The interconnection between galaxy mergers, AGN activity and rapid quenching of star formation in simulated post-merger galaxies.
Abstract
We investigate the role of galaxy mergers on supermassive black hole (SMBH) accretion and star formation quenching in three state-of-the-art cosmological simulations with contrasting physics models: EAGLE, Illustris and IllustrisTNG. We find that recently coalesced ’post-mergers’ in all three simulations have elevated SMBH accretion rates by factors of . However, rapid (within Myr of coalescence) quenching of star formation is rare, with incidence rates of in Illustris, in EAGLE and in IllustrisTNG. The rarity of quenching in post-mergers results from substantial gas reservoirs that remain intact after the merger. The post-mergers that do successfully quench tend to be those that had both low pre-merger gas fractions as well as those that experience the largest gas losses. Although rare, the recently quenched fraction of post-mergers is still elevated compared to a control sample of non-mergers by factors of two in IllustrisTNG and 11 in EAGLE. Conversely, quenching is rarer in Illustris post-mergers than in their control. Recent observational results by Ellison et al. have found rapid quenching to be at least times more common in post-mergers, a significantly higher excess than found in any of the simulations. Our results therefore indicate that whilst merger-induced SMBH accretion is a widespread prediction of the simulation, its link to quenching depends sensitively on the physics models, and that none of the subgrid models of the simulations studied here can fully capture the connection between mergers and rapid quenching seen in observations.
keywords:
galaxies: general – galaxies: evolution – galaxies: star formation – galaxies: interactions1 Introduction
Mergers are amongst the most catastrophic events that occur in galaxies. Early works with N-body simulations on idealised mergers showed how tidal forces dramatically distort and deform merger remnants (Toomre & Toomre, 1972; White, 1978; Roos & Norman, 1979). Both theory (e.g., Villumsen, 1982; Di Matteo et al., 2007; Cox et al., 2008; Lotz et al., 2008; Moreno et al., 2015) and observations (e.g., Hernández-Toledo et al., 2005; Patton et al., 2005; De Propris et al., 2007; Casteels et al., 2014; Patton et al., 2016) indicate that the ultimate morphological outcome of the interaction is driven by orbital properties and mass ratio of the progenitors, and by physical properties of the involved galaxies.
Furthermore, simulations have long predicted that galaxy mergers induce gravitational instabilities in the interstellar medium (ISM) due to a redistribution of angular momentum, thus driving gas towards the inner part of galaxies (e.g., Hernquist, 1989; Barnes & Hernquist, 1996; Mihos & Hernquist, 1996; Blumenthal & Barnes, 2018). Theory predicts that such strong gas inflows from the outer disk to the inner kpcs should induce an enhancement in central star formation rates (e.g., Cox et al., 2008; Di Matteo et al., 2008; Hopkins et al., 2008; Sparre & Springel, 2016),and a dilution in central gas-phase metallicity (e.g., Montuori et al., 2010; Torrey et al., 2012; Bustamante et al., 2018). Observational studies of galaxy-galaxy mergers give support to the theoretical framework. Merging galaxies show enhanced SFRs (e.g. Li et al., 2008; Ellison et al., 2008; Patton et al., 2013; Knapen et al., 2015; Cao et al., 2016), and central metallicity dilution (e.g., Ellison et al., 2013b; Grønnow et al., 2015; Thorp et al., 2019; Bustamante et al., 2020).
Following the pioneering work of Springel et al. (2005b), galaxy formation models generally invoke active galactic nuclei (AGN) feedback mechanisms to efficiently quench star formation in massive galaxies, especially as a consequence of a merger (e.g., Di Matteo et al., 2005; Hopkins et al., 2008). Indeed, during galaxy-galaxy interactions, theory predicts that part of the in-falling gas should feed the central super-massive black hole (SMBH), thus leading to rapid black hole growth and triggering AGN feedback with the release of energy (e.g., Lynden-Bell, 1969; Cattaneo et al., 2009; Capelo et al., 2015). A fraction of the energy ejected from the AGN feedback, in turn, couples with the surrounding interstellar medium and drives out a significant amount of gas from the galaxy (e.g., Silk & Rees, 1998; Murray et al., 2005; Fabian et al., 2006; Cattaneo et al., 2009).
However, in the last decade there has been an intense debate in the community about the role of mergers in triggering AGN activity. Many observational studies did not find evidence of merger-driven AGN activity (e.g., Cisternas et al., 2011; Schawinski et al., 2011; Kocevski et al., 2012; Villforth et al., 2014; Hewlett et al., 2017; Shah et al., 2020; Lambrides et al., 2021), while many others have found robust proofs for an AGN excess in interacting galaxies (e.g., Alonso et al., 2007; Ellison et al., 2011; Bessiere et al., 2012; Ellison et al., 2013a; Kocevski et al., 2015; Hewlett et al., 2017; Marian et al., 2020; Pierce et al., 2022). It is possible divergent results arise from different experimental set up, including (not exhaustively) mixed definitions of AGN, mixed low and high redshifts selection, lack of matched controls, AGN fraction in mergers versus excess of mergers amongst AGN, and/or different wavelength range involved (e.g., a larger importance of mergers in mid-IR AGNs than in optically selected ones, Satyapal et al., 2014; Goulding et al., 2018; Ellison et al., 2019; Gao et al., 2020). However, Ellison et al. (2019) ruled out the possibility that the tension could be due to different methodologies, at least for the low redshift infrared selected AGN. Furthermore, outcomes from cosmological simulations suggest that the majority of low-redshift AGN should not reside in recent mergers (Steinborn et al., 2018; McAlpine et al., 2020; Byrne-Mamahit et al., 2022). However, even though most AGN are not triggered by mergers, mergers can still lead to AGN. For example, in Byrne-Mamahit et al. (2022) we demonstrated that post-mergers from the IllustrisTNG simulation (Marinacci et al., 2018; Naiman et al., 2018; Nelson et al., 2017; Pillepich et al., 2017b; Springel et al., 2017) host an excess of AGN and that the majority of post-mergers have above average SMBH accretion rates, consistent with the prediction of enhanced AGN activity. However, there is no consensus about either the physical processes governing feedback mechanisms associated with AGNs (thermal energy, kinetic energy, a combination of the two), nor its extent (range, scales involved, strength). Different models implement different prescriptions for describing AGN feedback and the fraction of energy released, often leading to a dissimilar impact on galaxy evolution (e.g., Somerville & Davé, 2015; Schaye et al., 2015; Weinberger et al., 2017). It is therefore important to investigate whether the results of Byrne-Mamahit et al. (2022) are robust to variations in AGN feedback models. The first major goal of this paper is to rigorously compare the AGN-driven merging scenario in three state-of-the-art cosmological simulations: EAGLE (Schaye et al., 2015; Crain et al., 2015; McAlpine et al., 2016), Illustris-1 (Vogelsberger et al., 2014), and TNG100-1.
Beyond the mere triggering of nuclear accretion, theoretical predictions of merger-driven AGN activity have long suggested that galaxy mergers might be the leading mechanism for rapid galaxy quenching (e.g., Di Matteo et al., 2005; Springel et al., 2005c; Springel, 2005; Croton et al., 2006; Hopkins et al., 2008; Somerville et al., 2008). Effective mechanical AGN feedback triggered by gas with low angular momentum which is accreting onto the central SMBH could potentially drive out the gas from the galaxy and heat the circumgalactic medium (CGM), thus halting star formation and hampering the replenishment of the galactic gas supply.
Many previous simulations that linked mergers to AGN activity were able to efficiently remove gas from the galaxy reservoir, leading to a prompt quenching shortly after the coalescence phase (e.g., Springel, 2005; Bower et al., 2006; Khalatyan et al., 2008; Hopkins et al., 2008). Such early works tended to implement very aggressive AGN feedback prescriptions, thus provoking an immediate evacuation of the gas from most post-coalescence galaxies. Recent results also support a pivotal role of mergers to halt star formation. For instance, studies based on the so called “genetic modification approach” (Roth et al., 2016), that are capable of altering the accretion history of a galaxy by generating sets of controlled numerical realisations in a fully cosmological context, have demonstrated a causal connection between mergers and quenching (e.g., Pontzen et al., 2017; Sanchez et al., 2020; Davies et al., 2022). The genetic approach grants the advantage of controlling the main parameters involved in the galaxy interaction, thus allowing the search for causal connections between the various physical processes involved. However, currently the results are limited to a restricted number of objects covering a small dynamical range of masses, orbits, mass ratios and other physical properties that might be at play during mergers.
Many other recent works based on the statistical analysis of cosmological hydrodynamical simulations, which include complete samples of mergers covering a realistic range of parameters such as galaxy morphology, gas fraction, and orbital geometry, have instead challenged the merger-driven quenching scenario (e.g. Weinberger et al., 2018; Correa et al., 2019; Rodríguez Montero et al., 2019; Quai et al., 2021; Pathak et al., 2021). In Quai et al. (2021), we quantified that only percent of post-mergers selected from an unbiased IllustrisTNG300-1 galaxy sample quench as a direct consequence of mergers. In the current work, our second major goal is therefore to test whether the lack of merger-driven quenching is ubiquitous in the three aforementioned cosmological simulations and how their different prescriptions for AGN activity reflect upon the outcome of the quenched fraction in the global post-merger population.
A pivotal point that warrants examination is whether or not the merger-driven quenching scenario is in accordance with observational results. Proving a causal connection between mergers and quenching with observations is challenging. Among the known populations of recently quenched galaxies (e.g., Citro et al., 2017; Quai et al., 2018; Quai et al., 2019), the most promising quenched galaxies that can be directly linked to galaxy-galaxy interactions are those known as ‘post-starburst’, also called ‘E + A’ or ‘K + A’ galaxies. Post-starburst galaxies are systems showing spectroscopical evidence of a sharp decline of star formation following an intense star-burst episode that occurred between 0.5-1 Gyr ago (e.g., Dressler & Gunn, 1983; Couch & Sharples, 1987; Wild et al., 2010; Pawlik et al., 2019; Wild et al., 2020). Morphological studies show that post-starbursts often exhibit morphological disturbance and tidal features (e.g., Oegerle et al., 1991; Zabludoff et al., 1996; Yang et al., 2008; Pawlik et al., 2018; Sazonova et al., 2021; Wilkinson et al., 2022), all characteristics suggesting a merger-driven quenching scenario. To date, most of the observational studies of the merger-driven quenching scenario have focused on determining the frequency of mergers in various post-starburst populations selected via a plethora of methods, finding contrasting results ranging from small fractions (, Blake et al., 2004; Setton et al., 2022), intermediate fractions (, Wilkinson et al., 2022), and high fractions (up to , Pracy et al., 2009). However, for the purpose of this paper, we are interested in the complementary question of determining what is the fraction of rapidly quenched galaxies in an unbiased sample of recent post-merger galaxies. Thanks to the first statistically robust large sample of pure recent post-merger galaxies selected by Bickley et al. (2022), Ellison et al. (2022) could recently address the latter question, finding a strong excess of quenching in post-mergers. Quantitatively, Ellison et al. (2022) demonstrated that a rapid truncation of star formation is times more probable in post-coalescence galaxies than expected in a control sample of non-interacting galaxies, demonstrating an incommensurable dissimilarity with the quenching excess of Quai et al. (2021). The third major goal of this paper is therefore to compare for the first time observational results of merger triggered quenching (from Ellison et al., 2022) with the predictions from the earlier mentioned cosmological simulations, to gain insights into the interconnection between galaxy mergers and star formation quenching.
The paper is organised as follows: in Section 2, we briefly introduce the cosmological simulations used in this work, as well as the methodology to select post-mergers and a control sample of non-interacting galaxies. In Section 3 we present the results. In detail, in Section 3.1 we quantify the enhancement of AGN activity in star-forming post-merger galaxies; in Section 3.2 we measure the impact of mergers on quenching star-formation; in Section 3.3, we compare the quenching excess in simulated post-mergers with that from observations. Finally, we discuss the results in Section 4, and we summarise our work in Section 5.
2 Data and methods
Black hole accretion and AGN feedback operate on scales below the simulation resolution, and thus require subgrid prescriptions for modelling the physical processes involved. Distinct cosmological simulations might formulate different sub-grid recipes, responding to (1) appropriate calibrations of the simulations via tuning of physical parameters required to reproduce fundamental observed relation scales, and (2) updated models following a continuous improvement of our knowledge on the physical processes. As mentioned in the Introduction, most of the modern hydro-dynamical simulations use AGN feedback to halt star formation in massive galaxies, therefore, the choice of different models for regulating black hole accretion and AGN feedback may have important consequences on the merger-driven quenching scenario we aim to address. We compare the response of three state-of the art cosmological simulations (i.e., EAGLE, Illustris-1, and TNG100-1) to describe the interconnection between merger events, black hole activity, and quenching of star formation. Even though the three simulations span a similar volume (cubes of sides around cMpc), and all of them assume black hole accretion to be proportional to the spherically symmetric Bondi–Hoyle–Lyttleton accretion rate (Hoyle & Lyttleton, 1940; Bondi & Hoyle, 1944; Bondi, 1952), they opt for subtly different physical adjustments and implement distinct AGN feedback models, that might result in a diverse response to galaxy merger events. In this section, we give a brief overview of the simulations we use in this work and their sub-grid models governing black hole activity (see a brief summary of the black hole model prescriptions in Table 1). Readers interested in details about different models for AGN feedback and consequent implications on SMBH properties and galaxy evolution are referred to Habouzit et al. (2021, 2022).
2.1 Cosmological simulations
| EAGLE | Illustris-1 | TNG100-1 | |
|---|---|---|---|
| BH accretion | The model uses the angular momentum of the surrounding gas to reduce BH accretion rates in small galaxies. | The accretion rate depends on the gas properties at the location of the BH (susceptible to local stochasticity) | A Kernel-weighted accretion rate over neighbouring cells. The accretion rate correlates with the gas properties in the central regions. |
| AGN feedback | One-mode: • thermal, with a net efficiency ; • the energy is released isotropically. | Two-mode (both thermal): • At , thermal energy is released with a net coupling efficiency . • At thermal energy is released in hot bubbles within a radius of kpc from the BHs. | Two-mode: • At high accretion rates, a thermal “quasar” mode, similar to Illustris. • At low accretion rates, a kinetic “radio” mode, with directional injection of momentum into surrounding ISM, oriented in a random direction (isotropic feedback over several events). |
| Note: | The energy is released following a minimum heating temperature criterion: BHs store feedback energy until a threshold amount. This prevents numerical losses and overcooling. | The ‘hot bubble’ model impacts more on the host halo (M/M too high). | TNG uses a switch for low- and high-accretion rates with a dependence on the BH mass (low-accretion mechanical mode effective at MM⊙). |
2.1.1 EAGLE
The “Evolution and Assembly of GaLaxies and their Environment” (EAGLE, Schaye et al., 2015; Crain et al., 2015; McAlpine et al., 2016) is a suite of hydrodynamical cosmological simulations spanning a wide range of numerical resolutions and physical models which are implemented using a bespoke version of the Smoothed Particle Hydrodynamics (SPH) code GADGET-3 (Springel, 2005). For this work, we use the largest run denoted Ref-L0100N1504, a cubic periodic volume of ( cMpc)3 with dark matter and stellar mass resolutions of M⊙ and M⊙, respectively.
The EAGLE public catalogues contain only snapshots at redshift z, yelding a temporal resolution that is insufficient to cover the rapid changes a galaxy faces during mergers. We use instead a galaxy catalogue (internal team use) with a much denser time grid, including snipshots at redshift z, of which at z are useful for this work. The cosmological parameters used in EAGLE are in accordance with Planck Collaboration et al. (2014) which is given by a matter density , baryon density , dark energy density , a Hubble parameter , and .
Star formation is implemented via a sub-grid model described in Schaye & Dalla Vecchia (2008) and based on a pressure-dependent relation that converts gas to stars following the Schmidt-Kennicutt law (Kennicutt, 1998).
Following the prescription in Springel et al. (2005a), black holes are seeded as collision-less sink particles with an initial mass of M⊙ in the centres of black hole-free dark matter halos exceeding a threshold mass of M⊙. Subsequently, EAGLE black holes can grow either via (1) accretion of surrounding material or (2) black hole mergers. Black hole accretion is regulated following a modified Bondi-Hoyle rate (Bondi & Hoyle, 1944) that includes a prescription that takes into account the angular momentum of material nearby a black hole (see Rosas-Guevara et al., 2015; Rosas-Guevara et al., 2016). The inclusion of the angular momentum of surrounding gas allows the material to first settle into an accretion disk, thus reducing black hole accretion rates in small galaxies compared to the original Bondi-Hoyle model. Finally, in EAGLE accretion rates are capped at the Eddington limit, to avoid reaching spuriously high accretion rate values.
EAGLE uses single-mode AGN feedback (Booth & Schaye, 2009), where energy is injected thermally into the surrounding ISM, with a fixed efficiency (i.e., a fraction of the accreted gas is stochastically converted in thermal energy and released in the region nearby a black hole with a net efficiency of ), independently from halo mass and accretion rate. The thermal energy is released following a minimum heating temperature criterion, that is when the black hole has accreted enough mass that the equivalent energy released is capable of increasing the temperature of the surrounding gas particles, thus preventing numerical losses and overcooling.
2.1.2 Illustris-1
We identify post-mergers galaxies also in the Illustris cosmological simulation (Vogelsberger et al., 2013; Vogelsberger et al., 2014). In this work, we use the flagship Illustris-1 (Nelson et al., 2015) run, that covers a comoving cubic volume of side 106.5 cMpc. Illustris-1 has a dark matter and baryonic mass resolutions of M⊙ and M⊙, respectively. The simulation runs from redshift to the present day ( snapshots at redshift z) using the AREPO moving-mesh code (Springel, 2010; Pakmor et al., 2016). The cosmological parameters used in IllustrisTNG are in accordance with WMAP 9 (Hinshaw et al., 2013) which is given by a matter density , baryon density , dark energy density , and a Hubble parameter , and .
Star formation is implemented in a sub-grid model following the Springel & Hernquist (2003) formalism. Gas particles exceeding a hydrogen number density of cm-3 are described by a “star-forming” effective equation of state, and their gas is converted to stars stochastically following the Schmidt-Kennicutt law (Kennicutt, 1998) assuming a Chabrier (2003) initial mass function (see Nelson et al., 2015, for further details).
In Illustris-1, black hole seeding follows the prescription in Springel et al. (2005a), where massive halos exceeding M M⊙ and devoid of central supermassive black holes are seeded with a black hole of initial mass M M. In Illustris, the accretion rate onto the black hole follows an Eddington-capped Bondi-Hoyle-Lyttleton prescription. The accretion rate scales with the local mass density of the gas particle located at the physical position of the black hole itself. To compensate for the unresolved multiphase ISM (Springel et al., 2005b), that produces a non-physical under-density in the region surrounding the central black holes, the Illustris model introduces a boost factor that increases the instantaneous accretion rate.
Illustris uses a two-mode thermal AGN feedback, with both modes proportional to the amount of mass accumulated into the central black hole. At high accretion rates (i.e., at Eddington fractions f), Illustris activates the so-called “quasar” mode, where the AGN deposits thermal energy in the region surrounding the black hole, with a net coupling efficiency of . Instead, at low accretion rates (i.e., at Eddington fractions f), Illustris switches to the “radio” mode AGN feedback. The recipe for the low accretion rate regime should mimic the influence of an AGN radio jet (not resolved in the simulation), with hot bubbles of thermal energy deposited in the CGM within a radius of kpc from the central black hole, coupling to the gas with a net efficiency of . At high accretion rates, the feedback is implemented as a continuous injection of thermal energy into the ISM, thus subject to numerical losses. Therefore, the AGN quench galaxies exclusively through the low accretion mode.
2.1.3 IllustrisTNG100-1
The IllustrisTNG (TNG) project includes a suite of large-box magnetohydrodynamical cosmological simulations in a CDM Universe which provides a statistically robust sample of galaxies spanning a variety of galaxy properties (e.g., mass, environment, star formation rate). The simulations and physical model are introduced in detail in Marinacci et al. (2018); Naiman et al. (2018); Nelson et al. (2017); Pillepich et al. (2017b); Springel et al. (2017). IllustrisTNG (or TNG) is the descendant of the Illustris cosmological simulation with an improved physical models and numerical scheme. TNG also introduces a number of additional features to obtain a better agreement with observational results. In this paper, we focus on TNG100-1, the highest resolution run for the intermediate publicly released volume of side cMpc. TNG100-1 offers excellent statistics, whilst still guaranteeing adequate numerical resolution. TNG100-1 has a dark matter and stellar mass resolutions of M⊙ and M⊙, respectively. The simulation runs from redshift to the present day using the AREPO moving-mesh code (Springel, 2010; Pakmor et al., 2016). The cosmological parameters used in IllustrisTNG are in accordance with Planck Collaboration et al. (2016) which is given by a matter density , baryon density , dark energy density , and a Hubble parameter .
Star formation occurs in a pressurised, multi-phase interstellar medium following the Springel & Hernquist (2003) formalism. Gas particles whose density exceeds a threshold of cm-3 are “star-forming” and their gas is converted to stars stochastically following the Schmidt-Kennicutt law (Kennicutt, 1998) assuming a Chabrier (2003) initial mass function (see Nelson et al., 2015; Pillepich et al., 2017a, for further details).
Black holes are seeded with an initial mass of M⊙ at the centres of the potential wells of halos exceeding a threshold mass of M⊙. Black holes can grow their mass either through (1) accretion following a modify Bondi-Hoyle scheme, or (2) mergers with other black holes. The instantaneous accretion rate in IllustrisTNG does not depend upon the gas particle at the location of the black hole (as in Illustris). Instead, the rate scales following a kernel-weighted gas density over about neighbouring particles to reduce the dependence on the local gas mass fluctuations, and it is capped at the Eddington rate.
AGN feedback is directly related to the accretion rate onto the central black holes (). At high accretion rates (i.e., quasar mode feedback), thermal energy is returned to the black hole’s environment, whereas at low accretion rates (i.e., radio mode feedback, or kinetic feedback), energy accumulates until it reaches an energy threshold, then mechanical energy is instantaneously released along a random direction into the gas around the black hole (see Weinberger et al., 2017, for further details). As in Illustris, in IllustrisTNG the high accretion mode is subject to numerical losses. Therefore, quenching in massive galaxies can be obtained only through the kinetic mode at low accretion rates (e.g., Terrazas et al., 2020). TNG uses a switch for activating either low- or high-accretion rates. The switch function depends on the black hole mass, with low-accretion mechanical mode becoming effective at MM⊙.
2.2 Methods
For the purpose of this paper, for each galaxy and for its descendants, we retrieve and use stellar, halo, gas and black hole masses, as well as instantaneous star formation rates. SMBH accretion rates are calculated by averaging the change in SMBH mass between snapshots over the duration of the snapshot. The mean snapshot intervals are Myrs, Myrs, and Myrs for EAGLE, Illustris-1, and TNG100-1 respectively.
2.3 Star-forming post-mergers
We select and follow the evolution of galaxies from the three simulations’ merger trees created using the Sublink code (Rodriguez-Gomez et al., 2015). Galaxy mergers are defined as nodes in the Sublink merger trees (Rodriguez-Gomez et al., 2015). Namely, we define a post-merger (or PM) in the snapshot immediately after the coalescence phase as the remnant of two interacting galaxies. Following Hani et al. (2020) and Quai et al. (2021), our post-merger sample is restricted to those satisfying the following criteria. First of all, post-mergers must be star-forming when first selected (in order that we can later observe them quenching). In practice, this is implemented by requiring SFRs higher than from the star-forming main sequence best-fit in the given snapshot (i.e., at fixed redshift). We only follow the evolution of post-mergers at redshift z (i.e., in the last Gyr), in order to avoid the vigorous merger activity at higher redshift that would aggravate issues such as numerical stripping and subhalo switching (Rodriguez-Gomez et al., 2015), and to grant a robust sample of long-term non-interacting galaxies that constitute the pool for selecting a suitable control population. Moreover, we limit the analysis to galaxies more massive than M M⊙, thus ensuring a complete sample of well-resolved post-mergers with a mass ratio (secondary/primary) larger than 1:10. We then apply a mass ratio cut, excluding mergers with a mass ratio (secondary/primary) . This criterion is strictly connected with the previous one and prevents the analysis of remnants of mergers with a companion less massive than the reliable mass limit of the simulation.
For Illustris-1 and TNG100-1 post-mergers, we further prevent numerical stripping and subhalo switching issues (Rodriguez-Gomez et al., 2015) by adopting the following procedure to estimate the mass ratio of the merger. We define the mass ratio () as the “mean” mass ratio value measured over maximum snapshots leading up to coalescence. We exclude the maximum and minimum mass ratios from the mean calculation to remove possible extreme variations which we found to be strongly related to the numerical stripping and subhalo switching effect, respectively. In EAGLE, instead, the mass ratio is from McAlpine et al. (2020) and it is computed when the in-falling galaxy onto the main progenitor had its maximum mass.
Finally, for Illustris-1 and TNG100-1 post-mergers we also apply two additional environmental constraints aimed at avoiding post-mergers that are undergoing further close interactions. Following Patton et al. (2020), we measure r as:
| (1) |
where r is the 3D separation between the centres of the host (i.e. post-merger in our case) and its closest neighbour, and R and R are the stellar half mass radii of the post-merger and the closest neighbour, respectively. Patton et al. (2020) showed that TNG100-1 galaxies with r had stronger numerical mass stripping effects, hence we exclude them from the following analysis. The second environmental parameter is r1, that is defined in Patton et al. (2020) as the 3D separation to the nearest neighbour with stellar mass above of the mass of the galaxy in question. We exclude post-mergers that have r kpc, whose companion could be already interacting with the post-mergers.
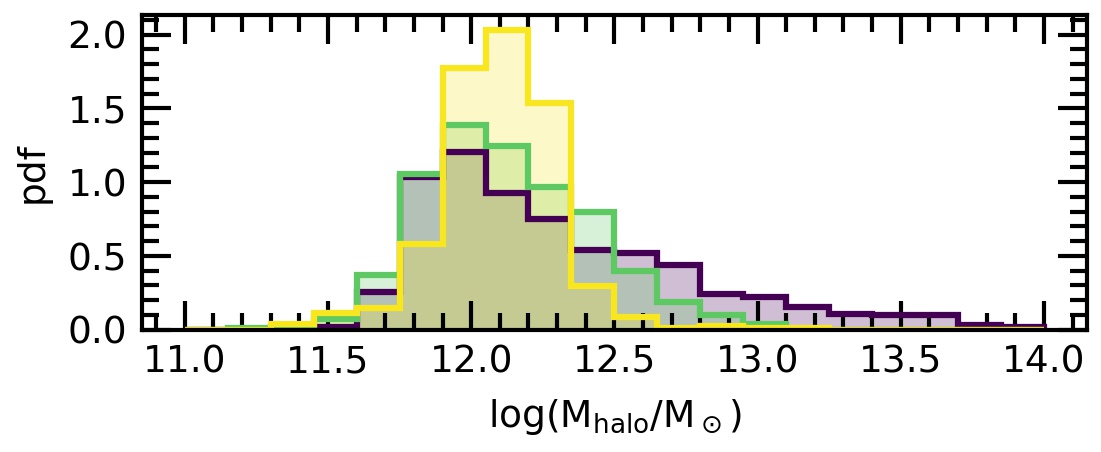
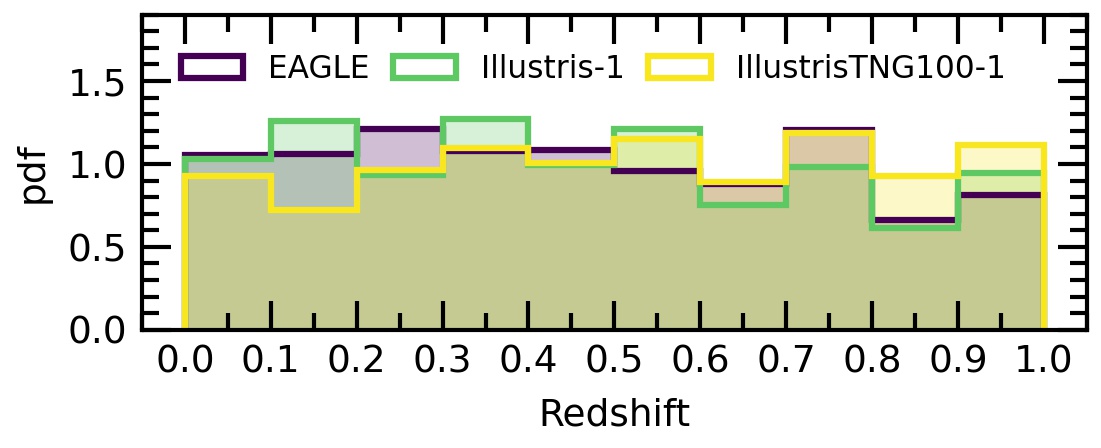
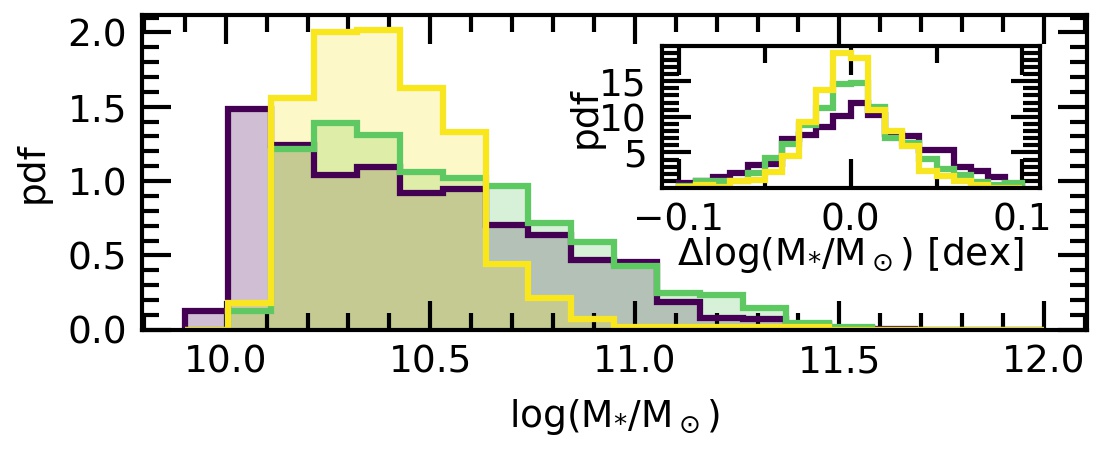
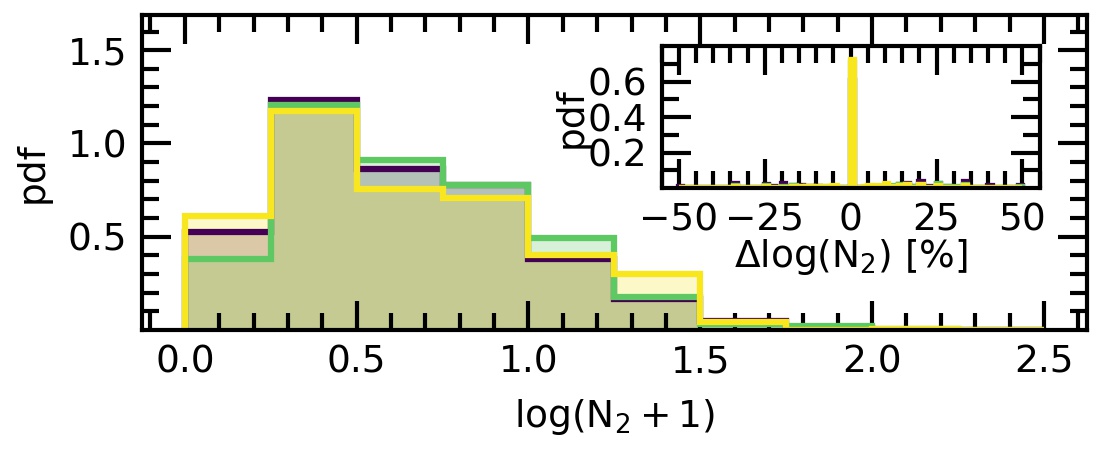
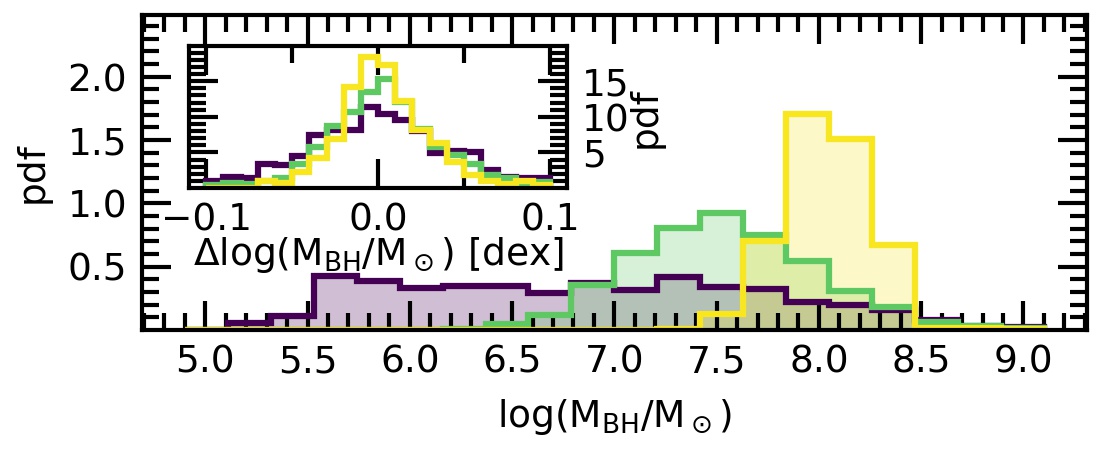
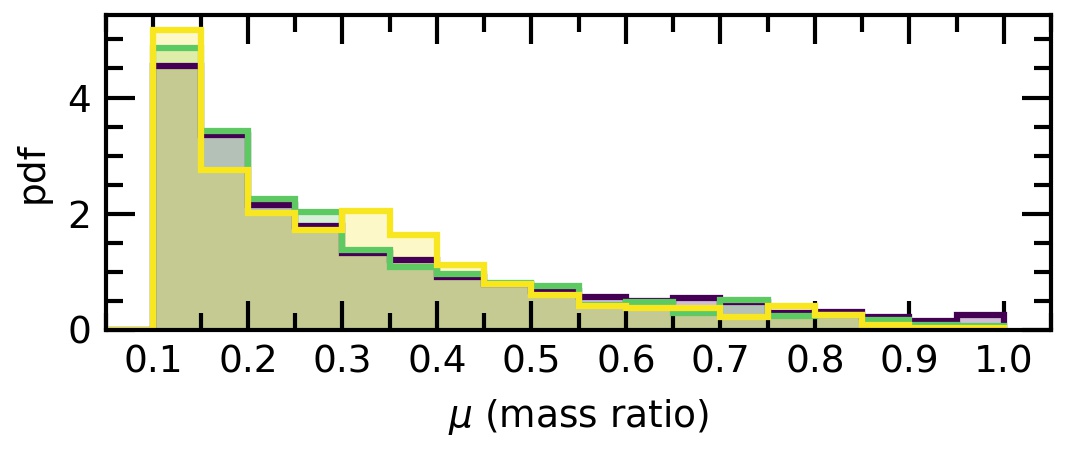
Our selection criteria yield three samples at redshift z of , , and star-forming post-mergers for EAGLE, Illustris-1, and TNG100-1, respectively. Despite the fact that the three simulations span similar comoving volumes and use similar cosmology, the number of star-forming post-mergers in TNG100-1 is remarkably smaller than in the other two simulations. Figure 1 shows the distribution in the main parameters (i.e., redshift, stellar mass, gas fraction (f, i.e., the fraction of the total gas over the sum of stellar and gas mass), halo mass, SFR, SMBH mass, mass ratio , and N2) defining the EAGLE, Illustris-1, and TNG100-1 post-merger populations. The different number of TNG100-1’s star-forming post-mergers compared to the other two simulations is explained by the difference in the halo and stellar mass distributions. In TNG100-1, indeed, there are only a few star-forming post-mergers with M M⊙ and M M⊙, whilst the rest of TNG100-1 massive post-mergers are passively evolving. The three simulations show significant differences in the black hole mass distributions, with TNG100-1 post-mergers harbouring already massive SMBH with masses around M⊙, whilst Illustris-1 and EAGLE post-mergers show a shallower black hole mass distribution, with EAGLE having a considerable tail of galaxies with black holes less massive than M⊙. Instead, the three simulations show a similar distribution in redshift, local density N2 (defined in Patton et al., 2016, as the number of neighbours within a radius of Mpc), and mass ratio. About the latter parameter, we note that , and of EAGLE, Illustris-1, and TNG100-1 post-mergers are minor mergers with mass ratio (i.e., 1:4 mergers). We address the impact of mass ratio on quenching star formation in Section 4.1.
2.4 Statistical control sample
We are interested in investigating the link between galaxy mergers, AGN activity, and the quenching of star formation. We quantify the impact of galaxy mergers on the quenching of star-formation using an observational approach that consists of identifying control galaxies that are matched to each post-merger galaxy in redshift, stellar mass, and environment (e.g., Ellison et al., 2013b; Patton et al., 2013). In this section, we describe the steps of generating the control sample.
We implement an adaptation of the matching procedure used in Patton et al. (2016) and Patton et al. (2020) to select statistical controls (CTRL) for post-merger galaxies in our sample. For each star-forming post-merger, we define a star-forming control pool (i.e. non-interacting galaxies with SFR higher than from the SFMS), at the same redshift (i.e. same snapshot/snipshot), with M M⊙, with a relative separation from the nearest neighbour r, and r kpc. We also exclude galaxies that have experienced a merger () within 2 Gyr. Then, for each post-merger in our sample, we identify the control galaxies that match the post-merger properties as follows:
-
•
log(M∗) within a tolerance of dex.
-
•
log(M) within a tolerance of dex.
-
•
The environmental parameter matched within a tolerance of .
If more than one control is found for a given post-merger, we follow the weighting scheme of Patton et al. (2016) to select up to control galaxies. We then define the post-merger’s control galaxy as the single best control galaxy that shares the most number of subsequent snapshots with the post-merger’s descendants whilst maintaining stellar and black hole mass match within a tolerance of dex of the descendants’. With our one-control-per-post-merger selection (fiducial matching scheme, in the following), we obtain robust control samples of , , and EAGLE, Illustris-1, and TNG100-1 non-interacting galaxies, respectively. We note that we did not find any control galaxy for , , and post-mergers in EAGLE, Illustris-1, and TNG100-1, respectively. We exclude these post-mergers without control galaxies from the following analysis. We investigated the bias in the matched post-mergers of the three simulations. We found our matching scheme preferentially failed to find controls in post-mergers with higher stellar and black hole mass. Moreover, a few tens of EAGLE unmatched post-mergers have intermediate stellar mass with black hole masses that are either in the lower (in most of such cases) or higher envelope of the stellar mass vs black hole mass distribution. We stress that the matching criteria are necessary in order to select an unbiased set of non-interacting control galaxies, therefore, we prioritise the selection of unbiased control samples over the full completeness of the post-merger samples. However, our choice of the maximum tolerances required in our matching criteria returns robust samples of mergers with completeness around in EAGLE and above in Illustris-1 and TNG100-1. Finally, we note that in Section 3.3, we will analyse two matching scheme variations that include a complete sample of post-mergers that are not matched in black hole mass.
The three insets in the right panels of Figure 1 show the distribution of the differences (i.e. post-mergers values control galaxy values) in the three matched parameters (note that redshift is matched de facto as well), demonstrating that the differences between the two samples of mergers and controls are well confined within the tolerance limits.
Once the control galaxy sample has been identified, we follow the evolution of the SFR in descendants of post-mergers and controls forward in time through the simulation. For each galaxy, we evaluate the relative level of star formation by calculating, on a logarithmic scale in the SFR-M∗ plane, the vertical offset between its SFR and the SFMS (hereafter, SFR). Then, we define galaxies to be quenched when their SFR drops below dex (i.e., a deviation of from the SFMS). Additionally, we quantify the enhancement or deficit of AGN activity in post-mergers as the logarithmic difference between the SMBH accretion rate of each post-merger galaxy and the best matched control (hereafter, ), where a positive indicates a post-merger SMBH accretion rate higher than the control.
3 Results
3.1 Merger-driven AGN activity
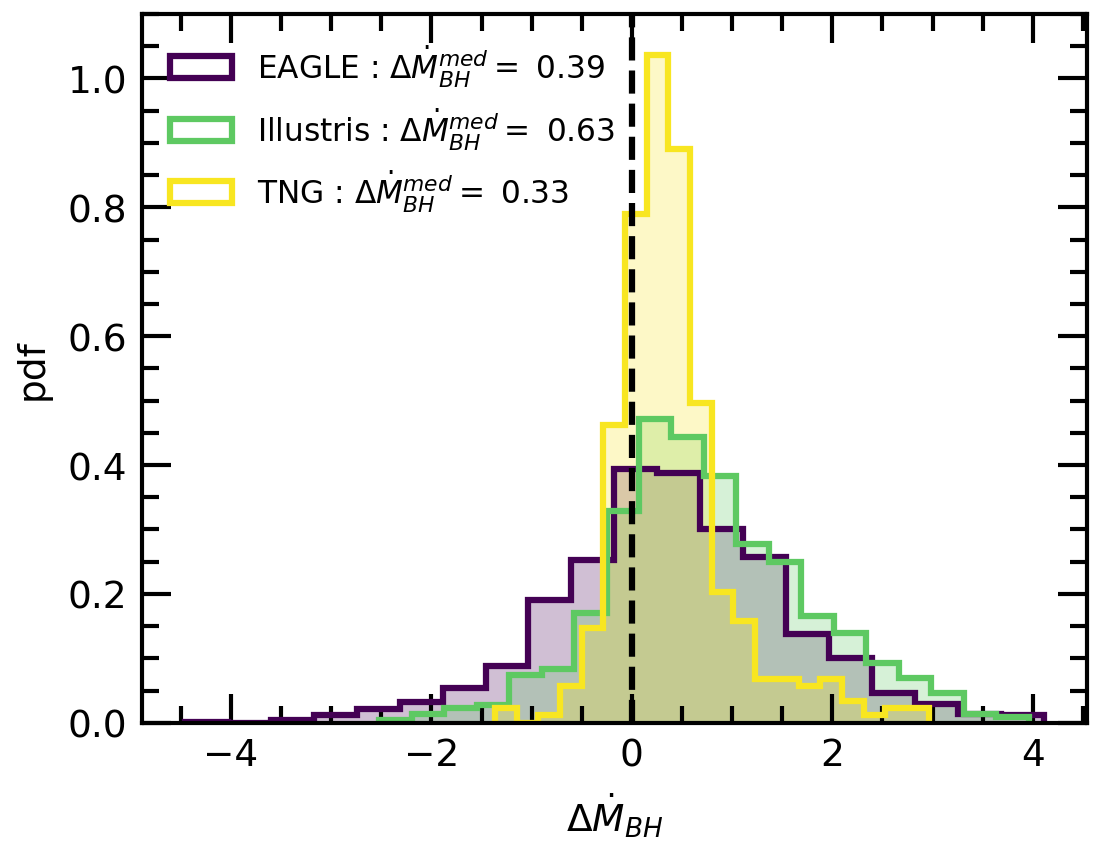
The primary goal of this work is to investigate the interconnection between galaxy mergers, AGN activity and star formation quenching in three state-of-the-art cosmological simulations with publicly available data, i.e., EAGLE, Illustris-1 and TNG100-1. We begin by investigating the enhancement of AGN activity in the star forming post-merger population. Figure 2 shows the distribution of the logarithmic difference () between the SMBH accretion rates of post-mergers and controls for each of the three simulations. For the EAGLE simulation, shown in purple, post-mergers have a median accretion rate 2.5 times higher than controls. For the Illustris-1 simulations, shown in green, post-mergers have a median accretion rate 4.3 times higher than controls. Finally, for the TNG100-1 simulation, shown in yellow, post-mergers have a median accretion rate 2.1 times higher than controls, consistent with the results of Byrne-Mamahit et al. (2022) who find post-mergers undergoing quasar mode feedback (the majority of which are star forming) have accretion rates 1.9 times higher than controls. Therefore, Figure 2 demonstrates that post-mergers have, on average, higher accretion rates than controls in all three simulations. We find that EAGLE and TNG100-1 have quantitatively similar enhancements in post-mergers. In contrast, Illustris-1 post-mergers have significantly stronger enhancements of accretion rate. The stronger enhancement in Illustris-1 is consistent with the overabundance of efficiently accreting SMBHs in Illustris-1 (Habouzit et al., 2022). In addition to the enhancement in post-mergers, our results demonstrate that enhanced SMBH accretion rates (when compared with controls) are not ubiquitous, and a significant portion (ranging from 20 to 35 percent) of post-mergers have similar or lower accretion rates compared with their matched controls. We therefore demonstrate that the majority, but not all, of the star forming post-merger population experiences accretion rates in excess of their matched controls.
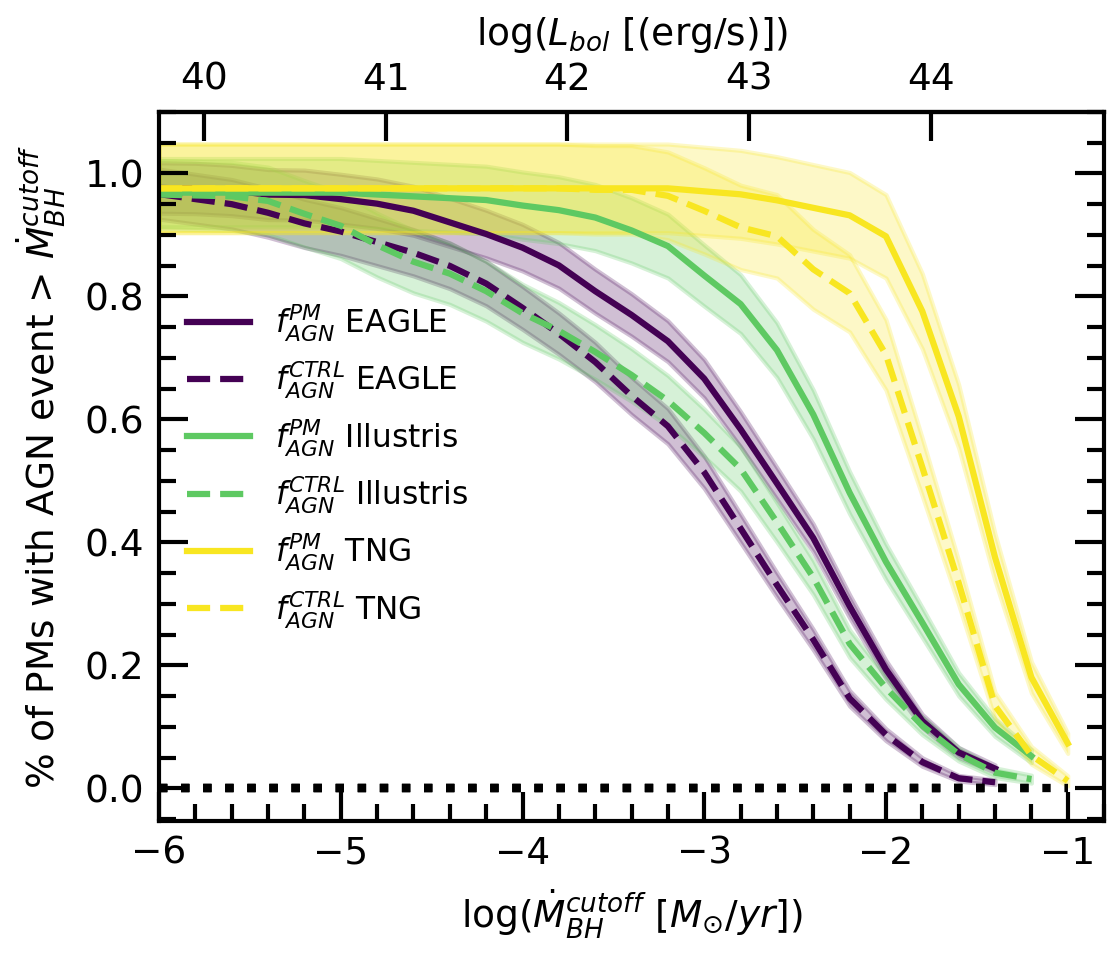
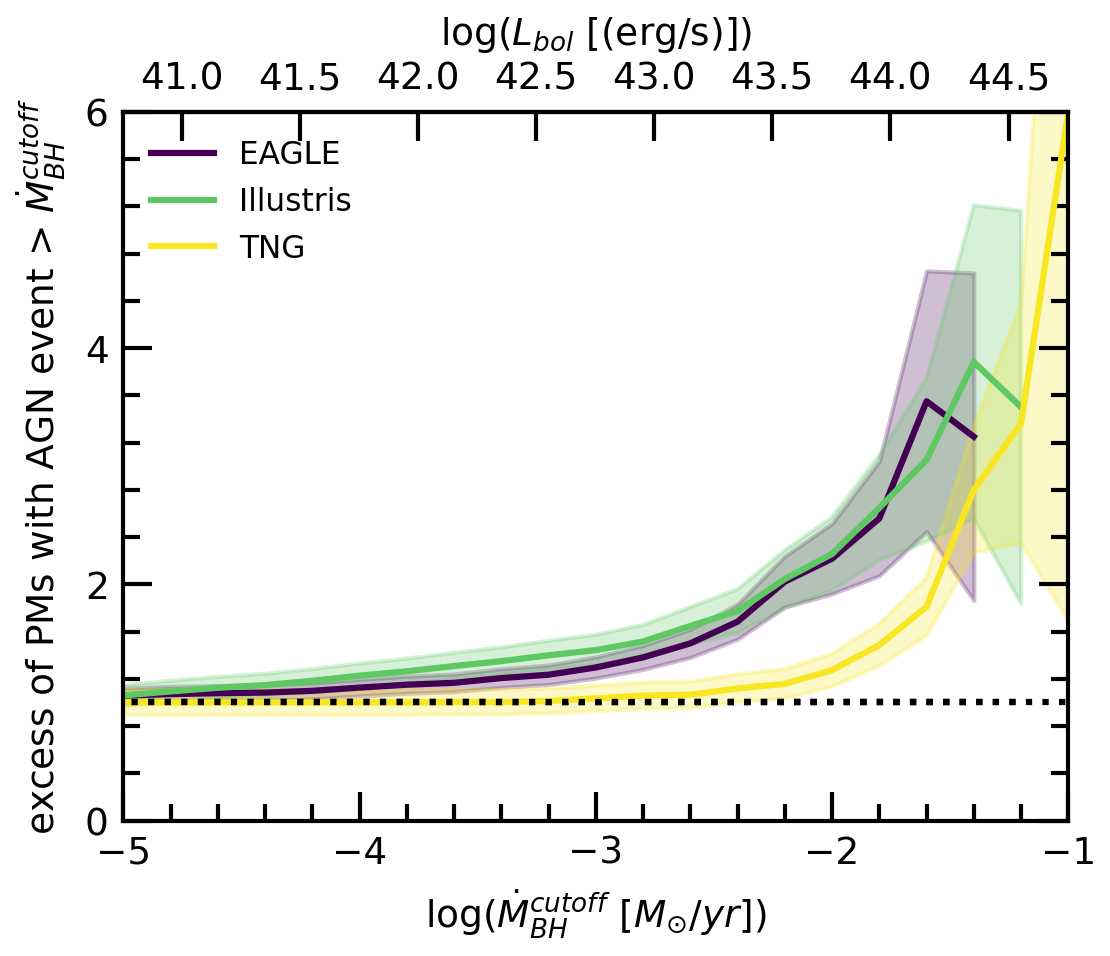
We further investigate the incidence of high accretion rate events within the star-forming post-merger population with the following procedure introduced in Byrne-Mamahit et al. (2022). For each post-merger galaxy and its associated control, we follow the post-merger and control forward in time 500 Myrs, for intervals of time following the snapshot resolution of the respective simulations. We then determine if, for any snapshot within 500 Myrs, the post-merger and/or control has an SMBH accretion rate in excess of a given AGN threshold accretion rate (). We note that we only conduct this experiment for post-mergers which can be followed forward in time for 500 Myrs. Repeating the experiment for each post-merger in the sample yields the percentage of post-mergers (or controls) that have undergone a high accretion rate event within 500 Myrs. Figure 3 demonstrates the results for EAGLE, Illustris-1, and TNG100-1, where post-mergers are shown as solid lines and controls as dashed lines. The y-axis demonstrates the percentage of post-mergers or controls which undergo an ‘AGN event’, and the x-axis defines the minimum SMBH accretion rate cutoff which defines the ‘AGN event’. Figure 3 demonstrates that AGN events become more rare with increasing AGN cutoff luminosity. We find that very few () of EAGLE post-mergers have (snapshot averaged) accretion rates above erg/s. Similarly, 17% of Illustris-1 post-mergers have accretion rates above erg/s. In TNG, 60% of post-mergers have erg/s in TNG100-1, but there is a rapid decline with no significant amount achieveing erg/s. We note that by design, the simulations limit high accretion rate events, both through the implementation of Eddington limited accretion rates and the transition to effective AGN feedback in TNG at a black hole mass of approximately M⊙. We therefore find highly accreting SMBHs are rare in EAGLE and Illustris-1. However, despite the rarity of the events, they occur more frequently in the post-merger population compared with the control population. We note that the average time between snapshots is shortest for EAGLE, which could result in higher average accretion rates, however we find instead that EAGLE produces the fewest galaxies with high SMBH accretion rates. We additionally note that although high accretion rate events are rare in post-mergers, it does not mean that the merging galaxy has not undergone any period of rapid accretion, which may still occur in the pre-merger or ongoing merger phase. In Figure 4 we show the fractional excess (the ratio of the solid to dashed lines in Figure 3) as a function of AGN accretion rate. In all three simulations, post-mergers more frequently host highly accreting SMBHs, with an increasing excess as a function of SMBH accretion rate. EAGLE and Illustris-1 demonstrate a peak excess of approximately four, that is four times more post-mergers achieve SMBH accretion rates of erg/s compared with controls. Similarly, post-mergers from TNG100-1 achieve a peak excess of approximately five to six, although at higher uncertainty. The fractional excess in TNG100-1 we find here is higher than the excess from Byrne-Mamahit et al. (2022), but is consistent with a stronger enhancement of SMBH accretion rate in the star-forming post-merger sample. Our results are also comparable with McAlpine et al. (2020), who find a maximum AGN excess (comparing post-mergers to a control sample) of approximately two in EAGLE. In fact, it is expected we may find a slightly higher excess over McAlpine et al. (2020), since we are accounting for any AGN event occuring in the snapshots between coalescence and 500 Myrs post-coalescence. Overall, Figures 3 and 4 demonstrate in combination that highly accreting SMBH events are rare in the star forming post-merger population but occur more frequently than in the control population.
3.2 Quenching in post-merger galaxies
Now that we have established the frequency of enhanced SMBH accretion in the post-merger samples, we continue our analysis by studying the impact (or lack thereof) of mergers on star formation quenching. Following Quai et al. (2021), we quantify the effects of mergers using two metrics: (i) the fraction of post-merger descendants with quenched star formation, and (ii) the excess of quenched post-mergers, i.e., the number of quenched post-mergers normalized by the number of quenched controls as a function of time after coalescence. Combined, these two metrics allow us to quantify the absolute rate of quenching in post-mergers, as well as addressing whether quenching is more common in post-mergers than in controls.
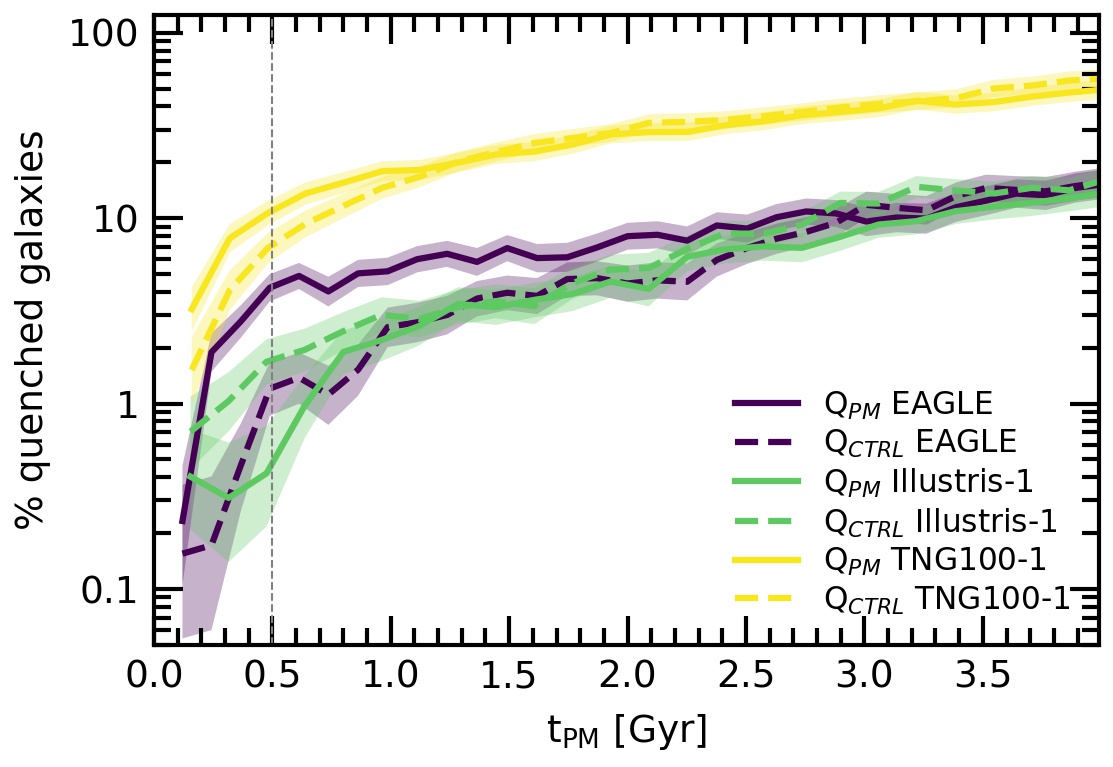
In Figure 5, we show the evolution of the fraction of post-merger galaxies (solid lines) that are quenched as a function of time elapsed since coalescence (t). For a qualitative comparison, we show also the behaviour of the control samples (dashed line), that represent the secular incidence of quenching that is expected. The trends of the three simulations are represented with different colours, purple for EAGLE, green for Illustris-1, and yellow for TNG100-1, with the shaded regions enclosing the uncertainty of the fraction, that we estimate following Gehrels (1986). We note that at t, the quenched fraction is because, by construction, we select star-forming post-mergers in our initial sample, hence we begin the analysis from the first snapshot after coalescence.
The quenched fraction of EAGLE’s post-mergers grows faster than their control galaxies in the vicinity of coalescence, though showing only a modest fraction of percent around Myr after coalescence. Later, the increase slows down and levels off to the control quenched fraction (i.e. the expected quenching because of secular evolution) around Gyr after the merger. Looking at the trend from a complementary perspective, the result means that around percent of EAGLE’s post-mergers that were star-forming during coalescence keep forming stars long after the merger is complete.
Illustris-1 shows very little impact of mergers on quenching star formation, as only percent of them quench within Myr after coalescence (against percent of their control sample in the same period), when mergers are supposed to manifest the maximum effect on the evolution of star formation (e.g., Hani et al., 2019). However, the Illustris-1 trend shows a faster growth in the rate of quenching than EAGLE, thus catching up with the control sample trend around Gyr after the merger, and reaching a quenched fraction percent Gyr after the merger.
In TNG100-1, we find the largest quenched fraction compared to the other simulations, although reaching only around percent within Myr after the merger, and levelling off with the control sample trend shortly after one Gyr after coalescence. The difference in the quenched fraction trend between TNG100-1 and the other two simulations can be better understood by focusing only on the control sample behaviour. We find that EAGLE and Illustris-1 control samples show a quantitatively similar trend for the entire period analysed, whilst the trend of the TNG100-1 control sample is systematically above, thus suggesting that the main distinction can be ascribed to both a different star formation/quenching regulation in the simulation models (e.g., Donnari et al., 2019) and to our selection of TNG100-1 galaxies that already have massive black holes about to enter (or already have entered) into the effective kinetic mode regime (i.e., MM⊙, see Figure 1, and Terrazas et al., 2020). Hence the controls quench just as readily as the merging galaxies.
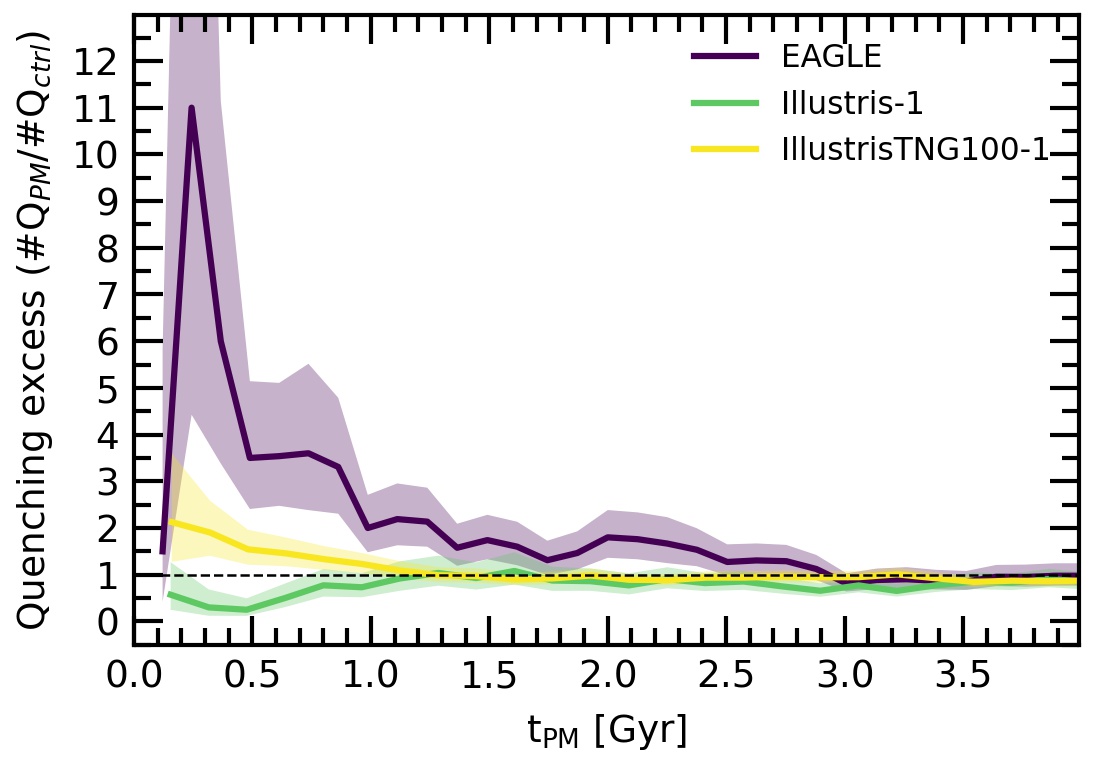
Figure 6 shows the quenching excess, that quantifies the relative tendency of mergers to experience quenching compared to secular processes which are accounted for in the controls. The layout is the same as in Figure 5, and the uncertainties are from the binomial statistic (Gehrels, 1986). We find that EAGLE (represented in purple) shows the largest excess among the analysed simulations, with a maximum of times more quenched post-mergers than expected in a control sample around Myr after coalescence. Then, the excess decreases steadily until Gyr after the merger, when quenching in post-mergers becomes statistically indistinguishable from that of the control sample. TNG100-1 (shown in yellow) also shows an enhanced quenched fraction, but at a somewhat lower level (factor of two) than in EAGLE. Moreover, the excess vanishes more quickly than in EAGLE, with the number of quenched post-mergers compatible with that expected from secular evolution beyond Gyr after coalescence. Illustris-1 (represented in green), surprisingly shows a deficit, with quenching happening in post-merger galaxies at half the rate expected in controls. The presence of a deficit in quenched post-mergers means that in Illustris-1 mergers are actually halting, or slowing down, the quenching process. The effect of reducing the frequency of quenching is temporary, and the deficit disappears around Gyr after the merger, when the number of post-mergers and controls is statistically equal.
3.3 Comparing post-merger quenched fractions with observations
The picture that arises from our analysis in the previous sections is that mergers in state-of-the-art cosmological simulations may trigger AGN, however, quenching occurs in only a small fraction of merging systems. Although we find a small fraction of promptly quenched galaxies (Figure 5), nonetheless there is an excess of quenched post-mergers compared with control galaxies in EAGLE and TNG100-1 (Figure 6), thus suggesting that mergers in these simulations could contribute to quenching star formation. We stress that our experiment proves how contemporary subgrid models affect the evolution of quenching in simulated merger remnants (see Section 2, and Quai et al., 2021). However, to obtain more accurate and reliable conclusions that can be generalised to the actual Universe, we need to put our results into perspective with robust observational results.
In the Introduction, we mentioned that ‘post-starburst’ galaxies are a useful population for identifying rapid and recent quenching. Briefly, post-starbursts are commonly identified by their optical spectra dominated by an over-abundance of A and F types stars (with a lifetime around Gyr), and a lack of spectral features of shorter-lived massive 0 and B types stars, indicating a recent starburst episode followed by a sharp truncation of star formation (e.g., Dressler & Gunn, 1983; Couch & Sharples, 1987). Post-starbursts could therefore represent the optimal population to causally connect mergers and quenching.
In the literature, however, most studies focus on the fraction of mergers in the post-starburst population, finding values ranging from to (e.g., Blake et al., 2004; Pracy et al., 2009; Setton et al., 2022; Wilkinson et al., 2022). Wilkinson et al. (2022) showed that the post-starburst merger fraction is strongly susceptible to the choice of merger identification metrics and post-starburst selection criteria. Wilkinson et al. (2022) also demonstrated that only of recent mergers in simulations can be recovered using the typical morphology metrics. Therefore, it cannot be excluded that a larger fraction of post-starbursts could have recently undergone a merger. Nevertheless, even in an extreme scenario where nearly all post-starburst galaxies would be post-mergers, it would not answer the complementary question of whether mergers systematically lead to promptly quenched star formation.
Recently, Ellison et al. (2022) analysed a robust and highly pure sample of post-mergers identified by Bickley et al. (2022), the largest pure catalogue to date, allowing them to statistically tackle the frequency of post-starburst galaxies in recent mergers. Applying two different selection methods for detecting post-starbursts, i.e., the ‘E+A’ and the ‘Principal Component Analysis’ (PCA)111The PCA selects galaxies with a relative excess of Balmer absorption lines, thus indicating spectra dominated by A and F types stars, but the method includes also galaxies that show emission lines that might originate from a non-star-forming source (Wild et al., 2007), which would be instead removed in the E+A selection (e.g., Zabludoff et al., 1996; Goto, 2005)., Ellison et al. (2022) found, respectively, a frequency of and percent of post-starbursts in the post-merger population. Compared with a control sample of non-mergers, these post-starburst fractions represent a factor enhancement, demonstrating that mergers can lead to quenching.
However, Ellison et al. (2022) stress that these observational fractions of post-starbursts in post-mergers are lower limits of the actual quenching fraction for the following reasons. First of all, to pass through the post-starburst phase, a galaxy has to first experience an enhanced star formation phase. However, we know from observations that the majority of post-mergers in the local Universe show a relatively modest enhancement in star formation (e.g., Ellison et al., 2013b; Knapen et al., 2015). Therefore, many post-mergers could quench as a direct consequence of the interaction without passing through the post-starburst phase. A second critical point concerns the different timescales at play. Galaxy merger features (e.g., morphology disturbance, shells, tidal features, star formation enhancement) tend to vanish on the order of Myr after coalescence (e.g., Mihos, 1995; Lotz et al., 2008; Hani et al., 2019; Bottrell et al., 2022). The post-starburst phase, instead, arises typically Gyr after the burst of star formation (Wild et al., 2020). Therefore, many post-mergers might be prematurely observed before the onset of the post-starburst phase. The chance to observe a post-starburst phase in post-merger galaxies scales with a restricted combination of orbital properties, mass ratio and underlying properties of the galaxies themselves. Mergers with prograde orbits, high mass ratio, and high initial gas mass are able to induce stronger and longer-lasting morphology disturbance and quenching (e.g., Di Matteo et al., 2007; Lotz et al., 2008; Moreno et al., 2015; Bekki et al., 2005; Wild et al., 2009; Pawlik et al., 2018; Zheng et al., 2020). Indeed, Ellison et al. (2022) note an enhanced post-starburst fraction in more asymmetric mergers.
In Section 3.2, we measured the fraction of quenched galaxies in the post-merger populations of the three analysed cosmological simulations. We cannot however directly compare our quenched fractions to those of Ellison et al. (2022) because we define the fraction to be the ratio between the number of quenched post-mergers over the number of total post-mergers selected, which by construction belong to the sub-group of star-forming post-mergers at coalescence.
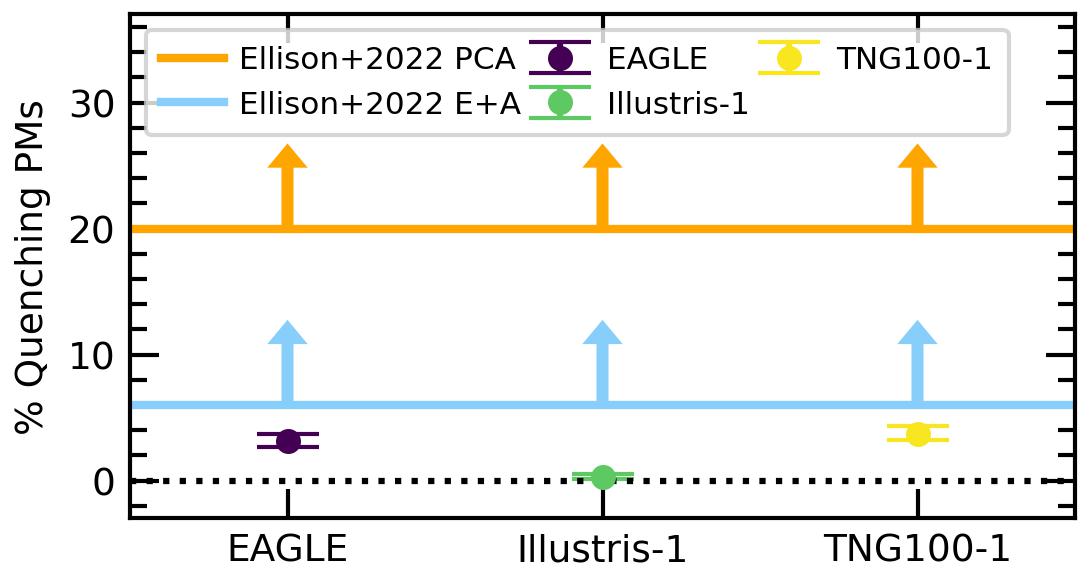
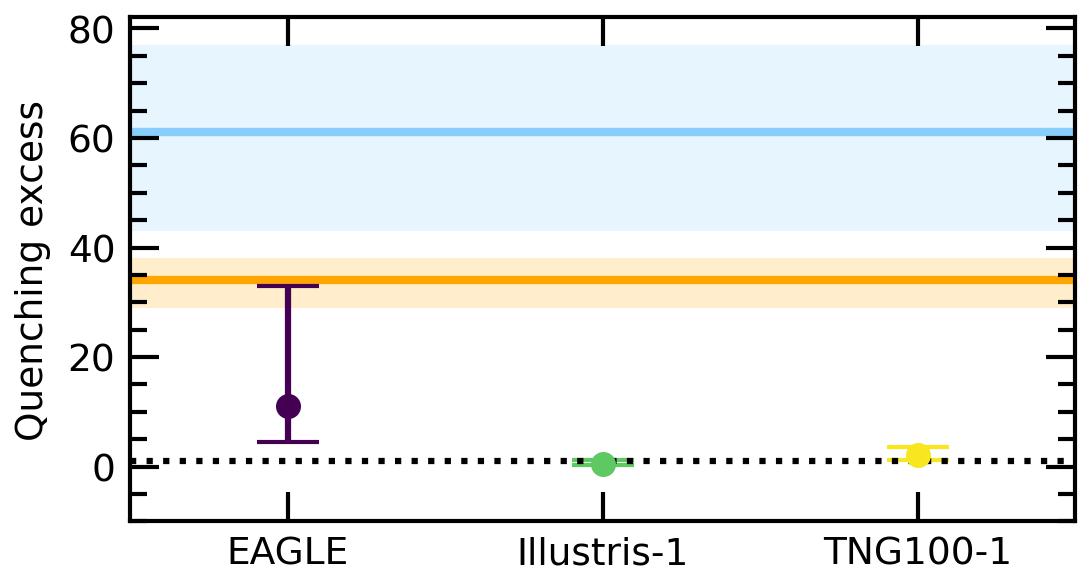
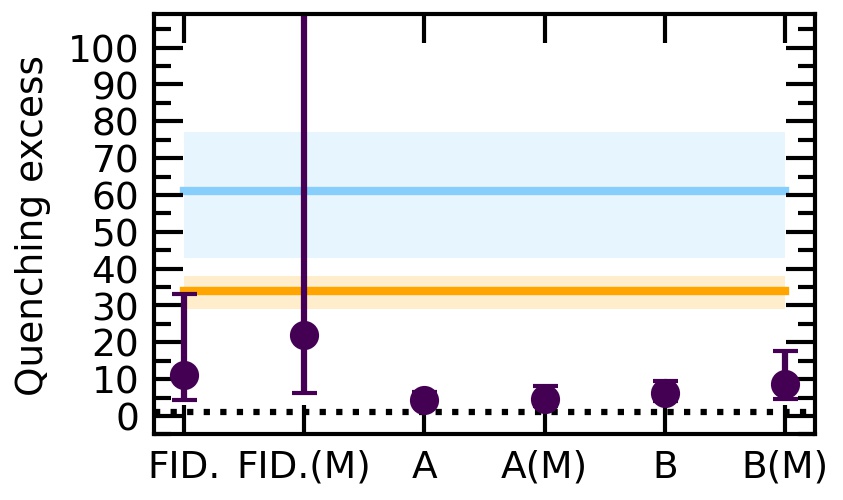
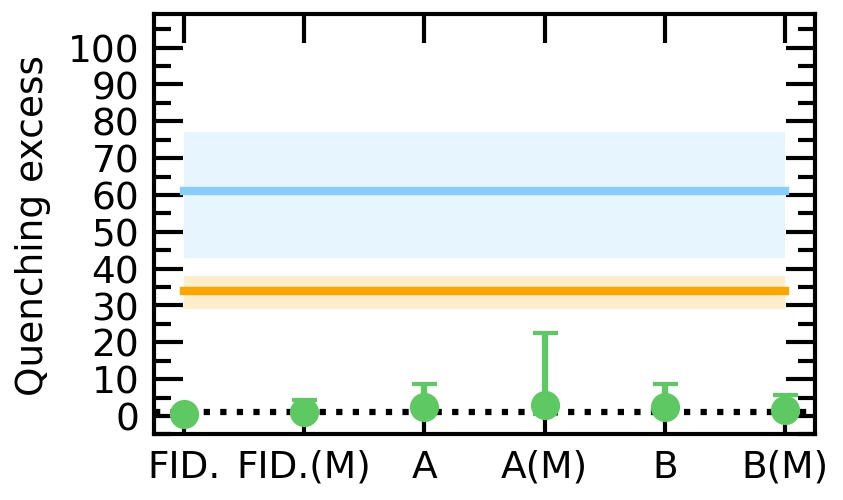
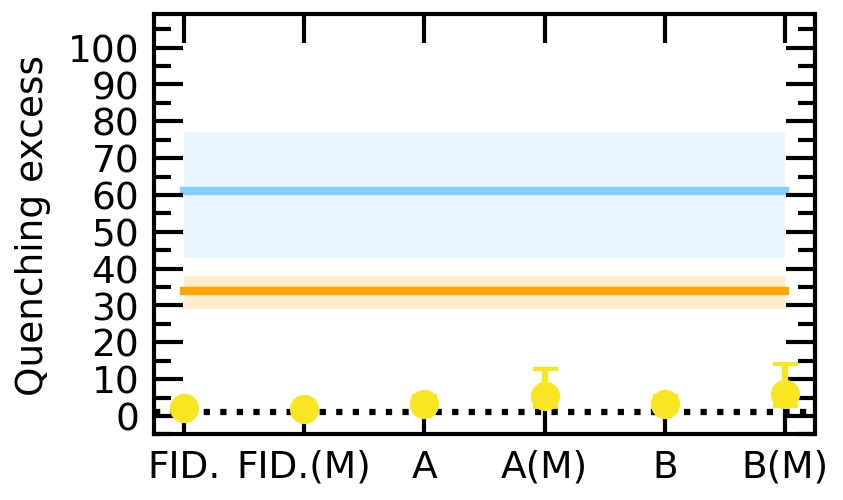
In order to compare with Ellison et al. (2022), we now quote the global quenched fraction, i.e. the number of star-forming post-mergers that quench relative to the total sample of post-mergers which include both the star-forming and non-star-forming populations. Figure 7 shows the global quenched fraction (top panel) and the quenching excess (bottom panel) within Myr after coalescence of the samples obtained with our fiducial matching selection (see Section 2.4), in comparison to observational results from Ellison et al. (2022). Figure 7 shows that the quenched fractions measured in the three analysed simulations are below the lower limits of the observational values (both E+A and PCA selection), and significantly below the observational quenching excess values. Only EAGLE’s quenching excess is barely compatible (within errors) with the excess measured with the conservative E+A selection. However, none of the simulations show quenched fraction and quenching excess compatible with the results from the PCA selection.
We test whether the incompatibility between simulations and observational constraints is due to differences in the matching selection criteria. Although the control sample is not used for measuring the quenched fraction, a different set of matching criteria can modify the completeness of the post-merger sample, because post-mergers that do not have a control are excluded from the analysis. In Ellison et al. (2022) each post-merger is matched to the best non-interacting control galaxy in redshift and stellar mass. Here, we perform two variations of our fiducial matching scheme (see Section 2.4), changing our criteria one step at a time to get closer to the observational control selection. For each variation, we take the maximum quenched fraction within Myr after coalescence, in order to focus on the stage of the merger sequence where it is highest the probability to observationally select galaxies with both post-merger and post-starburst features. This experiment helps us to both compare the simulated and observed merger quenched fraction, and to measure the impact of the matching scheme on our results. The fiducial and the two variation schemes are summarised in the following:
-
•
Fiducial. For each star-forming post-merger, we select the best star-forming non-interacting galaxy that is matched in redshift, stellar mass, black hole mass, and environment. See Section 2.4 for details.
-
•
Scheme A. We exclude black hole mass, while we apply the matching criteria on redshift, stellar mass, and environment.
-
•
Scheme B. We exclude black hole mass, and environment, while we keep the criteria on redshift and stellar mass. Scheme B offers the closest matching criteria to those in Ellison et al. (2022), where each post-merger is matched to non interacting galaxies in redshift and stellar mass.
Additionally, Ellison et al. (2022) found that post-mergers showing the most disturbed morphologies exhibit a higher post-starburst fraction. Because of the aforementioned reasons, it is likely that most observational post-starburst post-mergers might be remnants of major mergers. Therefore, for each of the three matching variations, we also perform an additional experiment with a focus only on major mergers (i.e., mass ratio ).
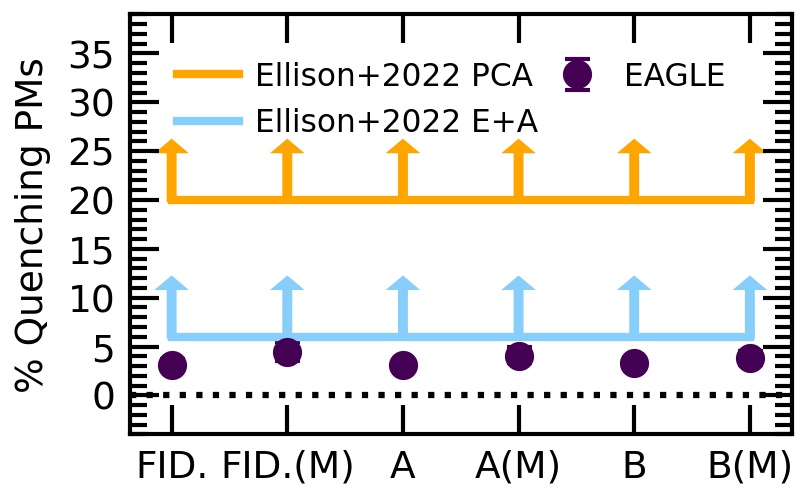
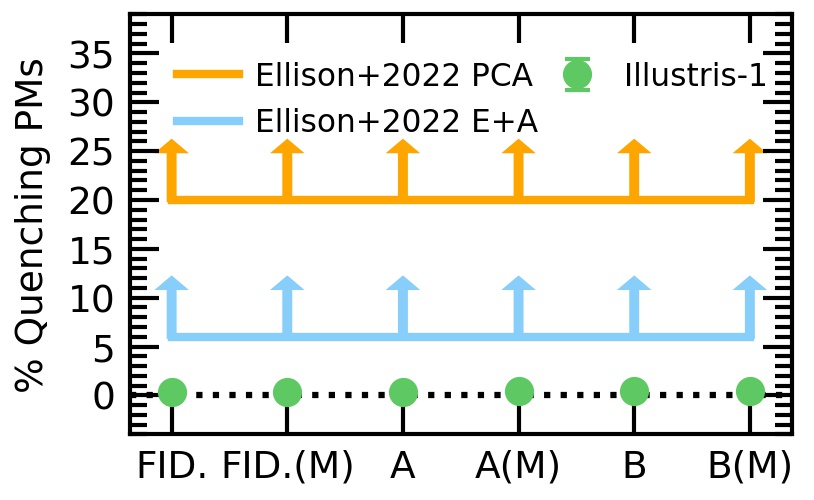
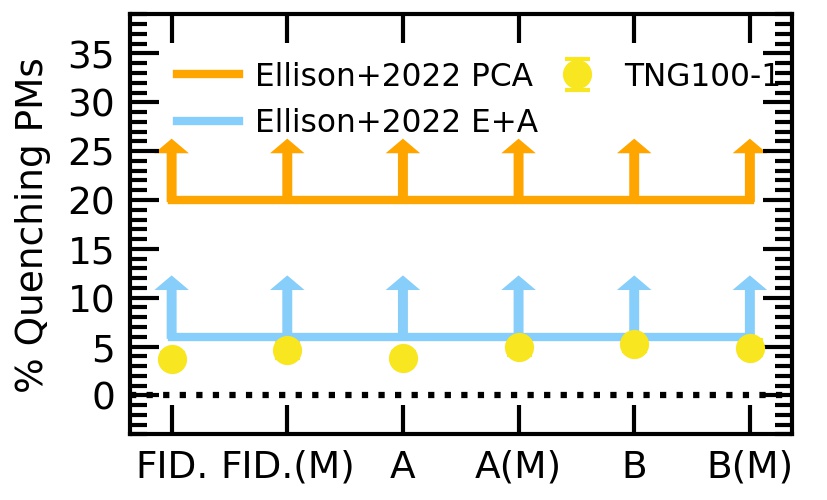
The result of the experiment is presented in the top panels of Figure 8. The three top panels show, from left to right, the merger quenched fractions measured in the various matching scheme variations for EAGLE,Illustris-1,TNG100-1 respectively. In each panel, the merger quenched fractions from Ellison et al. (2022) are reported in orange and light blue, for the PCA and E+A selections, respectively. We also drew arrows to indicate that Ellison et al. (2022) values are lower limits for the reasons described earlier in this section.
3.3.1 Global quenched fraction
The top panels of Figure 8 present the global quenched fractions of the three simulations. Symbols show the quenched fractions for the various matching schemes. Inspection of Figure 8 reveals that EAGLE post-mergers (top-left panel) show quenched fractions between and percent, with the larger values found in the variation scheme tests that are focused on major mergers. Illustris-1 shows, instead, quenched fractions between and percent, values substantially smaller than observations in all the variation tests. Similarly to EAGLE, the quenched fraction in TNG100-1 post-mergers (top-right panel) are between and percent. We note that TNG100-1 quenched fraction changed significantly from that in Figure 5. Here, the TNG100-1 fraction goes down because of all the non-star-forming post-mergers introduced in the denominator.
The mild discrepancy between EAGLE, TNG100-1 and the E+A observational post-starburst fraction could be explained by a difference in quenching efficiency between simulations and observations. Previous works comparing simulations with observations show that the galaxy passive fraction is about too low in EAGLE (Furlong et al., 2015; Trayford et al., 2017). Also in Illustris-1 quenching is not efficient enough compared to observations (e.g. Sparre et al., 2015; Bluck et al., 2016; Terrazas et al., 2017), while the quenching mechanism is more efficient in TNG100-1 than previous simulations, hence showing a better agreement with observations (e.g., Donnari et al., 2019). The EAGLE and TNG100-1 quenched fractions seem to be quantitatively almost compatible with the lower limit of E+A selection (i.e., ), with TNG100-1 showing a slightly better agreement than EAGLE. However, they are both substantially smaller than the observational PCA post-starburst fraction (i.e., ), with a level of incompatibility that is arguably challenging to be explained by the different experimental set up.
We finally note that the quenched fractions in the three analysed matching schemes (i.e., fiducial, A, and B) do not substantially differ from each other because the adopted criteria do not compromise the completeness of the post-merger sample, that is stably above in all the three simulations regardless of the matching approach. Finally, it is interesting to note that the variation tests focused on the major merger sub-samples show slightly larger quenched fractions than the corresponding tests on the whole merger sample, thus indicating that major mergers are more conducive to star formation quenching (see also Section 4.1).
3.3.2 Quenching excess
The second part of our comparison with observations regards the comparison of the quenching excess (i.e. the ratio between the number of quenched post-mergers over the number of quenched control galaxies) between simulated and observed mergers. Ellison et al. (2022) found a strong statistical excess of post-starbursts in post-merger galaxies, with quenching being to times (PCA and E+A selection, respectively) more common in post-mergers than in the control sample. The bottom panels of Figure 8 show the quenching excess from our various matching scheme variations. The three panels refer, from left to right, to EAGLE, Illustris-1, and TNG100-1, respectively. In all the panels, we also report the observational excess of the PCA (in orange, with an excess of ) and E+A (in light blue, with an excess of ) selections from Ellison et al. (2022). None of the simulations has a quenching excess high enough to be comparable with the observations. EAGLE shows excess between and (in the scheme A and the fiducial scheme focused on major mergers, respectively). The latter, though compatible with observations within errors, have a very large uncertainty due to the paucity of quenched controls, i.e., only one quenched control galaxy versus quenched post-mergers in the same period of time. Illustris-1 shows a post-merger quenching excess between and , with values, on average, compatible with a deficit of quenching (i.e. quenching excess ), which means quenching in Illustris-1 post-mergers is less common than expected in a control sample, thus consistent with what we already found in Section 3.2. Finally, TNG100-1 shows a post-merger quenching excess between and (in the fiducial matching scheme focused on major mergers and in the scheme A focused on major mergers), with a slightly worse agreement with observations than EAGLE. Earlier in this section, we demonstrated that the quenched fractions in EAGLE and TNG100-1 post-mergers are quantitatively almost compatible with the E+A selection, hence, the incommensurable difference in the quenching excess is driven by a larger number of control galaxies that quench in the simulations than in the observations. The difference in the simulated and observational controls could be explained if most of the simulated controls quench because of secular reasons and only a few pass through a post-starburst phase. However, we cannot test this speculative scenario because it would be challenging to isolate post-starburst galaxies in our global sample of mergers. Selecting a simulated sample of bona fide post-starbursts would require a different experimental approach and some fine-tuning to translate accurately the spectral post-starburst features into the star formation histories of the simulated galaxies (e.g., what should be the minimum strength of a burst to lead a galaxy through a post-starburst phase?).
To summarise, in this section, we attempt to compare the frequency of quenching in simulated and observed post-mergers. All of the three simulations, with the exception of a non statistically robust EAGLE case, produce a much lower excess of rapidly quenching post-mergers compared with observations with a caveat that a robust comparison would need to consider the details of post-starburst galaxy selection versus just rapid quenching. The incompatibility between observations and simulations may indicate either missing physical ingredients in the simulations, or insufficient resolution to capture the merger-induced effects.
4 Discussion
4.1 Lack of quenching in simulated post-mergers
So far, we have demonstrated that quenching of post-mergers in cosmological simulations occurs rarely and less frequently than in observations. However, we additionally demonstrate that the majority of star forming post-mergers have higher SMBH accretion rates compared with their controls and more frequently host highly accreting SMBHs, which suggests an excess of AGN feedback activity. Here, we investigate pivotal parameters (i.e., M, M, mass ratio , and gas fraction f) to get insights into the scarcity of quenching in simulated post-mergers. Before diving into the analysis, we present a brief overview of the importance of the aforementioned parameters on the interconnection between mergers and quenching.
Many studies indicate that black hole mass is the best physical proxy for determining the quenching status of massive galaxies, both in simulations (e.g., Bluck et al., 2016; Davies et al., 2019; Terrazas et al., 2020; Piotrowska et al., 2022), and observations (e.g., Bluck et al., 2016; Terrazas et al., 2016, 2017). In other words, black hole mass directly traces the integrated history of AGN feedback, hence, the cumulative energy released and coupled with the ISM and/or CGM. Quenched galaxies typically reside in massive halos (e.g., Davies et al., 2019; Cui et al., 2021), harbour overmassive (i.e., massive for their halo mass) black holes and have a low gas fraction, with quenching starting when the total amount of energy from efficient AGN feedback overcomes the gravitational binding energy of the gas (e.g., Terrazas et al., 2020), and prevents the CGM from cooling and replenishing the gas reservoir that sustains star formation (e.g., Davies et al., 2020; Zinger et al., 2020).
Quai et al. (2021) empirically found that gas fraction (i.e., the fraction of the total gas over the sum of stellar and gas mass within an aperture of two effective radii) is the best indicator for quenching in IllustrisTNG300-1’s galaxies, with star formation halting sharply as soon as gas fraction falls below due to the ejective effect of the TNG kinetic mode feedback. In this work, we generalise Quai et al. (2021)’s findings to the EAGLE, Illustris-1 and TNG100-1 simulations.
It is well established that mass ratio plays an important role in the impact of mergers on star formation (e.g., Cox et al., 2008; Moreno et al., 2015; Zheng et al., 2020). About of our post-mergers in the three simulations consist of minor mergers (i.e., , see the bottom-left panel in Figure 1), hence, it is necessary to tackle whether and how much our results are influenced by mass ratio. Altogether, the aforementioned parameters allow us to better understand the interplay between mergers, black holes and star formation.
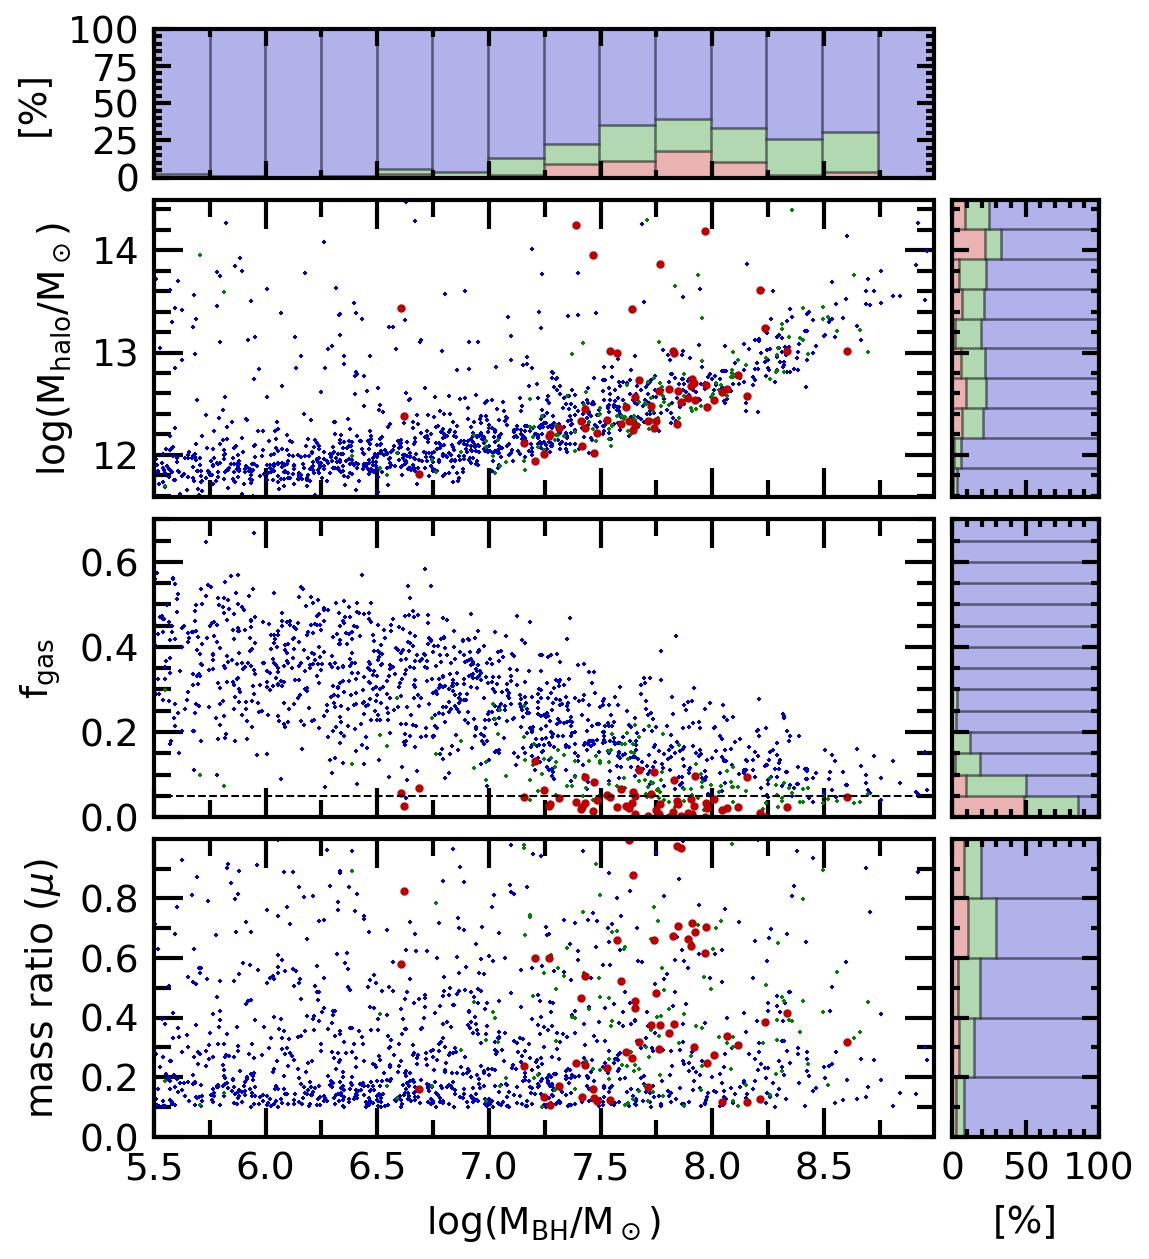
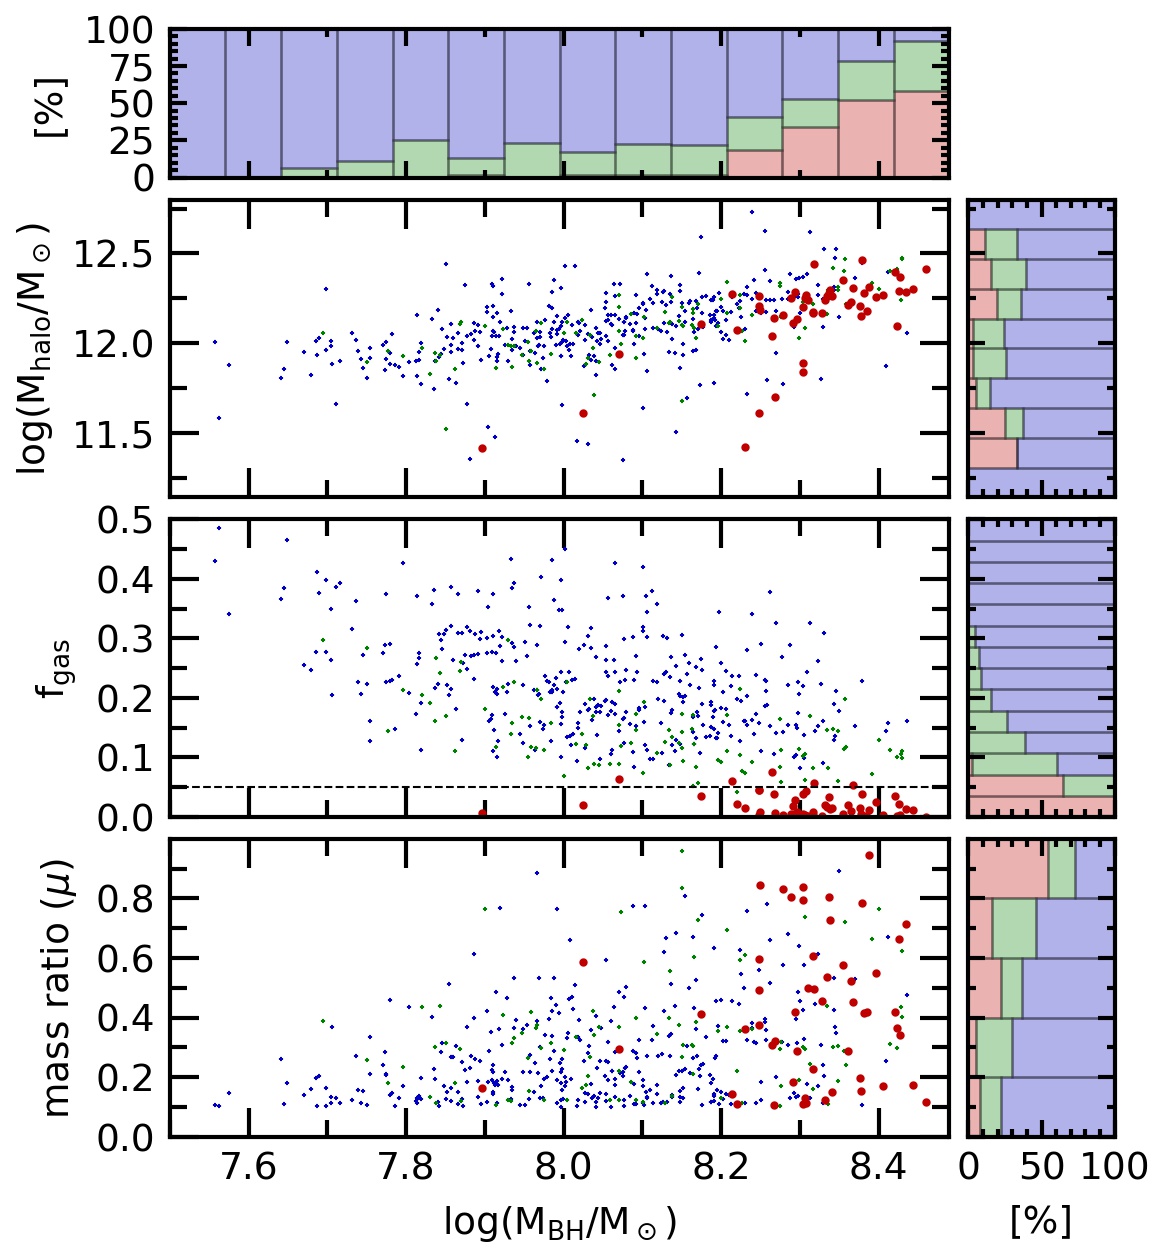
The result of the analysis is shown in Figure 9 for EAGLE, in Figure 10 for Illustris-1, and in Figure 11 for TNG100-1. The figures show the distribution (from top to bottom) of M, gas fraction f, and mass ratio as a function of black hole mass of star-forming (blue points), green valley (green points), and quenching (red points) post-mergers at Myr after coalescence. Moreover, the histogram in the top panel of each figure shows the percentage distribution of post-mergers in bins of black hole mass, whilst the three panels on the right show the histograms of the percentage distribution of post-mergers in bins of (from top to bottom) M, f, and . We discuss the results for each simulation in turn.
4.1.1 EAGLE
We discuss the results starting from the analysis of EAGLE in Figure 9. The histogram in the top panel demonstrates that quenching in EAGLE post-mergers is rare in any black hole mass regime. Almost all quenched post-mergers have black hole masses between and M⊙, although, this mass regime is dominated by star-forming post-mergers, representing percent of the population. At lower black hole mass, we find a long tail of (i.e., the of EAGLE post-mergers) galaxies, out of which only and are quenched and green valley post-mergers, respectively. However, at black hole masses larger than M⊙, where we would expect the quenched population to prevail, we find that of post-mergers are star-forming, and only out of are quenched.
To better understand why EAGLE post-mergers do not quench promptly, we investigate the M - M and f - M relationships (top and central distributions, respectively, in Figure 9). All post-mergers with less massive black holes reside in small halos and have gas fractions large enough to keep sustaining new episodes of star formation. In this black hole mass regime, it is clear that AGN feedback is not effective222The modified Bondi-Hoyle accretion implemented in EAGLE is proportional to M (Rosas-Guevara et al., 2015; Rosas-Guevara et al., 2016). in removing gas from the ISM, and the low virial temperature and high CGM mass fraction (and hence characteristic density of the CGM) of the halos grants short cooling time, thus providing fuel for star formation. It is less straightforward to interpret the dearth of quenching in post-mergers with black holes more massive than M⊙. The extra complication arises because EAGLE’s AGN feedback is not efficient enough at ejecting baryons and preventing cooling in group and cluster haloes. This is the reason why the EAGLE model produces groups and clusters that are too bright in X-ray (see Appendix A in Davies et al., 2019; Schaye et al., 2015). The CGM mass fraction is high in these haloes, hence, their inner regions can become quite dense, giving a short cooling time (see Davies et al., 2019; Oppenheimer et al., 2020). It is then very difficult for the AGN to remove gas from the CGM, which can therefore replenish the galaxy supply for new star formation.
We can observe the effect of change in AGN “effectiveness” by looking at the f-M distribution, and at the histogram of the percentage distribution of post-mergers in bins of f in the central panels of Figure 9. The panels show a trend with f reducing with increasing M (and increasing M). However, the vast majority of post-mergers maintain f, thus being able to form stars and stay in the star-forming main sequence. The few post-mergers that quench within Myr after coalescence have gas fraction around or below .
In the bottom panel of Figure 9, we investigate how the merger mass ratio influences the quenched fraction in EAGLE post-mergers. We find that major mergers show a slightly larger chance to be quenched, but even at mass ratios , only a small fraction of post-mergers are quenched, to which can be added of post-mergers in the green valley.
The weak dependence of quenched fraction on merger mass ratio is in contrast with some other results in the literature. For instance, Davies et al. (2022) found that increasing mass ratio in a EAGLE Milky Way-like merger galaxy causes more violent and preferentially head-on collisions, maximising the probability of quenching star formation. If we limit the analysis to Milky Way-like post-mergers with log(MM, we find that major mergers () have around higher chance to quench (or to reside in the green valley) shortly after coalescence than in minor mergers. Although, we also find that as much as of galaxies in this regime (i.e., major mergers in Milky Way-like galaxies) keep to stay star-forming.
To summarise, in EAGLE we find that as halo mass increases, the chances of a galaxy to be quenched by AGN feedback increases up to M M⊙, and then decreases as the AGN stop being effective in massive halos. Moreover, we do not find a significant impact of the merger mass ratio on the quenched fraction of EAGLE post-merger galaxies. Ultimately, we find that the gas fraction is the key ingredient to clearly disentangle star-forming and quenched post-mergers.
4.1.2 Illustris-1
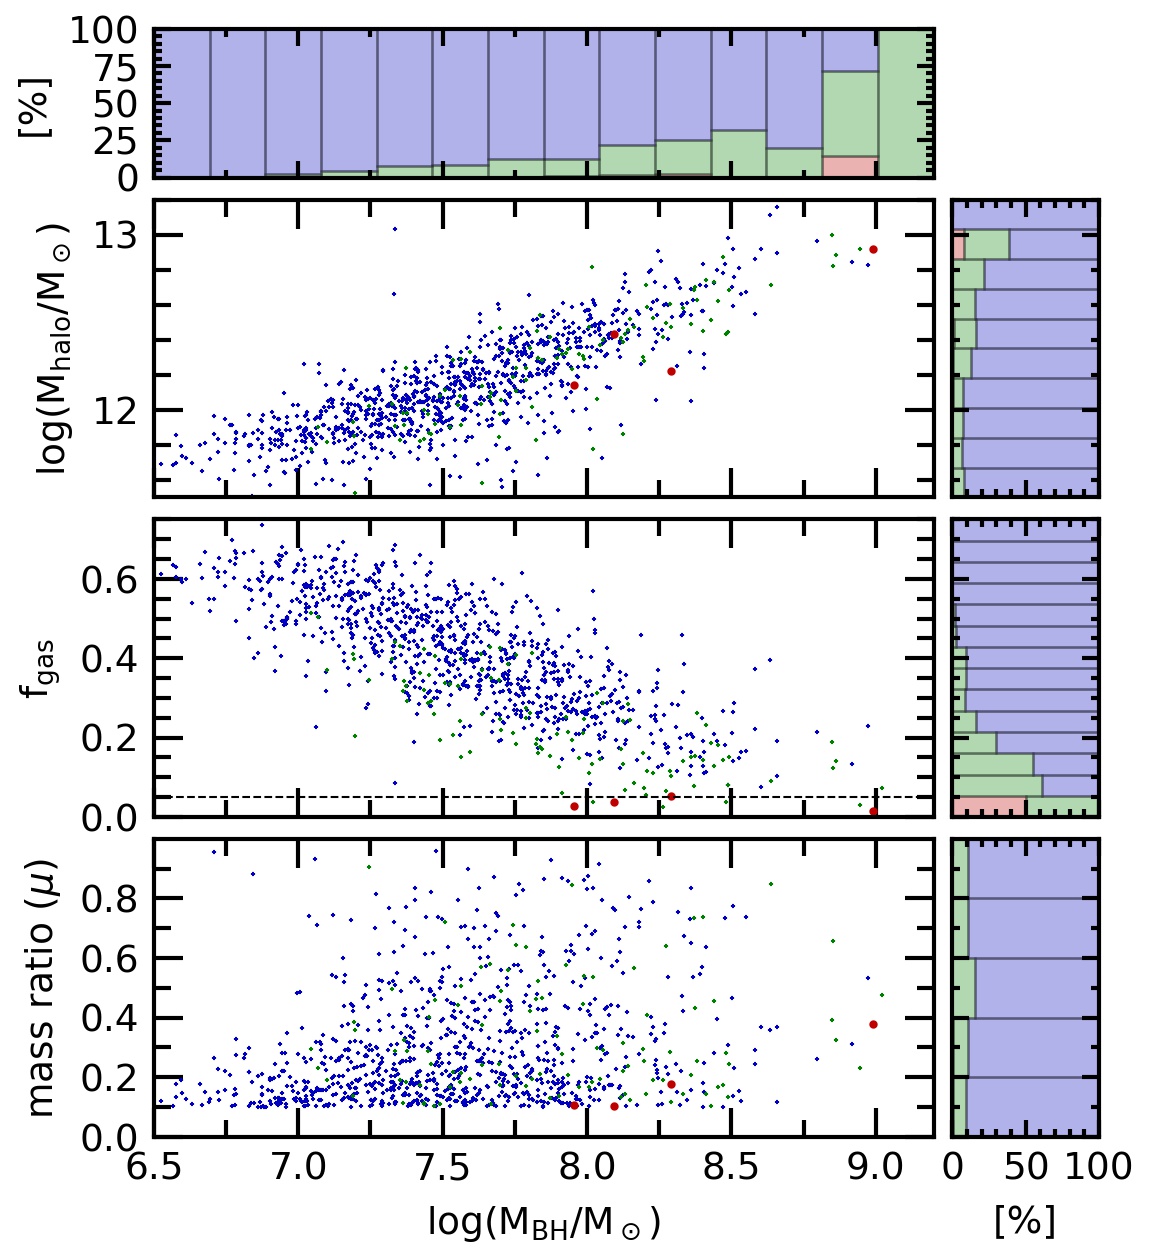
Figure 10 shows the results regarding Illustris-1. The figure demonstrates that only four Illustris-1 post-mergers quench within Myr after the merger. Despite the fact that the gas fraction decreases steadily with increasing black hole mass (and increasing halo mass), the star formation is affected (there is an increasing number of green valley galaxies), though not completely halted. The implementation of the Illustris-1 AGN feedback is the reason for such complete lack of quenching in post-mergers. Indeed, Illustris-1 post-mergers show a strong black hole accretion enhancement (see Section 3.1), thus activating the high accretion mode of the AGN feedback, which deposits thermal energy with a low coupling efficiency (e.g., Sparre et al., 2015; Donnari et al., 2019; Bluck et al., 2016; Terrazas et al., 2017), leaving the surrounding ISM almost unaffected.
4.1.3 TNG100-1
We focus now on the analysis of the lack of quenching in TNG100-1’s post-mergers. The results are shown in Figure 11, with an identical layout as that in Figure 9 for EAGLE. Studies of quenching in IllustrisTNG (Weinberger et al., 2017; Nelson et al., 2017; Terrazas et al., 2020) demonstrated that only the kinetic mode of AGN feedback is capable of causing star formation suppression. Terrazas et al. (2020) showed that the ejective feedback in IllustrisTNG becomes effective at quenching star formation once the cumulative kinetic energy overcomes the total gravitational binding energy of the gas in a galaxy. They also demonstrated that the kinetic feedback process dominates in galaxies whose M exceeds M⊙, that is the black hole mass threshold above which more than of the IllustrisTNG galaxies are quenched (see also Zinger et al., 2020). Such a M threshold for quiescence arises from the IllustrisTNG model parameters chosen to reproduce observational properties of the galaxy population at present (Pillepich et al., 2017a). Our results concerning the quenching deficiency in the TNG100-1 post-merger population reflect the general quenching process of galaxies in the simulation. In detail, the histogram in the top panel of Figure 11 shows that almost none of the post-mergers with M M⊙ are quenching, whilst the percentage of quenched post-mergers increases steadily at larger black hole mass, passing from at M M⊙, to at M M⊙, to which we can add, respectively, and of post-mergers in the green valley. All TNG quenched post-mergers have gas fraction f (see the central panels in Figure 11 ), confirming that these galaxies ran out of fuel for star formation. Differently from EAGLE though, we do not find trends with M (see the top panels in Figure 11). However, our TNG100-1 post-merger population has a smaller mass dynamical range, with most of the massive galaxies residing in halos of around M⊙, hence, we cannot probe the quenching efficiency of IllustrisTNG AGN feedback in post-mergers located in groups and clusters, as we can do for the EAGLE sample.
In the bottom panels of Figure 11, we investigate whether merger mass ratio influences the quenched fraction in TNG100-1 post-mergers. The histogram in the bottom-right corner shows that the percentage of quenched post-mergers strongly increases with increasing mass ratio, with a peak of quenched post-mergers in the bin of mass ratio above . However, the distribution of mass ratio as a function of black hole mass (bottom-left panel of Figure 11) shows a trend where higher mass ratio mergers have larger black hole mass, thus with a higher AGN feedback efficiency. To test whether the increment of the quenched fraction with the mass ratio is attributable to a larger black hole population, we calculate the fraction of quenched galaxies in two bins of mass ratio (i.e., , and ) for a sub-sample of TNG100-1 post-mergers that have black holes more massive than M⊙. In this sub-sample, we find and of quenched post-mergers in the minor and major merger bins, respectively, thus suggesting that TNG100-1 major mergers increase the chance of quenching shortly after coalescence. However, we find that as much as of major mergers that exhibit a massive black hole continue to reside in the star-forming main sequence. Such lack of quenching in major mergers could be due to other parameters governing the evolution in post-merger phases. For instance, Zeng et al. (2021) showed that progenitor orbits have an important effect on the remnant of TNG100-1 post mergers, with prograde orbits resulting in post-mergers with a high chance to preserve the original disk and a star-forming configuration even in major merger events.
To summarise, we find that quenching in a TNG100-1 post-merger occurs promptly after coalescence only if its black hole mass is larger than M⊙ (i.e., the mass above which the TNG100-1’s AGN feedback switches to the effective kinetic mode, Weinberger et al., 2018; Terrazas et al., 2020), and at the same time, its gas fraction is below . We also find that the TNG100-1 quenching fraction increases with increasing mass ratio, even though around percent of major mergers harbouring massive black holes continue to be star-forming long after coalescence.
4.2 Gas loss
In the previous sections, we showed that most simulated post-mergers keep forming stars. However, even if quenching is less frequent than in observations, we find that post-mergers quench at circa twice and at around ten times the rate of non-interacting control galaxies, in TNG100-1 and EAGLE, respectively (see Figure 6).
In the previous section the role of effective AGN feedback in quenched EAGLE and TNG100-1 post-mergers was investigated, a process which is in common with non-interacting galaxies. However, since we matched the two populations (and kept the match over the entire simulation life) in black hole mass (see Section 2.4), the quenching excess cannot be completely attributable to a mere difference in the black hole population, hence, it could be related to the merger process itself. In this section, we aim to tackle the origin of the extra quenching in EAGLE and TNG100-1 post-mergers. Note that we do not further analyse Illustris-1’s post-mergers because in Section 3.2 we demonstrated that quenched post-mergers in Illustris-1 are rarer than what expected from control non-interacting galaxies.
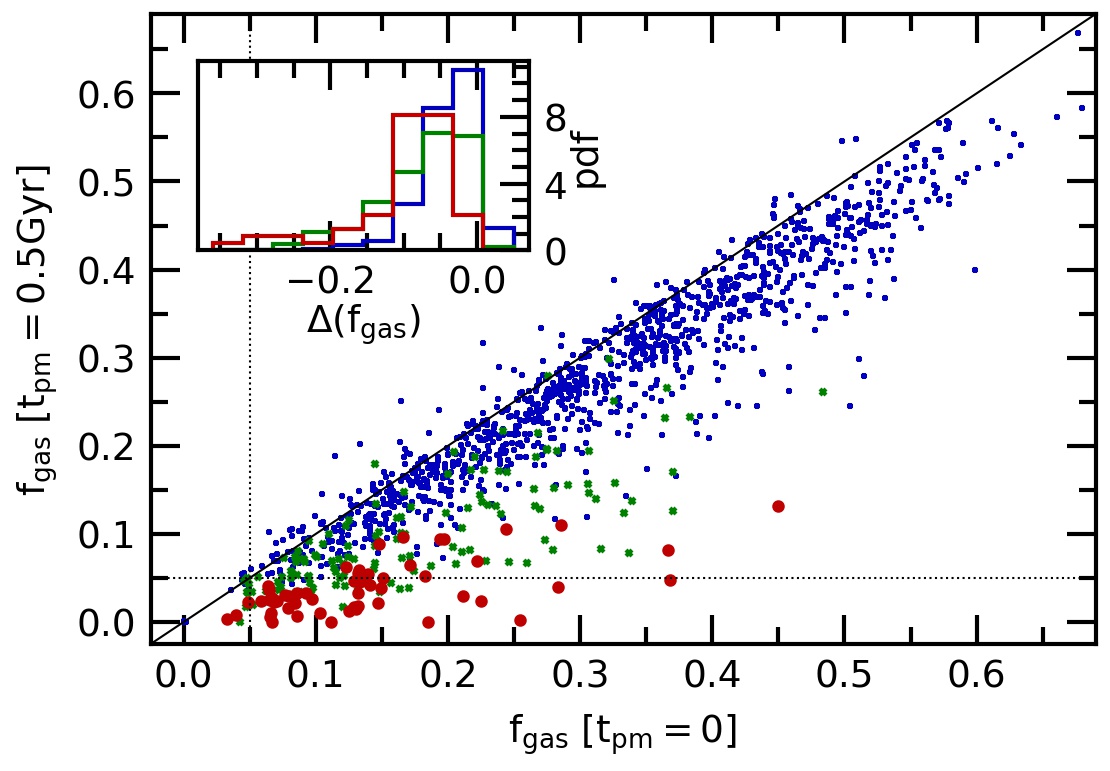
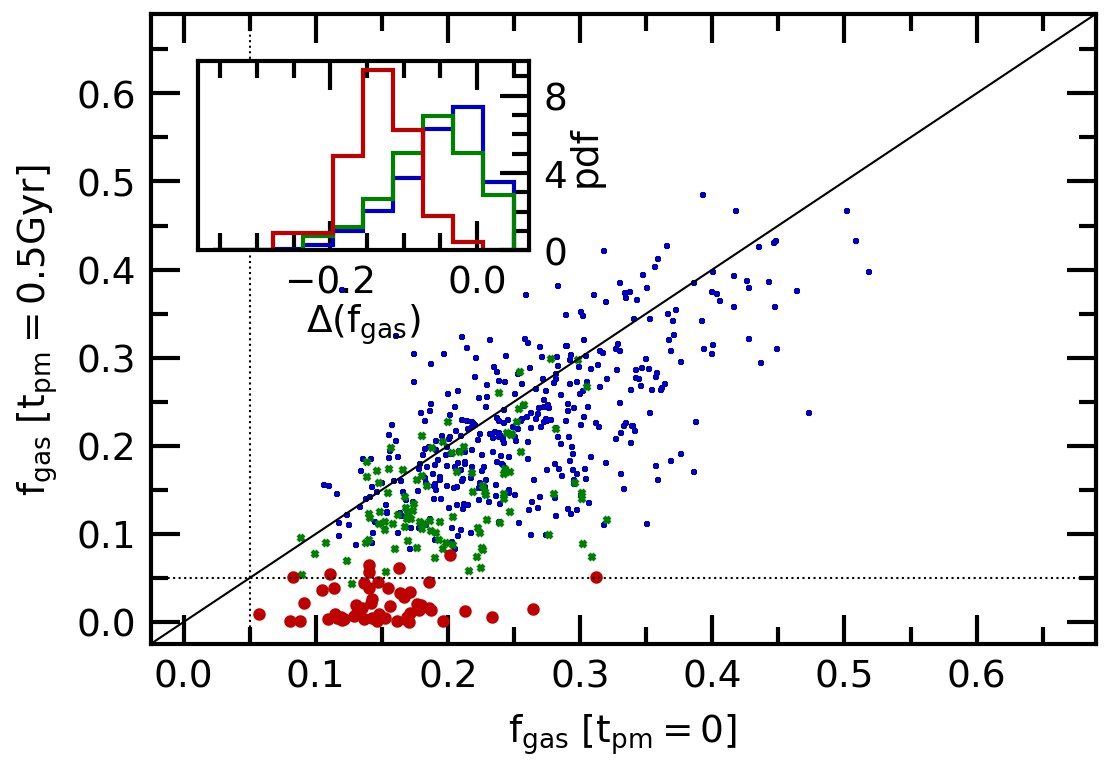
In Figures 9, 10, 11, it emerged that gas fraction is an excellent discriminator for the star-formation status of a population. Particularly, we found that a low level of gas fraction (i.e., f) strongly correlates with quenching. To shed light on the surplus of quenching in post-mergers compared to their direct control galaxies, it is, therefore, worth investigating how gas fraction evolves from coalescence in the post-merger population. We present the results in Figure 12. The two panels show the gas fraction at Myr after the merger versus the gas fraction at coalescence for (from top to bottom) EAGLE and TNG100-1. Star-forming post-mergers are represented in blue, green valley post-mergers in green and quenched post-mergers in red. The inset in each panel shows the distributions of gas loss, (i.e., f [t Gyr] f [t]), of the three star formation categories (i.e., star-forming, green valley, and quenched). We find two key results from the analysis of Figure 12. First of all, the plot shows that and (in EAGLE and TNG100-1, respectively) of quenched post-mergers had low gas fractions at coalescence333We stress that at coalescence all the galaxies in our samples have to be star-forming by construction, see Section 2., with values f. Such low gas fraction values at the time of the merger suggest that there is a pre-disposition towards quenching when the gas fraction is low to start with (see also Quai et al., 2021). What is also interesting is that the distributions of shown in the insets of Figure 12 demonstrate that quenched post-mergers in both simulations are also experiencing “preferentially” larger gas loss compared to those that stay star-forming and in the green valley. In numbers, we find mean values of and for EAGLE and TNG100-1 quenched post-mergers, respectively. Conversely, we find mean values of for both EAGLE and TNG100-1 star-forming, and and for EAGLE and TNG100-1 green valley post-mergers. Therefore, on the one hand, there is a “pre-disposition” to quench. However, on the other hand, the quenched post-mergers tend to lose relatively more gas shortly after coalescence.
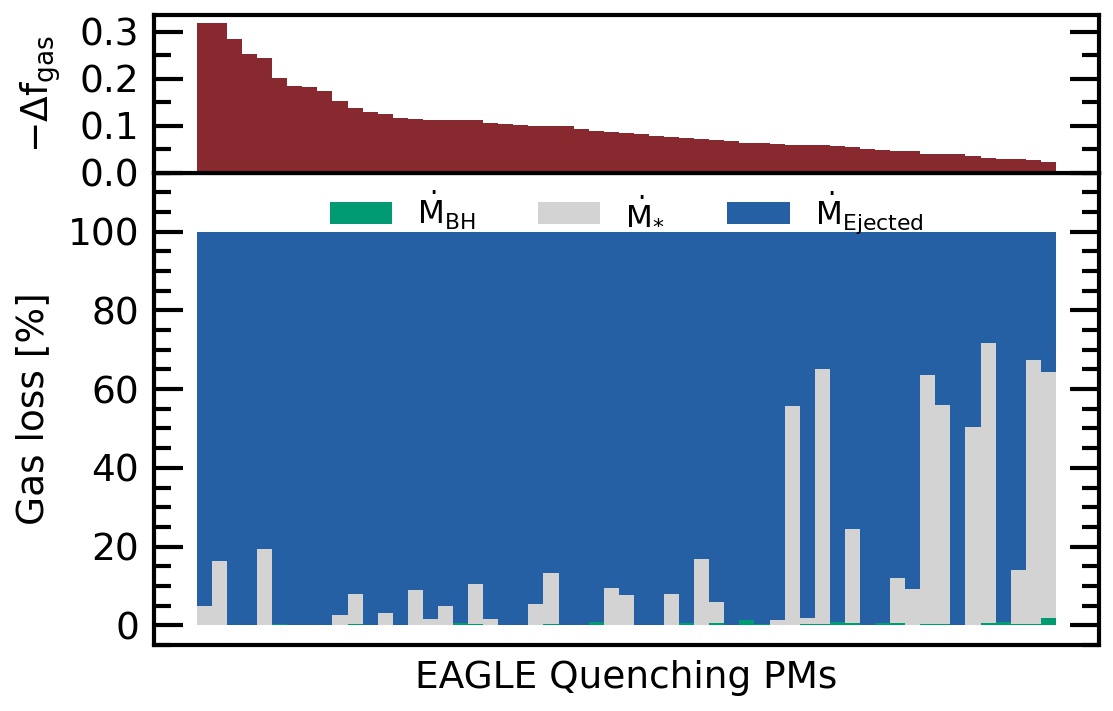
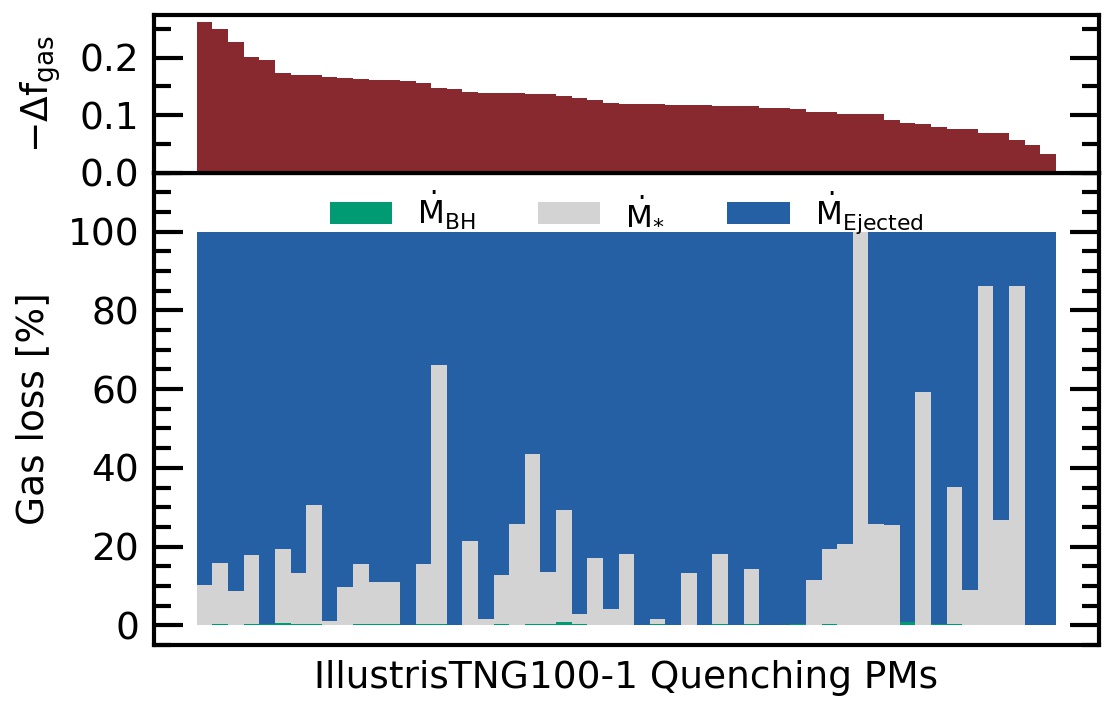
We investigate further the latter hypothesis in Figure 13, as well as attempting to quantify the mechanism responsible for the gas depletion that leads to quenching. Each vertical bar represents a single post-merger that quenches within Myr after the merger. In the top panel we focus on EAGLE, while quenched post-mergers in TNG100-1 are presented in the bottom panel. Galaxies are sorted from right to left from lowest to highest values (dark red histogram-like distribution), or in other words, according to increasing amount of gas missing with respect to coalescence. For each galaxy, we then show the percentage of such gas that has been accreted onto the central black hole (green bar; almost invisible for most galaxies), that has been converted into new stars (grey bar), and the percentage of gas that has been ejected outside the galaxy (blue bar). Figure 13 shows that in both simulations there is a large predominance of post-mergers which have of their missing gas completely ejected out of the galaxy, especially at higher values.
In summary, in this section we uncovered the two most common scenarios through which post-mergers quench following a merger event: galaxies which are predisposed to quench due to low gas fractions and those that quench after a period of significant gas evacuation.
4.3 Rapid versus long-term quenching
In this work we probed a merger-driven quenching scenario within state-of-the-art hydrodynamical cosmological simulations that encompass complete and robust samples of mergers covering a wide range of halo mass, mass ratio, orbital parameters, physical properties and environment. We found that a prompt quenching following a merger event is much less frequent than that expected from observational results and previous generations of simulations (see also Weinberger et al., 2018; Rodríguez Montero et al., 2019; Pathak et al., 2021, for similar results). We limited our analysis to the early stages of the post-merger evolution (i.e., probing the causal connection between mergers and rapid quenching) for two reasons: (1) the quenched fraction in post-mergers tends to gradually level off and finally even out with the quenched fraction of the control population (i.e., post-merger evolution becomes statistically indistinguishable from the secular evolution of non-interacting galaxies, see Figures 5 and 6); and (2) observations of quenched post-mergers are confined within a few hundred Myr after the coalescence phase. However, we cannot exclude the possibility of a long-term quenching that might be causally connected to galaxy-galaxy interactions. For instance, Davies et al. (2022) showed that in a series of genetically modified mergers of Milky Way-like galaxies from the EAGLE simulation, the intense AGN feedback triggered by major mergers can modify the evolution of the galaxy-CGM ecosystem. In such controlled post-mergers, the AGN feedback can eject enough gas to promptly push the galaxy out of the main sequence but not to fully quench its star formation. Quenching arises typically only around Gyr after the merger, due to the prolonged CGM cooling time that prevents further inflow of new gas. Testing longer-term quenching observationally is much more of a challenge as it requires being able to time the quenching episode as well as timing merger features (to prove a causal connection between them). Whilst star formation histories might be able to give fairly reliable quenching times in the last few Gyrs, timing mergers is harder, although some machine learning applications are now attempting to do this (e.g., Bottrell et al., 2022, Bottrell et al., in preparation).
5 Summary and Conclusions
We have used three different cosmological simulations to analyse a complete sample of post-merger galaxies in a fully cosmological environment spanning a diverse range of merger histories and physical properties. Each simulation implements accretion onto the central supermassive black hole and AGN feedback models that are distinct (see, for instance, Section 2).
Although galaxy-galaxy mergers are rare events in the history of a galaxy, there is a general consensus that mergers have a tremendous impact on the evolution of the merger remnants, with repercussions on shaping the global properties of galaxies (e.g., dark and stellar mass increment, metallicity evolution, mass function evolution, etc.). Such relative importance of mergers in the bigger picture of galaxy evolution should naturally arise as predictions of the models implemented in simulations. In this paper, we quantify the effect of galaxy-galaxy mergers on the black hole accretion, AGN feedback and rapid star formation quenching in three state-of-the-art cosmological simulations: EAGLE, Illustris-1, and TNG100-1. Moreover, for the first time we can compare the incidence of quenching in simulations with that of a large and pure sample of observed post-merger galaxies analysed in Ellison et al. (2022). Our findings can be summarised as follows:
-
•
The majority of star forming post-mergers exhibit higher SMBH accretion rates when compared with matched controls. On average, the post-merger population exhibits SMBH accretion rates 2.5 (EAGLE), 4.5 (Illustris-1), and 2.1 (TNG100-1) times higher than matched controls (see Section 3.1, and Figures 2 and 3.
-
•
Highly accreting SMBHs occur more frequently in the post-merger sample compared to the control sample, where post-mergers host the highest SMBH accretion rates up to 4 times more often (see Figure 4).
-
•
Rapid quenching is rare in the post-merger population in all three cosmological simulations. Only 4.5% (EAGLE), 0.4% (Illustris-1), and 10% (TNG100-1) of post-mergers quench within 500 Myrs of coalescence (see Section 3.2 and Figure 5). Despite the rarity of quenched post-mergers, quenching occurs more frequently than in the control population in the EAGLE and TNG100-1 simulations, with maximum quenching excesses factor (for the fiducial matching scheme) of and , respectively. In contrast, Illustris-1 demonstrates a quenching deficit, such that more control galaxies quench compared with the post-merger population (see Figure 6).
-
•
We proved the lack of a rapid merging-driven quenching scenario. However, we cannot statistically rule out a possible long-term quenching (over a few Gyr after coalescence) due, for instance, to a prolonged cooling time of the circumgalactic medium. For such long timescales we find that in all three simulations quenching in the post-merger population is statistically indistinguishable from the control sample of non-interacting galaxies, thus preventing any attempt to causally connect long quenching to merger itself (see figures 5 and 6, and comments in Section 4.3).
-
•
We compare our results with the observational results of Ellison et al. (2022), looking at the quenched fraction and quenching excess in post-starburst galaxies. We find the quenched fractions of EAGLE and Illustris-1 to be almost comparable to the lower limit estimated from E+A post-starburst selection, but incompatible with the lower limit estimated from PCA post-starburst selection. We further find that the simulations generally fail to reproduce the quenching excess of Ellison et al. (2022), with a note that EAGLE is able to produce an excess in agreement with Ellison et al. (2022) but with poor statistical significance (see Section 3.3, and Figure 8).
- •
-
•
We further demonstrate that there are two mechanisms at play to quench post-mergers: (1) a predisposition for post-mergers to quench if they exhibit a low gas fractions at the time of coalescence, and (2) a large amount of gas ejected promptly within 500 Myrs of coalescence (see Section 4.2, and figures 12 and 13).
Acknowledgements
We thank the referee, Neven Caplar, for his useful comments. We would like to express our gratitude to Jonathan J. Davies for his constructive comments and suggestions that greatly contributed to this work and Stuart McAlpine for providing the private-available EAGLE snipshots galaxy catalogue and insightful discussions. We are also grateful to Andrew Pontzen for his useful comments and suggestions. DRP and SLE gratefully acknowledge NSERC for Discovery Grants which helped to fund this research. This research was enabled, in part, by the computing resources provided by WestGrid and Compute Canada.
Data Availability
The data used in this work have been previously published. TNG100-1 and Illustris-1 data are publicly available at https://www.tng-project.org, and www.illustris-project.org/, respectively. EAGLE data, instead, can be accessed via https://virgodb.dur.ac.uk, however the snipshots used in this paper are for internal use only.
References
- Alonso et al. (2007) Alonso M. S., Lambas D. G., Tissera P., Coldwell G., 2007, MNRAS, 375, 1017
- Barnes & Hernquist (1996) Barnes J. E., Hernquist L., 1996, ApJ, 471, 115
- Bekki et al. (2005) Bekki K., Couch W. J., Shioya Y., Vazdekis A., 2005, MNRAS, 359, 949
- Bessiere et al. (2012) Bessiere P. S., Tadhunter C. N., Ramos Almeida C., Villar Martín M., 2012, MNRAS, 426, 276
- Bickley et al. (2022) Bickley R. W., Ellison S. L., Patton D. R., Bottrell C., Gwyn S., Hudson M. J., 2022, MNRAS, 514, 3294
- Blake et al. (2004) Blake C., et al., 2004, MNRAS, 355, 713
- Bluck et al. (2016) Bluck A. F. L., et al., 2016, MNRAS, 462, 2559
- Blumenthal & Barnes (2018) Blumenthal K. A., Barnes J. E., 2018, MNRAS, 479, 3952
- Bondi (1952) Bondi H., 1952, MNRAS, 112, 195
- Bondi & Hoyle (1944) Bondi H., Hoyle F., 1944, MNRAS, 104, 273
- Booth & Schaye (2009) Booth C. M., Schaye J., 2009, MNRAS, 398, 53
- Bottrell et al. (2022) Bottrell C., Hani M. H., Teimoorinia H., Patton D. R., Ellison S. L., 2022, MNRAS, 511, 100
- Bower et al. (2006) Bower R. G., Benson A. J., Malbon R., Helly J. C., Frenk C. S., Baugh C. M., Cole S., Lacey C. G., 2006, MNRAS, 370, 645
- Bustamante et al. (2018) Bustamante S., Sparre M., Springel V., Grand R. J. J., 2018, MNRAS, 479, 3381
- Bustamante et al. (2020) Bustamante S., Ellison S. L., Patton D. R., Sparre M., 2020, MNRAS, 494, 3469
- Byrne-Mamahit et al. (2022) Byrne-Mamahit S., Hani M., Ellison S., Quai S., Patton D., 2022, arXiv e-prints, p. arXiv:2212.07342
- Cao et al. (2016) Cao C., et al., 2016, ApJS, 222, 16
- Capelo et al. (2015) Capelo P. R., Volonteri M., Dotti M., Bellovary J. M., Mayer L., Governato F., 2015, MNRAS, 447, 2123
- Casteels et al. (2014) Casteels K. R. V., et al., 2014, MNRAS, 445, 1157
- Cattaneo et al. (2009) Cattaneo A., et al., 2009, Nature, 460, 213
- Chabrier (2003) Chabrier G., 2003, PASP, 115, 763
- Cisternas et al. (2011) Cisternas M., et al., 2011, ApJ, 741, L11
- Citro et al. (2017) Citro A., Pozzetti L., Quai S., Moresco M., Vallini L., Cimatti A., 2017, MNRAS, 469, 3108
- Correa et al. (2019) Correa C. A., Schaye J., Trayford J. W., 2019, MNRAS, 484, 4401
- Couch & Sharples (1987) Couch W. J., Sharples R. M., 1987, MNRAS, 229, 423
- Cox et al. (2008) Cox T. J., Jonsson P., Somerville R. S., Primack J. R., Dekel A., 2008, MNRAS, 384, 386
- Crain et al. (2015) Crain R. A., et al., 2015, MNRAS, 450, 1937
- Croton et al. (2006) Croton D. J., et al., 2006, MNRAS, 365, 11
- Cui et al. (2021) Cui W., Davé R., Peacock J. A., Anglés-Alcázar D., Yang X., 2021, Nature Astronomy, 5, 1069
- Davies et al. (2019) Davies J. J., Crain R. A., McCarthy I. G., Oppenheimer B. D., Schaye J., Schaller M., McAlpine S., 2019, MNRAS, 485, 3783
- Davies et al. (2020) Davies J. J., Crain R. A., Oppenheimer B. D., Schaye J., 2020, MNRAS, 491, 4462
- Davies et al. (2022) Davies J. J., Pontzen A., Crain R. A., 2022, MNRAS, 515, 1430
- De Propris et al. (2007) De Propris R., Conselice C. J., Liske J., Driver S. P., Patton D. R., Graham A. W., Allen P. D., 2007, ApJ, 666, 212
- Di Matteo et al. (2005) Di Matteo T., Springel V., Hernquist L., 2005, Nature, 433, 604
- Di Matteo et al. (2007) Di Matteo P., Combes F., Melchior A.-L., Semelin B., 2007, A&A, 468, 61
- Di Matteo et al. (2008) Di Matteo T., Colberg J., Springel V., Hernquist L., Sijacki D., 2008, ApJ, 676, 33
- Donnari et al. (2019) Donnari M., et al., 2019, MNRAS, 485, 4817
- Dressler & Gunn (1983) Dressler A., Gunn J. E., 1983, ApJ, 270, 7
- Ellison et al. (2008) Ellison S. L., Patton D. R., Simard L., McConnachie A. W., 2008, AJ, 135, 1877
- Ellison et al. (2011) Ellison S. L., Patton D. R., Mendel J. T., Scudder J. M., 2011, MNRAS, 418, 2043
- Ellison et al. (2013a) Ellison S. L., Mendel J. T., Scudder J. M., Patton D. R., Palmer M. J. D., 2013a, MNRAS, 430, 3128
- Ellison et al. (2013b) Ellison S. L., Mendel J. T., Patton D. R., Scudder J. M., 2013b, MNRAS, 435, 3627
- Ellison et al. (2019) Ellison S. L., Viswanathan A., Patton D. R., Bottrell C., McConnachie A. W., Gwyn S., Cuillandre J.-C., 2019, MNRAS, 487, 2491
- Ellison et al. (2022) Ellison S. L., et al., 2022, arXiv e-prints, p. arXiv:2209.07613
- Fabian et al. (2006) Fabian A. C., Celotti A., Erlund M. C., 2006, MNRAS, 373, L16
- Furlong et al. (2015) Furlong M., et al., 2015, MNRAS, 450, 4486
- Gao et al. (2020) Gao F., et al., 2020, A&A, 637, A94
- Gehrels (1986) Gehrels N., 1986, ApJ, 303, 336
- Goto (2005) Goto T., 2005, MNRAS, 357, 937
- Goulding et al. (2018) Goulding A. D., et al., 2018, PASJ, 70, S37
- Grønnow et al. (2015) Grønnow A. E., Finlator K., Christensen L., 2015, MNRAS, 451, 4005
- Habouzit et al. (2021) Habouzit M., et al., 2021, MNRAS, 503, 1940
- Habouzit et al. (2022) Habouzit M., et al., 2022, MNRAS, 509, 3015
- Hani et al. (2019) Hani M. H., Ellison S. L., Sparre M., Grand R. J. J., Pakmor R., Gomez F. A., Springel V., 2019, MNRAS, 488, 135
- Hani et al. (2020) Hani M. H., Gosain H., Ellison S. L., Patton D. R., Torrey P., 2020, MNRAS, 493, 3716
- Hernández-Toledo et al. (2005) Hernández-Toledo H. M., Avila-Reese V., Conselice C. J., Puerari I., 2005, AJ, 129, 682
- Hernquist (1989) Hernquist L., 1989, Nature, 340, 687
- Hewlett et al. (2017) Hewlett T., Villforth C., Wild V., Mendez-Abreu J., Pawlik M., Rowlands K., 2017, MNRAS, 470, 755
- Hinshaw et al. (2013) Hinshaw G., et al., 2013, ApJS, 208, 19
- Hopkins et al. (2008) Hopkins P. F., Hernquist L., Cox T. J., Kereš D., 2008, ApJS, 175, 356
- Hoyle & Lyttleton (1940) Hoyle F., Lyttleton R. A., 1940, Proceedings of the Cambridge Philosophical Society, 36, 325
- Kennicutt (1998) Kennicutt Robert C. J., 1998, ApJ, 498, 541
- Khalatyan et al. (2008) Khalatyan A., Cattaneo A., Schramm M., Gottlöber S., Steinmetz M., Wisotzki L., 2008, MNRAS, 387, 13
- Knapen et al. (2015) Knapen J. H., Cisternas M., Querejeta M., 2015, MNRAS, 454, 1742
- Kocevski et al. (2012) Kocevski D. D., et al., 2012, ApJ, 744, 148
- Kocevski et al. (2015) Kocevski D. D., et al., 2015, ApJ, 814, 104
- Lambrides et al. (2021) Lambrides E. L., et al., 2021, ApJ, 919, 129
- Li et al. (2008) Li C., Kauffmann G., Heckman T. M., Jing Y. P., White S. D. M., 2008, MNRAS, 385, 1903
- Lotz et al. (2008) Lotz J. M., Jonsson P., Cox T. J., Primack J. R., 2008, MNRAS, 391, 1137
- Lynden-Bell (1969) Lynden-Bell D., 1969, Nature, 223, 690
- Marian et al. (2020) Marian V., et al., 2020, ApJ, 904, 79
- Marinacci et al. (2018) Marinacci F., et al., 2018, MNRAS, 480, 5113
- McAlpine et al. (2016) McAlpine S., et al., 2016, Astronomy and Computing, 15, 72
- McAlpine et al. (2020) McAlpine S., Harrison C. M., Rosario D. J., Alexander D. M., Ellison S. L., Johansson P. H., Patton D. R., 2020, MNRAS, 494, 5713
- Mihos (1995) Mihos J. C., 1995, ApJ, 438, L75
- Mihos & Hernquist (1996) Mihos J. C., Hernquist L., 1996, ApJ, 464, 641
- Montuori et al. (2010) Montuori M., Di Matteo P., Lehnert M. D., Combes F., Semelin B., 2010, A&A, 518, A56
- Moreno et al. (2015) Moreno J., Torrey P., Ellison S. L., Patton D. R., Bluck A. F. L., Bansal G., Hernquist L., 2015, MNRAS, 448, 1107
- Murray et al. (2005) Murray N., Quataert E., Thompson T. A., 2005, ApJ, 618, 569
- Naiman et al. (2018) Naiman J. P., et al., 2018, MNRAS, 477, 1206
- Nelson et al. (2015) Nelson D., et al., 2015, Astronomy and Computing, 13, 12
- Nelson et al. (2017) Nelson D., et al., 2017, MNRAS, 475, 624
- Oegerle et al. (1991) Oegerle W. R., Hill J. M., Hoessel J. G., 1991, ApJ, 381, L9
- Oppenheimer et al. (2020) Oppenheimer B. D., et al., 2020, ApJ, 893, L24
- Pakmor et al. (2016) Pakmor R., Springel V., Bauer A., Mocz P., Munoz D. J., Ohlmann S. T., Schaal K., Zhu C., 2016, MNRAS, 455, 1134
- Pathak et al. (2021) Pathak D., Belli S., Weinberger R., 2021, ApJ, 916, L23
- Patton et al. (2005) Patton D. R., Grant J. K., Simard L., Pritchet C. J., Carlberg R. G., Borne K. D., 2005, AJ, 130, 2043
- Patton et al. (2013) Patton D. R., Torrey P., Ellison S. L., Mendel J. T., Scudder J. M., 2013, MNRAS, 433, L59
- Patton et al. (2016) Patton D. R., Qamar F. D., Ellison S. L., Bluck A. F. L., Simard L., Mendel J. T., Moreno J., Torrey P., 2016, MNRAS, 461, 2589
- Patton et al. (2020) Patton D. R., et al., 2020, MNRAS, 494, 4969
- Pawlik et al. (2018) Pawlik M. M., et al., 2018, MNRAS, 477, 1708
- Pawlik et al. (2019) Pawlik M. M., McAlpine S., Trayford J. W., Wild V., Bower R., Crain R. A., Schaller M., Schaye J., 2019, Nature Astronomy, 3, 440
- Pierce et al. (2022) Pierce J. C. S., et al., 2022, MNRAS, 510, 1163
- Pillepich et al. (2017a) Pillepich A., et al., 2017a, MNRAS, 473, 4077
- Pillepich et al. (2017b) Pillepich A., et al., 2017b, MNRAS, 475, 648
- Piotrowska et al. (2022) Piotrowska J. M., Bluck A. F. L., Maiolino R., Peng Y., 2022, MNRAS, 512, 1052
- Planck Collaboration et al. (2014) Planck Collaboration et al., 2014, A&A, 571, A16
- Planck Collaboration et al. (2016) Planck Collaboration et al., 2016, A&A, 594, A13
- Pontzen et al. (2017) Pontzen A., Tremmel M., Roth N., Peiris H. V., Saintonge A., Volonteri M., Quinn T., Governato F., 2017, MNRAS, 465, 547
- Pracy et al. (2009) Pracy M. B., Kuntschner H., Couch W. J., Blake C., Bekki K., Briggs F., 2009, MNRAS, 396, 1349
- Quai et al. (2018) Quai S., Pozzetti L., Citro A., Moresco M., Cimatti A., 2018, MNRAS, 478, 3335
- Quai et al. (2019) Quai S., Pozzetti L., Moresco M., Citro A., Cimatti A., Brinchmann J., Gunawardhana M. L. P., Paalvast M., 2019, MNRAS, 490, 2347
- Quai et al. (2021) Quai S., Hani M. H., Ellison S. L., Patton D. R., Woo J., 2021, MNRAS, 504, 1888
- Rodriguez-Gomez et al. (2015) Rodriguez-Gomez V., et al., 2015, MNRAS, 449, 49
- Rodríguez Montero et al. (2019) Rodríguez Montero F., Davé R., Wild V., Anglés-Alcázar D., Narayanan D., 2019, MNRAS, 490, 2139
- Roos & Norman (1979) Roos N., Norman C. A., 1979, A&A, 76, 75
- Rosas-Guevara et al. (2015) Rosas-Guevara Y. M., et al., 2015, MNRAS, 454, 1038
- Rosas-Guevara et al. (2016) Rosas-Guevara Y., Bower R. G., Schaye J., McAlpine S., Dalla Vecchia C., Frenk C. S., Schaller M., Theuns T., 2016, MNRAS, 462, 190
- Roth et al. (2016) Roth N., Pontzen A., Peiris H. V., 2016, MNRAS, 455, 974
- Sanchez et al. (2020) Sanchez N. N., Tremmel M., Werk J. K., Pontzen A., Christensen C., Quinn T., Loebman S., Cruz A., 2020, arXiv e-prints, p. arXiv:2009.05581
- Satyapal et al. (2014) Satyapal S., Ellison S. L., McAlpine W., Hickox R. C., Patton D. R., Mendel J. T., 2014, MNRAS, 441, 1297
- Sazonova et al. (2021) Sazonova E., et al., 2021, ApJ, 919, 134
- Schawinski et al. (2011) Schawinski K., Urry M., Treister E., Simmons B., Natarajan P., Glikman E., 2011, ApJ, 743, L37
- Schaye & Dalla Vecchia (2008) Schaye J., Dalla Vecchia C., 2008, MNRAS, 383, 1210
- Schaye et al. (2015) Schaye J., et al., 2015, MNRAS, 446, 521
- Setton et al. (2022) Setton D. J., et al., 2022, ApJ, 931, 51
- Shah et al. (2020) Shah E. A., et al., 2020, ApJ, 904, 107
- Silk & Rees (1998) Silk J., Rees M. J., 1998, A&A, 331, L1
- Somerville & Davé (2015) Somerville R. S., Davé R., 2015, ARA&A, 53, 51
- Somerville et al. (2008) Somerville R. S., Hopkins P. F., Cox T. J., Robertson B. E., Hernquist L., 2008, MNRAS, 391, 481
- Sparre & Springel (2016) Sparre M., Springel V., 2016, MNRAS, 462, 2418
- Sparre et al. (2015) Sparre M., et al., 2015, MNRAS, 447, 3548
- Springel (2005) Springel V., 2005, MNRAS, 364, 1105
- Springel (2010) Springel V., 2010, MNRAS, 401, 791
- Springel & Hernquist (2003) Springel V., Hernquist L., 2003, MNRAS, 339, 289
- Springel et al. (2005a) Springel V., Di Matteo T., Hernquist L., 2005a, MNRAS, 361, 776
- Springel et al. (2005b) Springel V., et al., 2005b, Nature, 435, 629
- Springel et al. (2005c) Springel V., Di Matteo T., Hernquist L., 2005c, ApJ, 620, L79
- Springel et al. (2017) Springel V., et al., 2017, MNRAS, 475, 676
- Steinborn et al. (2018) Steinborn L. K., Hirschmann M., Dolag K., Shankar F., Juneau S., Krumpe M., Remus R.-S., Teklu A. F., 2018, MNRAS, 481, 341
- Terrazas et al. (2016) Terrazas B. A., Bell E. F., Henriques B. M. B., White S. D. M., Cattaneo A., Woo J., 2016, ApJ, 830, L12
- Terrazas et al. (2017) Terrazas B. A., Bell E. F., Woo J., Henriques B. M. B., 2017, ApJ, 844, 170
- Terrazas et al. (2020) Terrazas B. A., et al., 2020, MNRAS, 493, 1888
- Thorp et al. (2019) Thorp M. D., Ellison S. L., Simard L., Sánchez S. F., Antonio B., 2019, MNRAS, 482, L55
- Toomre & Toomre (1972) Toomre A., Toomre J., 1972, ApJ, 178, 623
- Torrey et al. (2012) Torrey P., Cox T. J., Kewley L., Hernquist L., 2012, ApJ, 746, 108
- Trayford et al. (2017) Trayford J. W., et al., 2017, MNRAS, 470, 771
- Villforth et al. (2014) Villforth C., et al., 2014, MNRAS, 439, 3342
- Villumsen (1982) Villumsen J. V., 1982, MNRAS, 199, 493
- Vogelsberger et al. (2013) Vogelsberger M., Genel S., Sijacki D., Torrey P., Springel V., Hernquist L., 2013, MNRAS, 436, 3031
- Vogelsberger et al. (2014) Vogelsberger M., et al., 2014, MNRAS, 444, 1518
- Weinberger et al. (2017) Weinberger R., et al., 2017, MNRAS, 465, 3291
- Weinberger et al. (2018) Weinberger R., et al., 2018, MNRAS, 479, 4056
- White (1978) White S. D. M., 1978, MNRAS, 184, 185
- Wild et al. (2007) Wild V., Kauffmann G., Heckman T., Charlot S., Lemson G., Brinchmann J., Reichard T., Pasquali A., 2007, MNRAS, 381, 543
- Wild et al. (2009) Wild V., Walcher C. J., Johansson P. H., Tresse L., Charlot S., Pollo A., Le Fèvre O., de Ravel L., 2009, MNRAS, 395, 144
- Wild et al. (2010) Wild V., Heckman T., Charlot S., 2010, MNRAS, 405, 933
- Wild et al. (2020) Wild V., et al., 2020, MNRAS, 494, 529
- Wilkinson et al. (2022) Wilkinson S., Ellison S. L., Bottrell C., Bickley R. W., Stephen G., Jean-Charles C., Vivienne W., 2022, In press, MNRAS
- Yang et al. (2008) Yang Y., Zabludoff A. I., Zaritsky D., Mihos J. C., 2008, ApJ, 688, 945
- Zabludoff et al. (1996) Zabludoff A. I., Zaritsky D., Lin H., Tucker D., Hashimoto Y., Shectman S. A., Oemler A., Kirshner R. P., 1996, ApJ, 466, 104
- Zeng et al. (2021) Zeng G., Wang L., Gao L., 2021, MNRAS, 507, 3301
- Zheng et al. (2020) Zheng Y., Wild V., Lahén N., Johansson P. H., Law D., Weaver J. R., Jimenez N., 2020, MNRAS, 498, 1259
- Zinger et al. (2020) Zinger E., et al., 2020, MNRAS, 499, 768