T-Projection: High Quality Annotation Projection
for Sequence Labeling Tasks
Abstract
In the absence of readily available labeled data for a given sequence labeling task and language, annotation projection has been proposed as one of the possible strategies to automatically generate annotated data. Annotation projection has often been formulated as the task of transporting, on parallel corpora, the labels pertaining to a given span in the source language into its corresponding span in the target language. In this paper we present T-Projection, a novel approach for annotation projection that leverages large pretrained text-to-text language models and state-of-the-art machine translation technology. T-Projection decomposes the label projection task into two subtasks: (i) A candidate generation step, in which a set of projection candidates using a multilingual T5 model is generated and, (ii) a candidate selection step, in which the generated candidates are ranked based on translation probabilities. We conducted experiments on intrinsic and extrinsic tasks in 5 Indo-European and 8 low-resource African languages. We demostrate that T-projection outperforms previous annotation projection methods by a wide margin. We believe that T-Projection can help to automatically alleviate the lack of high-quality training data for sequence labeling tasks. Code and data are publicly available.111https://github.com/ikergarcia1996/T-Projection
1 Introduction
The performance of supervised machine-learning methods for Natural Language Processing, including advanced deep-neural models Devlin et al. (2019); Conneau et al. (2020); Xue et al. (2021); Zhang et al. (2022), heavily depends on the availability of manually annotated training data. In addition, supervised models show a significant decrease in performance when evaluated in out-of-domain settings Liu et al. (2021). This means that obtaining optimal results would require to manually generate annotated data for each application domain and language, an unfeasible task in terms of monetary cost and human effort. As a result, for the majority of languages in the world the amount of manually annotated data for many downstream tasks is simply nonexistent Joshi et al. (2020).
The emergence of multilingual language models Devlin et al. (2019); Conneau et al. (2020) allows for zero-shot cross-lingual transfer. A model fine-tuned on one language, typically English, can be directly applied to other target languages. However, better results can be obtained by either machine translating the training data from English into the target languages or, conversely, translating the test data from the target language into English Hu et al. (2020); Artetxe et al. (2023).
Sequence labeling tasks, which involve span-level annotations, require an additional step called annotation projection. This step involves identifying, in the translated sentence, the sequence of words that corresponds to the labeled spans in the source text Yarowsky et al. (2001); Ehrmann et al. (2011). The majority of previous published work on this line of research explores the application of word-alignments Ehrmann et al. (2011). However, projection methods based on word-alignments have achieved mixed results as they often produce partial, incorrect or missing annotation projections García-Ferrero et al. (2022). This is due to the fact that word alignments are computed on a word-by-word basis leveraging word co-occurrences or similarity between word vector representations. That is, without taking into consideration the labeled spans or categories to be projected. Other techniques have also been proposed, such as fine-tuning language models in the span projection task Li et al. (2021), translating the labeled spans independently from the sentence Zhou et al. (2022) or including markers during the machine translation step Chen et al. (2023). However, automatic annotation projection remains an open and difficult challenge.
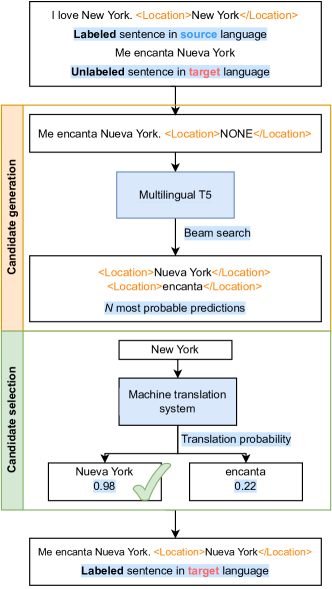
In this paper we present T-Projection, a novel approach to automatically project sequence labeling annotations across languages. Our method is illustrated by Figure 1. We split the annotation projection task into two steps. First, we use mT5 Xue et al. (2021) text-to-text model to generate a set of projection candidates in the target sentence for each labeled category in the source sentence. This step exploits the labeled categories as well as the cross-lingual capabilities of large pretrained multilingual language models. Second, we rank the candidates based on the probability of being generated as a translation of the source spans. We use the M2M100 Fan et al. (2021) and NLLB200 Costa-jussà et al. (2022) state-of-the-art MT models to compute the translation probabilities Vamvas and Sennrich (2022).
We conduct an intrinsic evaluation on three different tasks, Opinion Target Extraction (OTE), Named Entity Recognition (NER) and Argument Mining (AM), and five different target languages (French, German, Italian, Russian and Spanish). In this evaluation we compare the label projections generated by various systems with manually projected annotations. On average, T-Projection improves the current state-of-the-art annotation projection methods by more than 8 points in F1 score, which constitutes a significant leap in quality over previous label projection approaches. Additionally, we performed a real-world NER task evaluation involving eight low-resource African languages. In this downstream evaluation, T-Projection outperformed other annotation projection methods by 3.6 points in F1 score.
2 Background
While most of the previous approaches for annotation projection are based on the application of word alignments, other techniques have also been explored.
2.1 Word alignment methods
Ehrmann et al. (2011) use the statistical alignment of phrases to project the English labels of a multi-parallel corpus into the target languages. Instead of using discrete labels, Wang and Manning (2014) project model expectations with the aim of facilitating the transfer of model uncertainty across languages. Ni et al. (2017) aim to filter good-quality projection-labeled data from noisy data by proposing a set of heuristics. Other works have proposed to use word alignments generated by Giza++ Och and Ney (2003) to project parallel labeled data from multiple languages into a single target language Agerri et al. (2018). Fei et al. (2020) use the word alignment probabilities calculated with FastAlign Dyer et al. (2013) and the POS tag distributions of the source and target words to project from the source corpus into a target language machine-translated corpus. Finally, García-Ferrero et al. (2022) propose an annotation projection method based on machine translation and AWESOME Dou and Neubig (2021), Transformer-based word alignments to automatically project datasets from English to other languages.
2.2 Other projection methods
With respect to projection methods which do not use word alignments, Jain et al. (2019) first generate a list of projection candidates by orthographic and phonetic similarity. They choose the best matching candidate based on distributional statistics derived from the dataset. Xie et al. (2018) propose a method to find word translations based on bilingual word embeddings. Li et al. (2021) use a XLM-RoBERTa model Conneau et al. (2020) trained with the source labeled part of a parallel corpus to label the target part of the corpus. Then they train a new improved model with both labeled parts. Zhou et al. (2022) first replace the labeled sequences with a placeholder token in the source sentence. Second, they separately translate the sentence with the placeholders and the labeled spans into the target sentences. Finally, they replace the placeholders in the translated sentence with the translation of the labeled spans. Chen et al. (2023) jointly perform translation and projection by inserting special markers around the labeled spans in the source sentence. To improve the translation accuracy and reduce translation artifacts, they fine-tune the translation model with a synthetic label protection dataset.
To summarize, previous work does not take advantage of all the information which is available while performing annotation projection. For example, word alignment models do not take into account the labeled spans and their categories during alignment generation. Instead, they simply rely on information about word co-occurrences or similarity between word representations. Those techniques based on MT to generate the target part of the parallel corpus ignore additional knowledge that the MT model encodes. Furthermore, methods that utilize MT models for both translation and projection often introduce translation artifacts, which can affect the quality and accuracy of the projections. In contrast, our T-Projection method exploits both the labeled spans and their categories together with the translation probabilities to produce high-quality annotation projections.
3 T-Projection
Given a source sentence in which we have sequences of words labeled with a class, and its parallel sentence in a target language, we want to project the labels from the source into the target. As illustrated in Figure 1, T-Projection implements two main steps. First, a set of projection candidates in the target sentence are generated for each labeled sequence in the source sentence. Second, each projection candidate is ranked using a machine translation model. More specifically, candidates are scored based on the probability of being generated as a translation of the source labeled sequences. While the candidate generation step exploits the labeled spans and their categories in the source sentence as well as the zero-shot cross-lingual capabilities of large pretrained multilingual language models, the candidate selection step applies state-of-the-art MT technology to find those projection candidates that constitute the best translation for each source labeled span. As demonstrated by our empirical evaluation in Sections 5 and 6, we believe that these two techniques leverage both the available information and knowledge from the annotated text and language models thereby allowing us to obtain better annotation projections. These two steps are described in detail in the following two subsections.
3.1 Candidate Generation
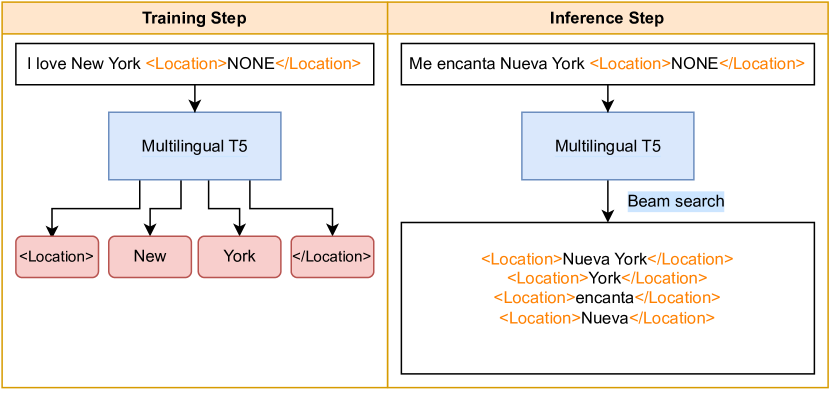
When trying to project labeled sequences from some source data into its parallel target dataset, we would expect both the source and the target to contain the same number of sequences labeled with the same category. For example, given the English source sentence "<Person>Obama</Person> went to <Location>New York</Location>" and its parallel Spanish unlabeled target sentence "Obama fue a Nueva York", we would expect to find the same two entities (person and location) in the target sentence. To solve the task of candidate generation, we finetune the text-to-text mT5 Xue et al. (2021) model using a HTML-tag-style prompt template Huang et al. (2022). As illustrated by Figure 2, the input consists of concatenating the unlabeled sentence followed by a list of tags ("<Category>None</Category>") with the category of each labeled span that we expect to find in the sentence. If two or more spans share the same category then we append the tag as many times as spans are expected with that category.
Unlike Huang et al. (2022), we do not encode the tags for each category as special tokens. Instead, we verbalize the categories (i.e PER->Person) and use the token representations already existing in the model. We expect that, thanks to the language modeling pretraining, T5 would have a good semantic representation of categories such as Person, Location, Claim, etc.
As Figure 2 illustrates, we finetune mT5 with the labeled source dataset. We train the model to replace the token None with the sequence of words in the input sentence that corresponds to that category. We use Cross-Entropy loss for training.
At inference, we label the target sentences which are parallel translations of the source sentences. As the source tells us how many labeled spans should we obtain in the target, we use the labels of the corresponding source sentence to build the prompts. In other words, our objective is to label parallel translations of the sentences we used for training. We take advantage of the zero-shot cross-lingual capabilities of mT5 to project the labels from the source to the target sentence. The output tokens are generated in an autoregressive manner. We use beam search decoding with 100 beams to generate 100 candidates for each input tag.
3.2 Candidate Selection
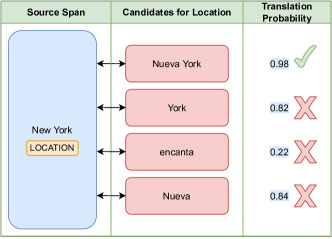
As depicted in Figure 3, all the generated candidates are grouped by category. In other words, if the previous step has generated multiple spans with the same category (i.e, two locations in a sentence) then all the candidates are included in a single set. Furthermore, all the candidates that are not a sub-sequence of the input sentence are filtered out.
For each labeled span in the source sentence, we rank all the projection candidates that share the same category as the source span using their translation probabilities (also known as translation equivalence) which have been obtained by applying the pretrained M2M100 Fan et al. (2021) or NLLB200 Costa-jussà et al. (2022) MT models and the NMTScore library222https://github.com/ZurichNLP/nmtscore Vamvas and Sennrich (2022). Thus, given the source span and the candidate the translation probability is computed as follows Vamvas and Sennrich (2022):
The translation probability is normalized:
As the translation probability varies depending on the direction of the translation, the scores are symmetrized by computing the scores of both translation directions and averaging them:
Finally, for each labeled span in the source sentence, we choose the candidate in the target with the highest translation probability. Once a candidate has been selected, that candidate, and any other that overlaps with it, is removed from the set of possible candidates. In this way we prevent assigning the same candidate in the target to two different spans in the source.
4 Experimental Setup
In order to evaluate our method we perform both intrinsic and extrinsic evaluations.

Intrinsic evaluation: We select a number of datasets that have been manually projected from English into different target languages. The manual annotations are used to evaluate and compare T-Projection with respect to previous state-of-the-art label projection models. Results are reported by computing the usual F1-score used for sequence labelling Tjong Kim Sang (2002) with the aim of evaluating the quality of the automatically generated projections with respect to the manual ones.
Extrinsic evaluation: In this evaluation we assess the capability of T-Projection to automatically generate training data for sequence labeling tasks, NER in this particular case. The process begins by utilizing the machine translation system NLLB200 Costa-jussà et al. (2022) to translate data from English into 8 low-resource African languages. We then project the labels from English onto the respective target languages. The automatically generated datasets are then employed to train NER models, which are evaluated using a relatively small manually annotated test set. The same procedure is performed with other state-of-the-art label projection models. The comparison of the results obtained is reported in terms of F1 score.
4.1 Datasets
The datasets used correspond to three sequence labeling tasks which are illustrated by Figure 4.
Opinion Target Extraction (OTE) Given a review, the task is to detect the linguistic expression used to refer to the reviewed entity. We use the English SemEval 2016 Aspect Based Sentiment Analysis (ABSA) datasets Pontiki et al. (2014). Additionally, for the evaluation we also used the parallel versions for Spanish, French and Russian generated via machine translation and manual projection of the labels García-Ferrero et al. (2022).
Named Entity Recognition (NER) The NER task consists of detecting named entities and classifying them according to some pre-defined categories. We use an English, Spanish, German, and Italian parallel NER dataset Agerri et al. (2018) based on Europarl data Koehn (2005). Manual annotation for the 4 languages was provided following the CoNLL 2003 Tjong Kim Sang (2002) guidelines. In the extrinsic evaluation, we use MasakhaNER 2.0 Adelani et al. (2022), a human-annotated NER dataset for 20 African languages. Argument Mining (AM) In the AbstRCT English dataset two types of argument components, Claims and Premises, are annotated on medical and scientific texts collected from the MEDLINE database Mayer et al. (2020). For evaluation we used its Spanish parallel counterpart which was generated following an adapted version of the method described above for OTE Yeginbergenova and Agerri (2023). In contrast to NER and OTE, the sequences in the AM task consist of very long spans of words, often encompassing full sentences. We use the Neoplasm split.
4.2 Baselines
We experiment with 4 different word alignment systems. Two statistical systems, Giza++ Och and Ney (2003) and FastAlign Dyer et al. (2013), widely used in the field. We also evaluate two Transformer-based systems, SimAlign Jalili Sabet et al. (2020) and AWESOME Dou and Neubig (2021), which leverage pre-trained multilingual language models to generate alignments. As the authors recommend, we use multilingual BERT (mBERT) Devlin et al. (2019) as the backbone. We tested different models as backbone with no improvement in performance (see Appendix C). We use these four systems to compute word alignments between the source and the target sentences and generate the label projections applying the algorithm published by García-Ferrero et al. (2022)333https://github.com/ikergarcia1996/Easy-Label-Projection.
We also experiment with EasyProject Chen et al. (2023), a system that jointly performs translation and projection by inserting special markers around the labeled spans in the source sentence. As this model generates its own translations it is therefore not suitable for the intrinsic evaluation which is why we only used it for the extrinsic evaluation.
We implemented two additional baselines for comparison. In the first baseline, inspired by Li et al. (2021), we use XLM-RoBERTa Conneau et al. (2020) 3 billion parameter model (same parameter count as the mT5 model that we use in T-Projection) with a token classification layer (linear layer) on top of each token representation. We train the model in the source labeled dataset and we predict the entities in the translated target sentences. The second baseline adopts a span translation approach inspired by Zhou et al. (2022). We translate the labeled spans in the source sentence using the pretrained M2M100 12 billion parameter model and we match them with the corresponding span in the target sentence. For example, given the labeled source sentence "I love <Location> New York </Location>." and the target sentence "Me encanta Nueva York", we translate the span New York into the target language, resulting in the translated span Nueva York which is then matched in the target sentence. We employ beam search to generate 100 possible translations, and we select the most probable one that matches the target sentence.
4.3 Models Setup
We use the 3 billion parameters pretrained mT5 Xue et al. (2021) for the candidate generation step while candidates are selected using the M2M100 12 billion parameter machine translation model Fan et al. (2021). In the case of MasakhaNER, since not all languages are included in M2M100, we resorted to NLLB200 Costa-jussà et al. (2022) 3 billion parameter model instead, which was also used by the EasyProject method Chen et al. (2023). Both MT models demonstrate comparable performance. For detailed hyperparameter settings, performance comparison of T-Projection using models of different sizes, and a comparison between T-Projection performance using M2M100 and NLLB200, please refer to the Appendix.
5 Intrinsic Evaluation
In this section we present a set of experiments to evaluate T-Projection with respect to current state-of-the-art approaches for annotation projection. We also analyze separately the performance of the candidate generation and candidate selection steps.
For the OTE task we train T-Projection and XLM-RoBERTa with the English ABSA 2016 training set. We also train the four word alignment systems (excluding SimAlign which is an unsupervised method) using the English training set together with the respective translations as parallel corpora. We augment the parallel data with 50,000 random parallel sentences from ParaCrawl v8 Esplà et al. (2019). Models are evaluated with respect to the manually label projections generated by García-Ferrero et al. (2022). As the Europarl-based NER dataset Agerri et al. (2018) provides only test data for each language, T-Projection and XLM-RoBERTa are trained using the full English CoNLL 2003 dataset Tjong Kim Sang (2002) together with the labeled English Europarl test data. The word alignment models are in turn trained with the the parallel sentences from the Europarl-based NER data plus 50,000 parallel sentences extracted from Europarl v8 Koehn (2005). We evaluate the model with respect to the manual annotations provided by Agerri et al. (2018). With respect to Argument Mining, we use the Neoplasm training set from the AbstRCT dataset to train T-Projection and XLM-RoBERTa, adding its Spanish translation as parallel corpora for the word alignment systems. As this is a medical text corpus, the parallel corpora is complemented with 50,000 parallel sentences from the WMT19 Biomedical Translation Task Bawden et al. (2019). We evaluate the models with respect to the manually projected labels by Yeginbergenova and Agerri (2023).
5.1 Annotation Projection Quality
OTE NER AM Avg ES FR RU ES DE IT ES Giza++ Och and Ney (2003) 77.0 73.3 72.4 73.3 75.3 68.4 86.6 77.7 FastAlign Dyer et al. (2013) 75.0 72.9 76.9 70.2 77.0 67.0 85.7 77.4 SimAlign Jalili Sabet et al. (2020) 86.7 86.3 87.7 85.4 87.4 81.3 84.1 85.3 AWESOME Dou and Neubig (2021) 91.5 91.1 93.7 87.3 90.7 83.1 54.8 78.0 XLM-RoBERTa-xl Conneau et al. (2020) 80.2 76.2 74.5 73.9 68.3 73.9 66.5 71.8 Span Translation 66.5 46.3 58.7 68.8 63.5 69.2 21.6 48.7 T-Projection 95.1 92.3 95.0 93.6 94.0 87.2 96.0 93.9
Table 1 reports the results of the automatically projected datasets generated by each projection method with respect to the human-projected versions of those datasets. The systems based on word alignments obtain good results across the board, especially those using language models, namely, SimAlign and AWESOME. In particular, AWESOME achieves good results for OTE and NER but very poor in AM. Manual inspection of the projections found out that AWESOME struggles to align articles and prepositions which are included in long sequences.
XLM-RoBERTa-xl shows a strong zero-shot cross-lingual performance. However, the generated datasets are of lower quality than the ones generated by the word-alignment systems. The results of the Span Translation approach are quite disappointing, especially when dealing with the long sequences of the AM task. Translating the labeled spans independently produce translations that, in many cases, cannot be located in the target sentence.
Our T-Projection method achieves the best results for every task and language. In OTE, it outperforms every other method by more than 2 points in F1 score averaged across the three languages. This suggests that T-Projection robustly projects labeled spans into machine-translated data. The NER evaluation is slightly different because the parallel data was translated by human experts. In this setting, T-Projection clearly improves AWESOME’s results by 4.7 points, which constitutes a significant leap in the quality of the generated datasets.
Despite the fact that the word alignment systems have been trained using Europarl domain-specific data, and that most of the training data used for T-Projection is coming from the CoNLL-2003 dataset (news domain) plus very few annotated sentences (699) from Europarl, T-Projection still clearly obtains the best results in NER label projection. This suggests that our system can also be applied in out-of-domain settings.
Finally, T-Projection obtains the overall highest scores for Argument Mining which means that our approach is particularly good projecting long sequences. Thus, T-Projection outperforms the second best model by 9.4 points in F1 score. In fact, the 96.0 F1 result obtained indicates that T-Projection is almost correctly projecting all the examples in the dataset.
If we look at the average over the three tasks and 5 languages, T-Projection improves by 8.6 points in F1 score the results of the second-best system, SimAlign. These results constitute a huge improvement over all the previous annotation projection approaches. To the best of our knowledge, these are by a wide margin the best annotation projection results published for sequence labeling.
5.2 The Role of the Candidates
OTE NER AM Avg ES FR RU ES DE IT ES T-Projection 95.1 92.3 95.0 93.6 94.0 87.2 96.0 93.9 Ngrams + Candidate Selection 89.7 86.1 93.8 83.8 79.3 73.3 73.5 80.7 \hdashline[3pt/6pt] mT5 + Most Probable Candidate 83.7 87.2 85.3 79.5 82.8 72.3 90.9 84.8 \hdashline[3pt/6pt] mT5 + Upper bound 98.6 97.0 97.9 98.0 98.5 94.0 99.3 98.0
We perform a set of experiments to measure the relevance and performance of the candidate generation and candidate selection tasks. First, we replace mT5 with an ngram-based candidate generation approach. We consider as candidate spans every possible ngram with size (i.e "Serves", "really", "good", "sushi", "Serves really"…). Table 2 shows that this approach results in lower performance compared with our technique using mT5. Ngrams are much noisier than the candidates generated by mT5, most of them are very similar to each other, and this makes selecting the right candidate a more challenging task. Thus, this experiment proves that our mT5 candidate generation approach is crucial to obtain good performance.
We also replace the candidate selection method with the most probable candidate. In other words, we only use the most probable beam generated by mT5 to label the target sentence. When using mT5 by itself, it obtains competitive results, close to those of the word alignment systems in Table 1. Still, the average performance drops by 9.2 points. This further confirms that both the candidate generation and selection steps are crucial for the T-Projection method.
In a final experiment we define an upperbound for candidate selection consisting of assuming that our model will always select the correct projection contained among the generated candidates. The upper bound achieves an average F1 score of 98. This result confirms with a very high probability that the correct candidate is almost always among the 100 candidates generated by mT5.
Language No. of Speakers Lang family Fine-tuneen AWESOME+EN EasyProject+EN T-Projection T-Projection+EN Hausa 63M Afro-Asiatic /Chadic 71.7 72.7 72.2 72.7 72.0 Igbo 27M NC / Volta-Niger 59.3 63.5 65.6 71.4 71.6 Chichewa 14M English-Creole 79.5 75.1 75.3 77.2 77.8 chiShona 12M NC / Bantu 35.2 69.5 55.9 74.9 74.3 Kiswahili 98M NC / Bantu 87.7 82.4 83.6 84.5 84.1 isiXhosa 9M NC / Bantu 24.0 61.7 71.1 72.3 71.7 Yoruba 42M NC / Volta-Niger 36.0 38.1 36.8 42.7 42.1 isiZulu 27M NC / Bantu 43.9 68.9 73.0 66.7 64.9 AVG 54.7 66.5 66.7 70.3 69.8
6 Extrinsic Evaluation
In this section we evaluate T-projection in a real-world low-resource scenario, namely, Named Entity Recognition in African Languages. We compare the results obtained by training on NER dataset automatically generated by T-Projection with respect to those automatically projected using two state-of-the-art label projection systems: AWESOME (The second-best NER system in Table 1) and EasyProject. We use the exactly same settings as Chen et al. (2023). For each target language in MasakhaNER2.0, we first translate the English CoNLL dataset using the NLLB-200 3 billion parameter model. Next, we project the English labels into the target language. It should be noted that EasyProject performs both of these processes in a single step. Subsequently, we train an mDebertaV3 He et al. (2021) model using the automatically generated datasets for each target language. Finally, this model is evaluated in the gold MasakhaNER2.0 test data. We only evaluate the 8 languages in MasakhaNER2.0 supported by mT5. We focus on named entities referring to Person, Location and Organization.
Table 3 presents the results of the evaluated models on the gold MasakhaNER2.0 test sets. For T-projection, we present the results of training with the automatically generated data for the target language only, and also by adding the original English CoNLL data concatenated with the automatically generated data for each target language. Regarding other systems, we only show the former results, as it was the only metric reported by previous work. In order to train and evaluate the NER models we apply the same hyperparameter settings and code as the authors of EasyProject.
The results show that T-projection achieves superior performance for seven out of the eight languages. Our model demonstrates a more pronounced performance difference in agglutinative languages such as Igbo and Shona. As outlined in Section 5, our model produces superior alignments compared to AWESOME. On the other side, we found that EasyProject, which utilizes markers for simultaneous translation and projection, introduces translation artifacts that hinder the performance of the downstream model. These artifacts are particularly noticeable in agglutinative languages, as EasyProject tends to separate words. For instance, in the case of Shona, consider the English sentence "[Germany]’s representative to the [European Union]’s veterinary committee [Werner Zwingmann]". Our system produces the Shona sentence "Mumiriri [weGermany] kukomiti yemhuka [yeEuropean Union] [Werner Zwingmann]", while EasyProject produces "Mumiriri we [Germany] ku [European Union] komiti yezvokurapa mhuka [Werner Zwingmann]". When training mDebertaV3 with T-projection generated data, which preserves the agglutinated words, we achieve better results compared to EasyProject that introduce artifacts by separating agglutinated words during translation and projection. Our system is only inferior in the Zulu language; however, on average, we improve the results by 3.6 F1 points. In contrast with previous work, our experiments revealed that concatenating English and translated data did not yield better results, potentially due to the superior quality of the data generated by T-Projection.
To the best of our knowledge, these are the best zero-shot results achieved for MasakhaNER2.0, underscoring the significant benefits of T-projection for NLP tasks in low-resource languages.
7 Concluding Remarks
In this paper we introduce T-Projection, a new annotation projection method that leverages large multilingual pretrained text-to-text language models and state-of-the-art machine translation systems. We conducted experiments on intrinsic and extrinsic tasks in 5 Indo-European languages and 8 African languages. T-projection clearly outperforms previous annotation projection approaches, obtaining a new state-of-the-art result for this task.
A comprehensive analysis shows that both the generation candidate and the candidate selection steps crucially contribute to the final performance of T-Projection. Future work includes adding more tasks and languages, especially those with different segmentation such as Japanese or Chinese. Unlike word alignment systems, T-Projection does not need to segment the words to do the projection which is why we think that our model can also be competitive to project annotations for many language pairs.
Limitations
We evaluate the performance of T-Projection to project labels in sequence labeling tasks from English into a set of 5 Indo-European languages and 8 African languages. It would be interesting to evaluate the performance for other language families, which we leave for future work. Our model requires training a 3B parameter mT5 model. While training a 3B model is computationally expensive and requires a GPU with at least 48GB of VRAM, automatically generating a dataset is a one-off endeavour which results in a dataset usable for many occasions and applications, and much cheaper than manual annotation. Furthermore, we believe that the huge gains obtained by T-Projection justify the computation requirements. In any case, we expect that, thanks to the rapid development of computer hardware, the cost of T-Projection will be reduced in the near future. From a software perspective, recent advancements like 4-bit / 8-bit quantization Dettmers et al. (2022b, a); Frantar et al. (2022) and Low Rank Adaptation Hu et al. (2022) have the potential to reduce the hardware requirements of T-Projection.
Acknowledgments
This work has been partially supported by the HiTZ center and the Basque Government (Research group funding IT-1805-22). We also acknowledge the funding from the following projects: (i) DeepKnowledge (PID2021-127777OB-C21) MCIN/AEI/10.13039/501100011033 and ERDF A way of making Europe; (ii) Disargue (TED2021-130810B-C21), MCIN/AEI/10.13039/501100011033 and European Union NextGenerationEU/PRTR (iii) Antidote (PCI2020-120717-2), MCIN/AEI/10.13039/501100011033 and by European Union NextGenerationEU/PRTR; (iv) DeepR3 (TED2021-130295B-C31) by MCIN/AEI/10.13039/501100011033 and EU NextGeneration programme EU/PRTR. Rodrigo Agerri currently holds the RYC-2017-23647 fellowship (MCIN/AEI/10.13039/501100011033 and by ESF Investing in your future). Iker García-Ferrero is supported by a doctoral grant from the Basque Government (PRE_2022_2_0208).
References
- Adelani et al. (2022) David Adelani, Graham Neubig, Sebastian Ruder, Shruti Rijhwani, Michael Beukman, Chester Palen-Michel, Constantine Lignos, Jesujoba Alabi, Shamsuddeen Muhammad, Peter Nabende, Cheikh M. Bamba Dione, Andiswa Bukula, Rooweither Mabuya, Bonaventure F. P. Dossou, Blessing Sibanda, Happy Buzaaba, Jonathan Mukiibi, Godson Kalipe, Derguene Mbaye, Amelia Taylor, Fatoumata Kabore, Chris Chinenye Emezue, Anuoluwapo Aremu, Perez Ogayo, Catherine Gitau, Edwin Munkoh-Buabeng, Victoire Memdjokam Koagne, Allahsera Auguste Tapo, Tebogo Macucwa, Vukosi Marivate, Mboning Tchiaze Elvis, Tajuddeen Gwadabe, Tosin Adewumi, Orevaoghene Ahia, Joyce Nakatumba-Nabende, Neo Lerato Mokono, Ignatius Ezeani, Chiamaka Chukwuneke, Mofetoluwa Oluwaseun Adeyemi, Gilles Quentin Hacheme, Idris Abdulmumin, Odunayo Ogundepo, Oreen Yousuf, Tatiana Moteu, and Dietrich Klakow. 2022. MasakhaNER 2.0: Africa-centric transfer learning for named entity recognition. In Proceedings of the 2022 Conference on Empirical Methods in Natural Language Processing, pages 4488–4508, Abu Dhabi, United Arab Emirates. Association for Computational Linguistics.
- Agerri et al. (2018) Rodrigo Agerri, Yiling Chung, Itziar Aldabe, Nora Aranberri, Gorka Labaka, and German Rigau. 2018. Building named entity recognition taggers via parallel corpora. In Proceedings of the Eleventh International Conference on Language Resources and Evaluation (LREC 2018), Miyazaki, Japan. European Language Resources Association (ELRA).
- Artetxe et al. (2023) Mikel Artetxe, Vedanuj Goswami, Shruti Bhosale, Angela Fan, and Luke Zettlemoyer. 2023. Revisiting machine translation for cross-lingual classification. CoRR, abs/2305.14240.
- Artetxe and Schwenk (2019) Mikel Artetxe and Holger Schwenk. 2019. Massively multilingual sentence embeddings for zero-shot cross-lingual transfer and beyond. Transactions of the Association for Computational Linguistics, 7:597–610.
- Bawden et al. (2019) Rachel Bawden, Kevin Bretonnel Cohen, Cristian Grozea, Antonio Jimeno Yepes, Madeleine Kittner, Martin Krallinger, Nancy Mah, Aurelie Neveol, Mariana Neves, Felipe Soares, Amy Siu, Karin Verspoor, and Maika Vicente Navarro. 2019. Findings of the WMT 2019 biomedical translation shared task: Evaluation for MEDLINE abstracts and biomedical terminologies. In Proceedings of the Fourth Conference on Machine Translation (Volume 3: Shared Task Papers, Day 2), pages 29–53, Florence, Italy. Association for Computational Linguistics.
- Chen et al. (2023) Yang Chen, Chao Jiang, Alan Ritter, and Wei Xu. 2023. Frustratingly easy label projection for cross-lingual transfer. In Findings of the Association for Computational Linguistics: ACL 2023, Toronto, Canada, July 9-14, 2023, pages 5775–5796. Association for Computational Linguistics.
- Conneau et al. (2020) Alexis Conneau, Kartikay Khandelwal, Naman Goyal, Vishrav Chaudhary, Guillaume Wenzek, Francisco Guzmán, Edouard Grave, Myle Ott, Luke Zettlemoyer, and Veselin Stoyanov. 2020. Unsupervised cross-lingual representation learning at scale. In Proceedings of the 58th Annual Meeting of the Association for Computational Linguistics, pages 8440–8451, Online. Association for Computational Linguistics.
- Costa-jussà et al. (2022) Marta R. Costa-jussà, James Cross, Onur Çelebi, Maha Elbayad, Kenneth Heafield, Kevin Heffernan, Elahe Kalbassi, Janice Lam, Daniel Licht, Jean Maillard, Anna Sun, Skyler Wang, Guillaume Wenzek, Al Youngblood, Bapi Akula, Loïc Barrault, Gabriel Mejia Gonzalez, Prangthip Hansanti, John Hoffman, Semarley Jarrett, Kaushik Ram Sadagopan, Dirk Rowe, Shannon Spruit, Chau Tran, Pierre Andrews, Necip Fazil Ayan, Shruti Bhosale, Sergey Edunov, Angela Fan, Cynthia Gao, Vedanuj Goswami, Francisco Guzmán, Philipp Koehn, Alexandre Mourachko, Christophe Ropers, Safiyyah Saleem, Holger Schwenk, and Jeff Wang. 2022. No language left behind: Scaling human-centered machine translation. CoRR, abs/2207.04672.
- Dettmers et al. (2022a) Tim Dettmers, Mike Lewis, Younes Belkada, and Luke Zettlemoyer. 2022a. Llm.int8(): 8-bit matrix multiplication for transformers at scale. CoRR, abs/2208.07339.
- Dettmers et al. (2022b) Tim Dettmers, Mike Lewis, Sam Shleifer, and Luke Zettlemoyer. 2022b. 8-bit optimizers via block-wise quantization. In The Tenth International Conference on Learning Representations, ICLR 2022, Virtual Event, April 25-29, 2022. OpenReview.net.
- Devlin et al. (2019) Jacob Devlin, Ming-Wei Chang, Kenton Lee, and Kristina Toutanova. 2019. BERT: Pre-training of deep bidirectional transformers for language understanding. In Proceedings of the 2019 Conference of the North American Chapter of the Association for Computational Linguistics: Human Language Technologies, Volume 1 (Long and Short Papers), pages 4171–4186, Minneapolis, Minnesota. Association for Computational Linguistics.
- Dou and Neubig (2021) Zi-Yi Dou and Graham Neubig. 2021. Word alignment by fine-tuning embeddings on parallel corpora. In Proceedings of the 16th Conference of the European Chapter of the Association for Computational Linguistics: Main Volume, pages 2112–2128, Online. Association for Computational Linguistics.
- Dyer et al. (2013) Chris Dyer, Victor Chahuneau, and Noah A. Smith. 2013. A simple, fast, and effective reparameterization of IBM model 2. In Proceedings of the 2013 Conference of the North American Chapter of the Association for Computational Linguistics: Human Language Technologies, pages 644–648, Atlanta, Georgia. Association for Computational Linguistics.
- Ehrmann et al. (2011) Maud Ehrmann, Marco Turchi, and Ralf Steinberger. 2011. Building a multilingual named entity-annotated corpus using annotation projection. In Proceedings of the International Conference Recent Advances in Natural Language Processing 2011, pages 118–124, Hissar, Bulgaria. Association for Computational Linguistics.
- Esplà et al. (2019) Miquel Esplà, Mikel Forcada, Gema Ramírez-Sánchez, and Hieu Hoang. 2019. ParaCrawl: Web-scale parallel corpora for the languages of the EU. In Proceedings of Machine Translation Summit XVII: Translator, Project and User Tracks, pages 118–119, Dublin, Ireland. European Association for Machine Translation.
- Fan et al. (2021) Angela Fan, Shruti Bhosale, Holger Schwenk, Zhiyi Ma, Ahmed El-Kishky, Siddharth Goyal, Mandeep Baines, Onur Celebi, Guillaume Wenzek, Vishrav Chaudhary, Naman Goyal, Tom Birch, Vitaliy Liptchinsky, Sergey Edunov, Michael Auli, and Armand Joulin. 2021. Beyond english-centric multilingual machine translation. J. Mach. Learn. Res., 22:107:1–107:48.
- Fei et al. (2020) Hao Fei, Meishan Zhang, and Donghong Ji. 2020. Cross-lingual semantic role labeling with high-quality translated training corpus. In Proceedings of the 58th Annual Meeting of the Association for Computational Linguistics, pages 7014–7026, Online. Association for Computational Linguistics.
- Frantar et al. (2022) Elias Frantar, Saleh Ashkboos, Torsten Hoefler, and Dan Alistarh. 2022. GPTQ: accurate post-training quantization for generative pre-trained transformers. CoRR, abs/2210.17323.
- García-Ferrero et al. (2022) Iker García-Ferrero, Rodrigo Agerri, and German Rigau. 2022. Model and data transfer for cross-lingual sequence labelling in zero-resource settings. In Findings of the Association for Computational Linguistics: EMNLP 2022, pages 6403––6416, Abu Dhabi, United Arab Emirates. Association for Computational Linguistics.
- He et al. (2021) Pengcheng He, Xiaodong Liu, Jianfeng Gao, and Weizhu Chen. 2021. Deberta: decoding-enhanced bert with disentangled attention. In 9th International Conference on Learning Representations, ICLR 2021, Virtual Event, Austria, May 3-7, 2021. OpenReview.net.
- Hu et al. (2022) Edward J. Hu, Yelong Shen, Phillip Wallis, Zeyuan Allen-Zhu, Yuanzhi Li, Shean Wang, Lu Wang, and Weizhu Chen. 2022. Lora: Low-rank adaptation of large language models. In The Tenth International Conference on Learning Representations, ICLR 2022, Virtual Event, April 25-29, 2022. OpenReview.net.
- Hu et al. (2020) Junjie Hu, Sebastian Ruder, Aditya Siddhant, Graham Neubig, Orhan Firat, and Melvin Johnson. 2020. XTREME: A massively multilingual multi-task benchmark for evaluating cross-lingual generalisation. In Proceedings of the 37th International Conference on Machine Learning, ICML 2020, 13-18 July 2020, Virtual Event, volume 119 of Proceedings of Machine Learning Research, pages 4411–4421. PMLR.
- Huang et al. (2022) Kuan-Hao Huang, I-Hung Hsu, Prem Natarajan, Kai-Wei Chang, and Nanyun Peng. 2022. Multilingual generative language models for zero-shot cross-lingual event argument extraction. In Proceedings of the 60th Annual Meeting of the Association for Computational Linguistics (Volume 1: Long Papers), pages 4633–4646, Dublin, Ireland. Association for Computational Linguistics.
- Jain et al. (2019) Alankar Jain, Bhargavi Paranjape, and Zachary C. Lipton. 2019. Entity projection via machine translation for cross-lingual NER. In Proceedings of the 2019 Conference on Empirical Methods in Natural Language Processing and the 9th International Joint Conference on Natural Language Processing (EMNLP-IJCNLP), pages 1083–1092, Hong Kong, China. Association for Computational Linguistics.
- Jalili Sabet et al. (2020) Masoud Jalili Sabet, Philipp Dufter, François Yvon, and Hinrich Schütze. 2020. SimAlign: High quality word alignments without parallel training data using static and contextualized embeddings. In Findings of the Association for Computational Linguistics: EMNLP 2020, pages 1627–1643, Online. Association for Computational Linguistics.
- Joshi et al. (2020) Pratik Joshi, Sebastin Santy, Amar Budhiraja, Kalika Bali, and Monojit Choudhury. 2020. The state and fate of linguistic diversity and inclusion in the NLP world. In Proceedings of the 58th Annual Meeting of the Association for Computational Linguistics, pages 6282–6293, Online. Association for Computational Linguistics.
- Koehn (2005) Philipp Koehn. 2005. Europarl: A parallel corpus for statistical machine translation. In Proceedings of Machine Translation Summit X: Papers, pages 79–86, Phuket, Thailand.
- Li et al. (2021) Bing Li, Yujie He, and Wenjin Xu. 2021. Cross-lingual named entity recognition using parallel corpus: A new approach using xlm-roberta alignment. ArXiv preprint, abs/2101.11112.
- Liu et al. (2021) Zihan Liu, Yan Xu, Tiezheng Yu, Wenliang Dai, Ziwei Ji, Samuel Cahyawijaya, Andrea Madotto, and Pascale Fung. 2021. Crossner: Evaluating cross-domain named entity recognition. In Thirty-Fifth AAAI Conference on Artificial Intelligence, AAAI 2021, Thirty-Third Conference on Innovative Applications of Artificial Intelligence, IAAI 2021, The Eleventh Symposium on Educational Advances in Artificial Intelligence, EAAI 2021, Virtual Event, February 2-9, 2021, pages 13452–13460. AAAI Press.
- Mayer et al. (2020) Tobias Mayer, Elena Cabrio, and Serena Villata. 2020. Transformer-based argument mining for healthcare applications. In ECAI 2020 - 24th European Conference on Artificial Intelligence, 29 August-8 September 2020, Santiago de Compostela, Spain, August 29 - September 8, 2020 - Including 10th Conference on Prestigious Applications of Artificial Intelligence (PAIS 2020), volume 325 of Frontiers in Artificial Intelligence and Applications, pages 2108–2115. IOS Press.
- Ni et al. (2017) Jian Ni, Georgiana Dinu, and Radu Florian. 2017. Weakly supervised cross-lingual named entity recognition via effective annotation and representation projection. In Proceedings of the 55th Annual Meeting of the Association for Computational Linguistics (Volume 1: Long Papers), pages 1470–1480, Vancouver, Canada. Association for Computational Linguistics.
- Och and Ney (2003) Franz Josef Och and Hermann Ney. 2003. A systematic comparison of various statistical alignment models. Computational Linguistics, 29(1):19–51.
- Pontiki et al. (2014) Maria Pontiki, Dimitris Galanis, John Pavlopoulos, Harris Papageorgiou, Ion Androutsopoulos, and Suresh Manandhar. 2014. SemEval-2014 task 4: Aspect based sentiment analysis. In Proceedings of the 8th International Workshop on Semantic Evaluation (SemEval 2014), pages 27–35, Dublin, Ireland. Association for Computational Linguistics.
- Shazeer and Stern (2018) Noam Shazeer and Mitchell Stern. 2018. Adafactor: Adaptive learning rates with sublinear memory cost. In Proceedings of the 35th International Conference on Machine Learning, ICML 2018, Stockholmsmässan, Stockholm, Sweden, July 10-15, 2018, volume 80 of Proceedings of Machine Learning Research, pages 4603–4611. PMLR.
- Thompson and Post (2020) Brian Thompson and Matt Post. 2020. Automatic machine translation evaluation in many languages via zero-shot paraphrasing. In Proceedings of the 2020 Conference on Empirical Methods in Natural Language Processing (EMNLP), pages 90–121, Online. Association for Computational Linguistics.
- Tjong Kim Sang (2002) Erik F. Tjong Kim Sang. 2002. Introduction to the CoNLL-2002 shared task: Language-independent named entity recognition. In COLING-02: The 6th Conference on Natural Language Learning 2002 (CoNLL-2002).
- Vamvas and Sennrich (2022) Jannis Vamvas and Rico Sennrich. 2022. NMTScore: A multilingual analysis of translation-based text similarity measures. In Findings of the Association for Computational Linguistics: EMNLP 2022, pages 198–213, Abu Dhabi, United Arab Emirates. Association for Computational Linguistics.
- Wang and Manning (2014) Mengqiu Wang and Christopher D. Manning. 2014. Cross-lingual projected expectation regularization for weakly supervised learning. Transactions of the Association for Computational Linguistics, 2:55–66.
- Wolf et al. (2019) Thomas Wolf, Lysandre Debut, Victor Sanh, Julien Chaumond, Clement Delangue, Anthony Moi, Pierric Cistac, Tim Rault, Rémi Louf, Morgan Funtowicz, and Jamie Brew. 2019. Huggingface’s transformers: State-of-the-art natural language processing. ArXiv preprint, abs/1910.03771.
- Xie et al. (2018) Jiateng Xie, Zhilin Yang, Graham Neubig, Noah A. Smith, and Jaime Carbonell. 2018. Neural cross-lingual named entity recognition with minimal resources. In Proceedings of the 2018 Conference on Empirical Methods in Natural Language Processing, pages 369–379, Brussels, Belgium. Association for Computational Linguistics.
- Xue et al. (2021) Linting Xue, Noah Constant, Adam Roberts, Mihir Kale, Rami Al-Rfou, Aditya Siddhant, Aditya Barua, and Colin Raffel. 2021. mT5: A massively multilingual pre-trained text-to-text transformer. In Proceedings of the 2021 Conference of the North American Chapter of the Association for Computational Linguistics: Human Language Technologies, pages 483–498, Online. Association for Computational Linguistics.
- Yarowsky et al. (2001) David Yarowsky, Grace Ngai, and Richard Wicentowski. 2001. Inducing multilingual text analysis tools via robust projection across aligned corpora. In Proceedings of the First International Conference on Human Language Technology Research.
- Yeginbergenova and Agerri (2023) Anar Yeginbergenova and Rodrigo Agerri. 2023. Cross-lingual argument mining in the medical domain. CoRR, abs/2301.10527.
- Zhang et al. (2022) Susan Zhang, Stephen Roller, Naman Goyal, Mikel Artetxe, Moya Chen, Shuohui Chen, Christopher Dewan, Mona T. Diab, Xian Li, Xi Victoria Lin, Todor Mihaylov, Myle Ott, Sam Shleifer, Kurt Shuster, Daniel Simig, Punit Singh Koura, Anjali Sridhar, Tianlu Wang, and Luke Zettlemoyer. 2022. OPT: open pre-trained transformer language models. CoRR, abs/2205.01068.
- Zhou et al. (2022) Ran Zhou, Xin Li, Lidong Bing, Erik Cambria, Luo Si, and Chunyan Miao. 2022. Conner: Consistency training for cross-lingual named entity recognition. In Proceedings of the 2022 Conference on Empirical Methods in Natural Language Processing, EMNLP 2022, Abu Dhabi, United Arab Emirates, December 7-11, 2022, pages 8438–8449. Association for Computational Linguistics.
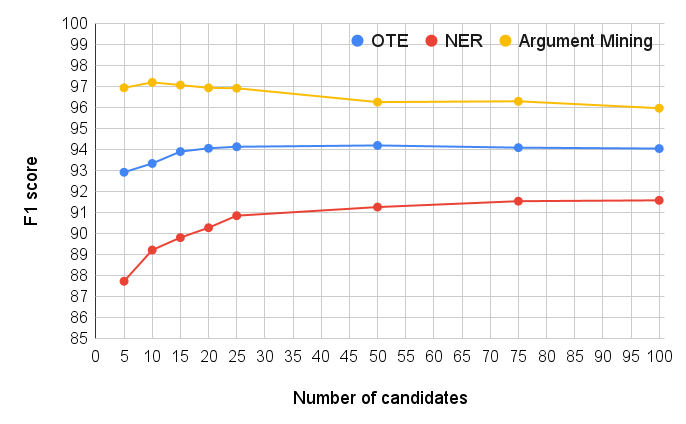
Appendix A How many candidates do we need?
Generating candidates is expensive. The number of flops and memory usage increases linearly with the number of beams computed. Generating 20 candidates is twice as expensive as generating 10 candidates. We also need to add the extra workload of computing the similarity between more candidates. Figure 5 shows the average F1 score for each task when generating a different number of candidates. For OTE and NER small improvements are obtained when generating more than 25 candidates. However, in Argument Mining using a large number of candidates hurts T-Projection’s performance, which performs optimally with just 10 candidates. While the results reported have been obtained generating 100 candidates, which is computationally very expensive, this analysis shows that we can use a much lower number of candidates and still achieve similar or even better results.
Appendix B Model size vs Performance
Model #Params OTE NER AM Average MT Size m2m100 418M 92.3 91.7 95.5 93.1 m2m100 1.2B 94.0 92.0 95.8 93.9 m2m100 12B 94.1 91.6 96.0 93.9 mT5 size mT5-small 60M 36.4 66.3 00.0 34.2 mT5-base 220M 72.8 86.2 33.6 64.2 mT5-large 738M 90.9 90.1 65.3 82.1 mT5-xl 3B 94.1 91.6 96.0 93.9
We analyze the performance of T-Projection when using an mT5 model and a translation system with different number of parameters. Table 4 shows the average F1 performance across all the tasks and languages. First, we experiment with M2M100 models of different sizes. The results show that the size of the translation model does not have a significant impact on the performance of T-Projection.
However, the size of the mT5 model used does have a big impact on the final performance of the system. Although for OTE and NER switching from a 3B to a 738M parameter mT5 model produces competitive results, this is not the case when applied to AM. The overall trend is that when decreasing the number of parameters results keep decreasing. Summarizing, in order to achieve competitive performance for every task T-Projection requires a mT5 model with 3B parameters, although a 738M parameter model is still competitive for OTE and NER.
OTE NER AM Average System Data Augmentation Backbone ES FR RU ES DE IT ES Giza++ Och and Ney (2003) 0 mBERT 76.2 73.8 78.2 71.4 66.6 65.7 86.4 76.8 FastAlign Dyer et al. (2013) 0 mBERT 72.3 70.4 74.6 60.3 64.0 57.5 84.0 72.4 SimAlign Jalili Sabet et al. (2020) - mBERT 86.7 86.3 87.7 85.4 87.4 81.3 84.1 85.3 AWESOME Dou and Neubig (2021) 0 mBERT 88.9 89.8 91.2 86.1 89.4 83.0 57.1 77.8 Giza++ Och and Ney (2003) 50000 mBERT 77.0 73.3 72.4 73.3 75.3 68.4 86.6 77.7 FastAlign Dyer et al. (2013) 50000 mBERT 75.0 72.9 76.9 70.2 77.0 67.0 85.7 77.4 AWESOME Dou and Neubig (2021) 50000 mBERT 91.5 91.1 93.7 87.3 90.7 83.1 54.8 78.0 SimAlign Jalili Sabet et al. (2020) - XLM-RoBERTa-xl 86.2 86.1 89.5 85.8 88.4 81.2 76.9 83.1 AWESOME Dou and Neubig (2021) 50000 XLM-RoBERTa-large 86.1 86.1 87.4 87.2 87.5 83.1 54.8 75.8 T-Projection - - 95.1 92.3 95.0 93.6 94.0 87.2 96.0 93.9
Appendix C Tunning the Word Alignment Systems
To validate our results and further demonstrate the performance of T-Projection, we conduct a set of experiments that evaluate the performance of word-alignment systems under different settings. We first compare the annotation projection performance when using and not using 50,000 parallel sentences as data augmentation for training the word aligners. Note that in Section 5 all the results we show correspond to using 50,000 extra parallel sentences for training the word-alignment systems. As Table 5 shows, using the augmented dataset achieves the best performance. SimAlign Dou and Neubig (2021) and AWESOME Dou and Neubig (2021) recommend using their systems with multilingual-bert-cased Devlin et al. (2019) as backbone. However, we also test XLM-RoBERTa-xl Conneau et al. (2020) 3 billion parameter model with SimAlign and XLM-RoBERTa-large (355M parameters) model with AWESOME (The released AWESOME code at the time of writing this paper doesn’t support XLM-RoBERTa-xl). Using XLM-RoBERTa produce worse results than using mBERT. These experiments show that we are using the word-alignment systems in their best-performing settings.
Appendix D MT models vs Laser
OTE NER AM Average Candidate Scorer ES FR RU ES DE IT ES Prism-745M 91.4 86.8 94.3 93.8 93.4 85.4 96.3 92.7 M2M100-12B 95.1 92.3 95.0 93.6 94.0 87.2 96.0 93.9 NLLB200-3B 96.6 90.5 95.6 91.0 94.3 87.7 93.9 93.0 \hdashline[3pt/6pt] LASER 2.0 89.0 80.6 91.3 91.2 91.6 86.5 70.4 82.4
We conducted experiments using M2M100-12B Fan et al. (2021), NLLB200-3B Costa-jussà et al. (2022) and prism Thompson and Post (2020) as model for computing translation probabilities. We also experiment with using LASER 2.0 Artetxe and Schwenk (2019) sentence representations instead of the translation probabilities of NMTscore. We encode the source span as well as all the projection candidates using LASER encoder. We then rank them using cosine similarity. Table 6 shows the results. LASER2.0 is competitive when dealing with the short labeled sequences in the OTE and NER task. But the performance decreases when dealing with large sequences in the AM task. M2M100, NLLB200, and Prism exhibit comparable performance, with some of them achieving the best results in specific languages, but overall, their average performance is very similar.
Appendix E Training details
We train the HuggingFace’s Wolf et al. (2019) implementation of mT5 444https://huggingface.co/google/mt5-xl (3 billion parameter model) in the candidate generation step using the following hyper-parameters: Batch size of 8, 0.0001 learning rate, 256 tokens sequence length, cosine scheduler with 500 warn up steps and no weight decay. We use AdaFactor Shazeer and Stern (2018) optimizer. We train the model for 10 epochs in the OTE task, and 4 epochs for the NER and AM tasks. In the candidate selection step, we also use HuggingFace’s implementation of M2M100, and we use m2m100-12B-last-ckpt 555https://huggingface.co/facebook/m2m100-12B-last-ckpt checkpoint of M2M100 released by the authors. We use the direct-translation function of the NMTscore library to compute the translation probabilities. For MasakhaNER2.0 we use the training script and evaluation script developed by the authors 666https://github.com/masakhane-io/masakhane-ner/blob/main/MasakhaNER2.0/scripts/mdeberta.sh and the same hyper-parameter setup than Chen et al. (2023).
Appendix F Dataset details
We list the size (number of sentences) of the dataset we use in Table 7. Note that all the datasets we use are parallel in all the languages, and the number of sentences is the same for all the languages.
Task Split Sentence No ABSA ABSA Pontiki et al. (2014) Train 2000 ABSA Pontiki et al. (2014) Test 676 NER Europarl Agerri et al. (2018) Test 799 CoNLL03 Tjong Kim Sang (2002) Train 14987 CoNLL03 Tjong Kim Sang (2002) Dev 3466 CoNLL03 Tjong Kim Sang (2002) Test 3684 \hdashline[3pt/6pt] MasakhaNER2.0 Adelani et al. (2022) Test (hau) 1632 MasakhaNER2.0 Adelani et al. (2022) Test (ibo) 2180 MasakhaNER2.0 Adelani et al. (2022) Test (sna) 1772 MasakhaNER2.0 Adelani et al. (2022) Test (swa) 1882 MasakhaNER2.0 Adelani et al. (2022) Test (xho) 1632 MasakhaNER2.0 Adelani et al. (2022) Test (yor) 1963 MasakhaNER2.0 Adelani et al. (2022) Test (nya) 1784 MasakhaNER2.0 Adelani et al. (2022) Test (zul) 1669 AM AbsRCT Neoplasm Mayer et al. (2020) Train 4404 AbsRCT Neoplasm Mayer et al. (2020) Dev 679 AbsRCT Neoplasm Mayer et al. (2020) Test 1251
For OTE, we use the SemEval-2016 Task 5 Aspect Based Sentiment Analysis (ABSA) dataset Pontiki et al. (2014). We train T-Projection with the concatenation of the English train and test splits. We evaluate all the systems by projecting the training split. For NER we use the English, Spanish, German, Italian europarl parallel dataset from Agerri et al. (2018). We train T-Projection with the concatenation of the English europarl dataset with the train, dev and test splits of the English CoNLL 2003 dataset Tjong Kim Sang (2002). We evaluate the systems by projecting the English NER europarl test splits. For Argument Mining, we use the AbstRCT Neoplasm English dataset Mayer et al. (2020) and the Spanish AbsRCT corpus generated by machine translating the English AbstRCT corpus with DeepL and manually projecting the labels. We train T-Projection of the concatenation of the English Neoplasm train, dev and test split. We evaluate the systems by projecting the English Neoplasm train split.
Appendix G Hardware used
We perform all our experiments using a single NVIDIA A100 GPU with 80GB memory. The machine used has two AMD EPYC 7513 32-Core Processors and 512GB of RAM.