Collective mechano-response dynamically tunes cell-size distributions in growing bacterial colonies
Abstract
Abstract
Mechanical stresses stemming from environmental factors are a key determinant of cellular behavior and physiology. Yet, the role of self-induced biomechanical stresses in growing bacterial colonies has remained largely unexplored. Here, we demonstrate how collective mechanical forcing plays an important role in the dynamics of the cell size of growing bacteria. We observe that the measured elongation rate of well-nourished Escherichia coli cells decreases over time, depending on the free area around each individual, and associate this behavior with the response of the growing cells to mechanical stresses. Via a cell-resolved model accounting for the feedback of collective forces on individual cell growth, we quantify the effect of this mechano-response on the structure and composition of growing bacterial colonies, including the local environment of each cell. Finally, we predict that a mechano-cross-response between competing bacterial strains with distinct growth rates affects their size distributions.
Introduction
Mechanical environment is a key determinant of behavior, physiology and functions in diverse cellular systems including microorganisms and their interactions with their host cells dufrene2020mechanomicrobiology ; harper2020cell . In bacterial systems, environments impose external mechanical constraints via viscous, elastic or surface forces, with far-reaching ramifications on their survival, fitness and resistance to biochemical agents, including antibiotics persat2015mechanical ; genova2019mechanical . A growing bacterial colony allen2018bacterialreview presents a complex biophysical setting where an interplay of extensile (due to growth) and adhesive (cell-cell and cell-substrate) interactions engender active biomechanical constraints, which evolve as the colony expands you2018geometry ; you2019monotomultilayer . Recently, it has been shown that such mechanical constraints give rise to active self-induced stresses within bacterial and yeast colonies, the magnitude of which depends on the local position within the colony chu2018self ; alric2022macromolecular . Beyond a certain threshold, the response to these stresses can drive shifts in the phenotypic traits of the individual cells and trigger critical structural changes in a colony, thereby initiating biofilm formation chu2018self ; sengupta2020microbial ; dhar2022escape2d_time .
At the level of a single cell, external mechanical influences on bacterial growth, including fluid flows and confinements, have been extensively investigated tuson2012measuring ; persat2015mechanical ; cesar2017fems . Moreover, different models for the growth kinetics of individual bacteria amir2014cell ; campos2014constant ; taheri2015cell ; si2019mechanistic ; delgado2022influence describe cell division events as regulated toward achieving cell-size homeostasis. However, owing to the small number of cells involved in these studies, dynamical effects arising from temporal and spatial biomechanical constraints, are not fully included. Despite the crucial influence that self-induced mechanical forces seem to have on microbial behavior and physiology, currently, we lack a cell-based mechanistic model that could capture the collective interrelations and feedback between cells that spontaneously evolve at the scale of the colony.
Motivated by the gaps in our current understanding, here we report on the phenomena arising from self-induced collective mechanical stresses between the cells in expanding bacterial colonies. While mechanical interactions have already been identified as a key ingredient to determine the structure and shape of a colony farrell2013mechanically ; farrell2017mechanicalinteractionsmutants ; schnyder2020control ; langeslay2022 , we also describe a mechano-response of bacterial cells that tunes the emerging distribution of cell sizes (or lengths) puliafito2012collective during the evolution of the growing colony. This mechano-response represents a cell’s ability to sense local surroundings, stimuli as well as the presence of other cells cox2018bacterialmechanosensors ; gordon2019bacterialmechanosensing and, based on this information, adapt the growth behavior to avoid overcrowding or trigger cell death podewitz2015tissue ; podewitz2016interface . A biochemical origin could lie in the inhibited signaling under mechanical stresses mishra2017protein ; van2019mechanical . To mimic these effects we devise an analytically accessible model founded on statistical mechanics. Inspired by the success of modeling various driven systems by means of rod-like particles vicsek2012collective ; baer2020SPRreview ; kraikivski2006enhanced ; narayan2007GNFgranularnematic ; diaz2020domain ; kumar2019trapping ; kozhukhov2022mesoscopic , we describe the bacteria as rigid rods of variable length allen2018bacterialreview ; you2018geometry ; you2019monotomultilayer . Our model both explains the collective self-regulation of phenotypic bacterial traits over time dhar2022escape2d_time and unveils that collective mechanical interactions also enable bacterial populations to dynamically tune the size (or length) of single cells.
To investigate the implications of collective stresses in a controlled setting, we perform our growth experiments on a nutrient-rich agarose substrate and put forward a microscopic first-principles model derived from dynamical density functional theory (DDFT) marconi1999DDFT ; archer2004DDFT ; tevrugt2020revDDFT , which explains the central experimental observations. Its basic ingredients are the division of a bacterium with length into two shorter agents of length-at-birth , growth with a certain elongation rate, fluctuations of the elongation rate and a mechano-response to collective interactions. The cell-length-dependent density chauviere2012DDFT_Tumor ; al2018DDFT_Tumor in our DDFT describes the phenotemporal properties of the growing colony, i.e., the cells’ length-distribution dynamics. This allows us to gain analytic insight into the growth process, predicting the evolution towards a unique distribution of cell lengths, which reflects the stochastic nature of biological systems. A numerical evaluation further sheds light on how the length distribution depends on the spatial position. On top, we introduce a refined cell-based simulation tool, which reveals the detailed spatiotemporal aspects of the mechano-response to the local colony structure. Our qualitative findings are robust with respect to implementing different mechanisms for growth or cell division amir2014cell ; delgado2022influence ; campos2014constant ; taheri2015cell ; si2019mechanistic . Therefore, our techniques can be applied to a broad class of biological systems, providing a comprehensive understanding of collective biomechanical forces during population growth, as we exemplify by investigating a mechano-cross-response between two competing bacterial strains.
Results
Overview.
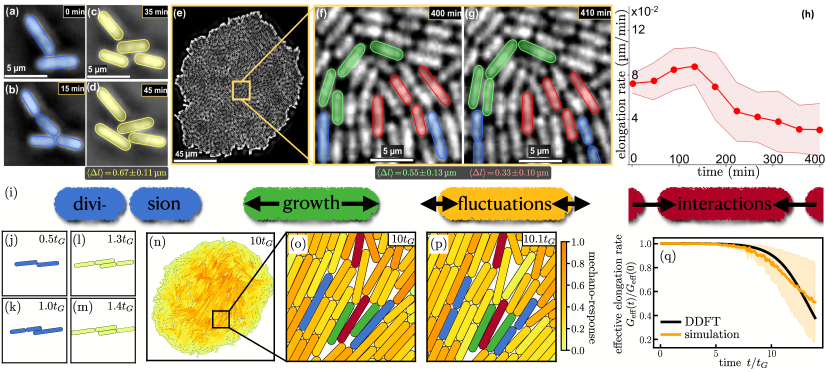
As compiled in Fig. 1, our model is designed to capture the fundamental aspects of bacterial growth (see the Methods section and Supplementary Notes 1 and 2 for more details). In our experiments, shown in Fig. 1a-h, we observe the growth of Escherichia coli at 30∘ C, on a nutrient-rich agarose substrate. A single cell first divides into two cells of equal length which then continue to grow with a certain elongation rate. At later times, as the colony becomes denser, growth and cell division progress with reduced elongation rate. This effect is significantly more pronounced for closely packed cells whose ends are in direct contact with their neighbors than for the loosely packed cells flanked by void regions of the colony. Overall, we observe that the average cell elongation rate is nearly halved in the grown colony, although a sufficient amount of nutrients is still available.
As demonstrated by means of cell-resolved Langevin simulations in two dimensions, shown in Fig. 1j-q, the central experimental observations are modeled by accounting for four central ingredients in the dynamics of the bacterial length (Fig. 1i): cell division into two new individuals with length-at-birth when the maximal length is reached, growth with (average) elongation rate , fluctuations of this elongation rate with magnitude and collective mechanical interactions generated by the same potential as the forces and torques in configurational space (see the Methods section and Supplementary Note 1 for a precise definition). Since these interactions have a weakening effect on the bacterial elongation rate, we speak of a mechano-response with strength quantified by the parameter .
Size-averaged analytical predictions.
As the main prediction of our model, we observe in Fig. 1q an effective reduction of the bacterial elongation rate over time, confirming the experimental trend in Fig. 1h. This is due to collective interactions (), which slow down the growth until the colony eventually attains a stationary state when all available space is occupied. In a first approximation, the behavior under such a mechano-response can be described by deriving a logistic growth equation for the total number density of all cells from our general DDFT model (see the Methods section and Supplementary Note 3).
Specifying the initial value , we find the analytic result
| (1) |
with . Hence, due to the mechano-response, the colony does not grow indefinitely but approaches the maximal density for . Defining the effective elongation rate as
| (2) |
and inserting from Eq. (1), allows us to predict analytically the behavior shown in Fig. 1q from DDFT, where decays to zero for . The first two terms in Eq. (2) are contributions of individual cells, while the third term emerges due to collective interactions. Cell division merely contributes to by increasing the total cell count.
Size-resolved DDFT.
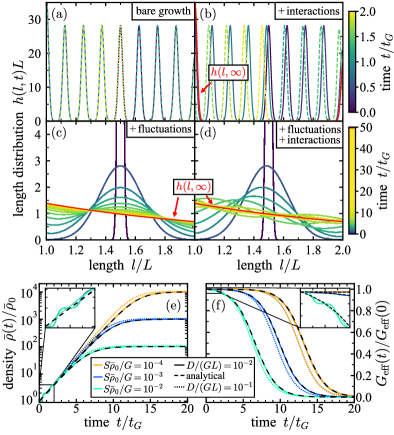
While Eqs. (1) and (2) illustrate the basic concept of a mechano-response, our phenotemporal DDFT, also resolving the cell size, provides deeper insight into the growth process. Thus, we now describe the growth dynamics of the bacterial colony by its density explicitly depending on the size of the bacteria, represented here by a length (see the Methods section and Supplementary Note 2). To make analytic progress, we restrict to the interval and, for the moment, we model cell division by the oblique boundary condition . We are particularly interested in the length distribution with , which follows from normalizing the density by the total length-averaged density . Our DDFT results compiled in Fig. 2 reveal nontrivial length-distribution dynamics, where the initial condition is chosen as a sharp peak to represent a single bacterium of length . The analytic solutions are discussed in Supplementary Note 4 and illustrated in Supplementary Figure 1.
In the absence of both fluctuations () and interactions (), we observe bare growth, cf. Fig. 2a, where is periodic in time as the horizontal offset increases linearly from to within one period , which sets the time unit. After each generation, denoted by an integer such that , the distribution resorts to its initial form and the total density has doubled.
With interactions ( but ), we observe a decelerated growth, cf. Fig. 2b, where the period of increases from generation to generation, as the effective elongation rate in Eq. (2) decreases over time. When the density reaches its stationary value in the course of the birth of a new generation, the length distribution is suddenly arrested. In short, the growth process comes to an end following a mechano-response to collective interactions.
With fluctuations ( but ), we observe disperse growth, cf. Fig. 2c, where the distribution smears out and approaches the unique limit , without inhibiting the indefinite exponential growth of . In short, the stochastic nature of bacterial growth results in a self-regulation of the cell length dhar2022escape2d_time .
For extreme fluctuations ( and ), this model predicts a fluctuation-driven growth with (see Supplementary Note 4 E).
Combining the behavior from the above special cases, the full dynamics including both fluctuations () and interactions () can be understood as disperse decelerated growth, cf. Fig. 2d, where the distribution simultaneously broadens and increases its period in the course of time. Hence, we observe in Fig. 2e that the total density increases jerkily due to correlated division bursts in the young colony. Later, the mechano-response sets an asymptotic threshold and the prediction from Eq. (1) is recovered after the cells have self-regulated their growth behavior, approaching due to fluctuations (other possible stationary solutions are unstable, as illustrated in Supplementary Figure 2). Another consequence of an initially sharp length distribution is an effective elongation rate which depends on the instantaneous form of (see Supplementary Note 4 D). As shown in Fig. 2f, the average effective elongation rate , defined in Eq. (2), decays earlier for both increasing mechano-response (stronger counter-force) and increasing fluctuations (faster growth). Moreover, shows a jerky behavior for weak fluctuations, just like the total density. Comparing these observations to the approximate size-averaged predictions in Eqs. (1) and (2), also shown as a reference in Fig. 2e,f for , underlines the dynamical information hidden in the length distribution.
DDFT with position dependence.
While homogeneous systems of growing bacteria, as described with , can also be realized in experiments shimaya2022tilt , we now investigate the basic local aspects of size-resolved colony growth using our DDFT in one spatial dimension (see the Methods section and Supplementary Note 1). Here, the density also depends on the position in a one-dimensional channel, resembling, e.g., cells growing in a mother machine wang2010robust ; yang2018analysis . To implement cell division, we employ a directed boundary condition, which consists of source and sink terms, representing the two daughter cells and the dividing mother cell, respectively, and prohibits flow from short to long across the boundary (see the Methods section and Supplementary Note 5).
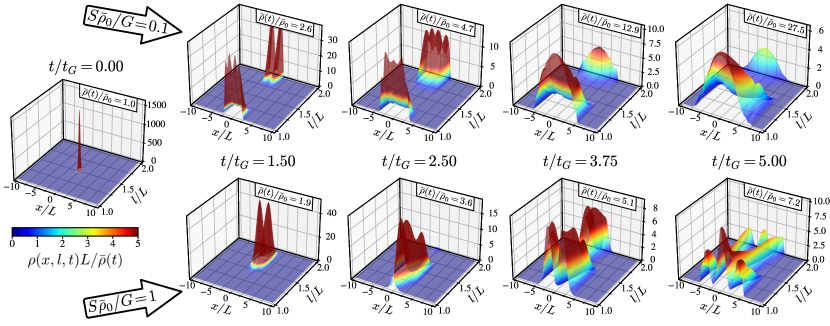
In general, our model describes a decrease of the local cell elongation rate in the regions with high density according to the stronger local mechano-response. To illustrate this spatial dependence, we depict the normalized density in the early stages of the colony evolution in Fig. 3. Initially, we observe individual density peaks, each representing a cell, whose number doubles after the birth of the next generation. The effect of an increasing mechano-response is to slow down the overall colony growth, as predicted in Fig. 2, but here also on a local level. For example, in the bottom-right snapshot of Fig. 3, the outer peaks represent cells one generation ahead of those in the center, where the local density is much higher. For a weaker mechano-response (top panel of Fig. 3) this effect is less pronounced and we observe that the peaks gradually merge due to growth fluctuations and spatial diffusion. Moreover, for a stronger spatial mechano-repulsion, i.e., lower substrate friction, the peaks are pushed further apart from each other (see Supplementary Figure 3), which reduces the local strength of the mechano-response, such that the total cell count increases faster. Eventually, a smooth colony structure is approached which is characterized by having a higher density and a larger percentage of shorter cells in the center than in the periphery.
Cell-based simulations.
To corroborate the predictions of our probabilistic DDFT and better understand the repercussions on the individual growth dynamics, we also perform cell-resolved Langevin simulations in two spatial dimensions. As detailed in the Methods section, we consider rod-like bacteria that interact through Hertzian repulsion. Specifically, the Langevin equations for positions and orientations are coupled to the stochastic dynamics of the cell lengths, including a response term with respect to the same Hertzian overlap potential.
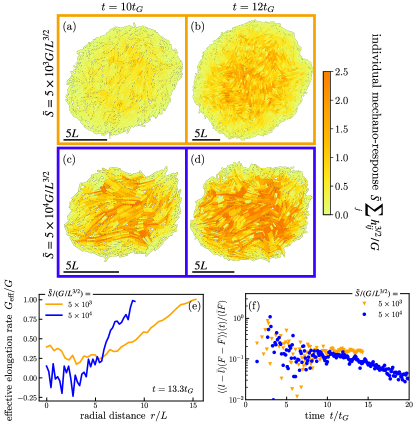
The effective elongation rate averaged over the whole colony is shown in Fig. 1q. As in the experiment (Fig. 1h), decreases at later times but does not exponentially approach zero since the continuously growing periphery of the colony always remains sufficiently dilute. This result is illustrated in more detail by the different snapshots compiled in Fig. 4a-d. Comparing the colony size (different scale bars) after certain times, it becomes apparent that the colony of bacteria with a stronger overall mechano-response (larger ) grows slower.
We also resolve by the color code in Fig. 4a-d the local mechano-response of individual cells, which is apparently stronger in the center of the colony than in the periphery. As this local quantity scales with the overall mechano-response, the difference between the typical forces in these two regions is more significant for larger . Our qualitative observations are confirmed in Fig. 4e by measuring the local elongation rate, which is steeper for larger (also notice the smaller colony radius after the same amount of time) and generally increases from the colony center to the periphery, following the decrease of local density (see also the DDFT results in Fig. 3). The correlation depicted in Fig. 4f further reveals that the mechanical force on longer bacteria is typically stronger than on shorter bacteria throughout the colony evolution.
Moreover, as illustrated in Fig. 1o-p, the local force acting on a bacterium in a dense colony is smaller when it is surrounded by voids than when its ends are in close contact with its neighbors, which also feeds back on the individual elongation rate, as measured experimentally in Fig. 1f-g.
Length-distribution dynamics.
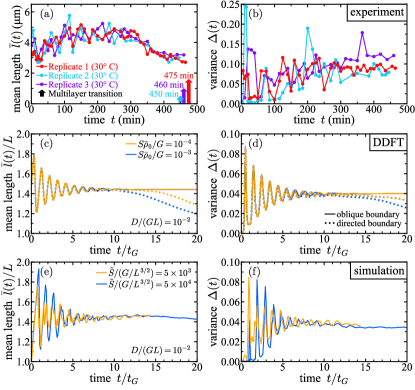
To gain further insight into the length-distribution dynamics, we compare in Fig. 5 the experimental results for the mean length and the normalized variance to our model predictions. After early fluctuations owed to the synchronous cell cycles in the early generations, the experimental data show a clear trend that the bacteria become shorter in the dense colony, while the variance begins to plateau under the experimental growth conditions considered here. Accordingly, the moments predicted by DDFT oscillate around their stationary values with a decreasing amplitude. Recall that the version of our DDFT used here formally describes a homogeneous system with the cell lengths restricted to a fixed interval.
The qualitative experimental observations for later times are better captured by utilizing the directed boundary condition introduced for our position-resolved DDFT, as it prohibits flow from short to long (see the Methods section and Supplementary Note 5). This refined implementation allows us to effectively predict the expected decrease of within our size-resolved DDFT. As shown in Supplementary Figures 4 and 5, the colony enters an additional fluctuation-driven regime after it has grown sufficiently dense, which is characterized by a gradual approach to a distinct stationary solution, where shorter bacteria balance the higher cell count (the smaller variance is due to our assumption of a restricted length interval). We also find consistent results from our cell-based simulations of a freely growing colony, where the bacteria in the dense region can effectively respond by shrinking below the length-at-birth (see Supplementary Figure 6). A detailed comparison between our approaches in view of the observations in Fig. 5 can be found at the end of the Methods section.
Mechano-cross-response of competing strains.
When evolving on the same substrate, two different bacterial strains compete for the available resources, including the free space in the colony. Therefore, the growth of each individual is not only regulated by the interaction with its own kind but also with the other species. To investigate this mechano-cross-response, we consider two interacting species and with different characteristic growth properties giometto2018physical . For such a system, our multicomponent DDFT (see the Methods section) with directed boundary conditions predicts distinct length distributions in the fully grown homogeneous colony, whose general form is related analytically to the input parameters and final densities in Supplementary Note 6. We can thus use this stationary information to infer the growth properties of the two competing bacterial strains.
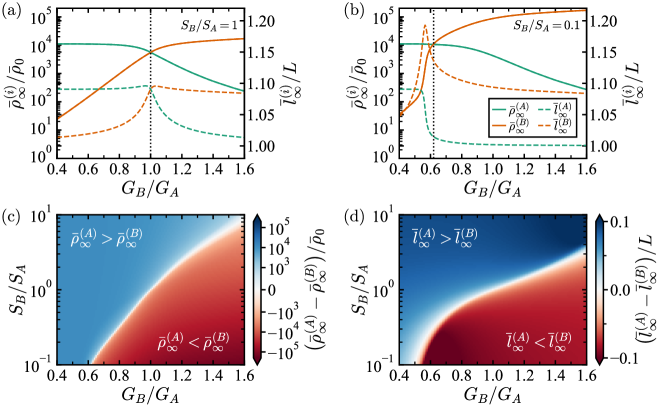
To understand the ultimate colony composition, we compare in Fig. 6 the stationary total densities and mean lengths with for different parameters of our model. For equal strengths of the mechano-response (, Fig. 6a), the faster-growing strain also ends up with a larger total number of cells and thus dominates the colony. Due to the mechano-cross-response, the other strain ends up with a larger percentage of shorter cells. Setting now, say, (Fig. 6b), a dominance of species over species is even possible if the latter has a larger elongation rate , as long as exceeds an interaction-dependent threshold set by the condition . Slightly below this threshold, the shape of the stationary length distributions changes drastically for small variations of . This behavior of and is illustrated for a broader range of interaction parameters in the state diagrams in Fig. 6c-d. Moreover, as exemplified in Supplementary Figure 7 and discussed in Supplementary Note 6, we observe for a dynamical crossover in the total densities, for but for with the crossover time , and an adiabatic regime in which the faster growing but more mechano-responsive species follows a sequence of quasi-stationary length distributions after its total density has saturated.
The experimental investigation of such bacterial mixtures, together with a more comprehensive theoretical study that allows for a possible extinction of the dominated species, shall shed further light on the cross-talk and interfaces between distinct active growth processes in future work.
Discussion
We have introduced a DDFT model for growing bacterial colonies from which we predicted analytical length distributions and drew parallels to dynamical observations in experiments and Langevin simulations. Despite its simplicity, our model captures the basic features of collective interactions among the cells in in vitro experiments ruling out possible effects of nutrient limitation. This agreement is demonstrated by investigating the (local) reduction of the elongation rate depending on the bacterial mechano-response. For a mixture of competing bacterial strains, our model suggests that a mechano-cross-response between the two species affects the (dynamical) length distributions in a nontrivial way. Our general theoretical description relates these effects to a microscopic interaction potential and, therefore, it both contributes to the understanding of collective effects in models of growing bacterial colonies and elucidates the consequences of biomechanical forces for the evolution of living samples. While a comprehensive description of biological systems surely requires the inclusion of additional effects (as discussed below), our length-resolved tools are potentially of inherent theoretical and mathematical interest in their own right, for example regarding the interplay between cell length and topological defects.
The utility of our model can be exemplified by contemplating the onset of the mono-to-multilayer transition you2019monotomultilayer ; dhar2022escape2d_time ; chu2018self (or verticalization beroz2018verticalization ; nijjer2021mechanical ; shimaya2022tilt ), i.e., when individual bacteria evade crowded regions by escaping into the third dimension to form additional layers. Such structural transitions are triggered as a consequence of the self-imposed mechanical stresses that build up in a growing bacterial colony you2019monotomultilayer ; dhar2022escape2d_time . Accordingly, our model allows us to determine directly the local in-plane mechanical force opposing the growth of each cell, cf. Fig. 4a-d, which can be compared to an appropriately chosen threshold. In our experiments, the transition happens after about 450 minutes, which roughly corresponds to for the model parameters chosen accordingly in Fig. 1q. By then the peak pressure within the colony has reached values around 10 kPa you2019monotomultilayer , which is consistent with the self-imposed physical pressures measured by Chu et al. chu2018self . A more quantitative comparison in future work should also take into account the role of substrate friction podewitz2016interface .
To provide a more accurate description of specific internal processes in individual cells and give a broader account of biodiversity, our model can be readily extended in various directions. Escherichia coli typically exhibit exponential growth amir2014cell ; delgado2022influence ; dhar2022escape2d_time , which can be modeled on a cellular level mukherjee2023cell , and cell division occurs after adding a specific length campos2014constant ; taheri2015cell ; si2019mechanistic . These processes are intrinsically related to a cell cycle malmi2018cell ; banwarth2020quantifying ; colin2021twoprocessescelldivision ; li2021role ; li2022competition . One may further include death events allocati2015communitydeath ; ghosh2017morphodynamicsdeath ; yanni2019drivers ; podewitz2015tissue ; podewitz2016interface or describe division into multiple daughter cells tse2012increased and then consider more general mixtures of cells with different physiological properties frost2018cooperationantibiotics ; li2022competition , also allowing for phenotype switching balaban2004bacterial ; kussell2005phenotypic or mutation wrande2008accumulationmutants ; farrell2017mechanicalinteractionsmutants ; hashuel2019agingmutants . Finally, we stress that our model, as employed here, is formally not limited to the interpretation of mimicking mechanical interactions. An alternative application of our equations would be to conceive an interaction potential differing from that describing spatial repulsion, such that it effectively incorporates other effects limiting cell growth, such as biochemical signaling mishra2017protein ; van2019mechanical or nutrient depletion hornung2018nutrientlimitedgrowth .
Further perspectives on the spatiotemporal implications of a heterogeneous local length distribution open up when additionally resolving positions and orientations. Both our generalized DDFT (see the Methods section) and our cell-based simulations allow us to include and compare the mechano-response with respect to different externally applied forces affecting the growth process on the single-cell level. For example, the bacteria can be immersed in a stiff gel tuson2012measuring , grown on rough surfaces yoda2014effect ; zheng2021implication or spatially confined volfson2008biomechanical ; podewitz2015tissue ; you2021confinement . It is also possible to investigate the detailed colony structure zhang2010collective ; liu2015metaboliccodependencebiofilms ; ghosh2017morphodynamicsdeath ; beraghosh2022mechanisticbiofilmcoexistence , topological defect dynamics doostmohammadi2016defect ; dell2018growingcolonyactivenematic ; nordemann2020defect ; sengupta2020microbial ; dhar2022escape2d_time ; shimaya2022tilt , emerging smectic order boyer2011buckling ; wittmann2021annulus ; monderkamp2021topology ; xia2021structural ; paget2022tensorsmectic ; langeslay2022 , growth within porous media ingham1998transportinporousmediabook ; or2007porousreview or the explicit onset of three-dimensional growth beroz2018verticalization ; nijjer2021mechanical ; dhar2022escape2d_time ; drescher2016architecturaltransition3dcellresolution ; warren2019spatiotemporal . Moreover, attractions through pili bonds ponisch2018pili ; kuan2021continuum , or the motility of individual bacteria ni2020growth ; sarkar2021minimal ; breoni2022cycle can be modeled. In view of a comprehensive biological picture, one could study interactions and competition between multiple colonies or cell strains liu2016interspecific ; ponisch2018pili ; kuan2021continuum ; basaran2022inward alongside their cross-talk with other spatially distributed agents nadell2016spatial , such as signaling molecules mishra2017protein ; van2019mechanical nutrients ghosh2015biofilm ; hornung2018nutrientlimitedgrowth , antibiotics fridman2014antibiotics ; frost2018cooperationantibiotics , parasites like bacteriophages kauffman2022phages or a secreted extracellular matrix mediating biofilm formation ghosh2015biofilm ; beraghosh2022mechanisticbiofilmcoexistence .
Finally, our DDFT equations allow for a systematic derivation elder2007PCF_DDFT ; vanteeffelen2009derivationPFC_DDFT of phase-field crystal models elder2002PFC to recover hydrodynamic field equations dell2018growingcolonyactivenematic ; doostmohammadi2016defect ; you2018geometry and explicitly incorporate aspects related to bacterial length. Exploring the relation to active nematics doostmohammadi2018activenematics ; copenhagen2021topological constitutes a possible direction for future work.
Methods
General DDFT for growing bacterial colonies
We propose a dynamical density functional theory (DDFT) to model growing bacterial colonies through a time-dependent density , which resolves the spatial position , orientation and a size parameter , which here represents the cell length. In its most general form, the DDFT reads
| (3) | ||||
| (4) | ||||
| (5) | ||||
| (6) |
with the currents , and in positional, orientational and length space, respectively. The former two terms are given in their standard DDFT form as marconi1999DDFT ; archer2004DDFT ; tevrugt2020revDDFT
| (7) | ||||
| (8) |
with the diffusion coefficients and , the friction coefficients and and the derivative operators and in positional and rotational space, respectively. The internal interactions between the cells and interactions with an externally imposed field are described by the excess part of the free energy and an external potential , respectively Evans1979 .
As the central ingredient of our model, the length current
| (9) |
drives the length-dependent changes of the density, where the thermal energy is used as a scaling factor. The first term describes cell growth according to the growth function and thus drives the system out of equilibrium, while the remaining terms have a similar form as the currents in Eq. (7) but possess a slightly different interpretation. The term is of diffusive nature and describes fluctuations of the growth function, while the terms describe the response of the cell growth to internal and external interactions, where is related to the substrate friction. Finally, the source and sink terms in Eq. (6) describe cell division after a length is reached. A more detailed introduction to Eq. (6) and the framework of DDFT in general can be found in Supplementary Note 1.
Overview of related approaches
In Eq. (6) we have presented the most general form of our basic model in the language of DDFT which we can, in principle, even further extend in several directions along the lines of the Discussion section. What is left to be specified are the explicit interactions between the cells. Instead of evaluating the full multidimensional DDFT, we focus in the main text on different approaches based on this model, which are further described in the remaining paragraphs of this Methods section.
Specifically, we provide in Eqs. (10), (11) and (13) a set of stochastic Langevin equations in two dimensions, which are formally equivalent to our DDFT in Eq. (6) and allow for a cell-resolved investigation of the mechano-response. On the DDFT side, we consider various versions of Eq. (6) focusing on different aspects. First, we introduce a one-dimensional version of our DDFT in Eqs. (16) and (17) to illustrate the positional dependence of the evolving length distribution. Second, we derive a homogeneous size-resolved DDFT in Eqs. (19) and (20), which formally assumes a well-mixed system and can be analytically investigated. Third, we also generalize this size-resolved DDFT by Eqs. (28) and (29) to a version valid for multiple bacterial species. Fourth, we demonstrate that a logistic growth equation, Eq. (30) can be recovered upon further averaging our homogeneous DDFT over the cell size. After presenting details on our experimental system, we conclude the Methods section with a discussion of how the different versions of our model are related and which experimental aspects we intend to describe.
Cell-based Langevin simulations
In the particle-based approach to modeling growing bacterial colonies, the cells are considered as rigid rods. Their positions , orientations and lengths (of their long axis) evolve in time according to coupled Langevin equations. Here is the cell index, where the total number of bacteria may increase after each time step due to cell division. The short axis of each rod is kept fixed with length .
The position of rod evolves according to
| (10) |
where is the friction coefficient and are steric forces stemming from the interactions with other rods. Further, the orientation of the rod is measured by the angle with respect to the -axis in a Cartesian coordinate system. The dynamics of the angles are given by
| (11) |
where is the distance vector between particles and and is the vector perpendicular to the rods’ plane of motion. The forces between rods are calculated by a Hertzian repulsion
| (12) |
where is the overlap of rods and , is the strength of the force, and is the vector normal to the closest point of contact of the particles.
In the same spirit, we now allow the length of a rod to evolve as
| (13) |
with the constant elongation rate , a white noise of unit variance accounting for fluctuations of magnitude and mechanical interactions mediated by the overlap between particles . The parameter quantifies the strength of this mechano-response and takes the role of an inverse friction coefficient. Here, we have absorbed the other parameters from Eq. (12), such that is formally different from in Eq. (26) given the different nature of interactions considered. When the length of a cell exceeds the value after a certain time step, it is reset to , where is the length-at-birth. Then, a second cell with a new particle label and the same length is introduced and the total cell count is increased accordingly. In the course of this cell division, the positions of the two daughter cells are shifted from the rod’s original position by along the direction of the rod axis.
In the main text, the repulsion strength is fixed as and the length of the short axis of each rod is . The data presented in our plots are averaged over five simulation runs.
DDFT in one spatial dimension
To illustrate the spatial evolution of the length distribution in DDFT, we consider a system in one spatial dimension described by the density . As a minimal model, we take the growth function as a constant elongation rate you2018geometry ; you2019monotomultilayer , focus on a freely growing colony in the absence of an external potential and employ a soft-repulsive pair interaction
| (14) |
in the form of Gaussian cores archer2001binary whose width follows from the lengths and of two interacting bacteria. Such a potential is conveniently included through the mean-field functional
| (15) |
where the integrals over and run over the full one-dimensional space while and are restricted under the present assumptions to the interval . More general interactions could also be incorporated through appropriate alternative free-energy functionals Evans1979 ; vanderlickpercus1989mixture ; wittmann2017phase ; wittmann2016fundamental .
With the above choices, we rewrite the length current from Eq. (9) as
| (16) |
The one-dimensional version of Eq. (6) then reads
| (17) |
where a detailed derivation is given in Supplementary Note 1 D.
Although the cell length can, in principle, take any positive value, we restrict it here to the fixed interval with constant length-at-birth and consider a directed boundary condition (see Supplementary Note 5 for a detailed description and also Eq. (23) below). At , this corresponds to a specific no-flux boundary condition in Eq. (16) imposed for the fluctuations (the term ) and to enforcing a vanishing density if the drift-like terms (those and ) result in a negative contribution to the current. At , we use an absorbing boundary.
Homogeneous size-resolved DDFT
For the size-resolved calculations presented here, we employ a version of Eq. (6) for the dynamics of after averaging over positional and orientational coordinates, while assuming again that the external potential vanishes (or does not depend on the cell length) and taking a constant elongation rate . The resulting DDFT reads
| (18) | ||||
| (19) |
where the length current is given by
| (20) |
The third term of is derived assuming a mean-field expression of , Eq. (15), for soft interactions in the form of Gaussian cores, Eq. (14). Hence, this size-resolved DDFT is fully consistent with Eq. (17) and (16) in one spatial dimension. The expression in Eq. (20) can also be used in any spatial dimension after absorbing a trivial dimensional scaling factor into .
The spatially homogeneous nature of our size-resolved DDFT allows us to consider two types of boundary conditions for . First, when working with Eq. (19), we use the directed boundary condition (compare Supplementary Note 5 A))
| (21) | ||||
| (22) | ||||
| (23) |
for the current in Eq. (20). Second, a convenient alternative is to incorporate cell division through the oblique boundary condition
| (24) |
assuming that individual cell growth is homeostatic, while rewriting Eq. (20) as
| (25) |
which yields the DDFT equation
| (26) |
This approximation allows for a detailed analytic understanding of the length-distribution dynamics, where the effective elongation rate in Eq. (2) can be conveniently defined from the term on the right-hand side. A more precise specification of , a full derivation of Eq. (20), details on the role of the different boundary conditions, analytic analysis and further results are provided in Supplementary Notes 2, 4 and 5.
DDFT for multiple bacterial species.
It is in general straightforward to generalize a given DDFT model to mixtures of species with different properties by adding an additional species label and consider the individual evolution equations for , which are coupled via their collective interactions tevrugt2020revDDFT . For the purpose of the present study, we generalize the size-resolved DDFT from Eq. (19) to
| (27) | ||||
| (28) |
with the currents
| (29) |
In these equations, we assumed for simplicity that all species have the same length-at-birth and the same magnitude of growth fluctuations. Moreover, we consider different species and and define the elongation rates and , as well as the strengths and of the intra-species mechano-response, where we assume for the cross-interactions (see Supplementary Note 6 for further discussion).
Size-averaged logistic growth
The phenotemporal description of in Eq. (26) represents an averaged model after integrating out positions and orientations of a more general DDFT for . In turn, if one is only interested in the increase of the density (or number of cells), we can show upon further averaging out the dependence of the cell size (see Supplementary Note 3) that our model is consistent with the logistic growth equation
| (30) |
widely used to describe (space-resolved) population dynamics verhulst1838notice ; vandermeer2010populations ; korolev2010genetic ; pigolotti2012population . From our Eq. (26) we identify here the overall growth rate . Solving Eq. (30) with the initial condition , we find an analytic expression for the time evolution of the total density , as given by Eq. (1). Note that generalized growth equations fujikawa2003new ; pinto2022compressed can also be derived within our framework from different microscopic interactions.
Experiments on growing bacterial colonies
We use non-motile strains of E. Coli bacteria, NCM3722 delta-motA, growing at 30°C on a millimeter-thick agarose matrix. The experimental time scales are short enough to ensure that the growing bacterial monolayers remain nutrient-replete and do not undergo physiological changes throughout the duration of the experiments. Nutrient-limitation, if any, will impact all cells irrespective of their location in the colony. This setup ensures that collective (mechanical) stresses constitute the main cause of (locally) limited cell growth reported in Fig. 1a-h.
All experiments have been performed for a minimum of three distinct biological replicates. Cells were grown and monitored using standard protocols and control experiments dhar2022escape2d_time . The growth of a single bacterium (or two initial cells, in some cases) into colonies was imaged while maintaining the growth temperature of 30°C within the microscope environment. Single bacteria acting as monoclonal nucleating sites expand horizontally on the nutrient-rich agarose layers. Initially, the colony expanded in two dimensions as a bacterial monolayer over multiple generations, subsequently penetrating into the third dimension.
We visualize the colony growth over the entire period using time-lapse phase-contrast microscopy. For the current work, we focus primarily on the horizontal spreading of the colony and analyze the data till the transition to the multilayer structure sets off. Images were acquired using a Hamamatsu ORCA-Flash Camera ( m pixels) that was coupled to an inverted microscope (Olympus CellSense LS-IXplore). We use a 60X oil objective and, in some cases, 100X oil objectives to zoom into specific regions of the growing colonies. Overall, this gave a minimum resolution of 0.11 m.
Each experiment lasted typically 15h to 18h, allowing us to capture the mono-to-multilayer configurations and the structure and dynamics of multilayer colonies. Prior to image acquisition, multiple locations on the agarose surface (where a single bacterium or up to two cells were present) were identified and recorded, allowing us to additionally extract technical replicates from the same sample. The microscope was automated to scan these pre-recorded coordinates and to capture the images of the gradually increasing colonies after every five minutes while maintaining the focus across all the colonies captured.
We extracted the cell dimensions (width and length), position (centroid) and orientation of each bacterium from the phase-contrast images using the combination of open-source packages of Ilastik berg2019Ilastik and ImageJ as well as MATLAB (MathWorks). The combination of phase contrast and time-lapse imaging allowed us to quantify phenotypic traits at the resolution of individual cells and thereby extract the reported statistics after image analyses while ensuring that the cells do not tilt out of the plane beroz2018verticalization ; nijjer2021mechanical (see Supplementary Figure 8). A detailed description of cell culturing, fabrication and imaging of cell monolayers can be found in Supplementary Note 7. The obtained cell-length statistics are shown in Supplementary Tables 1-3 and provided as Supplementary Data 1-3.
Comparison of different approaches
Our cell-based Langevin model essentially describes the same physics of growing bacterial colonies as our general DDFT. However, the former conveniently ignores positional and rotational diffusion terms, which are typically required in DDFT. Apart from this minor difference, Eqs. (10) and (11) are conceptually equivalent to the first and second terms in Eq. (6), respectively (the sole difference being the way interactions are chosen and implemented, as discussed below). The dynamical description of cell size is the heart of our model and the four ingredients illustrated in Fig. 1i are accounted for in all our approaches. While the implementation of cell division is straightforward in the Langevin model, our DDFT requires the translation to a slightly different directed boundary condition (23). The description of growth and fluctuations in the Langevin model is stochastically equivalent to our DDFT when we compare the first two terms in Eq. (13) to those of the probability current in Eq. (9), Eq. (16) and Eq. (20), or to those on the right-hand-side of Eq. (26). Finally, despite the different appearance of the third term in these equations, the treatment of collective interactions is also conceptually equivalent: they are derived from the same expression as in configurational space (steric forces in the Langevin model and an excess free energy in DDFT), which is the defining feature of the mechano-response.
The specific choice and implementation of the interaction terms is what distinguishes our two computational approaches. As we are interested in the basic phenomenology resulting from our model we have chosen to work with expressions that are standard in each case. Hence, we implement our Langevin simulations with the established Hertzian overlap function (12) allen2018bacterialreview ; you2018geometry ; you2019monotomultilayer and equip our DDFT with a Gaussian soft-repulsive potential (14) which can be treated in the mean-field way (15). To corroborate the general compatibility of both approaches, let us note that, for a well-mixed system, the DDFT equation from Eq. (26) is stochastically equivalent to the Langevin model
| (31) |
where is the current number of particles and is the total volume of the system, thus . As shown in Supplementary Figure 4, the simulations of Eq. (31) with yield practically the same length distributions as DDFT with the directed boundary condition.
In view of the most accurate description of our experiments, a specific interaction potential would have to be measured for interacting cells and implemented in our mechanical terms. However, our qualitative observations are largely independent of such a choice, as long as the assumed interaction is sufficiently repulsive. The parameters entering our model equations are empirical and specific to the experimental nonequilibrium systems of interest. In particular, the strength (or ) of the mechano-response is a measure of how strongly the growth behavior of a cell is actually affected by a mechanical stimulus - just like friction with the substrate determines the extent of the spatial drift induced by a repulsive force. If desired, other growth-limiting effects that are not of mechanical origin (such as nutrient depletion) can be effectively described by an appropriate adaption of this parameter to experimental measurements.
Although it is not the focus of the present work, we stress that the onset of cell division can also be affected by different biological or mechanical mechanisms. Hence, to better represent the real bacterial system, our basic model could be fine-tuned by allowing for a time-dependent length-of-birth in future work. For example, individual Escherichia coli cells grow according to the adder model and divide after having grown by a certain length campos2014constant ; taheri2015cell ; si2019mechanistic . More specifically, taking a closer look at our experimental data, we find that the periodicity of the oscillations in Fig. 5 decreases in the course of the colony evolution, i.e., on average, a cell divides every 33-36 minutes in the dilute case and every 24-27 minutes in the dense case. As the elongation rate, averaged over the colony, also decreases over time, this observation is accompanied by a reduction of the maximum length an individual cell reaches before the division event, i.e., the length-at-birth decreases from generation to generation. In addition, the length-at-birth depends on a cell’s local position in relation to its neighbors in the growing colony. Hence, we conclude that the observed decrease of the mean cell length in Fig. 5 is consistent with our current model of a mechano-response depending on the local density (even in the simple form with a constant length-at-birth ) and that the individual growth kinetics play only a minor role. In an extended model, the length-at-birth should thus also depend on the density, which could be modeled by similar terms as used for the length current in Eq. (9).
Acknowledgments
The authors would like to thank Michael te Vrugt, Nicola Pellicciotta, Marco Mazza, Simon Schnyder and Jens Elgeti for stimulating discussions and Marcel Funk for his contributions to implementing the size-resolved Langevin simulations (31).
R.W. and H.L. acknowledge support by the Deutsche Forschungsgemeinschaft (DFG) through the SPP 2265, under grant numbers WI 5527/1-1 (R.W.) and LO 418/25-1 (H.L.).
A.S. thanks the Institute for Advanced Studies, University of Luxembourg (AUDACITY Grant: IAS-20/CAMEOS), and the Luxembourg National Research Fund’s ATTRACT Investigator Grant (Grant no. A17/MS/11572821/MBRACE) and CORE Grant (C19/MS/13719464/TOPOFLUME/Sengupta) for supporting this work.
References
- (1) Dufrêne, Y. F. & Persat, A. Mechanomicrobiology: how bacteria sense and respond to forces. Nat. Rev. Microbiol. 18, 227–240 (2020).
- (2) Harper, C. E. & Hernandez, C. J. Cell biomechanics and mechanobiology in bacteria: Challenges and opportunities. APL Bioeng. 4 (2020).
- (3) Persat, A. et al. The mechanical world of bacteria. Cell 161, 988–997 (2015).
- (4) Genova, L. A. et al. Mechanical stress compromises multicomponent efflux complexes in bacteria. Proc. Natl. Acad. Sci. U.S.A. 116, 25462–25467 (2019).
- (5) Allen, R. J. & Waclaw, B. Bacterial growth: a statistical physicist’s guide. Rep. Prog. Phys. 82, 016601 (2018).
- (6) You, Z., Pearce, D. J. G., Sengupta, A. & Giomi, L. Geometry and mechanics of microdomains in growing bacterial colonies. Phys. Rev. X 8, 031065 (2018).
- (7) You, Z., Pearce, D. J. G., Sengupta, A. & Giomi, L. Mono-to multilayer transition in growing bacterial colonies. Phys. Rev. Lett. 123, 178001 (2019).
- (8) Chu, E. K., Kilic, O., Cho, H., Groisman, A. & Levchenko, A. Self-induced mechanical stress can trigger biofilm formation in uropathogenic escherichia coli. Nat. Commun. 9, 4087 (2018).
- (9) Alric, B., Formosa-Dague, C., Dague, E., Holt, L. J. & Delarue, M. Macromolecular crowding limits growth under pressure. Nat. Phys. 18, 411–416 (2022).
- (10) Sengupta, A. Microbial active matter: a topological framework. Front. Phys. 8, 184 (2020).
- (11) Dhar, J., Thai, A. L. P., Ghoshal, A., Giomi, L. & Sengupta, A. Self-regulation of phenotypic noise synchronizes emergent organization and active transport in confluent microbial environments. Nat. Phys. 18, 945–951 (2022).
- (12) Tuson, H. H. et al. Measuring the stiffness of bacterial cells from growth rates in hydrogels of tunable elasticity. Mol. Microbiol. 84, 874–891 (2012).
- (13) Cesar, S. & Huang, K. C. Thinking big: the tunability of bacterial cell size. FEMS Microbiol. Rev. 41, 672–678 (2017).
- (14) Amir, A. Cell size regulation in bacteria. Phys. Rev. Lett. 112, 208102 (2014).
- (15) Campos, M. et al. A constant size extension drives bacterial cell size homeostasis. Cell 159, 1433–1446 (2014).
- (16) Taheri-Araghi, S. et al. Cell-size control and homeostasis in bacteria. Curr. Biol. 25, 385–391 (2015).
- (17) Si, F. et al. Mechanistic origin of cell-size control and homeostasis in bacteria. Curr. Biol. 29, 1760–1770 (2019).
- (18) Delgado-Campos, A. & Cuetos, A. Influence of homeostatic mechanisms of bacterial growth and division on structural properties of microcolonies: A computer simulation study. Phys. Rev. E 106, 034402 (2022).
- (19) Farrell, F. D. C., Hallatschek, O., Marenduzzo, D. & Waclaw, B. Mechanically driven growth of quasi-two-dimensional microbial colonies. Phys. Rev. Lett. 111, 168101 (2013).
- (20) Farrell, F. D., Gralka, M., Hallatschek, O. & Waclaw, B. Mechanical interactions in bacterial colonies and the surfing probability of beneficial mutations. J. R. Soc. Interface 14, 20170073 (2017).
- (21) Schnyder, S. K., Molina, J. J. & Yamamoto, R. Control of cell colony growth by contact inhibition. Sci. Rep. 10, 6713 (2020).
- (22) Langeslay, B. & Juarez, G. Microdomains and stress distributions in bacterial monolayers on curved interfaces. Soft Matter (2023).
- (23) Puliafito, A. et al. Collective and single cell behavior in epithelial contact inhibition. Proc. Natl. Acad. Sci. U.S.A. 109, 739–744 (2012).
- (24) Cox, C. D., Bavi, N. & Martinac, B. Bacterial mechanosensors. Annu. Rev. Physiol 80, 71–93 (2018).
- (25) Gordon, V. D. & Wang, L. Bacterial mechanosensing: the force will be with you, always. J. Cell Sci. 132, jcs227694 (2019).
- (26) Podewitz, N., Delarue, M. & Elgeti, J. Tissue homeostasis: A tensile state. Europhys. Lett. 109, 58005 (2015).
- (27) Podewitz, N., Jülicher, F., Gompper, G. & Elgeti, J. Interface dynamics of competing tissues. New J. Phys. 18, 083020 (2016).
- (28) Mishra, R. et al. Protein kinase c and calcineurin cooperatively mediate cell survival under compressive mechanical stress. Proc. Natl. Acad. Sci. U.S.A. 114, 13471–13476 (2017).
- (29) van Drogen, F. et al. Mechanical stress impairs pheromone signaling via pkc1-mediated regulation of the mapk scaffold ste5. J. Cell Biol. 218, 3117–3133 (2019).
- (30) Vicsek, T. & Zafeiris, A. Collective motion. Phys. Rep. 517, 71–140 (2012).
- (31) Bär, M., Großmann, R., Heidenreich, S. & Peruani, F. Self-propelled rods: Insights and perspectives for active matter. Annu. Rev. Condens. Matter Phys. 11, 441–466 (2020).
- (32) Kraikivski, P., Lipowsky, R. & Kierfeld, J. Enhanced ordering of interacting filaments by molecular motors. Phys. Rev. Lett. 96, 258103 (2006).
- (33) Narayan, V., Ramaswamy, S. & Menon, N. Long-lived giant number fluctuations in a swarming granular nematic. Science 317, 105–108 (2007).
- (34) Díaz-De Armas, A., Maza-Cuello, M., Martínez-Ratón, Y. & Velasco, E. Domain walls in vertically vibrated monolayers of cylinders confined in annuli. Phys. Rev. Res. 2, 033436 (2020).
- (35) Kumar, N., Gupta, R. K., Soni, H., Ramaswamy, S. & Sood, A. K. Trapping and sorting active particles: Motility-induced condensation and smectic defects. Phys. Rev. E 99, 032605 (2019).
- (36) Kozhukhov, T. & Shendruk, T. N. Mesoscopic simulations of active nematics. Sci. Adv. 8, eabo5788 (2022).
- (37) Marconi, U. M. B. & Tarazona, P. Dynamic density functional theory of fluids. J. Chem. Phys. 110, 8032–8044 (1999).
- (38) Archer, A. J. & Evans, R. Dynamical density functional theory and its application to spinodal decomposition. J. Chem. Phys. 121, 4246–4254 (2004).
- (39) te Vrugt, M., Löwen, H. & Wittkowski, R. Classical dynamical density functional theory: From fundamentals to applications. Adv. Phys. 69, 121–247 (2020).
- (40) Chauviere, A., Hatzikirou, H., Kevrekidis, I. G., Lowengrub, J. S. & Cristini, V. Dynamic density functional theory of solid tumor growth: preliminary models. AIP Adv. 2, 011210 (2012).
- (41) Al-Saedi, H. M., Archer, A. J. & Ward, J. Dynamical density-functional-theory-based modeling of tissue dynamics: Application to tumor growth. Phys. Rev. E 98, 022407 (2018).
- (42) Shimaya, T. & Takeuchi, K. A. Tilt-induced polar order and topological defects in growing bacterial populations. PNAS Nexus 1, pgac269 (2022).
- (43) Wang, P. et al. Robust growth of escherichia coli. Curr. Biol. 20, 1099–1103 (2010).
- (44) Yang, D., Jennings, A. D., Borrego, E., Retterer, S. T. & Männik, J. Analysis of factors limiting bacterial growth in pdms mother machine devices. Front. Microbiol. 9, 871 (2018).
- (45) Giometto, A., Nelson, D. R. & Murray, A. W. Physical interactions reduce the power of natural selection in growing yeast colonies. Proc. Natl. Acad. Sci. U.S.A. 115, 11448–11453 (2018).
- (46) Beroz, F. et al. Verticalization of bacterial biofilms. Nat. Phys. 14, 954–960 (2018).
- (47) Nijjer, J. et al. Mechanical forces drive a reorientation cascade leading to biofilm self-patterning. Nat. Commun. 12, 6632 (2021).
- (48) Mukherjee, A. et al. Cell wall fluidization by mechano-endopeptidases sets up a turgor-mediated volumetric pacemaker. bioRxiv 2023.08.31.555748 (2023).
- (49) Malmi-Kakkada, A. N., Li, X., Samanta, H. S., Sinha, S. & Thirumalai, D. Cell growth rate dictates the onset of glass to fluidlike transition and long time superdiffusion in an evolving cell colony. Phys. Rev. X 8, 021025 (2018).
- (50) Banwarth-Kuhn, M., Collignon, J. & Sindi, S. Quantifying the biophysical impact of budding cell division on the spatial organization of growing yeast colonies. Applied Sciences 10, 5780 (2020).
- (51) Colin, A., Micali, G., Faure, L., Lagomarsino, M. C. & van Teeffelen, S. Two different cell-cycle processes determine the timing of cell division in escherichia coli. Elife 10, e67495 (2021).
- (52) Li, J., Schnyder, S. K., Turner, M. S. & Yamamoto, R. Role of the cell cycle in collective cell dynamics. Phys. Rev. X 11, 031025 (2021).
- (53) Li, J., Schnyder, S. K., Turner, M. S. & Yamamoto, R. Competition between cell types under cell cycle regulation with apoptosis. Phys. Rev. Res. 4, 033156 (2022).
- (54) Allocati, N., Masulli, M., Di Ilio, C. & De Laurenzi, V. Die for the community: an overview of programmed cell death in bacteria. Cell Death Dis. 6, e1609–e1609 (2015).
- (55) Ghosh, P. & Levine, H. Morphodynamics of a growing microbial colony driven by cell death. Phys. Rev. E 96, 052404 (2017).
- (56) Yanni, D., Márquez-Zacarías, P., Yunker, P. J. & Ratcliff, W. C. Drivers of spatial structure in social microbial communities. Curr. Biol. 29, R545–R550 (2019).
- (57) Tse, H. T. K., Weaver, W. M. & Di Carlo, D. Increased asymmetric and multi-daughter cell division in mechanically confined microenvironments. PloS one 7, e38986 (2012).
- (58) Frost, I. et al. Cooperation, competition and antibiotic resistance in bacterial colonies. ISME J. 12, 1582–1593 (2018).
- (59) Balaban, N. Q., Merrin, J., Chait, R., Kowalik, L. & Leibler, S. Bacterial persistence as a phenotypic switch. Science 305, 1622–1625 (2004).
- (60) Kussell, E. & Leibler, S. Phenotypic diversity, population growth, and information in fluctuating environments. Science 309, 2075–2078 (2005).
- (61) Wrande, M., Roth, J. R. & Hughes, D. Accumulation of mutants in “aging” bacterial colonies is due to growth under selection, not stress-induced mutagenesis. Proc. Natl. Acad. Sci. U.S.A. 105, 11863–11868 (2008).
- (62) Hashuel, R. & Ben-Yehuda, S. Aging of a bacterial colony enforces the evolvement of nondifferentiating mutants. MBio 10, e01414–19 (2019).
- (63) Hornung, R. et al. Quantitative modelling of nutrient-limited growth of bacterial colonies in microfluidic cultivation. J. R. Soc. Interface 15, 20170713 (2018).
- (64) Yoda, I. et al. Effect of surface roughness of biomaterials on staphylococcus epidermidis adhesion. BMC Microbiol. 14, 1–7 (2014).
- (65) Zheng, S. et al. Implication of surface properties, bacterial motility, and hydrodynamic conditions on bacterial surface sensing and their initial adhesion. Front. Bioeng. Biotechnol. 9, 643722 (2021).
- (66) Volfson, D., Cookson, S., Hasty, J. & Tsimring, L. S. Biomechanical ordering of dense cell populations. Proc. Natl. Acad. Sci. U.S.A. 105, 15346–15351 (2008).
- (67) You, Z., Pearce, D. J. G. & Giomi, L. Confinement-induced self-organization in growing bacterial colonies. Sci. Adv. 7, eabc8685 (2021).
- (68) Zhang, H.-P., Be’er, A., Florin, E.-L. & Swinney, H. L. Collective motion and density fluctuations in bacterial colonies. Proc. Natl. Acad. Sci. U.S.A. 107, 13626–13630 (2010).
- (69) Liu, J. et al. Metabolic co-dependence gives rise to collective oscillations within biofilms. Nature 523, 550–554 (2015).
- (70) Bera, P., Wasim, A. & Ghosh, P. A mechanistic understanding of microcolony morphogenesis: coexistence of mobile and sessile aggregates. Soft Matter 19, 1034–1045 (2023).
- (71) Doostmohammadi, A., Thampi, S. P. & Yeomans, J. M. Defect-mediated morphologies in growing cell colonies. Phys. Rev. Lett. 117, 048102 (2016).
- (72) Dell’Arciprete, D. et al. A growing bacterial colony in two dimensions as an active nematic. Nat. Commun. 9, 4190 (2018).
- (73) Los, R. et al. Defect dynamics in growing bacterial colonies. arXiv preprint arXiv:2003.10509v2 (2022).
- (74) Boyer, D. et al. Buckling instability in ordered bacterial colonies. Phys. Biol. 8, 026008 (2011).
- (75) Wittmann, R., Cortes, L. B. G., Löwen, H. & Aarts, D. G. A. L. Particle-resolved topological defects of smectic colloidal liquid crystals in extreme confinement. Nat. Commun. 12, 623 (2021).
- (76) Monderkamp, P. A. et al. Topology of orientational defects in confined smectic liquid crystals. Phys. Rev. Lett. 127, 198001 (2021).
- (77) Xia, J., MacLachlan, S., Atherton, T. J. & Farrell, P. E. Structural landscapes in geometrically frustrated smectics. Phys. Rev. Lett. 126, 177801 (2021).
- (78) Paget, J., Mazza, M. G., Archer, A. J. & Shendruk, T. N. Complex-tensor theory of simple smectics. Nat. Commun. 14, 1048 (2023).
- (79) Ingham, D. B. & Pop, I. Transport phenomena in porous media (Elsevier, 1998).
- (80) Or, D., Smets, B. F., Wraith, J. M., Dechesne, A. & Friedman, S. P. Physical constraints affecting bacterial habitats and activity in unsaturated porous media–a review. Adv. Water Resour. 30, 1505–1527 (2007).
- (81) Drescher, K. et al. Architectural transitions in vibrio cholerae biofilms at single-cell resolution. Proc. Natl. Acad. Sci. U.S.A. 113, E2066–E2072 (2016).
- (82) Warren, M. R. et al. Spatiotemporal establishment of dense bacterial colonies growing on hard agar. Elife 8, e41093 (2019).
- (83) Pönisch, W. et al. Pili mediated intercellular forces shape heterogeneous bacterial microcolonies prior to multicellular differentiation. Sci. Rep. 8, 16567 (2018).
- (84) Kuan, H.-S., Pönisch, W., Jülicher, F. & Zaburdaev, V. Continuum theory of active phase separation in cellular aggregates. Phys. Rev. Lett. 126, 018102 (2021).
- (85) Ni, B., Colin, R., Link, H., Endres, R. G. & Sourjik, V. Growth-rate dependent resource investment in bacterial motile behavior quantitatively follows potential benefit of chemotaxis. Proc. Natl. Acad. Sci. U.S.A. 117, 595–601 (2020).
- (86) Sarkar, D., Gompper, G. & Elgeti, J. A minimal model for structure, dynamics, and tension of monolayered cell colonies. Commun. Phys. 4, 36 (2021).
- (87) Breoni, D., Schwarzendahl, F. J., Blossey, R. & Löwen, H. A one-dimensional three-state run-and-tumble model with a ’cell cycle’. Eur. Phys. J. E 45, 83 (2022).
- (88) Liu, W. et al. Interspecific bacterial interactions are reflected in multispecies biofilm spatial organization. Front. Microbiol. 7, 1366 (2016).
- (89) Basaran, M., Yaman, Y. I., Yüce, T. C., Vetter, R. & Kocabas, A. Large-scale orientational order in bacterial colonies during inward growth. Elife 11, e72187 (2022).
- (90) Nadell, C. D., Drescher, K. & Foster, K. R. Spatial structure, cooperation and competition in biofilms. Nat. Rev. Microbiol. 14, 589–600 (2016).
- (91) Ghosh, P., Mondal, J., Ben-Jacob, E. & Levine, H. Mechanically-driven phase separation in a growing bacterial colony. Proc. Natl. Acad. Sci. U.S.A. 112, E2166–E2173 (2015).
- (92) Fridman, O., Goldberg, A., Ronin, I., Shoresh, N. & Balaban, N. Q. Optimization of lag time underlies antibiotic tolerance in evolved bacterial populations. Nature 513, 418–421 (2014).
- (93) Kauffman, K. M. et al. Resolving the structure of phage–bacteria interactions in the context of natural diversity. Nat. Commun. 13, 372 (2022).
- (94) Elder, K. R., Provatas, N., Berry, J., Stefanovic, P. & Grant, M. Phase-field crystal modeling and classical density functional theory of freezing. Phys. Rev. B 75, 064107 (2007).
- (95) van Teeffelen, S., Backofen, R., Voigt, A. & Löwen, H. Derivation of the phase-field-crystal model for colloidal solidification. Phys. Rev. E 79, 051404 (2009).
- (96) Elder, K. R., Katakowski, M., Haataja, M. & Grant, M. Modeling elasticity in crystal growth. Phys. Rev. Lett. 88, 245701 (2002).
- (97) Doostmohammadi, A., Ignés-Mullol, J., Yeomans, J. M. & Sagués, F. Active nematics. Nat. Commun. 9, 3246 (2018).
- (98) Copenhagen, K., Alert, R., Wingreen, N. S. & Shaevitz, J. W. Topological defects promote layer formation in myxococcus xanthus colonies. Nat. Phys. 17, 211–215 (2021).
- (99) Evans, R. The nature of the liquid-vapour interface and other topics in the statistical mechanics of non-uniform, classical fluids. Adv. Phys. 28, 143–200 (1979).
- (100) Archer, A. J. & Evans, R. Binary gaussian core model: Fluid-fluid phase separation and interfacial properties. Phys. Rev. E 64, 041501 (2001).
- (101) Vanderlick, T. K., Davis, H. T. & Percus, J. K. The statistical mechanics of inhomogeneous hard rod mixtures. J. Chem. Phys. 91, 7136–7145 (1989).
- (102) Wittmann, R., Sitta, C. E., Smallenburg, F. & Löwen, H. Phase diagram of two-dimensional hard rods from fundamental mixed measure density functional theory. J. Chem. Phys. 147, 134908 (2017).
- (103) Wittmann, R., Marechal, M. & Mecke, K. Fundamental measure theory for non-spherical hard particles: predicting liquid crystal properties from the particle shape. J. Phys. Condens. Matter 28, 244003 (2016).
- (104) Verhulst, P.-F. Notice sur la loi que la population suit dans son accroissement. Corresp. Math. Phys. 10, 113–129 (1838).
- (105) Vandermeer, J. How populations grow: the exponential and logistic equations. Nature Education Knowledge 3, 15 (2010).
- (106) Korolev, K. S., Avlund, M., Hallatschek, O. & Nelson, D. R. Genetic demixing and evolution in linear stepping stone models. Rev. Mod. Phys. 82, 1691 (2010).
- (107) Pigolotti, S., Benzi, R., Jensen, M. H. & Nelson, D. R. Population genetics in compressible flows. Phys. Rev. Lett. 108, 128102 (2012).
- (108) Fujikawa, H., Kai, A. & Morozumi, S. A new logistic model for bacterial growth. J. Food Hyg. Soc. Japan 44, 155–160 (2003).
- (109) Pinto, C. & Shimakawa, K. A compressed logistic equation on bacteria growth: inferring time-dependent growth rate. Phys. Biol. 19, 066003 (2022).
- (110) Berg, S. et al. ilastik: interactive machine learning for (bio)image analysis. Nat. Methods 16, 1226–1232 (2019).