Benchmarking Spatial Reasoning Abilities of Text-to-Image Generative Models
Abstract
Spatial understanding is a fundamental aspect of computer vision and integral for human-level reasoning about images, making it an important component for grounded language understanding. While recent text-to-image synthesis (T2I) models have shown unprecedented improvements in photorealism, it is unclear whether they have reliable spatial understanding capabilities. We investigate the ability of T2I models to generate correct spatial relationships among objects and present VISOR, an evaluation metric that captures how accurately the spatial relationship described in text is generated in the image. To benchmark existing models, we introduce a dataset, SR2D, that contains sentences describing two or more objects and the spatial relationships between them. We construct an automated evaluation pipeline to recognize objects and their spatial relationships, and employ it in a large-scale evaluation of T2I models. Our experiments reveal a surprising finding that, although state-of-the-art T2I models exhibit high image quality, they are severely limited in their ability to generate multiple objects or the specified spatial relations between them. Our analyses demonstrate several biases and artifacts of T2I models such as the difficulty with generating multiple objects, a bias towards generating the first object mentioned, spatially inconsistent outputs for equivalent relationships, and a correlation between object co-occurrence and spatial understanding capabilities. We conduct a human study that shows the alignment between VISOR and human judgement about spatial understanding. We offer the SR2D dataset and the VISOR metric to the community in support of T2I reasoning research.
Index Terms:
text-to-image synthesis, generative models, dataset, vision-and-language1 Introduction
Text to image synthesis (T2I), has advanced rapidly with capabilities for generating high-definition images in response to text prompts. Models are being used as tools for art, graphic design, and image editing. The power of T2I models for generating photorealistic objects and scenes is well-known. We less understand the ability of the models to faithfully render spatial relationships in its compositions.
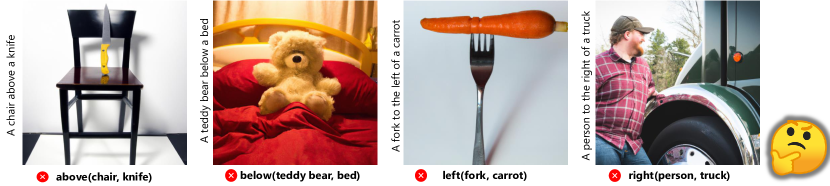
We pursue the question: Do T2I models have the ability to render the spatial relationships among objects that are specified in text prompts? Fig. 1 illustrates images generated by a state-of-the-art model (DALLE-v2 [1]) for sentences that contain a spatial relationship between two objects. In these examples, although both objects mentioned in the text are generated, the specified spatial relationship is not rendered.
Spatial relations and larger scene geometries are integral aspects of computer vision. Rendering and reasoning about these relationships is crucial for many applications such as language-guided navigation and object manipulation [2, 3, 4]. A lack of spatial understanding by T2I models can be frustrating to creators seeking to render specific configurations of objects. The assertion of spatial relationship is common in natural communication among humans and poor capabilities in this realm will rapidly come to the fore in navigational and instructional applications.
Prior work on evaluation metrics for T2I models have focused on photorealism [5, 6], object accuracy [7], and image-text vector similarity (via CLIP [8], retrieval [9], and captioning [10]). We find that these metrics are insensitive to errors with generating spatial relationships (Sec. 5.1). This finding highlights the need for a metric to quantify competencies and progress in spatial understanding. We develop an automated evaluation pipeline that employs computer vision to recognize objects and their spatial relationships, and harness this pipeline to conduct a large-scale evaluation of the spatial understanding capabilities of T2I models. We create the “SR2D” dataset, containing 25,280 sentences describing two-dimensional spatial relationships (left/right/above/below) between pairs of commonly occurring objects from MS-COCO [11], as shown in Table I. We study several state-of-the-art models: GLIDE [12], DALLE-mini [13], CogView2 [14], DALLE-v2 [1], Stable Diffusion [15], and Composable Diffusion [16]. For each model we generate and evaluate four images per SR2D example, i.e., a large-scale study of 101,120 images per model. Our study makes significant advances to evaluation of T2I reasoning capabilities since we evaluate photorealistic images rather than synthetic objects on solid background.
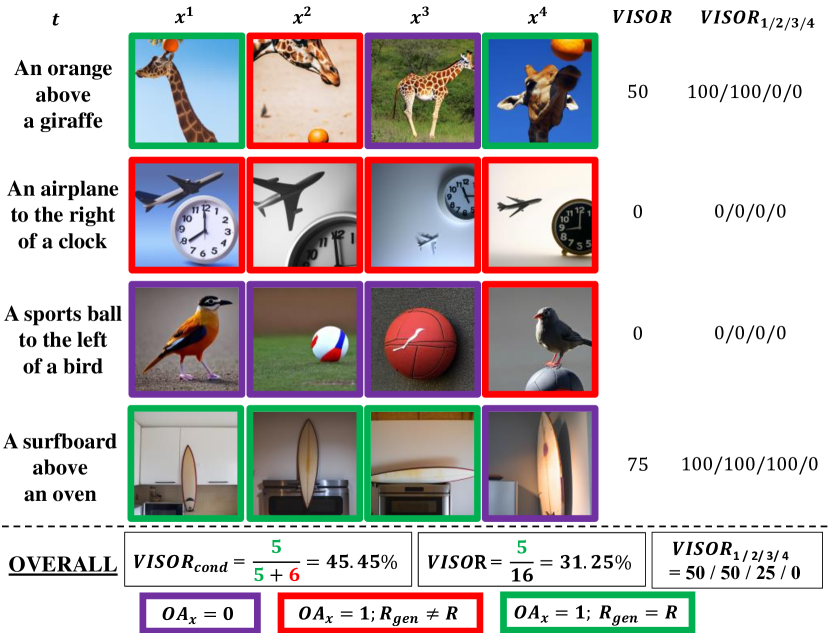
We introduce a new evaluation metric we refer to as VISOR (for verifying spatial object relationships), to compare the spatial understanding abilities of T2I models. We define three variants of the metric: (1) VISOR: verifies spatial correctness for each image w.r.t. its text input, (2) VISORn: consider whether at least of the multiple generated images for each text input are spatially correct, (3) VISORcond: verifies the spatial correctness in images, conditioned on both objects being generated by the model. While VISOR provides a macro-perspective on the performance gap in the spatial capabilities of T2I models, VISORn reflects the practical value of the model to users who can select one of many images generated by the model. The conditional formulation VISORcond disentangles two capabilities: (i) the generation of multiple objects and (ii) generation of correct spatial relationships between the rendered objects. We conduct a human study on Amazon Mechanical Turk and find that the VISOR metric is correlated with human judgment.
Our experiments reveal several interesting findings. First, we find that all existing models are significantly worse at generating two objects as compared to their capability to render single objects. While previous work shows exceptional zero-shot compositionality of colors, styles, and attributes [1, 17, 18], we found challenges with compositionality for multiple objects. Second, we find poor spatial understanding: even in cases where both objects are generated, models tend to ignore spatial relationships specified in language. VISOR scores for all models show that even the best model in our benchmark generates correct spatial relationships on less than of test cases. When we consider a strict metric (VISOR4) that requires that all generated images for text prompts to have correct spatial relationships, the best model (DALLE-v2) achieves the goal in cases. Third, we discover several biases in T2I models: to generate only the first object mentioned in the text and ignoring the second, to show better performance on commonly occurring object pairs, to have a tendency to merge two objects into one, and to have inconsistent outputs for equivalent text inputs.
| A | B | R | Text |
|---|---|---|---|
| microwave | sink | left | A microwave to the left of a sink |
| elephant | cat | right | An elephant to the right of a cat |
| donut | airplane | above | A donut above an airplane |
| suitcase | chair | below | A suitcase below a chair |
| keyboard | bench | left | A keyboard to the left of a bench |
| bed | bear | right | A bed to the right of a bear |
| potted plant | fire hydrant | above | A potted plant above a fire hydrant |
| person | umbrella | below | A person below an umbrella |
To summarize, our contributions are as follows:
-
•
We introduce a metric called VISOR to quantify spatial reasoning performance. VISOR can be used off-the-shelf with any text-to-image model, disentangles correctness of object generation with the ability of spatial understanding.
-
•
We construct and make available a large-scale dataset: SR2D, which contains sentences that describe spatial relationships between a pair of 80 commonly occurring objects along with linguistic variations.
-
•
With SR2D, we conduct a large-scale benchmarking of state-of-the-art T2I models with automated and human evaluation of spatial reasoning abilities of state-of-the-art T2I models using the VISOR metric. We find that although existing T2I models have improved photorealism, they lack spatial and relational understanding with multiple objects, and indicate several biases.
2 Related Work
2.1 Text-to-Image Synthesis.
Earlier work [19, 20] trained and evaluated models on human-labeled datasets [21, 22, 11]. Recent work on T2I has focused on zero-shot capabilities by taking advantage of implicit knowledge from pretrained language models and V+L models like CLIP, and the diffusion technique to train on large-scale web data.
2.2 Biases in Vision+Language models
have been studied from a linguistic perspective, such as question-answer priors in VQA [23, 24], gender bias in captioning [25, 26], shortcut effects in commonsense reasoning [27], and failure modes in logic-based VQA [28, 29, 30]. The difficulty of spatial understanding has been studied for visual grounding [31], image-text matching [32], VQA [33, 34], and navigation [35].
2.3 Human Study about Relational Understanding.
Conwell et al. [36] conducted a human study (1350 images) of DALLE-v2 on a set of eight physical relations and seven action-based relations between 12 object categories. Our human study is significantly larger in scale, considers diverse text inputs, several state of the art models, and establishes an alignment with the automated VISOR metric.
2.4 Empirical Evaluation of Visual Reasoning Skills.
DALL-Eval [37] evaluates reasoning skills of T2I models trained and tested on a synthetically generated dataset PaintSkills with black backgrounds and 21 rendered object categories. In our work, we instead focus on the evaluation of photorealistic and open-domain images with commonly occurring real-world objects and backgrounds on a large scale. Most importantly, we devise a new human-aligned metric (VISOR) that disentangles object accuracy from spatial understanding to accordingly measure progress in spatial reasoning despite the model’s capabilities in object generation.
2.5 Other Failure Modes of T2I Models.
Preliminary stress-testing of DALLE-v2 [38] (14 prompts), [39] (40 prompts) and [17] (200 prompts) illustrated anecdotal failures of the model in terms of compositionality, grammar, binding, and negation. However, since these studies rely on human judgment, there is a need for automated evaluation techniques for comparing the reasoning abilities of T2I models. Our paper fills this gap with the automated VISOR metric for spatial relationships and the large-scale SR2D dataset.
3 Spatial Relationships Challenge Dataset
3.1 Predicate Generation.
Our goal is to collect a set of sentences that describe spatial relationships between two objects.
Let be the set of object categories.
Let be the set of spatial relationships between objects.
In this paper, we focus on two-dimensional relationships, i.e.
,
and object categories derived from the MS-COCO dataset [11].
Then, for every , , and , let the predicate indicate that the spatial relationship exists between object and object .
For example describes a scene where a cat is to the left of a dog.
For each pair, we construct 8 types of spatial relationships as shown below:
left(A, B), right(A, B), above(A, B), below(A, B)
left(B, A), right(B, A), above(B, A), below(B, A)
3.2 Sentence Generation.
For each predicate , we convert it into a template <A> <R> <B> and paraphrase it into natural language. Appropriate articles “a”/“an” are prepended to object names A and B, to obtain four templates:
A/an <A> to the left of a/an <B>
A/an <A> to the right of a/an <B>
A/an <A> above a/an <B>
A/an <A> below a/an <B>
The template-based procedure has several advantages. First, it avoids linguistic ambiguity, subjectivity, and grammatical errors. Second, it is extensible to new object categories and additional spatial relationships. While we focus on two-dimensional relationships in this paper, our templates can be extended for generating test inputs for studying more complex spatial relationships and geometric features of objects, as we discuss in Sec. 7.
3.3 Dataset Statistics.
We use object categories from MS-COCO and therefore obtain unique combinations of object pairs (A, B). For each pair, we construct 8 types of spatial relationships listed above, which leads to a total of 3,160 8 25,280 predicates. The SR2D dataset contains 25,280 text prompts, uniformly distributed across 80 COCO object categories, with each object being found in 632 prompts. Tab. I lists a few illustrative examples.

4 VISOR Evaluation Metric
We propose VISOR as an automated metric for quantifying spatial understanding abilities of text-to-image models. VISOR is short for Verifying Spatial Object Relationships.
4.1 Definitions
Definition 1 (Object Accuracy)
Let be an oracle function that returns a set of detected objects in image from set . Then, object accuracy for an image , generated by a sentence containing objects and is:
| (1) |
Note that, the oracle function here could be either a pluggable learned model or a human detecting the presence of objects mentioned in the sentence. In our experiments, we show results for both cases and a correlational analyses between the two. Object accuracy is agnostic to the relationship , whose presence is instead captured in the VISOR metric.
Definition 2 (VISOR)
Let be the generated spatial relationship, while is the ground-truth relationship mentioned in text. Then, for each image ,
| (2) |
A useful feature of T2I models for artists and designers is the ability to generate multiple images for each input text prompt. This allows the creators to pick an appropriate image from generated images. We define VISORn to reflect how good T2I models are at generating at least spatially correct images given a text input that mentions a spatial relationship. From a usability perspective (where creators have the option to pick from the output image set), VISORn is useful for measuring if it is possible to find at least images that satisfy the prompt.
Definition 3 (VISORn)
VISORn is the probability of generating images such that for every text prompt , at least out of images have VISOR1:
| (3) |
The relationship between VISOR and VISORn is given below. The proof is presented in the supplementary materials.
| (4) |
In our study we use images per text prompt and, therefore, report VISOR1, VISOR2, VISOR3, and VISOR4. Fig. 2 shows an example computation of all VISOR metrics.
Note that only if both objects are generated in the image, i.e. . However, as we will see in Sec. 5, T2I models fail to generate multiple objects in a large subset of images. As such, it is important to disentangle the two abilities of the models to (1) generate multiple objects and (2) to generate them according to the spatial relationships described in the text of the prompt. For this purpose, we define conditional VISOR:
Definition 4 (Conditional VISOR)
is defined as the conditional probability of correct spatial relationships being generated, given that both objects were generated correctly.
| (5) |
4.2 Implementation
The VISOR computation process is summarized in Fig. 3. Given any text prompt and a T2I model , we first generate images , and use an object detector to localize objects in . Object accuracy OA is computed using Eq. 1. We obtain centroid coordinates of objects A and B from the the bounding boxes of the detected objects. Based on the centroids, we deduce the spatial relationship between them using the rules shown in the “Predicate Converter” box in Fig. 3. Finally, the generated relationship is compared with the ground-truth relationship , and VISOR scores are computed using Eqs. 2, 3 and 5.
We use OWL-ViT [40], a state of the art open-vocabulary object detector, with a CLIP backbone and ViT-B/32 transformer architecture and confidence threshold . The supplementary material also contains results using DETR-ResNet-50 [41] trained on MS-COCO. The results using both object detectors are similar and lead to an identical ranking of models in our benchmark. However, the open-vocabulary functionality of OWL-ViT ensures that VISOR is widely applicable to other datasets, categories, and vocabularies. This removes dependence on specific datasets, making VISOR widely applicable for any freeform text input.
| Model | BLEU-1 | BLEU-2 | BLEU-3 | BLEU-4 | METEOR | ROUGE | CIDER | SPICE | CLIPScore | VISOR |
|---|---|---|---|---|---|---|---|---|---|---|
| GLIDE | 0.29 / 0 | 0.14 / 1.9e-6 | 0.05 / 2.9e-6 | 0.02 / 7.4e-7 | 0.13 / -9.9e-6 | 0.35 / -2.6e-6 | 0.18 / 1.1e-6 | 0.11 / -8.1e-6 | 0.70 / 1.3e-3 | 0.02 / 0.03 |
| GLIDE + CDM | 0.31 / 0 | 0.15 / 2.9e-5 | 0.06 / 7.6e-6 | 0.02 / 1.7e-6 | 0.15 / 6.4e-5 | 0.36 / 1.7e-6 | 0.22 / 3.1e-5 | 0.14 / -7.7e-5 | 0.75 / -8.8e-6 | 0.06 / 0.07 |
| DALLE-mini | 0.34 / 0 | 0.19 / -4.4e-5 | 0.09 / -1.6e-5 | 0.04 / -4.5e-6 | 0.19 / 2.1e-6 | 0.41 / -7.3e-6 | 0.34 / -6.0e-5 | 0.20 / 3.3e-5 | 0.80 / 1.5e-3 | 0.16 / 0.22 |
| CogView-2 | 0.30 / 0 | 0.16 / 4.4e-6 | 0.07 / 1.3e-6 | 0.03 / 5.6e-6 | 0.16 / -6.6e-6 | 0.36 / -2.9e-6 | 0.25 / 8.7e-6 | 0.15 / 7.0e-5 | 0.72 / 1.5e-5 | 0.12 / 0.13 |
| DALLE-v2 | 0.36 / 0 | 0.21 / -1.9e-5 | 0.11 / -4.8e-6 | 0.04 / -1.5e-6 | 0.21 / 1.7e-4 | 0.44 / 8.8e-6 | 0.40 / -2.8e-5 | 0.22 / -4.1e-5 | 0.84 / 1.8e-3 | 0.38 / 0.55 |
| SD | 0.33 / 0 | 0.18 / 3.3e-6 | 0.08 / 9.7e-7 | 0.03 / 2.8e-7 | 0.19 / 1.0e-5 | 0.40 / -2.6e-6 | 0.31 / 4.3e-6 | 0.19 / 7.4e-5 | 0.79 / 1.5e-3 | 0.19 / 0.23 |
| SD + CDM | 0.32 / 0 | 0.17 / 1.1e-5 | 0.07 / 5.1e-6 | 0.03 / 1.3e-6 | 0.17 / 1.6e-4 | 0.38 / 4.4e-6 | 0.28 / 1.2e-5 | 0.18 / -4.5e-5 | 0.77 / 3.6e-4 | 0.15 / 0.17 |
| SD 2.1 | 0.35 / 0 | 0.20 / -1.3e-5 | 0.09 / 4.2e-6 | 0.038 / -1.3e-6 | 0.20 / 7.1e-5 | 0.42 / 5.4e-6 | 0.35 / -1.8e-5 | 0.20 / 3.5e-5 | 0.82 / 1.0e-3 | 0.30 / 0.37 |
| OA (%) | VISOR (%) | ||||||
|---|---|---|---|---|---|---|---|
| Model | uncond | cond | 1 | 2 | 3 | 4 | |
| GLIDE [12] | 3.36 | 1.98 | 59.06 | 6.72 | 1.02 | 0.17 | 0.03 |
| GLIDE + CDM [16] | 10.17 | 6.43 | 63.21 | 20.07 | 4.69 | 0.83 | 0.11 |
| DALLE-mini [13] | 27.10 | 16.17 | 59.67 | 38.31 | 17.50 | 6.89 | 1.96 |
| CogView2 [14] | 18.47 | 12.17 | 65.89 | 33.47 | 11.43 | 3.22 | 0.57 |
| DALLE-v2 [1] | 63.93 | 37.89 | 59.27 | 73.59 | 47.23 | 23.26 | 7.49 |
| SD [15] | 29.86 | 18.81 | 62.98 | 46.60 | 20.11 | 6.89 | 1.63 |
| SD + CDM [16] | 23.27 | 14.99 | 64.41 | 39.44 | 14.56 | 4.84 | 1.12 |
| SD 2.1 | 47.83 | 30.25 | 63.24 | 64.42 | 35.74 | 16.13 | 4.70 |
| Structured Diffusion [42] | 28.65 | 17.87 | 62.36 | 44.70 | 18.73 | 6.57 | 1.46 |
| Attend-and-Excite [43] | 42.07 | 25.75 | 61.21 | 49.29 | 19.33 | 4.56 | 0.08 |
5 Experiments
In the following experiments, we study state-of-the-art T2I models as baselines, including GLIDE [12], DALLE-mini [13], CogView2 [14], DALLE-v2 [1], and Stable-Diffusion (SD and SD 2.1.) [15], and two versions of Composable Diffusion Models [16] (GLIDE + CDM and SD + CDM). We generate images for each text prompt from our SR2D dataset, to obtain 126,720 images per model and compare performance in terms of OA, VISOR, VISORcond, and VISOR1/2/3/4. We also included two models that use additional knowledge for text-to-image generation. These are: Structured Diffusion [42] which uses constituency parsing and tree structures from linguistics, and Attend-Excite [43] which requires human users to input the indices of the object tokens.
5.1 Ineffectiveness of Existing Metrics
T2I models have been primarily compared in terms of photorealism (purely visual) and human judgment about image quality (subjective). We quantify whether existing automated multimodal metrics are useful for evaluating spatial relationships generated by T2I models. We consider CLIPScore [8] (cosine similarity between image and text embeddings) and image captioning-based evaluation (BLEU [44], METEOR [45], ROUGE [46], CIDER [47], SPICE [48]) which are used by generating a caption for the synthesized image and computing the captioning score with respect to the reference input text . Note that purely visual metrics (FID and Inception Score [6, 5]) ignore the text, while semantic object accuracy [7] ignores all words except nouns, making them incapable of scoring spatial relationships.
Let be the score for where is the generated image and is the input text. Let be the transformed version of obtained by inverting/flipping the spatial relationship in (for example, leftright). Let be the score for . For each metric, we define as the average difference between and over the entire SR2D dataset:
| (6) |
Thus, captures the ability of metric to understand spatial relationships. Table II shows and values for each previous metric and VISOR for each model. It can be seen that, for all previous metrics, is negligible and close to zero, which implies that they return similar scores even if the text is flipped. For some cases, the difference is negative, implying that the score for the image and the flipped caption is higher. On the other hand, the values for VISOR are high implying that VISOR assigns significantly lower scores for the flipped samples. These results establish the need for a new evaluation metric since none of the existing metrics are able to quantify spatial relationships reliably, and show the efficacy of VISOR for this purpose.
5.2 Benchmarking Results
Table III shows the results of benchmarking on our SR2D dataset. We first note that the object accuracy of all models except DALLE-v2 is lower than 30%. While DALLE-v2 (63.93%) significantly outperforms other models, it still shows a large number of failures in generating both objects that are mentioned in the prompt. For the unconditional metrics VISOR and VISOR1/2/3/4, DALLE-v2 is the best performing model. However, in terms of VISORcond, CogView2 has the highest performance. This implies that, although CogView2 is better than other models on those examples where both objects are generated, the large failures of CogView2 in OA result in a lower unconditional VISOR score. VISOR4 is extremely low for all models including DALLE-v2 (), revealing a large gap in performance.
5.3 Human Study
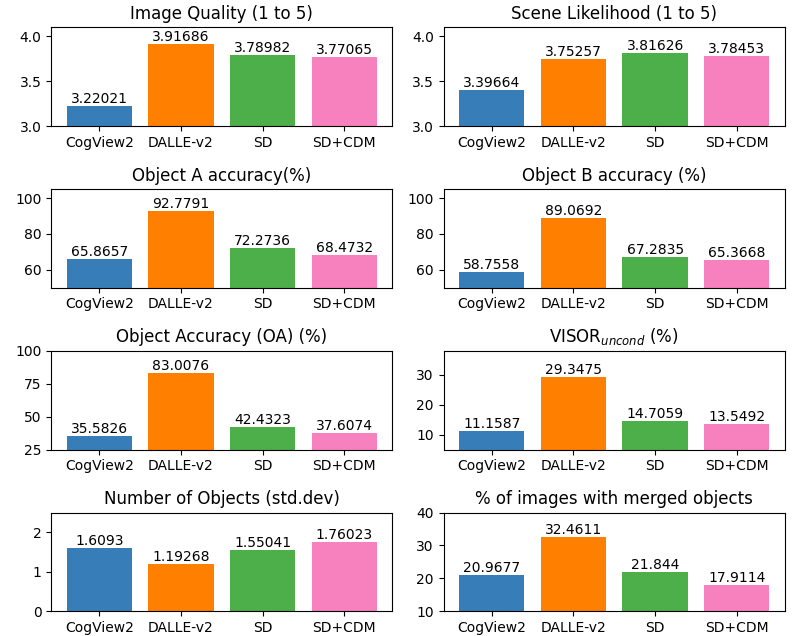
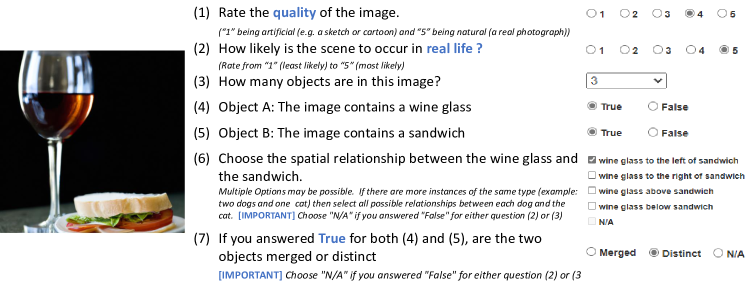
Methodology. We conducted a human evaluation study to understand the alignment of our metrics with human judgment, and to quantify the gap between object detector performance and human assessments of object presence. For the human study, we used four models: CogView2, DALLE-v2, Stable Diffusion (SD), and SD + CDM. Annotators were shown (via Amazon Mechanical Turk) an image generated by one of the four models, and were asked seven questions about it, as shown in Fig. 5. The questions assessed human evaluation of image quality and scene realism (scene likelihood) on a Likert scale (1 through 5), the number of objects, answering True or False for presence of objects, selecting valid spatial relationships, and responding if two objects were merged in the image. We used a sample size of 1000 images per model and 3 workers per sample.
Results. Fig. 4 shows a summary of responses for each question in the human study. While DALLE-v2 received the highest image quality rating, SD and SD+CDM received higher scene likelihood rating. Interestingly, DALLE-v2 also had the largest number of images with merged objects (32.46%); several cases of this phenomenon are shown in Fig. 7. Inter-annotator agreement was high for all questions in terms of majority (agreement between at least 2 out of 3 workers) and unanimous agreement (agreement between all 3 out of 3 workers) as reported in Table IV.
| Response | CogView2 | DALLE-v2 | SD | SD + CDM |
|---|---|---|---|---|
| Image Quality | 65.47 / 52.93 | 75.02 / 62.33 | 69.86 / 55.31 | 72.59 / 57.99 |
| Scene Likelihood | 64.40 / 50.78 | 72.13 / 59.62 | 69.47 / 52.35 | 67.19 / 53.99 |
| Num. Objects | 79.63 / 50.03 | 87.09 / 46.39 | 81.41 / 46.06 | 80.28 / 45.74 |
| Object A | 100.0 / 33.00 | 99.64 / 8.02 | 100.0 / 18.56 | 100.0 / 20.04 |
| Object B | 100.0 / 32.75 | 100.0 / 13.39 | 100.0 / 22.44 | 100.0 / 25.51 |
| Spatial Relation | 100.0 / 23.33 | 100.0 / 47.90 | 100.0 / 30.79 | 100.0 / 25.00 |
| Merged/Distinct | 100.0 / 43.02 | 99.64 / 58.85 | 100.0 / 39.95 | 100.0 / 38.60 |
| Metric | CogView2 | DALLE-v2 | SD | SD-CDM |
|---|---|---|---|---|
| OA | 73.07 | 73.87 | 79.25 | 80.21 |
| VISORuncond | 88.48 | 77.41 | 88.43 | 88.80 |
| VISORcond | 75.02 | 75.62 | 76.95 | 74.69 |
Alignment of VISOR with Human Responses. We observe that the ranking of models in terms of both object accuracy (OA) and VISOR is identical for the human study and for the automated VISOR scores in Table III, i.e. DALLE-v2 SD SD-CDM CogView2. Table V shows the percentage of samples for which responses from humans matched our automated evaluation using object detectors.
6 Analysis
6.1 Qualitative Results.
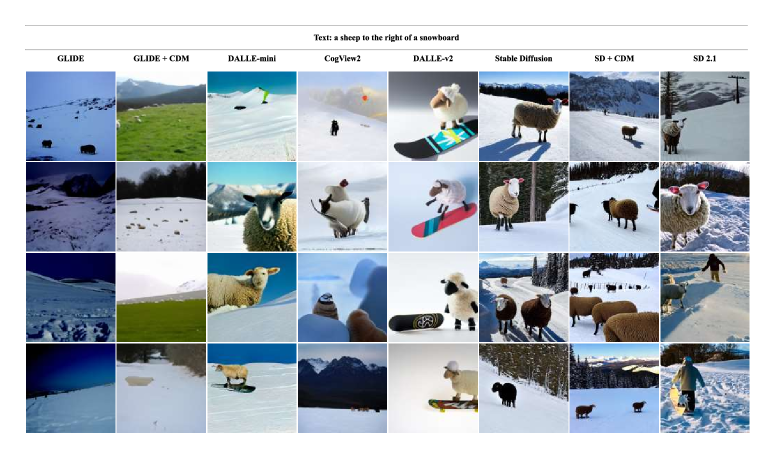
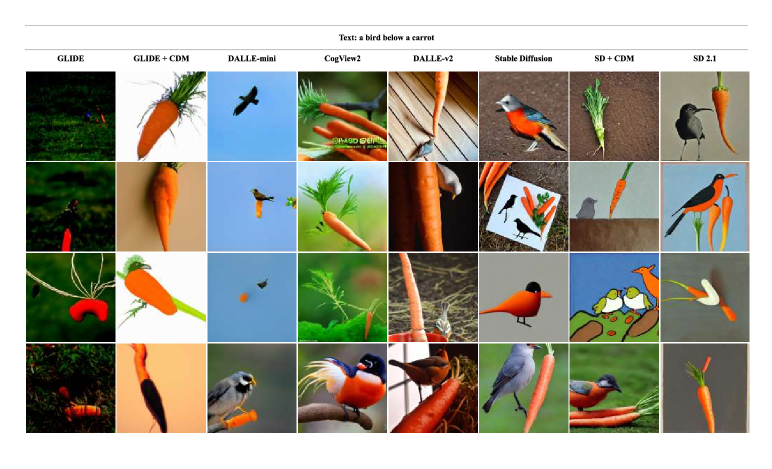
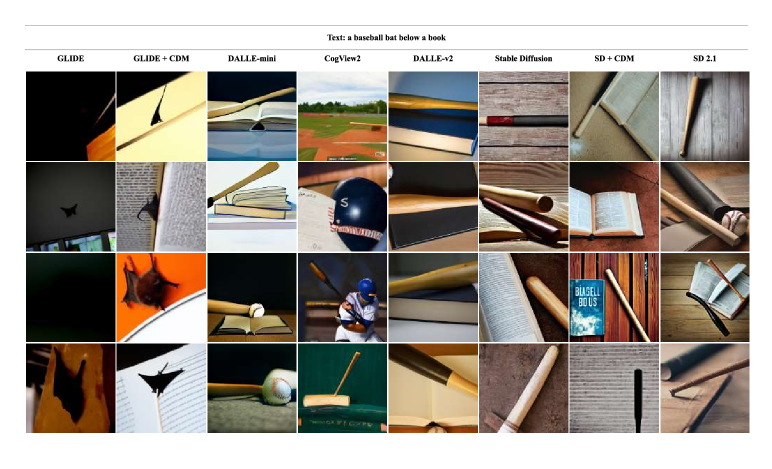
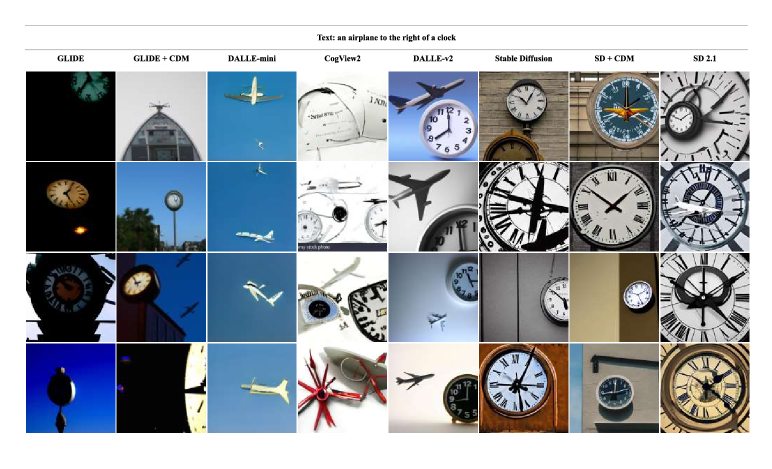
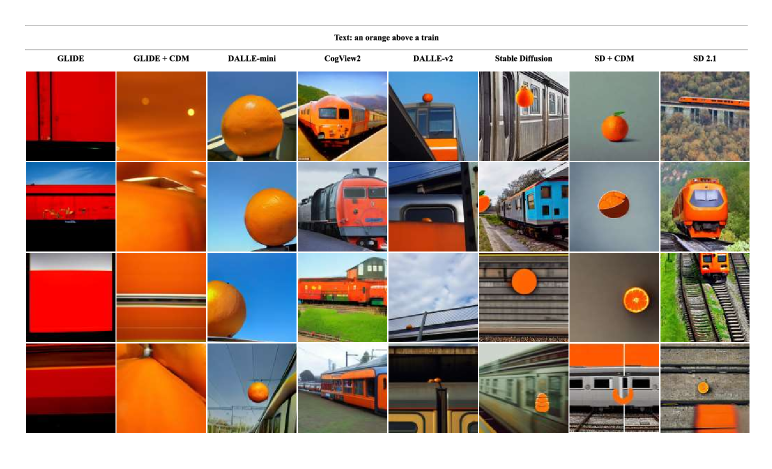
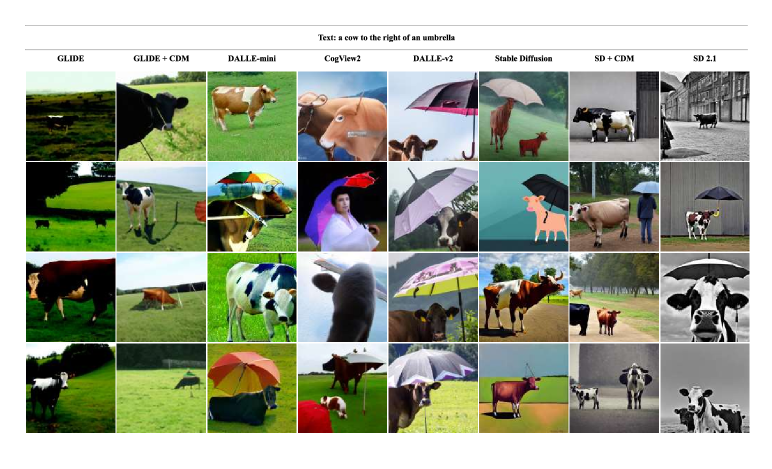
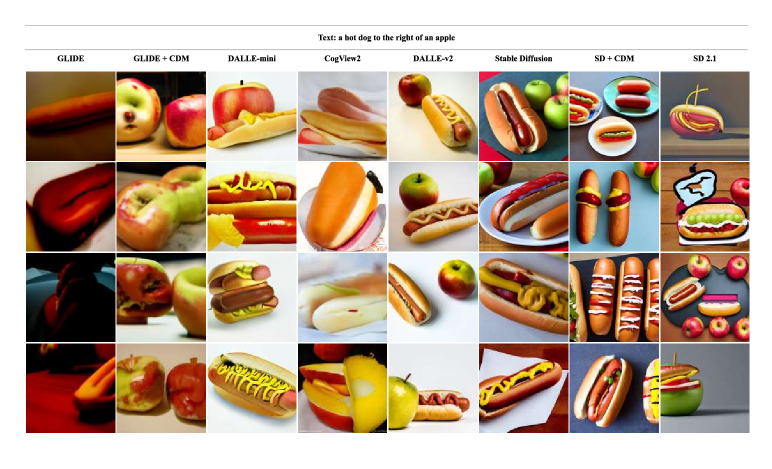
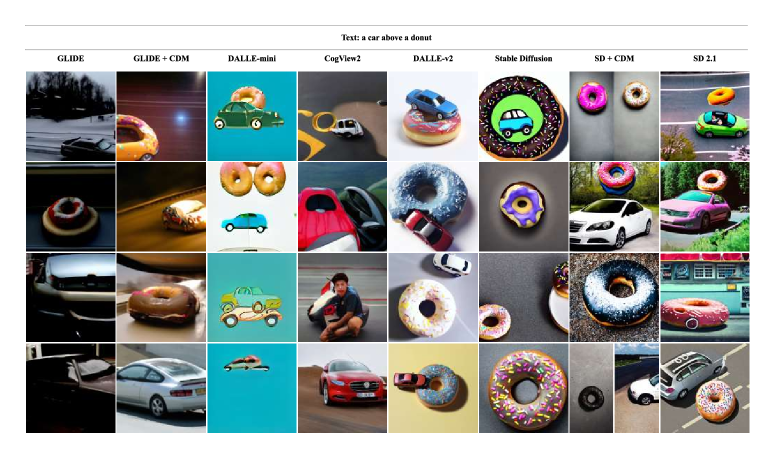
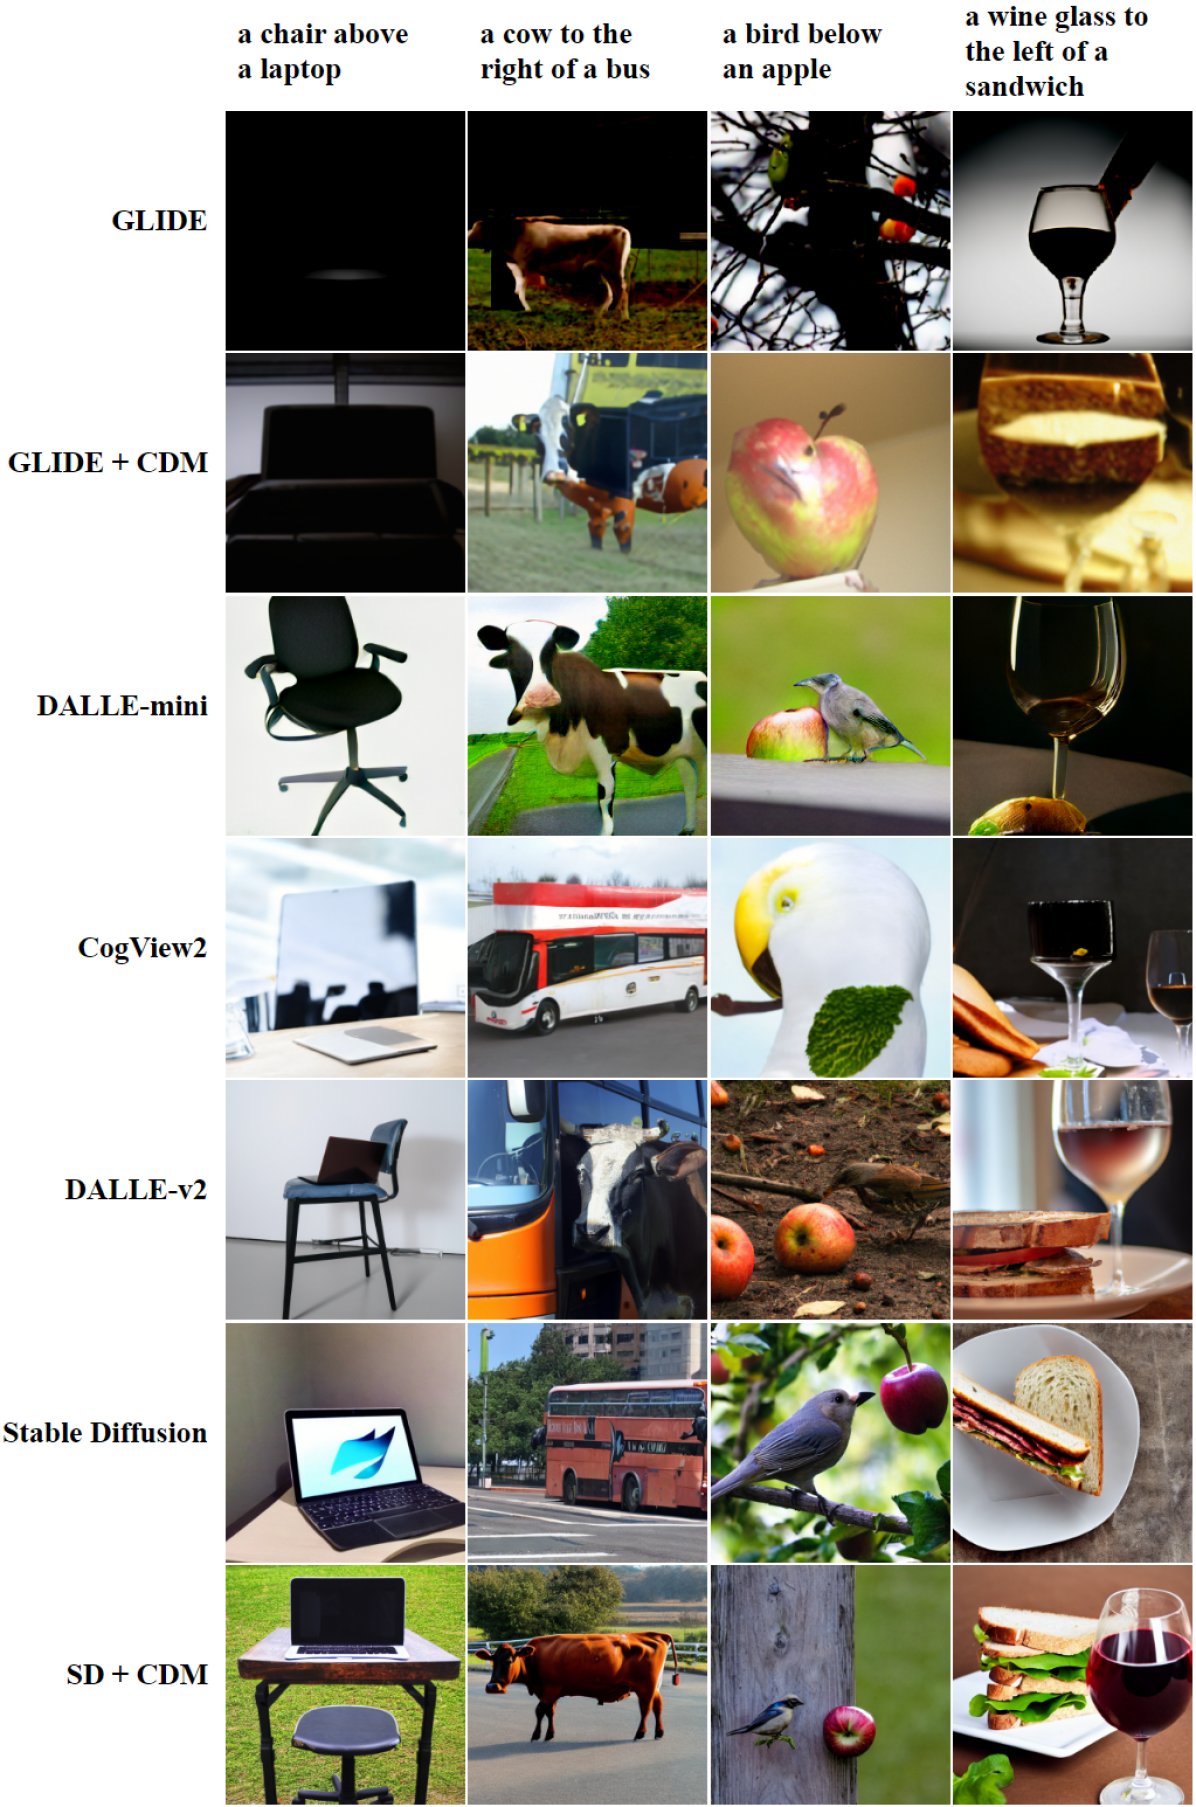
Fig. 6 shows examples of images generated by all baselines for each prompt, with more visualizations in the appendix. Although the photorealism of recent models, such as DALLE-v2, SD, and SD+CDM, is much higher, all models are equally poor at generating accurate spatial relationships.
6.2 Curious Cases
Merged Objects.
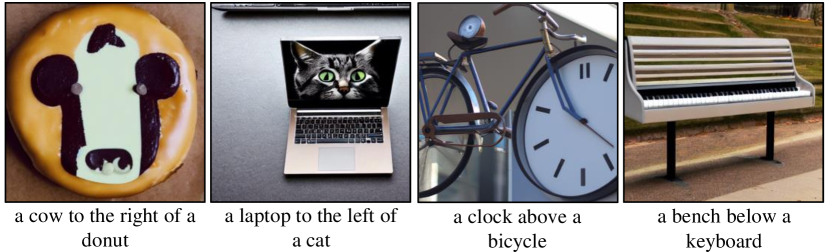
Fig. 7 shows examples of a few common types of merging between objects that we observed, especially with DALLE-v2. Common patterns observed include animals being rendered as patterns on inanimate objects (a, b) and both objects retaining their typical shape but getting merged (c, d). As our human study in Fig. 4 shows, a large proportion (more than 20%) of images have merged objects – this poses a significant challenge for generating distinct objects and their relationships using T2I models.
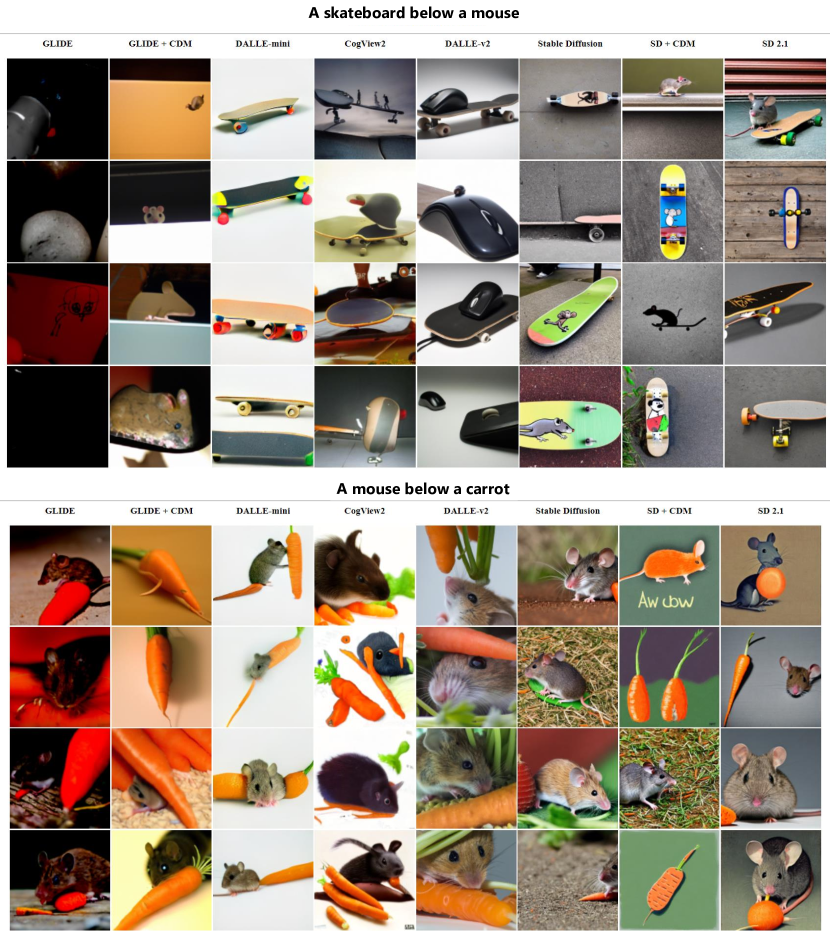
Word Sense Ambiguity. We also observed curious differences between models when generating images for sentences containing words that have different senses, i.e. a different meaning in context. For example, the word “mouse” is often used to mean the animal mouse and also the computer accessory mouse. We observed that different models under different contexts interpreted the word as one of the multiple meanings of that word and generated images accordingly. The first example in Figure 8 shows that for the sentence “A skateboard below a mouse”, GLIDE, SD, SD+CDM and SD 2.1 generated the animal mouse whereas CogView2 and DALLE-v2 generated computer mouse. The SD variants also merged mouse and skateboard in some images by generating a cartoon mouse merged as the design of the skateboard. However for the second example “A mouse below a carrot” all models generated an animal mouse. Similarly the words “kite” and “keyboard” also resulted in generation of two senses – the bird kite vs. the toy kite made of paper and string, and a computer keyboard vs. the musical keys on a piano. As there are several words in the English language (for instance bass, bow, bat, bank, crane, palm, letter, and so on) where word sense ambiguity could affect the outputs of T2I models, this aspect needs to be studied in depth further to improve the experience of users of T2I models.
| Model | VISORcond (%) | Object Accuracy (%) | |||||||
|---|---|---|---|---|---|---|---|---|---|
| left | right | above | below | left | right | above | below | ||
| GLIDE | 57.78 | 61.71 | 60.32 | 56.24 | 3.10 | 3.46 | 3.49 | 3.39 | |
| GLIDE + CDM | 65.37 | 65.46 | 59.40 | 59.84 | 12.78 | 12.46 | 7.75 | 7.68 | |
| DALLE-mini | 57.89 | 60.16 | 63.75 | 56.14 | 22.29 | 21.74 | 33.62 | 30.74 | |
| CogView2 | 68.50 | 68.03 | 63.72 | 62.51 | 20.34 | 19.30 | 17.71 | 16.54 | |
| DALLE-v2 | 56.47 | 56.51 | 60.99 | 63.24 | 64.30 | 64.32 | 65.66 | 61.45 | |
| SD | 64.44 | 62.73 | 61.96 | 62.94 | 29.00 | 29.89 | 32.77 | 27.8 | |
| SD + CDM | 69.05 | 66.52 | 62.51 | 59.94 | 23.66 | 21.17 | 23.66 | 24.61 | |
6.3 Fine-grained Performance Analysis
Performance per relationship is shown in Table VI. Interestingly, five of the seven models have the best VISORcond scores for horizontal relationships (left or right). However, five of the seven models have the best object accuracy for vertical relationships (above or below).
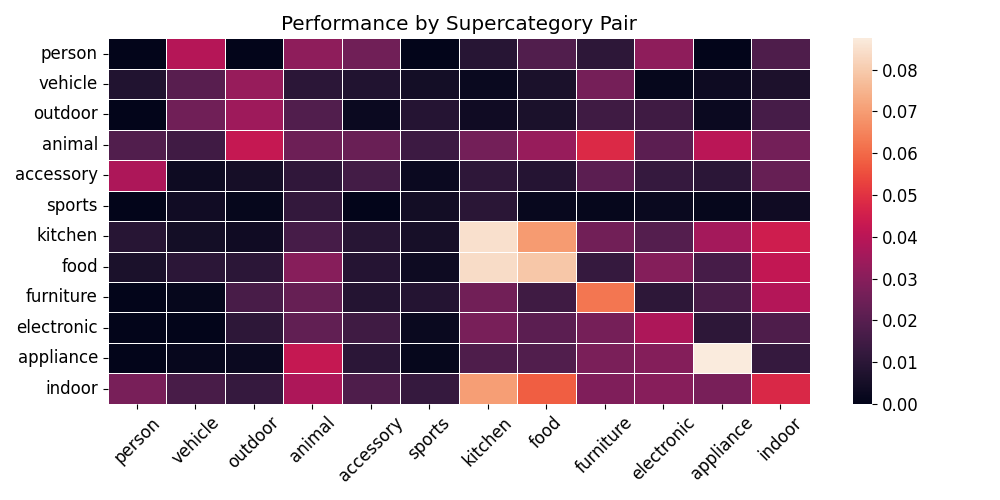
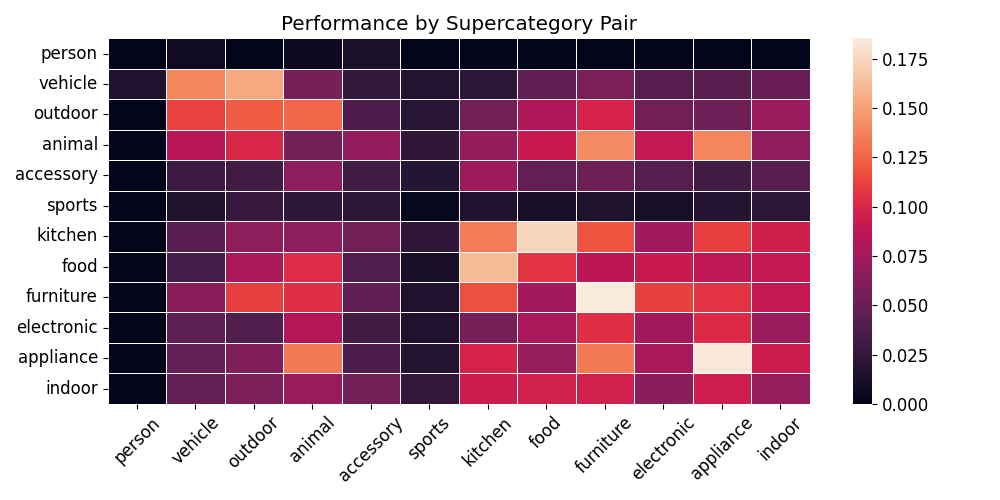
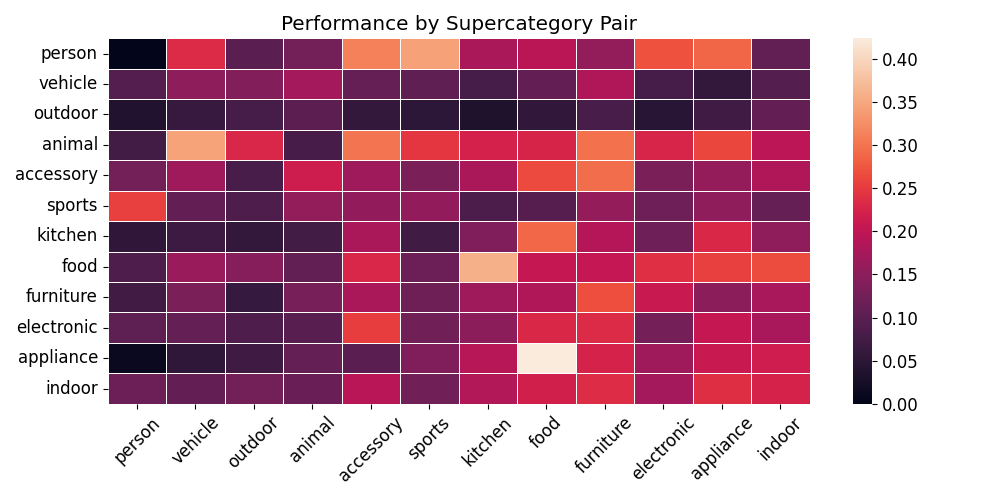
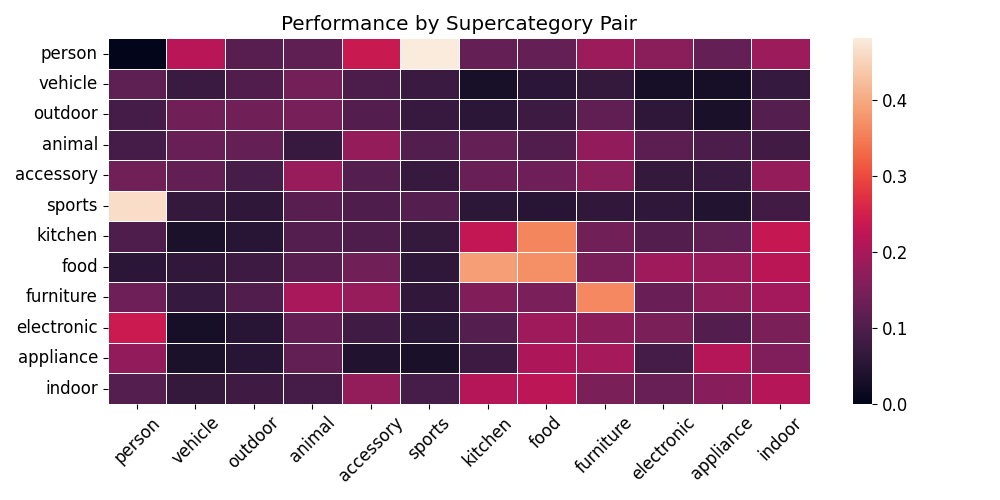
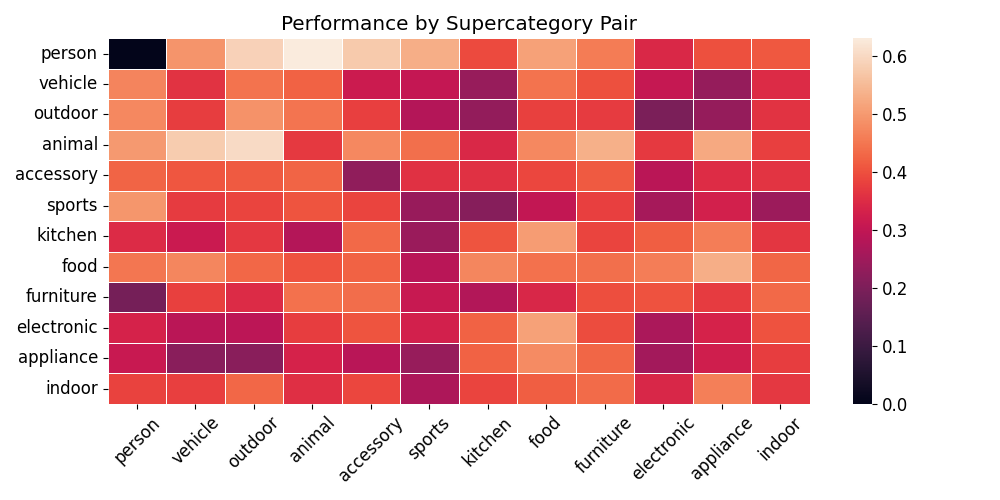
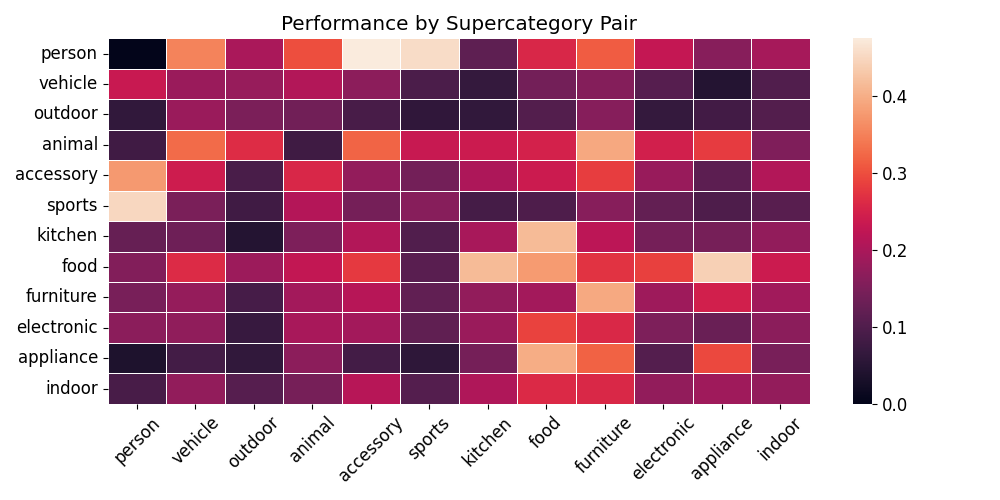
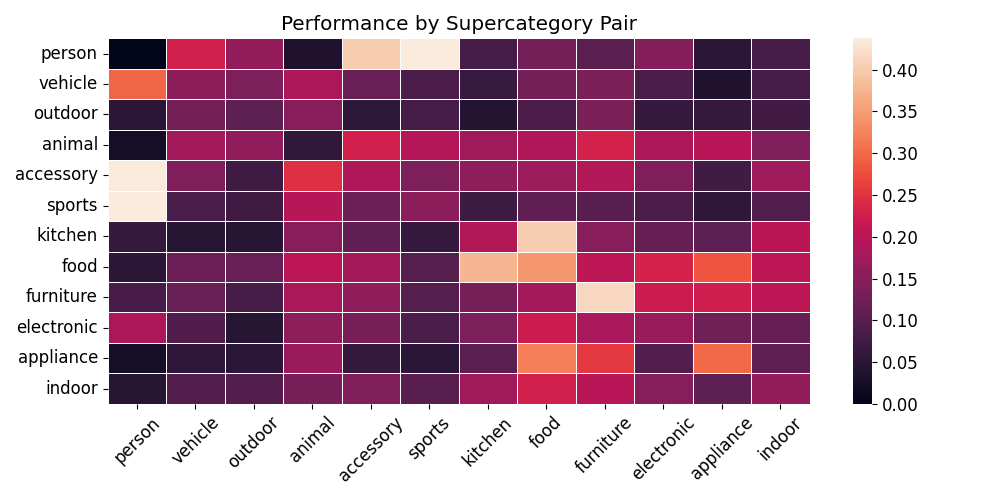
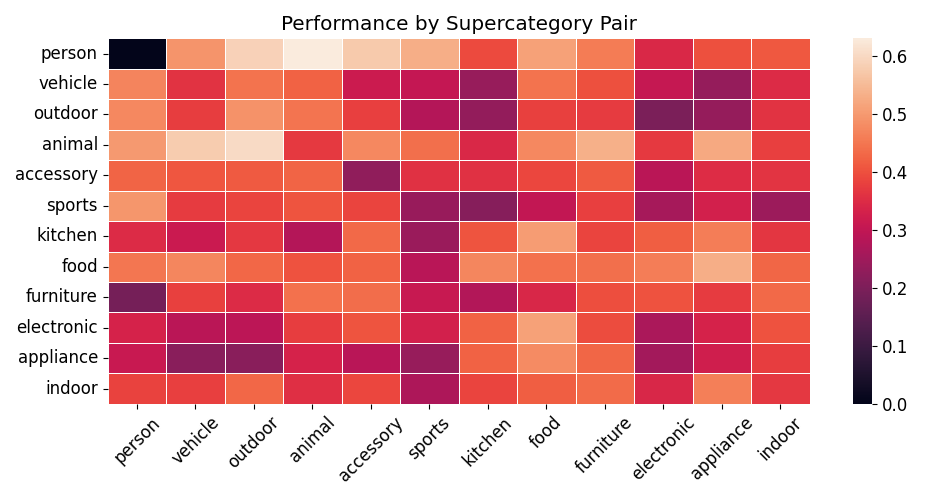
Performance per Supercategory. The 80 object categories in SR2D belong to 11 MS-COCO “supercategories”. We investigate VISOR scores for each supercategory pair and report the results for the best model (DALLE-v2) in Fig. 9 (results for other models are in the appendix). VISOR scores for commonly co-occurring supercategories such as “animal, outdoor” are highest whereas unlikely combinations of indoor-outdoor objects such as “vehicle, appliance” and “electronic, outdoor” have low performance.
6.4 Correlation with Object Co-occurrence Statistics
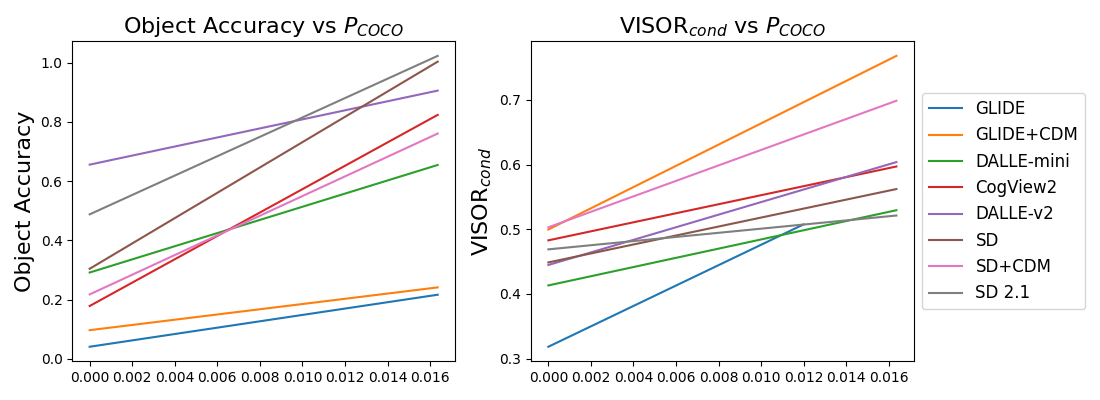
The object categories in our dataset span a wide range of commonly occurring objects from MS-COCO such as wild animals, vehicles, appliances, and humans, found in varying contexts, including combinations that do not appear together often in real life. For instance, an elephant is unlikely to be found indoors near a microwave oven. To understand how object co-occurrence affects VISOR, we first obtain , the probability of co-occurrence for each object pair (A, B) as a proxy for real-world object co-occurrence. Then, we plot the correlation of VISOR and object accuracy for pair (A, B) with its . As Fig. 10 shows, the correlation is positive for all models, for both OA and VISORcond, implying that the quality of outputs is likely to be better for commonly co-occurring objects, clearly establishing a bias towards real-world likelihood. This correlation shows the difficulty in generating unlikely relationships such as “an elephant to the left of a microwave” even though such unlikely combinations may be desired by creators, pursuing artistic compositions.
6.5 Bias and Consistency
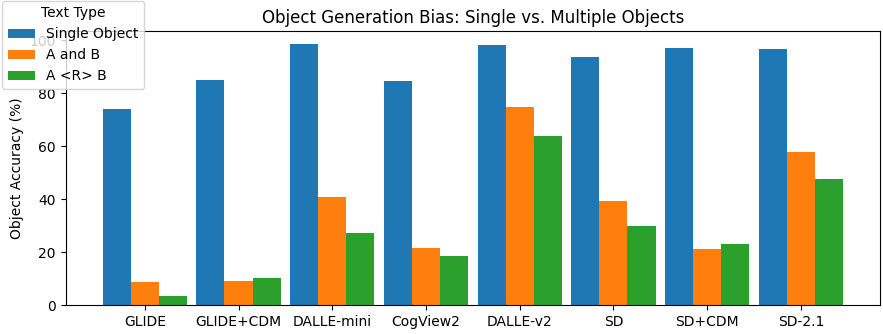
Object Generation Bias. We compare object accuracy with three types of inputs to generate images: (1) single objects text such as “an elephant”, (2) multiple object conjunction such as “an elephant and a cat”, and (3) relational texts such as “an elephant to the right of a cat”. Fig. 11 shows that, for all models, OA is significantly higher for single objects; while composition using conjunction is challenging, systems perform better with this generation than spatial composition.
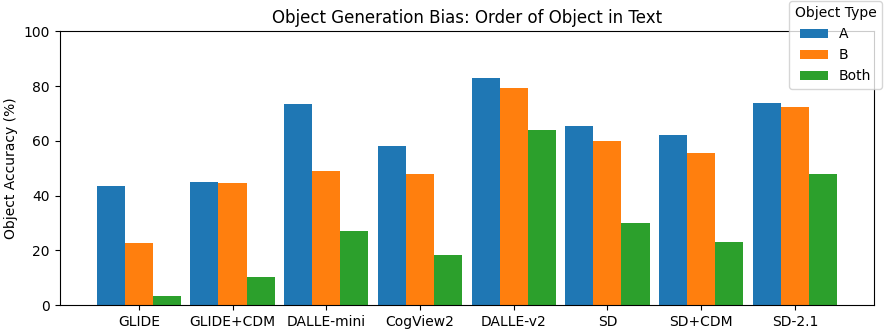
Text-Order Bias. In Fig. 12, we show that for all models, OA for the first mentioned object (A) in the text is significantly higher than OA for the second object (B); generating both objects together is most challenging.
Consistency between equivalent phrases. Ideally, given two equivalent inputs such as “a cat above a dog” and “a dog below a cat”, the model should generate images with the same spatial relationship. To evaluate this consistency, we consider cases in which both objects are detected and report the consistency for each relationship type in Table VII. Surprisingly, the best model DALLE-v2 is the least consistent, while CogView2 is the most consistent model. This result shows that merely rephrasing the input can have a large influence on the spatial correctness of the output.
| Model | left | right | above | below | Average |
|---|---|---|---|---|---|
| GLIDE | 45.90 | 58.93 | 63.16 | 52.63 | 55.16 |
| GLIDE + CDM | 61.99 | 59.15 | 54.79 | 56.15 | 58.02 |
| DALLE-mini | 54.75 | 52.28 | 54.64 | 55.77 | 54.36 |
| CogView2 | 67.32 | 65.38 | 65.67 | 66.95 | 66.33 |
| DALLE-v2 | 48.81 | 48.10 | 48.72 | 48.15 | 48.45 |
| SD | 58.71 | 61.36 | 55.36 | 55.39 | 57.71 |
| SD + CDM | 64.69 | 65.71 | 61.35 | 57.71 | 62.37 |
| SD 2.1 | 53.96 | 55.50 | 54.73 | 54.38 | 54.64 |
6.6 Effect of Linguistic Variation
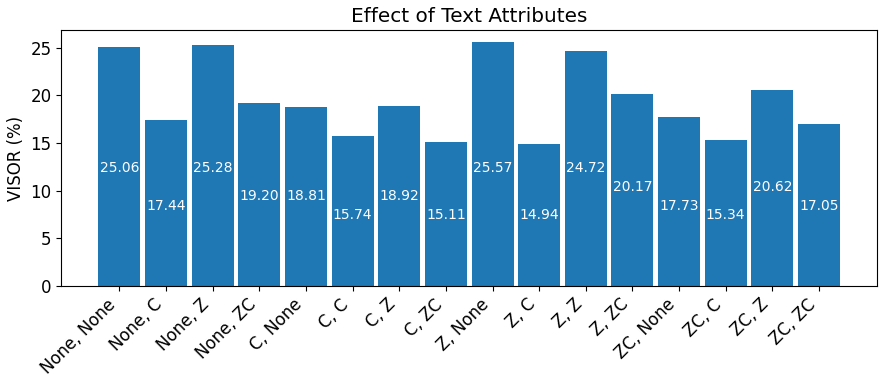
Effect of Attributes on Spatial Understanding. We conduct a case study with Stable Diffusion (SD) to seek an understanding of the impact of sentence complexity on a model’s VISOR performance. We increase the complexity of text prompts by randomly assigning two attributes (size Z and color C) to the object category, via templates of the form [ZA][CA]<A> <R> [ZB][CB]<B>. We focus on 11 object categories representative of each supercategory in COCO, 8 colors, and 4 sizes. As shown in Fig. 13, compared to generation without attributes, there is a drop in performance in 13 out of 15 types of attribute combinations. Addition of the color attribute (C) leads to a large drop in performance. Adding size descriptors (Z) may improve performance. While concurrent work [42] has reported difficulty in attribute binding, our analysis suggests that attributes may negatively influence spatial compositionality.
| OA (%) | VISOR (%) | ||||||
|---|---|---|---|---|---|---|---|
| Prompt Type | uncond | cond | 1 | 2 | 3 | 4 | |
| Phrases | 29.86 | 18.81 | 62.98 | 46.60 | 20.11 | 6.89 | 1.63 |
| Sentences | 32.48 | 20.67 | 63.64 | 48.54 | 22.94 | 8.92 | 2.25 |
| Split Sentences | 24.98 | 16.44 | 65.82 | 41.91 | 16.29 | 5.66 | 1.91 |
Effect of Rephrased Text Prompts. We compare four variations of the prompt:
-
1.
phrases: the default version of SR2D used in Tab. III (e.g. “a cat to the left of a dog”);
-
2.
sentences (e.g. “There is a cat to the left of a dog”), and
-
3.
split sentences (e.g. “There is a cat to the left. There is a dog to the right”). Compared to phrases,
-
4.
rephrasing using Language Models: variations of our prompts from GPT3.5-Turbo
Tab. VIII shows that compared to phrases, sentences have higher OA and VISORcond; while split sentences have lower OA and higher VISORcond. Table IX shows the results of a small-scale experiment where we obtained 3 variations from GPT3.5-Turbo for 500 SR2D prompts (examples shown below) and generated images using SD 2.1. For instance the prompt “an apple below a skateboard” was rephrased as “beneath the skateboard lies an apple” or “a cat to the right of a toaster” was rephrased as “on the right side of a toaster, there is a cat”. The results suggest that with GPT-rephrased prompts, OA is higher but VISOR is lower – hinting that prompt engineering with language models might help object-level evaluation, but still may not enhance spatial understanding.
| OA (%) | VISOR (%) | ||||||
|---|---|---|---|---|---|---|---|
| Dataset | uncond | cond | 1 | 2 | 3 | 4 | |
| Original | 45.83 | 30.47 | 66.49 | 65.69 | 35.62 | 16.34 | 4.25 |
| GPT-rephrased | 46.16 | 29.99 | 64.98 | 63.54 | 35.10 | 16.59 | 4.74 |
These observations of differences in performance by simply rephrasing the prompt are a signal that prompt engineering for grounded generation such as spatial aspects is a promising future direction to be investigated.
7 Discussion and Conclusion
We studied the spatial capabilities of text-to-image generators by introducing spatial relationship metrics (VISOR measures), building a dataset (SR2D), and developing an automated evaluation pipeline. Our experiments reveal that existing T2I models have poor spatial interpretation and rendering abilities, as characterized by their low VISOR scores, making them unreliable for uses that depend on the correctness in generated images of spatial relations specified in prompts. Our analysis also reveals several biases and artifacts of T2I models, such as proclivity for generating single objects (especially the first mentioned object), correlation of spatial correctness with likelihood of object co-occurrence, sensitivity to equivalent phrasings of spatial relations, and negative influences of the inclusion in prompts of several commonly used modifiers. We hope that the metrics, methods, and dataset will help to stimulate a stream of research on the spatial rendering capabilities of generative models, leading to enhancements of these capabilities over time. For uses of today’s technologies, we hope our findings can provide creators with guidance for prompt engineering. We note that the SR2D data generation pipeline can be extended to study spatial relationships of more than two objects, including three-dimensional and complex relations such as inside, outside, contains, behind, in front, covers, touching, as well as semantic and action-based relationships.
One of major findings of this paper is the big gap in expectations from generative models and the grounded abilities of those models. At the same time, we also note that evaluation itself is a significant challenge and our paper is an effort towards revealing those challenges and creating a path towards holistic evaluation. While general purpose scores are easier to implement, they can’t fully assess each skill or ability that is of interest to practitioners. Our dataset and evaluation pipeline offers users a focused evaluation of spatial abilities. We hope the VISOR metric will serve as a complement to prior metrics that evaluate photorealism and image-text similarity. We envision T2I evaluation to proceed in the direction of multi-faceted evaluations that are prevalent in the natural language processing community, such as the GLUE [49] and Super-GLUE [50] benchmarks for natural language understanding.
References
- [1] A. Ramesh, P. Dhariwal, A. Nichol, C. Chu, and M. Chen, “Hierarchical text-conditional image generation with clip latents,” arXiv preprint arXiv:2204.06125, 2022.
- [2] P. Anderson, Q. Wu, D. Teney, J. Bruce, M. Johnson, N. Sünderhauf, I. Reid, S. Gould, and A. Van Den Hengel, “Vision-and-language navigation: Interpreting visually-grounded navigation instructions in real environments,” in Proceedings of the IEEE conference on computer vision and pattern recognition, 2018, pp. 3674–3683.
- [3] O. Mees, A. Emek, J. Vertens, and W. Burgard, “Learning object placements for relational instructions by hallucinating scene representations,” in 2020 IEEE International Conference on Robotics and Automation (ICRA). IEEE, 2020, pp. 94–100.
- [4] S. Nair, E. Mitchell, K. Chen, S. Savarese, C. Finn et al., “Learning language-conditioned robot behavior from offline data and crowd-sourced annotation,” in Conference on Robot Learning. PMLR, 2022, pp. 1303–1315.
- [5] T. Salimans, I. Goodfellow, W. Zaremba, V. Cheung, A. Radford, and X. Chen, “Improved techniques for training gans,” Advances in neural information processing systems, vol. 29, 2016.
- [6] M. Heusel, H. Ramsauer, T. Unterthiner, B. Nessler, and S. Hochreiter, “Gans trained by a two time-scale update rule converge to a local nash equilibrium,” Advances in neural information processing systems, vol. 30, 2017.
- [7] T. Hinz, S. Heinrich, and S. Wermter, “Semantic object accuracy for generative text-to-image synthesis,” IEEE transactions on pattern analysis and machine intelligence, 2020.
- [8] J. Hessel, A. Holtzman, M. Forbes, R. Le Bras, and Y. Choi, “Clipscore: A reference-free evaluation metric for image captioning,” in Proceedings of the 2021 Conference on Empirical Methods in Natural Language Processing, 2021, pp. 7514–7528.
- [9] T. Xu, P. Zhang, Q. Huang, H. Zhang, Z. Gan, X. Huang, and X. He, “Attngan: Fine-grained text to image generation with attentional generative adversarial networks,” in Proceedings of the IEEE conference on computer vision and pattern recognition, 2018, pp. 1316–1324.
- [10] S. Hong, X. Yan, T. E. Huang, and H. Lee, “Learning hierarchical semantic image manipulation through structured representations,” in Advances in Neural Information Processing Systems 31: Annual Conference on Neural Information Processing Systems 2018, NeurIPS 2018, December 3-8, 2018, Montréal, Canada, S. Bengio, H. M. Wallach, H. Larochelle, K. Grauman, N. Cesa-Bianchi, and R. Garnett, Eds., 2018, pp. 2713–2723. [Online]. Available: https://proceedings.neurips.cc/paper/2018/hash/602d1305678a8d5fdb372271e980da6a-Abstract.html
- [11] T.-Y. Lin, M. Maire, S. Belongie, J. Hays, P. Perona, D. Ramanan, P. Dollár, and C. L. Zitnick, “Microsoft coco: Common objects in context,” in European conference on computer vision. Springer, 2014, pp. 740–755.
- [12] A. Q. Nichol, P. Dhariwal, A. Ramesh, P. Shyam, P. Mishkin, B. Mcgrew, I. Sutskever, and M. Chen, “Glide: Towards photorealistic image generation and editing with text-guided diffusion models,” in International Conference on Machine Learning. PMLR, 2022, pp. 16 784–16 804.
- [13] B. Dayma, S. Patil, P. Cuenca, K. Saifullah, T. Abraham, P. Le Khac, L. Melas, and R. Ghosh, “Dall·e mini,” 7 2021. [Online]. Available: https://github.com/borisdayma/dalle-mini
- [14] M. Ding, W. Zheng, W. Hong, and J. Tang, “Cogview2: Faster and better text-to-image generation via hierarchical transformers,” in Advances in Neural Information Processing Systems, A. H. Oh, A. Agarwal, D. Belgrave, and K. Cho, Eds., 2022. [Online]. Available: https://openreview.net/forum?id=GkDbQb6qu_r
- [15] R. Rombach, A. Blattmann, D. Lorenz, P. Esser, and B. Ommer, “High-resolution image synthesis with latent diffusion models,” in Proceedings of the IEEE/CVF Conference on Computer Vision and Pattern Recognition, 2022, pp. 10 684–10 695.
- [16] N. Liu, S. Li, Y. Du, A. Torralba, and J. B. Tenenbaum, “Compositional visual generation with composable diffusion models,” European Conference on Computer Vision, 2022.
- [17] C. Saharia, W. Chan, S. Saxena, L. Li, J. Whang, E. L. Denton, K. Ghasemipour, R. Gontijo Lopes, B. Karagol Ayan, T. Salimans et al., “Photorealistic text-to-image diffusion models with deep language understanding,” Advances in Neural Information Processing Systems, vol. 35, pp. 36 479–36 494, 2022.
- [18] J. Yu, Y. Xu, J. Y. Koh, T. Luong, G. Baid, Z. Wang, V. Vasudevan, A. Ku, Y. Yang, B. K. Ayan, B. Hutchinson, W. Han, Z. Parekh, X. Li, H. Zhang, J. Baldridge, and Y. Wu, “Scaling autoregressive models for content-rich text-to-image generation,” Transactions on Machine Learning Research, 2022, featured Certification. [Online]. Available: https://openreview.net/forum?id=AFDcYJKhND
- [19] S. Reed, Z. Akata, X. Yan, L. Logeswaran, B. Schiele, and H. Lee, “Generative adversarial text to image synthesis,” in International conference on machine learning. PMLR, 2016, pp. 1060–1069.
- [20] H. Zhang, T. Xu, H. Li, S. Zhang, X. Wang, X. Huang, and D. N. Metaxas, “Stackgan: Text to photo-realistic image synthesis with stacked generative adversarial networks,” in Proceedings of the IEEE international conference on computer vision, 2017, pp. 5907–5915.
- [21] P. Welinder, S. Branson, T. Mita, C. Wah, F. Schroff, S. Belongie, and P. Perona, “Caltech-ucsd birds 200,” Caltech, Tech. Rep. CNS-TR-201, 2010. [Online]. Available: /se3/wp-content/uploads/2014/09/WelinderEtal10_CUB-200.pdf,http://www.vision.caltech.edu/visipedia/CUB-200.html
- [22] M.-E. Nilsback and A. Zisserman, “Automated flower classification over a large number of classes,” in 2008 Sixth Indian Conference on Computer Vision, Graphics & Image Processing. IEEE, 2008, pp. 722–729.
- [23] A. Agrawal, D. Batra, D. Parikh, and A. Kembhavi, “Don’t just assume; look and answer: Overcoming priors for visual question answering,” in 2018 IEEE Conference on Computer Vision and Pattern Recognition, CVPR 2018, Salt Lake City, UT, USA, June 18-22, 2018. IEEE Computer Society, 2018, pp. 4971–4980. [Online]. Available: http://openaccess.thecvf.com/content_cvpr_2018/html/Agrawal_Dont_Just_Assume_CVPR_2018_paper.html
- [24] C. Kervadec, G. Antipov, M. Baccouche, and C. Wolf, “Roses are red, violets are blue… but should vqa expect them to?” in Proceedings of the IEEE/CVF Conference on Computer Vision and Pattern Recognition, 2021, pp. 2776–2785.
- [25] L. A. Hendricks, K. Burns, K. Saenko, T. Darrell, and A. Rohrbach, “Women also snowboard: Overcoming bias in captioning models,” in European Conference on Computer Vision. Springer, 2018, pp. 793–811.
- [26] J. Zhao, T. Wang, M. Yatskar, V. Ordonez, and K.-W. Chang, “Men also like shopping: Reducing gender bias amplification using corpus-level constraints,” in Proceedings of the 2017 Conference on Empirical Methods in Natural Language Processing. Copenhagen, Denmark: Association for Computational Linguistics, 2017, pp. 2979–2989. [Online]. Available: https://www.aclweb.org/anthology/D17-1323
- [27] K. Ye and A. Kovashka, “A case study of the shortcut effects in visual commonsense reasoning,” in Proceedings of the AAAI conference on artificial intelligence, vol. 35, no. 4, 2021, pp. 3181–3189.
- [28] A. Ray, K. Sikka, A. Divakaran, S. Lee, and G. Burachas, “Sunny and dark outside?! improving answer consistency in VQA through entailed question generation,” in Proceedings of the 2019 Conference on Empirical Methods in Natural Language Processing and the 9th International Joint Conference on Natural Language Processing (EMNLP-IJCNLP). Hong Kong, China: Association for Computational Linguistics, 2019, pp. 5860–5865. [Online]. Available: https://www.aclweb.org/anthology/D19-1596
- [29] T. Gokhale, P. Banerjee, C. Baral, and Y. Yang, “Vqa-lol: Visual question answering under the lens of logic,” in Computer Vision–ECCV 2020: 16th European Conference, Glasgow, UK, August 23–28, 2020, Proceedings, Part XXI 16. Springer, 2020, pp. 379–396.
- [30] V. Goel, M. Chandak, A. Anand, and P. Guha, “Iq-vqa: intelligent visual question answering,” in Pattern Recognition. ICPR International Workshops and Challenges: Virtual Event, January 10–15, 2021, Proceedings, Part II. Springer, 2021, pp. 357–370.
- [31] R. Liu, C. Liu, Y. Bai, and A. L. Yuille, “Clevr-ref+: Diagnosing visual reasoning with referring expressions,” in IEEE Conference on Computer Vision and Pattern Recognition, CVPR 2019, Long Beach, CA, USA, June 16-20, 2019. Computer Vision Foundation / IEEE, 2019, pp. 4185–4194. [Online]. Available: http://openaccess.thecvf.com/content_CVPR_2019/html/Liu_CLEVR-Ref_Diagnosing_Visual_Reasoning_With_Referring_Expressions_CVPR_2019_paper.html
- [32] F. Liu, G. E. T. Emerson, and N. Collier, “Visual spatial reasoning,” Transactions of the Association for Computational Linguistics, 2023.
- [33] J. Johnson, B. Hariharan, L. van der Maaten, L. Fei-Fei, C. L. Zitnick, and R. B. Girshick, “CLEVR: A diagnostic dataset for compositional language and elementary visual reasoning,” in 2017 IEEE Conference on Computer Vision and Pattern Recognition, CVPR 2017, Honolulu, HI, USA, July 21-26, 2017. IEEE Computer Society, 2017, pp. 1988–1997. [Online]. Available: https://doi.org/10.1109/CVPR.2017.215
- [34] D. A. Hudson and C. D. Manning, “Compositional attention networks for machine reasoning,” in 6th International Conference on Learning Representations, ICLR 2018, Vancouver, BC, Canada, April 30 - May 3, 2018, Conference Track Proceedings. OpenReview.net, 2018. [Online]. Available: https://openreview.net/forum?id=S1Euwz-Rb
- [35] H. Chen, A. Suhr, D. Misra, N. Snavely, and Y. Artzi, “Touchdown: Natural language navigation and spatial reasoning in visual street environments,” in Proceedings of the IEEE/CVF Conference on Computer Vision and Pattern Recognition, 2019, pp. 12 538–12 547.
- [36] C. Conwell and T. Ullman, “Testing relational understanding in text-guided image generation,” arXiv preprint arXiv:2208.00005, 2022.
- [37] J. Cho, A. Zala, and M. Bansal, “Dall-eval: Probing the reasoning skills and social biases of text-to-image generative transformers,” arXiv preprint arXiv:2202.04053, 2022.
- [38] G. Marcus, E. Davis, and S. Aaronson, “A very preliminary analysis of dall-e 2,” arXiv preprint arXiv:2204.13807, 2022.
- [39] E. Leivada, E. Murphy, and G. Marcus, “Dall-e 2 fails to reliably capture common syntactic processes,” arXiv preprint arXiv:2210.12889, 2022.
- [40] M. Minderer, A. Gritsenko, A. Stone, M. Neumann, D. Weissenborn, A. Dosovitskiy, A. Mahendran, A. Arnab, M. Dehghani, Z. Shen, X. Wang, X. Zhai, T. Kipf, and N. Houlsby, “Simple open-vocabulary object detection with vision transformers,” arXiv preprint arXiv:2205.06230, 2022.
- [41] N. Carion, F. Massa, G. Synnaeve, N. Usunier, A. Kirillov, and S. Zagoruyko, “End-to-end object detection with transformers,” in European conference on computer vision. Springer, 2020, pp. 213–229.
- [42] W. Feng, X. He, T.-J. Fu, V. Jampani, A. R. Akula, P. Narayana, S. Basu, X. E. Wang, and W. Y. Wang, “Training-free structured diffusion guidance for compositional text-to-image synthesis,” in The Eleventh International Conference on Learning Representations, 2022.
- [43] H. Chefer, Y. Alaluf, Y. Vinker, L. Wolf, and D. Cohen-Or, “Attend-and-excite: Attention-based semantic guidance for text-to-image diffusion models,” 2023.
- [44] K. Papineni, S. Roukos, T. Ward, and W.-J. Zhu, “Bleu: a method for automatic evaluation of machine translation,” in Proceedings of the 40th Annual Meeting of the Association for Computational Linguistics. Philadelphia, Pennsylvania, USA: Association for Computational Linguistics, 2002, pp. 311–318. [Online]. Available: https://www.aclweb.org/anthology/P02-1040
- [45] S. Banerjee and A. Lavie, “METEOR: An automatic metric for MT evaluation with improved correlation with human judgments,” in Proceedings of the ACL Workshop on Intrinsic and Extrinsic Evaluation Measures for Machine Translation and/or Summarization. Ann Arbor, Michigan: Association for Computational Linguistics, 2005, pp. 65–72. [Online]. Available: https://www.aclweb.org/anthology/W05-0909
- [46] C.-Y. Lin, “ROUGE: A package for automatic evaluation of summaries,” in Text Summarization Branches Out. Barcelona, Spain: Association for Computational Linguistics, 2004, pp. 74–81. [Online]. Available: https://www.aclweb.org/anthology/W04-1013
- [47] R. Vedantam, C. Lawrence Zitnick, and D. Parikh, “Cider: Consensus-based image description evaluation,” in Proceedings of the IEEE conference on computer vision and pattern recognition, 2015, pp. 4566–4575.
- [48] P. Anderson, B. Fernando, M. Johnson, and S. Gould, “Spice: Semantic propositional image caption evaluation,” in European conference on computer vision. Springer, 2016, pp. 382–398.
- [49] A. Wang, A. Singh, J. Michael, F. Hill, O. Levy, and S. R. Bowman, “GLUE: A multi-task benchmark and analysis platform for natural language understanding,” in 7th International Conference on Learning Representations, ICLR 2019, New Orleans, LA, USA, May 6-9, 2019. OpenReview.net, 2019. [Online]. Available: https://openreview.net/forum?id=rJ4km2R5t7
- [50] A. Wang, Y. Pruksachatkun, N. Nangia, A. Singh, J. Michael, F. Hill, O. Levy, and S. Bowman, “Superglue: A stickier benchmark for general-purpose language understanding systems,” Advances in neural information processing systems, vol. 32, 2019.
In this appendix we provide more details about the SR2D dataset, additional experimental results and analyses, updates to the benchmark, proofs, and qualitative examples.
Appendix A Additional Details about the SR2D Dataset
List of COCO categories. In the SR2D dataset we use 80 object categories from the MS-COCO dataset as the set of objects . The box below lists all of these categories.
person, bicycle, car, motorcycle, airplane, bus, train, truck, boat, traffic light, fire hydrant, stop sign, parking meter, bench, bird, cat, dog, horse, sheep, cow, elephant, bear, zebra, giraffe, backpack, umbrella, handbag, tie, suitcase, frisbee, skis, snowboard, sports ball, kite, baseball bat, baseball glove, skateboard, surfboard, tennis racket, bottle, wine glass, cup, fork, knife, spoon, bowl, banana, apple, sandwich, orange, broccoli, carrot, hot dog, pizza, donut, cake, chair, couch, potted plant, bed, dining table, toilet, tv, laptop, mouse, remote, keyboard, cell phone, microwave, oven, toaster, sink, refrigerator, book, clock, vase, scissors, teddy bear, hair drier, toothbrush
List of COCO supercategories. In Figure 9 in the main paper, we presented results for each supercategory. The box below lists these eleven supercategories.
person, vehicle, outdoor, animal, accessory, sports, kitchen, food, furniture, electronic, appliance, indoor
Appendix B Experimental Setup for “Effect of Attributes on Spatial Understanding”.
In Figure 13, we compared VISOR scores for text prompts with and without size and color attributes. We used one object category for 11 supercategories for this analysis. Note that we ignore the person category since colors are not typically used as attributes for people (for example “purple person”) and to avoid any potentially racist stereotypes associated with skin color to percolate into our generated images. Table X shows the object categories that we used:
| Supercategory | vehicle | outdoor | animal | accessory | sports | kitchen | food | furniture | electronic | appliance | indoor |
| Category | car | bench | dog | suitcase | sports ball | cup | cake | chair | laptop | microwave | book |
Appendix C Proof of Equation 4
Equation 4 states the following relationship between VISOR and VISORn.
| (7) |
Proof. First, we restate the definitions of VISOR and VISORn below.
| (8) |
| (9) |
Let be the total number of text prompts used for evaluating VISOR of a text-to-image model. For a model that generates images per prompt, we have total generated images. Let be the number of images for which , i.e. images for which . From Eq. 8, it is clear that
| (10) |
Appendix D Additional Experiments
D.1 Performance Per Supercategory.
Fig. 16 shows the performance per supercategory for all seven models.
D.2 Benchmarking using COCO-finetuned Object Detectors.
| OA (%) | VISOR (%) | ||||||
|---|---|---|---|---|---|---|---|
| Model | uncond | cond | 1 | 2 | 3 | 4 | |
| GLIDE | 0.23 | 2.54 | 0.12 | 0.47 | 0.02 | 0.00 | 0.00 |
| GLIDE+CDM | 1.49 | 5.09 | 0.82 | 2.90 | 0.33 | 0.04 | 0.01 |
| DALLE-mini | 6.91 | 3.16 | 3.67 | 11.34 | 2.65 | 0.62 | 0.08 |
| CogView2 | 4.75 | 6.86 | 2.70 | 8.85 | 1.62 | 0.29 | 0.04 |
| DALLE-v2 | 14.80 | 3.92 | 7.98 | 22.84 | 6.95 | 1.80 | 0.32 |
| SD | 14.17 | 7.14 | 8.09 | 23.37 | 6.91 | 1.73 | 0.37 |
| SD+CDM | 11.06 | 9.34 | 6.56 | 19.49 | 5.13 | 1.40 | 0.22 |
In the main paper, we used the open-vocabulary object detector OWL-ViT [40] as the oracle to localize objects and identify their spatial relationships. In this section, we replicate these benchmarking experiments by using DETR-Resnet-50 [41], finetuned on the MS-COCO dataset. Results are shown in Tab. XI. The findings are similar using OWLViT. In terms of OA and VISOR (unconditional), DALLE-v2 [1] is the best performing model. However conditional VISOR for DALLE-v2 is low, but higher for CogView [14], SD [15], and SD+CDM [16]. This result shows that irrespective of the object detector, the relative performance comparison and rankings of models obtained via VISOR are consistent. While the oracle object detector does set an upper-bound for VISOR, it can be seamlessly swapped with any newer and more sophisticated object detectors that may be developed in the future.
D.3 Effect of Confidence Threshold.
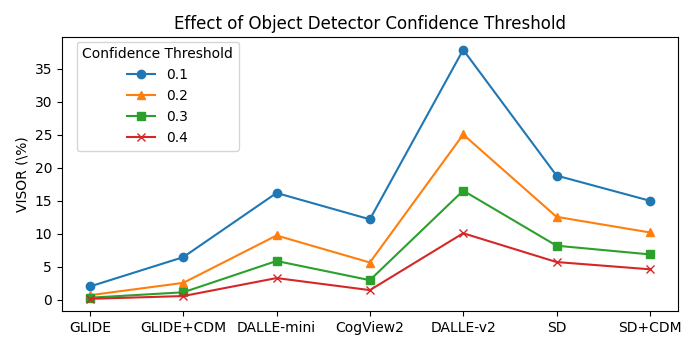
We study how the confidence threshold of the object detector affects VISOR performance. In Fig. 14 we plot the VISOR scores for each model for four values of confidence threshold: , , , and . For a higher (stricter) threshold, naturally, the VISOR score is lower, since fewer objects will be detected than at a lower confidence value. However, the trend and relative performance of the models are identical irrespective of the confidence threshold, leading to consistency in the rankings of models in terms of VISOR score, validating the use of oracle object detectors for computing VISOR score. This also implies that in the future, more sophisticated object detection models that may be developed can be incorporated in the VISOR computation pipeline to replace older detectors.
| Original | GPT-Variation |
|---|---|
| an apple below a skateboard |
(1) Beneath the skateboard lies an apple.
(2) An apple rests underneath a skateboard. |
| a cat to the right of a toaster |
(1) A cat positioned on the right side of a toaster.
(2) On the right side of a toaster, there is a cat. |
D.4 UPDATE: Comparison with new spatially-focused methods.
After the first version of this preprint was released, more variants of text-to-image generation models have been developed. Two of these: Structured Diffusion [42] and Attend-and-Excite [43] are focused on spatial aspects of the image and are therefore very relevant to the benchmark. The availability of our dataset and metric will aid in comparing these or future models in terms of spatial reasoning. Table XIII shows the comparitive results with the models in our previous study.
| OA (%) | VISOR (%) | ||||||
|---|---|---|---|---|---|---|---|
| Model | uncond | cond | 1 | 2 | 3 | 4 | |
| GLIDE [12] | 3.36 | 1.98 | 59.06 | 6.72 | 1.02 | 0.17 | 0.03 |
| GLIDE + CDM [16] | 10.17 | 6.43 | 63.21 | 20.07 | 4.69 | 0.83 | 0.11 |
| DALLE-mini [13] | 27.10 | 16.17 | 59.67 | 38.31 | 17.50 | 6.89 | 1.96 |
| CogView2 [14] | 18.47 | 12.17 | 65.89 | 33.47 | 11.43 | 3.22 | 0.57 |
| DALLE-v2 [1] | 63.93 | 37.89 | 59.27 | 73.59 | 47.23 | 23.26 | 7.49 |
| SD [15] | 29.86 | 18.81 | 62.98 | 46.60 | 20.11 | 6.89 | 1.63 |
| SD + CDM [16] | 23.27 | 14.99 | 64.41 | 39.44 | 14.56 | 4.84 | 1.12 |
| SD 2.1 | 47.83 | 30.25 | 63.24 | 64.42 | 35.74 | 16.13 | 4.70 |
| Structured Diffusion [42] | 28.65 | 17.87 | 62.36 | 44.70 | 18.73 | 6.57 | 1.46 |
| Attend-and-Excite [43] | 42.07 | 25.75 | 61.21 | 49.29 | 19.33 | 4.56 | 0.08 |
| OA (%) | VISOR (%) | ||||||
|---|---|---|---|---|---|---|---|
| Dataset | uncond | cond | 1 | 2 | 3 | 4 | |
| Original | 45.83 | 30.47 | 66.49 | 65.69 | 35.62 | 16.34 | 4.25 |
| GPT-rephrased | 46.16 | 29.99 | 64.98 | 63.54 | 35.10 | 16.59 | 4.74 |
D.5 Linguistic Variations with Large Language Models.
Our SR2D dataset offers a controlled evaluation without ambiguity or noise. However recent advances in generative language models have given us access to automated ways to rephrase our prompts. In a small experiment, we obtaining 3 variations from GPT3.5-Turbo for 500 SR2D prompts and generated images using Stable Diffusion 2.1. Examples of the GPT-rephrased text promps are shown in Tab. XII. We compare VISOR scores of GPT-rephrased vs. original prompts in Tab. XIV and find that with GPT-rephrased prompts, OA is higher but VISOR is lower – hinting that prompt engineering with LLMs might help object-level evaluation, but still may not enhance spatial understanding.
Appendix E Survey of Prior Work on T2I Evaluation
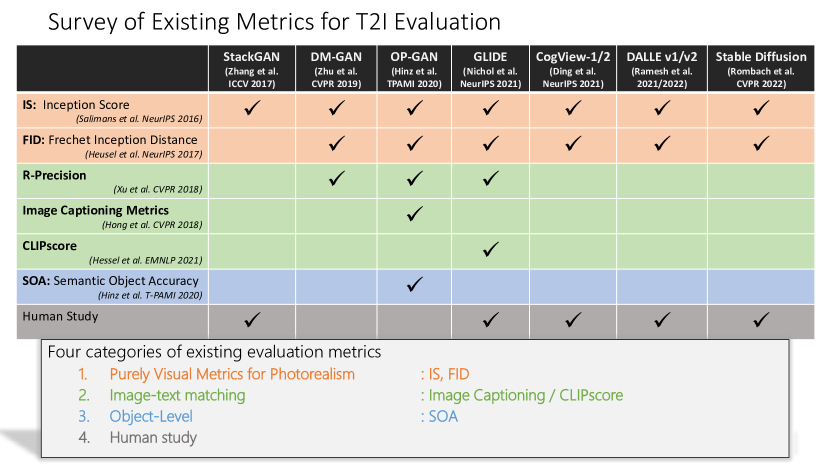
Text-to-image synthesis is a relatively new area of research but has seen an explosion in interest and unprecedented improvements in the quality of generated outputs. In Fig. 15 we overview existing evaluation metrics for T2I and their used by seminal T2I models from 2017 to 2022. We categorize these metrics into four broad categories: purely visual metrics, image-text matching, object-level evaluation, and human studies.
Appendix F Visualization of Generated Images
We would like readers to view more examples via our anonymous project page visort2i.github.io, or the webpage viz.html found in the accompanying .zip file. These webpages contain additional visualizations of images generated by our benchmark models for text prompts from the SR2D dataset. In this section we visualize some of these examples and show all images generated by each model, in Figs. 17, 18, 19, 20, 21, 22, 23 and 24.