Anisotropic correlation functions as tracers of central galaxy alignments in simulations
Abstract
Motivated by observational results, we use IllustrisTNG hydrodynamical numerical simulations to study the alignment of the central galaxies in groups with the surrounding structures. This approach allows us to analyse galaxy and group properties not available in observations. To perform this analysis, we use a modified version of the two-point cross-correlation function and a measure of the angle between the semi-major axes of the central galaxies and the larger structures. Overall, our results reproduce observational ones, as we find large-scale anisotropy, which is dominated by the red central galaxies. In addition, the latter is noticeably more aligned with their group than the blue ones. In contrast to the observations, we find a strong dependence of the anisotropy on the central galaxy with mass, probably associated with the inability of observational methods to determine them. This result allows us to link the alignment to the process of halo assembly and the well-known dependence of halo anisotropy on mass. When we include the dark matter distribution in our analysis, we conclude that the galaxy alignment found in simulations (and observations) can be explained by a combination of physical processes at different scales: the central galaxy aligns with the dark matter halo it inhabits, and this, in turn, aligns with the surrounding structures at large scales.
keywords:
large-scale structure of Universe – methods: statistical – galaxies: haloes – dark matter – Galaxies: groups: general1 Introduction
The shapes and angular momentum of dark matter halos are driven by accretion and tidal processes with the surrounding matter (Ciotti & Dutta, 1994; Usami & Fujimoto, 1997; Porciani et al., 2002a; Fleck & Kuhn, 2003). In this context, galaxies form and evolve in the potential well of dark matter halos and, in consequence, tend to follow a preferential shape, orientation and distribution (Pen et al., 2000; Catelan et al., 2001; Crittenden et al., 2001; Porciani et al., 2002b; Jing, 2002; Ciotti & Dutta, 1994; Usami & Fujimoto, 1997; Porciani et al., 2002a; Fleck & Kuhn, 2003). These features imprint information on the way the environment influences their formation history.
Observational evidence shows that galaxy alignments vary according to their colours, luminosity and star formation history. In particular, early-type/red galaxies tend to be more aligned with the large-scale dark matter distribution as a consequence of their build-up of matter, than late-type/blue galaxies (see, e.g., Sales & Lambas, 2004; Yang et al., 2006; Agustsson & Brainerd, 2010; Kirk et al., 2015). On the other hand, several works show that satellite galaxies tend to be distributed along the galactic plane of the central galaxies (Yang et al., 2005; Wang et al., 2008; Libeskind et al., 2015; Welker et al., 2018; Pawlowski, 2018), and red satellite galaxies are more aligned when the central one is red than when it is blue (Kiessling et al., 2015; Kirk et al., 2015; Johnston et al., 2019). The dependence on the galaxy colours is referred as anisotropic quenching and angular conformity in several works (see Wang et al., 2008; Stott, 2022, and references therein), and it can be related to the galactic conformity (Bray et al., 2016; Otter et al., 2020; Maier et al., 2022). As mentioned above, the preferential alignments and galaxy occupancy in haloes can be explained as a manifestation of the large-scale environmental conditions in combination with baryonic processes such as stellar and AGN feedback.
In a recent work, Rodriguez et al. (2022) study the alignment of the central galaxies of the groups with the surroundings, using spectroscopic data from the Sloan Digital Sky Survey Data Release 16 (SDSS DR16, Ahumada et al., 2020) and the galaxy group finder presented in Rodriguez & Merchán (2020). Their results show that central galaxies are aligned with the satellite galaxies within the same halo (which agrees with Yang et al. 2006) and with nearby structures up to a distance of 10 Mpc. Moreover, the galaxy alignment shows a strong dependence on the colour, where red central galaxies are more aligned with the environment than the blue ones. Other properties such as the ellipticity of the central galaxy and the halo mass do not show a dependence with galaxy alignments. Rodriguez & Merchán (2020) also investigate the correlation function taking the group shape as a reference. They find, as expected, that the one-halo term show a large anisotropy, higher than that obtained using the shape of the central galaxy as a reference. On the other hand, the two-halo term is very similar in both amplitude and anisotropy as it is calculated with respect to the shape of the halo or the central galaxy. However, the probability distribution function of the angle between the major axes of the central galaxy and that of its group shows an overall faint alignment dominated by the central red galaxies.
Based on the findings presented in Rodriguez et al. (2022), in this work we use the cosmological hydrodynamical simulation IllustrisTNG111http://www.tng-project.org (hereafter, simply TNG) to extend the analysis. This approach mainly allows for a three-dimensional analysis without projection effects. In addition, it enables us to take advantage of the dark matter distribution provided by the TNG suite to study other secondary dependencies of the dark matter halo besides the halo mass. Cosmological simulations and in particular, hydrodynamical cosmological simulations, have proven to be a powerful tool to study the intrinsic alignments and spatial distribution of galaxies and dark matter haloes (Deason et al., 2011; Dong et al., 2014; Shao et al., 2016; Welker et al., 2018; Zjupa et al., 2020; Shi et al., 2021b, b; Shi et al., 2021a; Ragone-Figueroa et al., 2020; Samuroff et al., 2020).
Here we use the cosmological hydrodynamical simulation IllustrisTNG. Previous works based on this simulation analyzed the alignments of satellite galaxies with respect to the central ones (Tenneti et al., 2021), and Jagvaral et al. (2022) report an alignment of the elliptical galaxies in two-halo term scales of the order of Mpc. Furthermore, Zhang et al. (2022) finds that galaxies with mass above M⊙ present an excess of alignment between the galaxy shapes and the cosmic web filaments. Our results complement previous findings with the TNG simulation and we intend to investigate numerically the findings showed by Rodriguez et al. (2022).
This paper is organised as follows. Section 2 provides a description of the TNG simulation box and the halo and galaxy properties analysed. Section 3 presents the results for the anisotropic correlation function for central galaxies split by halo mass, colours, luminosity and elipticity. In Section 4 we study the connection of central and group alignments. We make a further exploration on the dark matter halo distribution and central galaxy alignments in Section 5, and we discuss other possible secondary dark matter halo dependences in Section 6. Finally, we present a summary and discuss the implications of our results in Section 7. The TNG simulation adopts the standard CDM cosmology from (Planck Collaboration et al., 2016), with parameters , , , with , , and .
2 The Illustris TNG hydrodynamical simulation
Here we use the galaxy and dark-matter halo catalogues of the IllustrisTNG300-1 run at (hereafter TNG300, Nelson et al. 2019). The magneto-hydrodynamical cosmological simulations IllustrisTNG, are performed with the arepo moving-mesh code (Springel, 2010) and represent an updated version of the Illustris simulations (Vogelsberger et al., 2014a, b; Genel et al., 2014). The IllustrisTNG simulations include sub-grid models that account for radiative metal-line gas cooling, star formation, chemical enrichment from SNII, SNIa and AGB stars, stellar feedback, supermassive-black-hole formation with multi-mode quasar, and kinetic black-hole feedback.
TNG300 represents the largest simulated box of the IllustrisTNG suite with the highest resolution available. It adopts a cubic box of Mpc side, and it is run with 25003 dark-matter particles of mass . The initial conditions includes 25003 gas cells of mass .
A friends-of-friends (FOF) algorithm is used to identify the dark-matter haloes (also named as groups in this paper) using a linking length of 0.2 times the mean inter-particle separation (Davis et al., 1985). The substructures gravitationally bound are identified with the SUBFIND algorithm (Springel et al., 2001; Dolag et al., 2009). Those subhaloes with a stellar component above a certain limit are defined as galaxies. We use the stellar mass of the galaxies, , defined as the total mass of all stellar particles bound to each subhalo. In our analysis, we use all the simulated galaxies with stellar mass above M⊙ represented by 429982 in total. We define colours in our sample using the galaxy photometric bands and provided by the IllustrisTNG database.
2.1 Galaxy and dark matter halo properties
Besides the galaxy properties from the IllustrisTNG database, in this work we compute the galaxy shapes. For this, we assume that galaxies are modelled by three-dimensional ellipsoids, where the axes are represented by the eigenvectors of the inertia tensor. We compute the inertia tensor by using the information of the individual stellar, dark matter particles and gas cells within the radius enclosing the half-dark matter mass of each subhalo. With this information, each element of the inertia tensor is computed as,
| (1) |
where = 1, 2, 3 correspond to the axis of the simulated box, and represents the mass of the n-th particle. The position of each individual particle is measured with respect to the centre of the subhalo it belongs, defined by using the particle with the minimum gravitational potential energy.
We compute the three axis of each central galaxy with the eingenvalues of the inertia tensor defined as , , and , where . We investigate the galaxy alignments based on these three axis. Assuming that central galaxies can be described as ellipsoids (and defined analogously to eccentricity), the ellipticity of the central galaxies, , is computed as,
| (2) |
In this work we explore the role of other secondary galaxy properties on galaxy alignments such as the major mergers of central galaxies. For this, we make use the sublink merger tree (Rodriguez-Gomez et al., 2015) available on the IllustrisTNG database, and we count the number of major mergers, , that happen to each individual central galaxy. Following previous works, we define a major merger as those where the stellar mass ratio between galaxies is larger than 0.25 (Peschken & Łokas, 2019).
For the dark matter haloes we use their virial mass, Mh [M⊙], defined as the total mass enclosed within a sphere of radius Rvir enclosing a density equals to 200 times the critical density. We also study the role of the formation time of the dark matter haloes, , computed as the time when it reaches half of the total mass obtained at . We compute the dark matter halo shapes using the same methodology as the one described above for central galaxies.
3 Correlation Function
To statistically study the distribution of galaxies, we use the cross-correlation function, , between central galaxies of each group and different targets. This function measures the excess probability of finding a target in the volume element at a distance away from a central galaxy (Peebles, 1980):
where is the target numerical density. Here we use two different targets: the total galaxy sample and the dark matter particles. To measure in the simulation box, we use the Davis & Peebles (1983) method consisting of counting central galaxy-target pairs in a distance bin and normalising this quantity by the expected number of pairs for a homogeneous random distribution.
We will refer to the standard , as the “isotropic” cross-correlation function, , since we will later use a modified version that considers the orientation of the central object with respect to the targets (see Section 3.1). As we have done in previous work, such as Rodriguez et al. (2022), we performed correlation function calculations using codes developed by us for this purpose.
3.1 Anisotropic correlation function
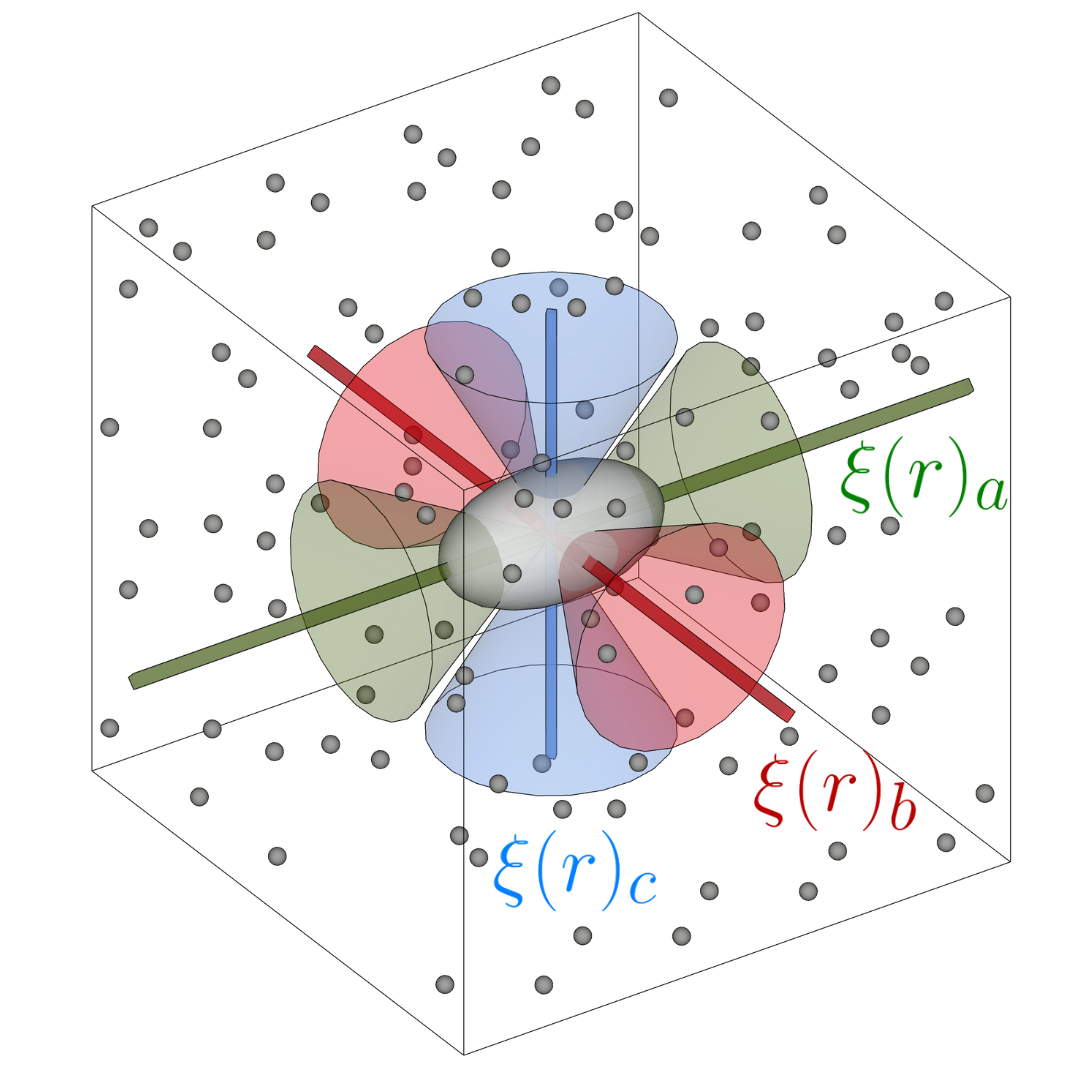
As mentioned above, the goal of this work is to determine whether matter tends to align with respect to the central galaxies of the groups in the TNG300 simulation, and compare the results with those from Rodriguez et al. (2022). We follow the same approach as in Paz et al. (2008) to study the galaxy alignment with respect to a particular direction. In our implementation, we define the anisotropic cross-correlation functions as those computed using all pairs subtending an angle with respect to the shape axes smaller than a threshold (). We denote the function corresponding to the major axis, , the one corresponding to the intermediate axis, , and the one corresponding to the minor axis, . For a clearer understanding of this, see the schematic presented in Figure 1, where green, red, and blue areas correspond to those used for , and , respectively.
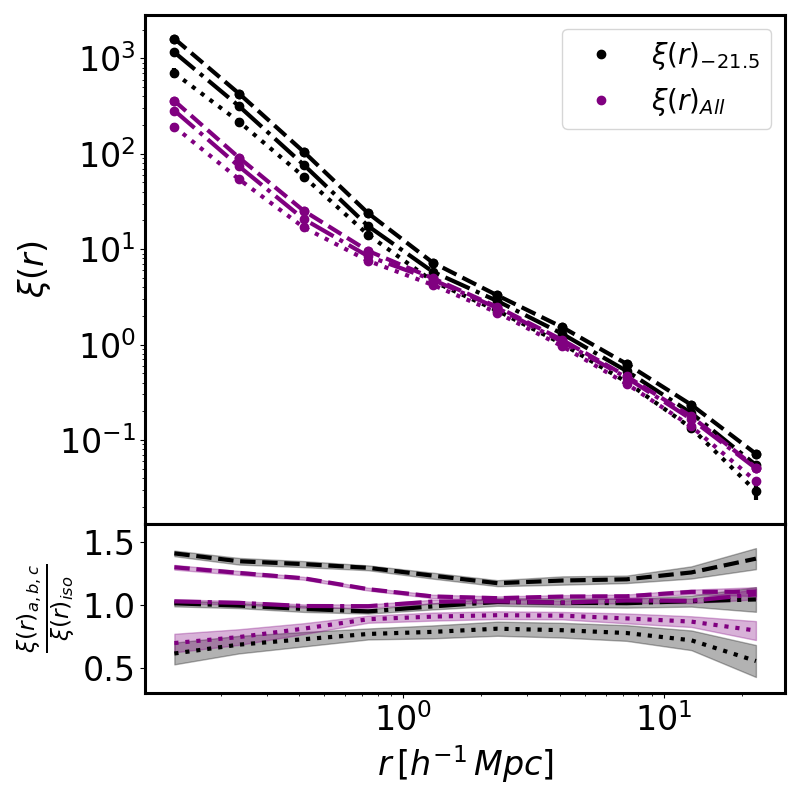
Using the sample of galaxies described in Section 2, we made a first measurement of , and cross-correlating central galaxies with the total sample. The purple lines in the top panel of Figure 2 represent our results. In these measurements and throughout this paper, we use the jack-knife technique to calculate the errors of the correlation functions. For this, we split the total sample into 32 equal-size sub-boxes, representing % of the full box. We note, however, that most times the error bars are smaller than the points used to graph the correlation function. The subplot on the bottom panel of Figure 2 displays the ratio between the anisotropic cross-correlations (, and ) and the isotropic one (). Hereafter, we will use this ratio to quantify the anisotropy. A ratio above or below 1 is a sign of anisotropy in the galaxy distribution. Our results show a weak anisotropy signal for the two-halo term of the full galaxy sample. When we restrict the sample to those halos whose central galaxy is brighter than (represented by 14135 halos) the anisotropy increases (see black lines and symbols in Figure 2). Interestingly, the two-halo term shows a significant increase in the anisotropic signal. Furtheremore, the correlation increases at the same time as the anisotropy. This is consistent with the results shown by Rodriguez et al. (2022) for the SDSS-DR16. Using the former sample, we analyse the dependence of the anisotropy on different properties of the galaxies and the halos in which they are located.
Our results show that the anisotropy signal is higher for the direction than for and , suggesting the existence of a preferential direction for the matter distribution to be aligned along the major axis. On the other hand, the anisotropic cross-correlation of the direction is lower than the one for the . This difference indicates that the matter is mostly triaxially distributed rather than in a purely prolate configuration. This feature extends to the outskirts and is present in the 2-halo term. The distinction in the anisotropic cross-correlation function for the three galaxy axis is in agreement with Paz et al. (2011), using dark matter-only simulations.
3.2 Colour dependence
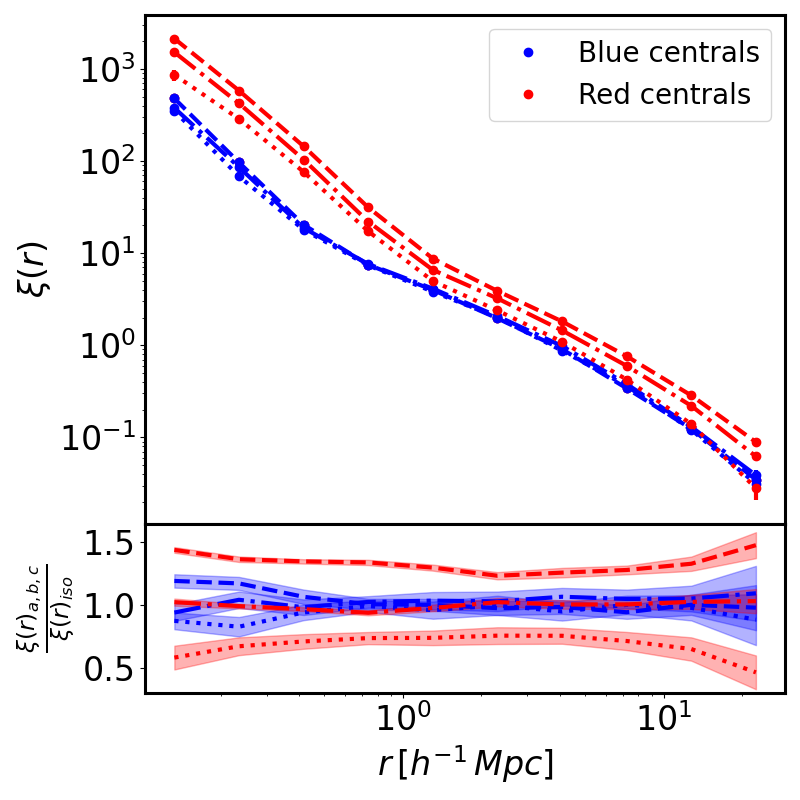
In Rodriguez et al. (2022) the authors find a strong dependence of the anisotropy with the colour of the central galaxy. Here we investigate whether the same trend is present in the TNG300. Following previous works, we define a threshold of to split the galaxy sample in red and blue (see Figure 1 in Lacerna et al. 2022 for the colour distribution of the TNG300 simulated galaxies). With that threshold, 68% of the sample are red central galaxies while 32% are blue.
Figure 3 presents the anisotropic cross-correlation functions for the groups with red and blue central galaxies. The top panel shows that the red central galaxies have a larger amplitude (i.e., are more clustered) than the blue ones. This result reflects that red central galaxies inhabit halos of higher masses. The most important result is shown in the subplot of Figure 3, where we find that the red central galaxies have a significantly higher anisotropy than the blue ones. In particular, red central galaxies reach an anisotropy of 1.5 and 0.5 for the major and minor axis, respectively, while the intermediate axis does not show anisotropy signal. These results suggest that the red central galaxies are aligned with the surrounding structures at least up to 25 Mpc. The blue central galaxies, on the other hand, have almost no anisotropy, showing only a very slight signal at small scales below .
These results are consistent with those obtained in Rodriguez et al. (2022). We chose to show only these measurements because they condense the most relevant information: the red central galaxies are responsible for the anisotropy. However, when we perform cross-correlations between central galaxies and target galaxies of different colours, we get analogous results.
3.3 Mass dependence
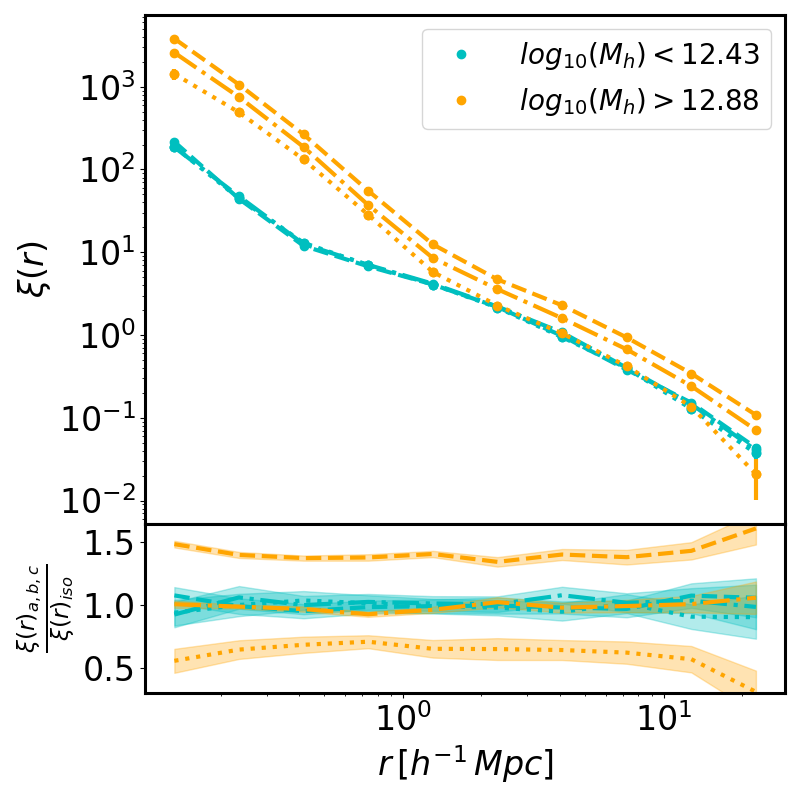
Considering that red galaxies are responsible for the anisotropy and that they tend to inhabit more massive haloes, it would be expected a dependence of the anisotropy on the halo mass, as demonstrated by Paz et al. (2011). However, a controversial result obtained in (Rodriguez et al., 2022) from observations using halo mass derived from the abundance matching method was that no such dependence was detected.
Figure 4 presents the correlation functions for the first and third halo mass terciles of the distribution. For the sake of clarity, we omit the central tercile, but the corresponding curves lie between the first and third terciles. As expected, the cross-correlation function corresponding to the more massive sample has a higher amplitude than the low-mass one (top main panel). Our findings show that massive haloes present a strong anisotropy while the less massive ones show almost no signal (see the subplot, bottom panel). The fact that this dependence was not observed in Rodriguez et al. (2022) could be related, in the first place, to the fact that the mass range covered was smaller (where the three halo mass bins were defined as ). In addition, it is natural that the masses have more observational uncertainties due to several factors, such as the abundance matching method applied for their determination, errors in the identification of galaxy systems, or the assignment of the central galaxy.
Our results are consistent with previous findings from other cosmological simulations (see Shao et al., 2016; Welker et al., 2018; Tenneti et al., 2021), suggesting that the trends are robust irrespective of sub-grid physics in the simulation. In particular Tenneti et al. (2021) show that the alignment angle between satellite galaxies and the major axis of the central galaxy strongly depends on the dark matter halo, and similar results are found for IllustrisTNG and MassiveBlack-II.
3.4 Ellipticity dependence
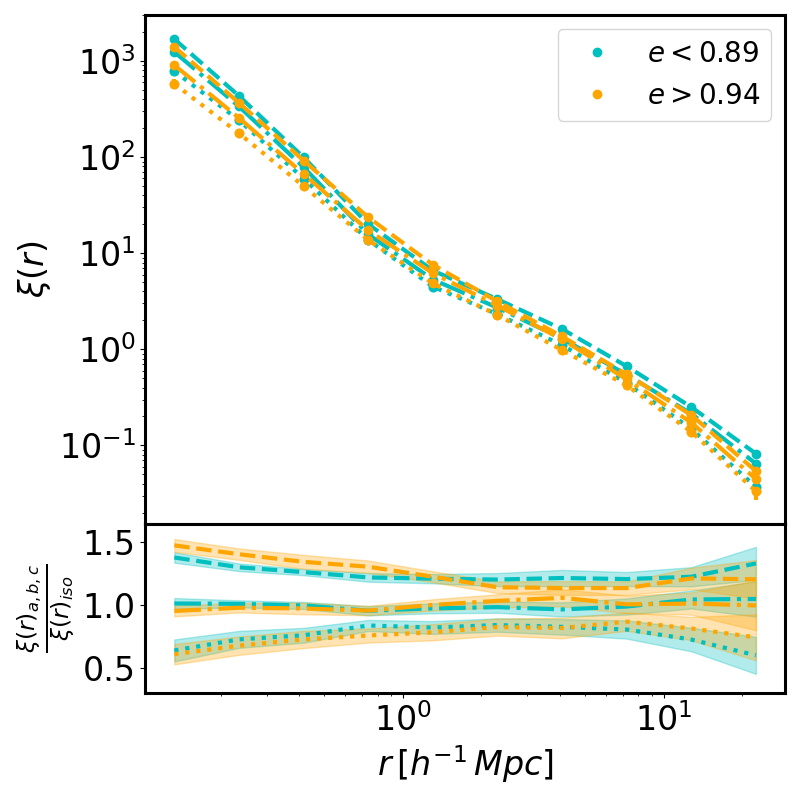
We now study the dependence of the anisotropy on the ellipticity of the central galaxies determined from the eigenvectors of the shape tensor calculated using the stellar particles within two radii at half mass.
Figure 5 shows the cross-correlation functions and anisotropies determined for the first and third terciles of the ellipticity distribution for the central galaxies. No differences are observed either in the correlation function or in the anisotropy. These findings support the results found in Rodriguez et al. (2022). This is relevant because, in the observations, the ellipticity is affected by projection effects and the anisotropy signal could be distorted. The simulation is free of these projection effects, yet no dependence of anisotropy on ellipticity is observed.
4 Central and group alignment
As a final comparison with the observational results of Rodriguez et al. (2022), we propose to determine the anisotropic correlation functions but, in this case, relative to the direction of the group axis. We calculate these directions from the eigenvectors associated with the eigenvalues of the shape tensor:
| (3) |
where is the component of the Cartesian coordinates of the object relative to the centre of the group and is the number of objects in the group.
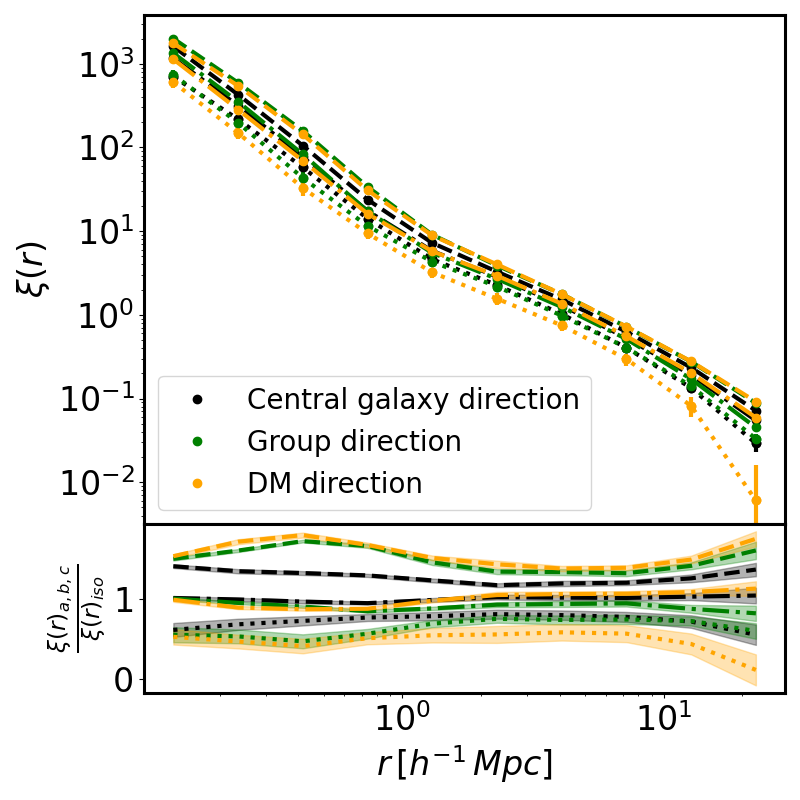
Figure 6 presents the comparison between the result obtained when using the axis from the central galaxies shape (presented in Figure 2, black lines) and the one using the axis from the groups shape (green lines). As in Rodriguez et al. (2022), we find that the one-halo term alignment signal is larger for the case when the group shape is used.
However, the difference found in TNG300 is smaller than the result obtained from observations. This can be explained by projection effects, together with the method used to calculate the correlation function, both enhancing the anisotropies on the smaller scales. A striking result obtained from the observations was that both the anisotropy associated with the central galaxy and the group were indistinguishable on large scales. However, when we analyze it in the simulation, we can detect a small difference, which means that the groups are more aligned with the distant environment than their central galaxy. This result suggests that the observed anisotropy signal for the central galaxy could be because of an alignment between it and its group. It is possible that two effects are involved in this phenomenon. First, non-linear physical processes would produce the alignment of the central galaxy within the dark matter halo. Second, the large-scale structure distribution of matter is imprinted in the hierarchical nature of the dark matter halo formation (Paz et al., 2011). This mechanism would explain the galaxy cluster alignment at large scales beyond the halo.
Taking advantage of the dark matter information in the simulation, we calculate the halo shape with the same procedure as in equation 3 but using the dark matter particles. The results with the latter determination are shown in orange in Figure 6. We find a similar trend to the results obtained when member galaxies are used to estimate the group shapes, but the alignment increases slightly. Our results are at some point expected since over-dense dark matter regions are linked with the satellite galaxies’ position within the halos.
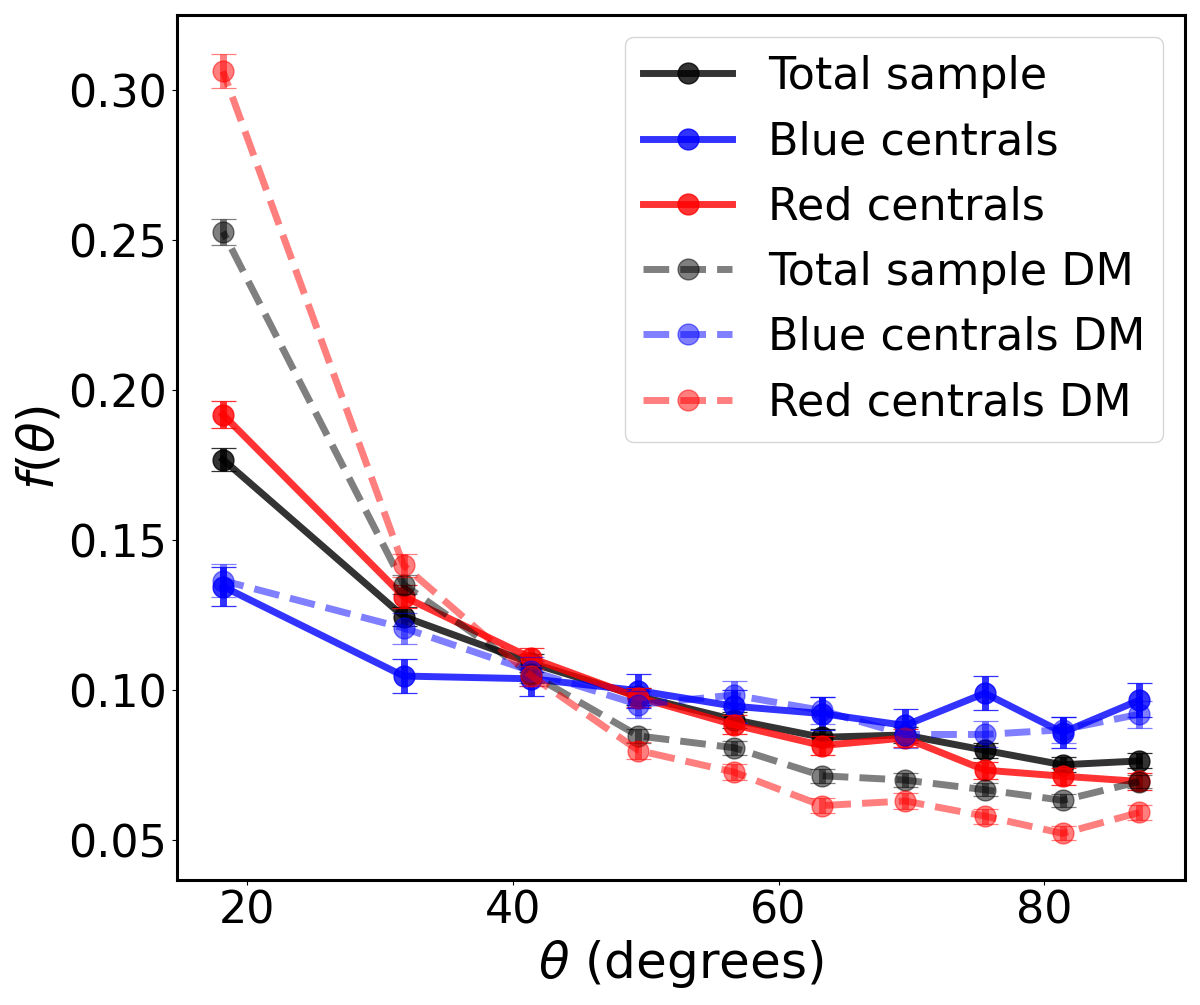
Since the alignment obtained by calculating the shape of the halo with galaxies or dark matter is very similar and slightly larger than that estimated with the central galaxy shape, it is clear that the alignment between the central galaxy and its host group/halo needs to be explored. To quantify this alignment, we measure the angle between the corresponding major axes. Figure 7 shows the measured probability density distribution for total, red, and blue samples of central galaxies regarding the halo shape calculated with the galaxies members (solid lines) and with the dark matter particles (dashed line). As expected from Figure 6, the alignment of the central galaxy with the dark matter in its host halo is slightly stronger.
Therefore, in both cases, the red galaxies show more alignments than the total while the blue galaxies show a very low alignment signal. As in Rodriguez et al. (2022), when we divide the sample into red and blue central galaxies, we obtain a larger alignment signal for the red galaxies while it almost disappears for the blue ones. Looking at the alignment calculated using dark matter, it can be seen that while the alignment for the red central galaxies increases, it remains the same for the blue ones. To better understand this result, in the next section we will concentrate on dark matter.
5 Dark Matter alignment
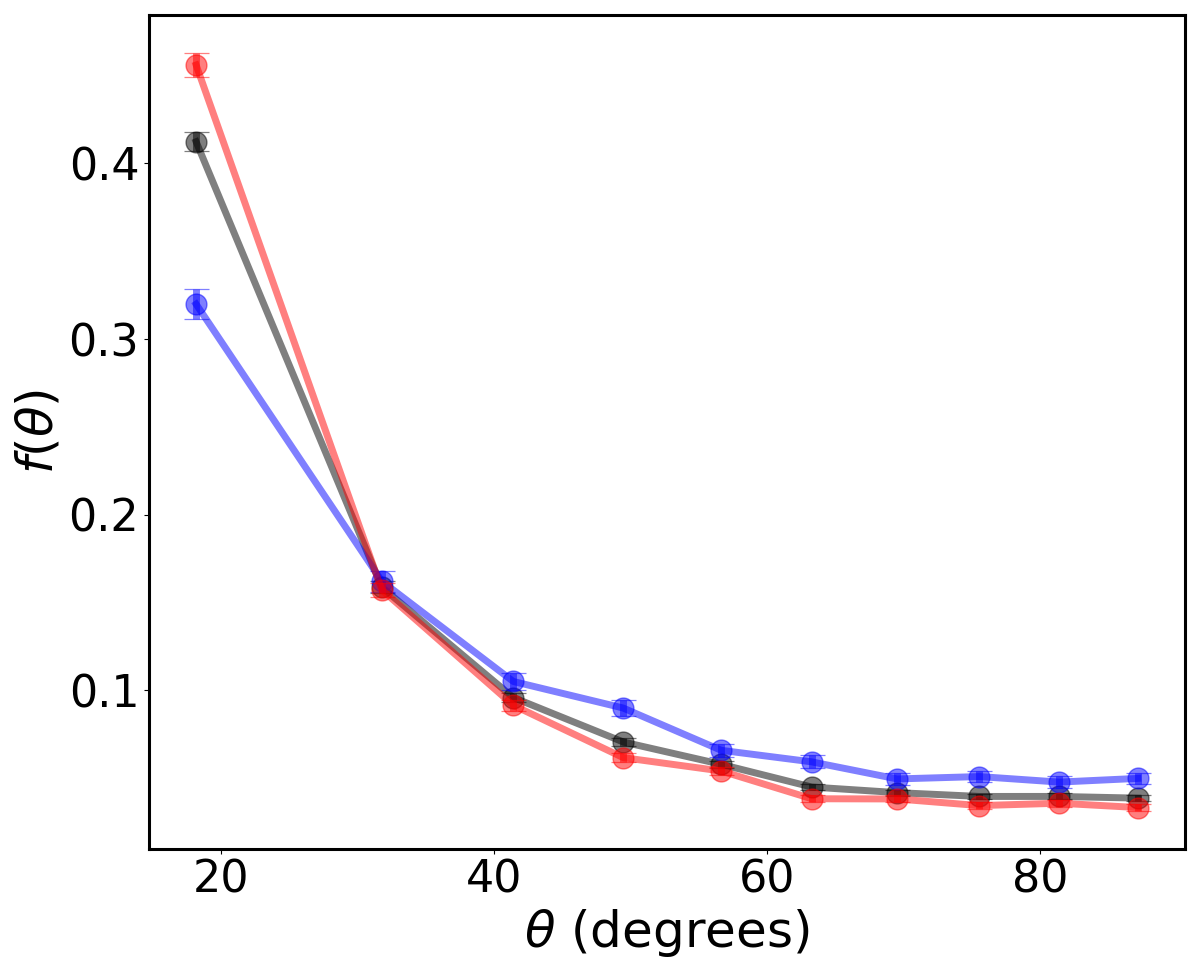
In the previous section, we show that the stellar component of blue galaxies is not aligned with the dark matter of the host halo. At this stage, we want to see if the dark matter in the central galaxies behaves similarly. In Figure 8, we show the alignment between the main axis of the central galaxy and the corresponding to the host halo, both calculated using the dark matter particles and following the same procedure as in Section 4. As can be seen, both the total sample and red galaxies maintain a similar behavior to that found when the stellar component was used to calculate their shapes. Only a slight increase in alignment is observed. However, something very different happens with the blue galaxies, which in this case, have a considerably higher alignment than the one found in figure 7.
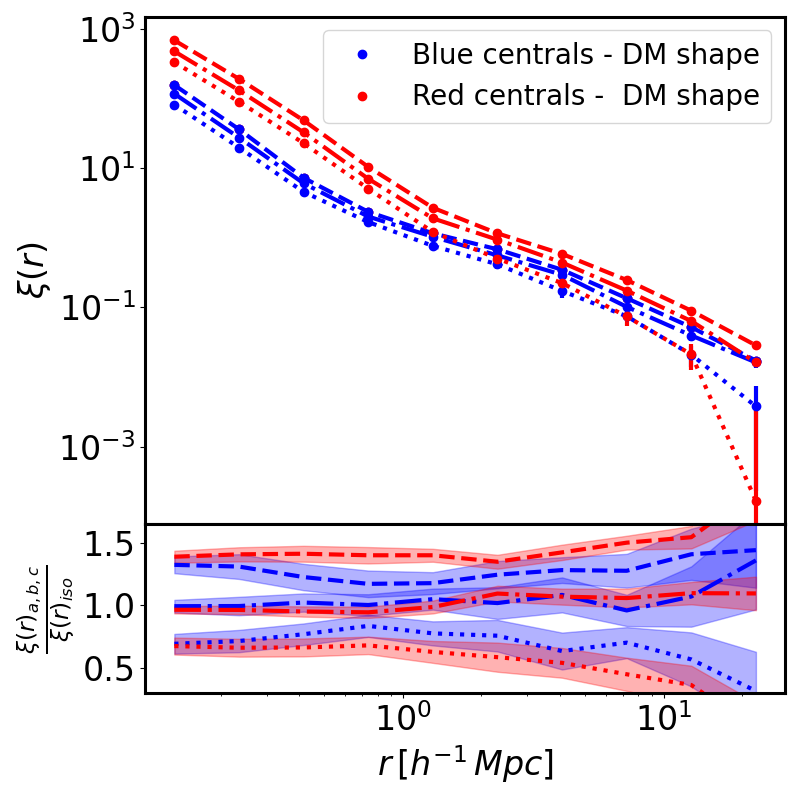
The above result should be evidenced in the correlation function if we use dark matter instead of stars. Figure 9 shows the correlation function and anisotropy resulting from considering the central galaxy with the three shape axes calculated from the dark matter particles of the subhalo it inhabits and using dark matter particles as targets. In contrast to what we obtained in Figure 3 both the central blue and red galaxies show a strong anisotropy signal. Although the anisotropy of the blue central galaxies is slightly lower, it is comparable to that of the red ones, both evidently aligned with the host halo and surrounding structure.
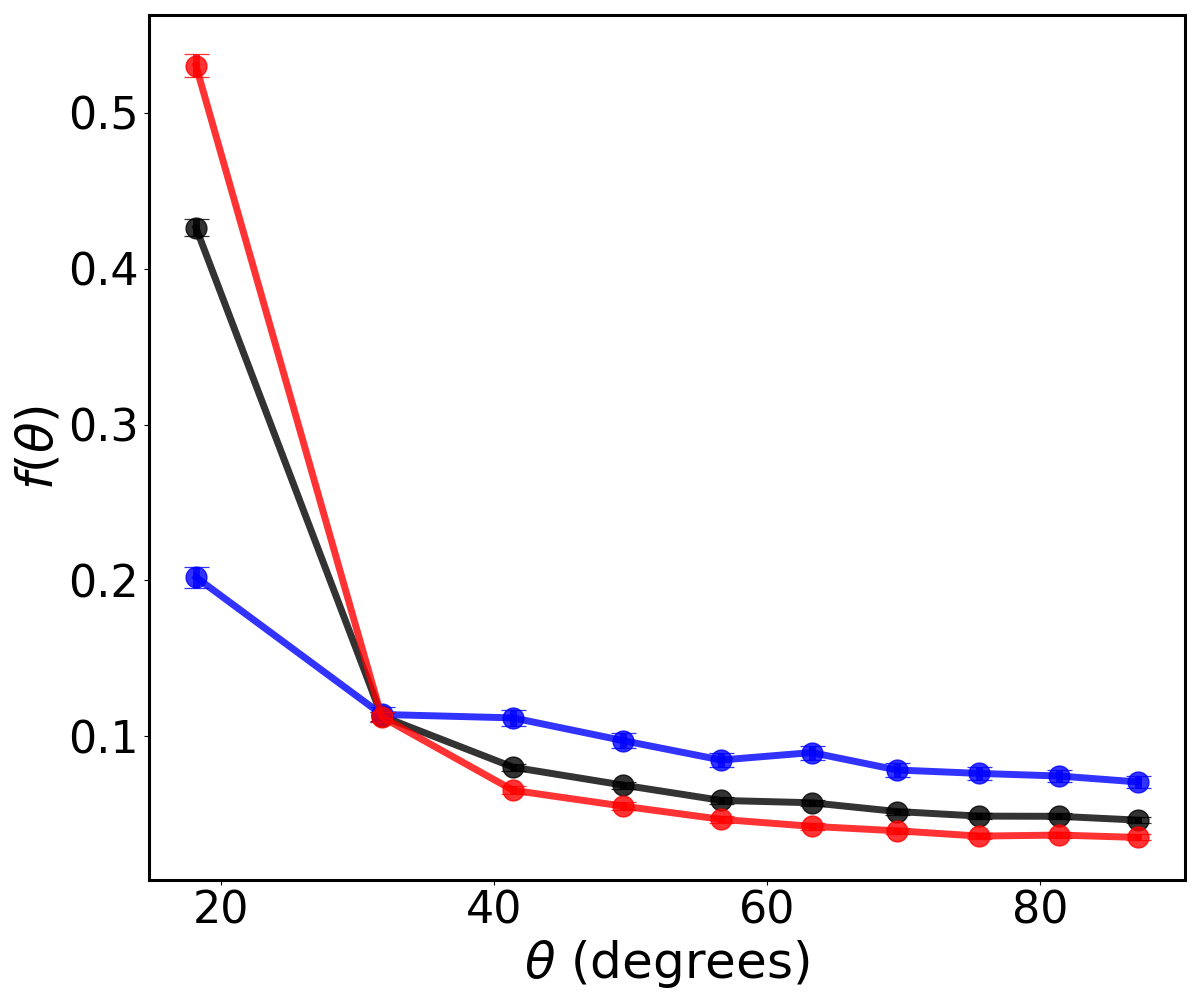
These latest results suggest a misalignment between the stellar and dark matter components for blue galaxies. Consequently, we study the alignment between stars and dark matter in the sub-halo inhabited by the central galaxies. We present this in Figure 10. Evidently, the main axis of the red central galaxies is strongly aligned with that of their halo, while that of the blue ones is close to a random distribution. That is, the stars are good tracers of the shape of the subhalo of the red central galaxies but not of the blue ones. This allows us to understand why this alignment occurs up to scales larger than 10 Mpc: The stars of the red central galaxies are aligned with their dark matter subhalo, which is aligned with the halo containing the group, which, in turn, is aligned with the surrounding structures. The behavior of blue central galaxies could be explained in the same way, but, unlike the red ones, they have the stellar component misaligned with their own subhalo, which makes the anisotropy signal fade when only stars are considered.
6 Secondary dependencies of anisotropies for red galaxies
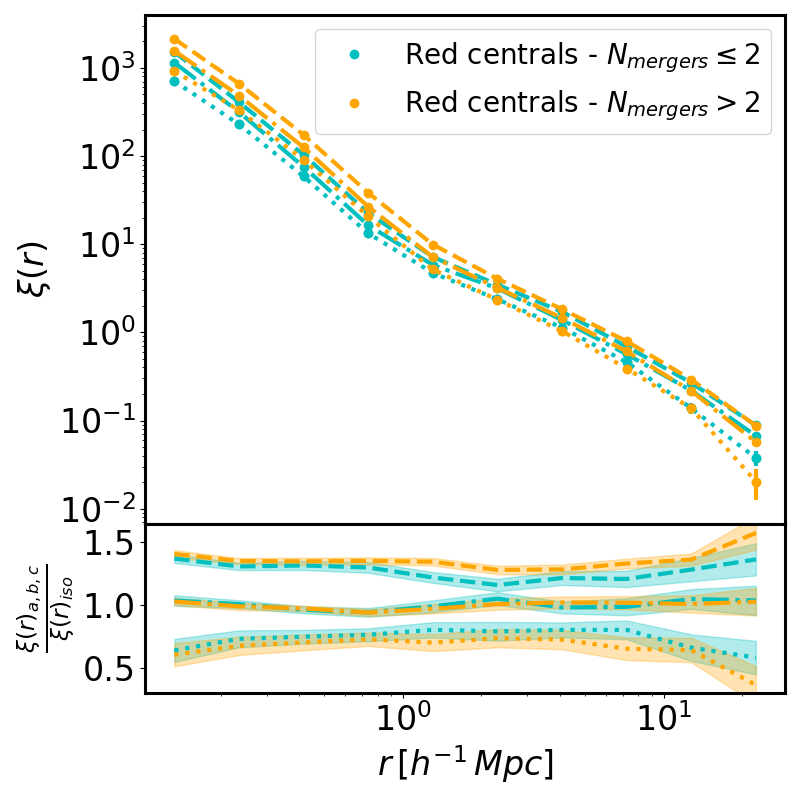
In previous sections, we show that red central galaxies are aligned with their surroundings, while the blue ones are misaligned. In addition, we find a dependence of the alignment of the central galaxies on the halo mass they inhabit. This leads us to think that there may be other (secondary) dependencies linked to the evolutionary processes of galaxy assembly and mass accretion history. Two properties that hold information of this type are the redshift at which half of the haloes’ mass was assembled () and the number of major mergers (of one-fifth of their mass) they underwent during their lifetime ().
In previous sections we show that blue central galaxies do not present any alignment signal when we split the sample by halo mass regardless of the parameters used and the selection within the sample. Consequently, in this section we focus on the results corresponding to red central galaxies.
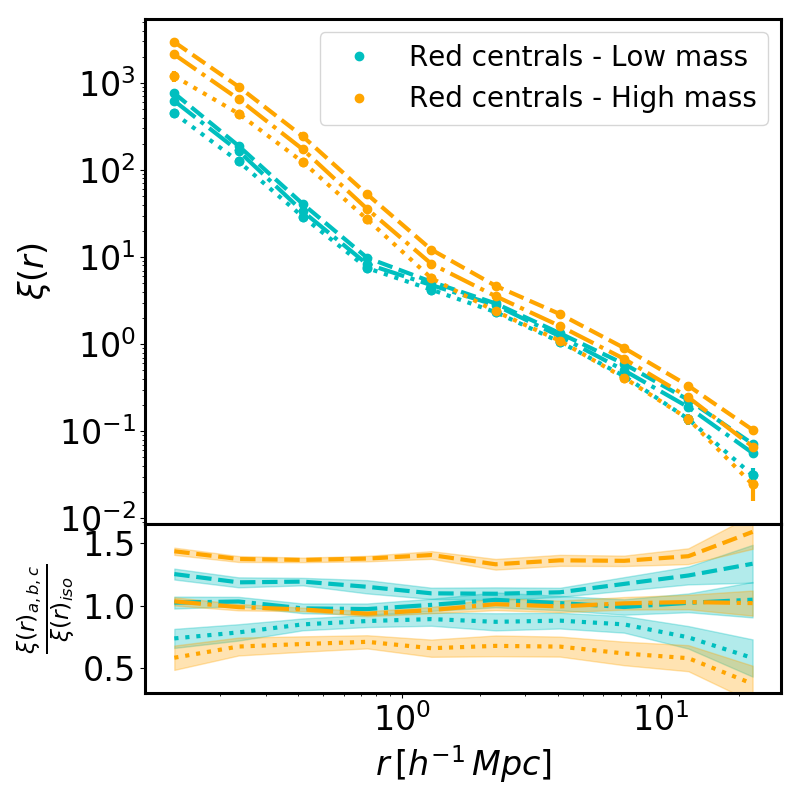
We first split the red central galaxies according to the mass of the halo they inhabit. We divide the sample by the median of the mass distribution, whose value is . Then, following section 3, we calculate the cross-correlation function and the anisotropy for high-mass and low-mass samples. We present the results for these samples in the top panel of Figure 11. Red central galaxies hosted in massive haloes are more aligned with the surrounding structures than those in less massive haloes. This means that the dependence of anisotropy on mass is still present even when we only consider red central galaxies. This outcome supports what we found in the previous section: the anisotropy signal on large scales is more related to the host halo than the central galaxy. It is pertinent to mention that, as the stellar mass of the central galaxy correlates very well with the host halo mass, we reach similar results if we perform the above analysis, but in terms of this mass instead of that of the halo.
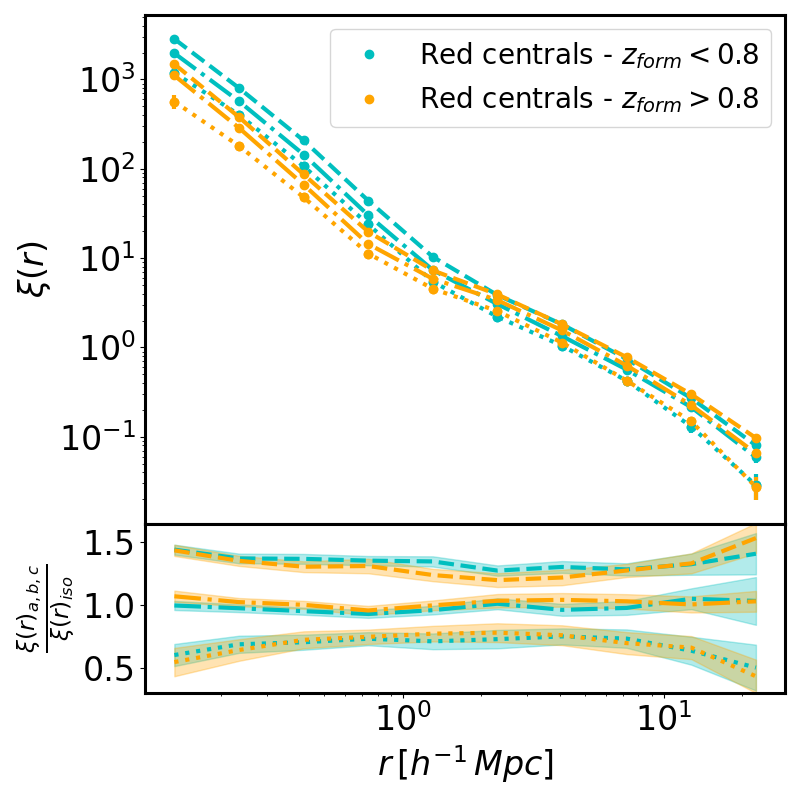
We will now analyse the dependence of anisotropy on . Following the same procedure as in the previous paragraphs, we split the sample according to the median of the distribution. We present the results in the middle panel of Figure 11. Although the correlation function shows some difference in the one halo term, the variation in anisotropy for halos with different is negligible.
We also investigate if the number of major mergers, , has an impact on the anisotropy. In the lower panel of Figure 11, we present the results corresponding to the samples with a number of mergers above and below the median value (). As in the formation redshift study, we observe minor differences in the one halo term of the correlation function. However, we did not find relevant differences in the anisotropies. We carry out this analysis considering the number of major mergers based on the stellar material, but the results are similar when we use the dark matter mass budget to define the mergers.
Unexpectedly, we do not find a dependence on the redshift and the number of mergers. However, we know from Figures 4 and 11 that there is a strong dependence on the mass. Consequently, we investigated the influence of the redshift and the number of mergers on the anisotropy for the highest mass bin. This selection yielded no difference in the anisotropic correlation functions, suggesting that the colour and halo masses may be the properties that best summarise information about anisotropy. We do not include figures for these tests because they are very similar to those already presented in Figure 11.
7 Discussion and conclusions
We use the cosmological hydrodynamical simulation IllustrisTNG to determine the alignment of the central galaxies with the environment to deepen the observational results obtained by Rodriguez et al. (2022).
When we restrict the sample by the colour or brightness of the central galaxies, our results show good agreement with the results obtained in Rodriguez et al. (2022), i.e. the brighter central galaxies show more anisotropy and, within this subsample, the red central galaxies are responsible for most of the signal.
When we consider more specific galaxy properties, such as the ellipticity of the central galaxy and the mass of the host halo, we find a dependence of the anisotropy on the mass but not on the ellipticity. While the result for the ellipticity agrees with the observations, this does not happen for the mass, where the observations do not show any dependence. This discrepancy is probably because of the way the masses of the galaxy groups are assigned in the observations. Although the abundance matching method used to estimate the masses of galaxy groups is statistically better than dynamical estimates, it is still not sufficiently accurate for the determination of individual masses. This would explain the observational inability to detect the dependence of the anisotropy on the mass observed in the simulations. The fact that, in observations, it is possible to detect the dependence of the anisotropy on the colour of the central galaxy, but not on the mass of the host halo, would show that the colour of the central galaxy is a better indicator of the mass of the host halo than the masses assigned by traditional methods.
A remarkable result of this work is the detected increase of the anisotropy with the host halo mass taking into account the shape of the central galaxy. According to the determinations of other authors, the dependence of the anisotropy with the mass associated with the shape of the host halo is well known. So the alignment of the central galaxy with the environment on large scales could be an effect of the alignment of the central galaxy and its host halo.
From the comparison of the anisotropies estimated using the shapes of central galaxies or groups, we observe that the signal of the one-halo term is higher in the groups, while they are similar in the two-halo term. This supports the reasoning in the previous paragraph that the alignment of the central galaxy with the large-scale structure is a consequence of the alignment with the halo it inhabits. To figure this out, we studied the alignment between the central galaxy and the host halo. We find that, in general, there is a remarkable alignment, with the red central galaxies being most closely aligned with their host halo. This result is in agreement with previous observational results.
All the above analysis was performed using the stellar component of the simulation. However, since various astrophysical processes could influence the orientation of the central galaxy, we study the behavior of the anisotropy based on the shapes determined using dark matter particles. Using these determinations, we repeat the analysis of the previous paragraph and observe that, remarkably, the alignment of both red and blue central galaxies increases. When we study the anisotropy using the correlation function, we find that unlike the case when we calculated the shape with the stars, the blue central galaxies present a similar anisotropy signal to the red galaxies. This leads us to understand the origin of the lack of anisotropy in the blue central galaxies. Analysing the alignment between stars and dark matter in the central galaxies, we find that the blue galaxies are misaligned with their own halo compared to the red galaxies, which show a significant alignment.
Since the alignment is dominated by the colour of the central galaxy in both observations and simulations, it is worth wondering whether the alignment is actually determined by the assembly process of the central galaxy. To see this, we study for red central galaxies (because they show an anisotropy signal) the dependence of the anisotropy on the mass of the host halo, the formation redshift and the number of mergers. While the dependence on the host halo mass resembles that of the total sample, unexpectedly, the anisotropy seems to be neither sensitive to the formation redshift nor the number of mergers.
The results found in this work can be summarized as follows: the alignment signal or anisotropy found from the shape axes of the central galaxies is the consequence of a concatenation of alignments. Starting at the smallest scales, the baryonic material of the central galaxy aligns with the dark matter of its own halo, which in turn aligns with the host halo, and eventually, the host halo aligns with the structures surrounding it. The unexpected independence of the alignment signal with respect to the formation redshift and the number of mergers does not allow us to link the assembly process of the central galaxy with the detected anisotropy. It is probably necessary to study in detail and individually the alignment process of the central galaxies both with their own halo and with the host halo, to explain the processes that determine the alignment or misalignment of the baryonic material with the halos of dark matter. Other halo properties such as the tidal field and the evolution of the galaxy alignment will be evaluated in the future for further exploration. This is essential to understand observations in which only the two ends of this sequence can be measured.
Acknowledgements
The authors wish to thank the anonymous referee for his/her report that helps us to improve this manuscript. FR and MM thanks the support by Agencia Nacional de Promoción Científica y Tecnológica, the Consejo Nacional de Investigaciones Científicas y Técnicas (CONICET, Argentina) and the Secretaría de Ciencia y Tecnología de la Universidad Nacional de Córdoba (SeCyT-UNC, Argentina). MCA acknowledges financial support from the Seal of Excellence @UNIPD 2020 program under the ACROGAL project. FR would like to thank Rocío Rodríguez and Santiago Díaz for their help in producing a graphic to make our work clearer.
Data Availability
The data underlying this article will be shared on reasonable request to the corresponding authors.
References
- Agustsson & Brainerd (2010) Agustsson I., Brainerd T. G., 2010, ApJ, 709, 1321
- Ahumada et al. (2020) Ahumada R., et al., 2020, The Astrophysical Journal Supplement Series, 249, 3
- Bray et al. (2016) Bray A. D., et al., 2016, MNRAS, 455, 185
- Catelan et al. (2001) Catelan P., Kamionkowski M., Blandford R. D., 2001, Monthly Notices of the Royal Astronomical Society, 320, L7
- Ciotti & Dutta (1994) Ciotti L., Dutta S., 1994, Monthly Notices of the Royal Astronomical Society, 270, 390
- Crittenden et al. (2001) Crittenden R. G., Natarajan P., Pen U.-L., Theuns T., 2001, The Astrophysical Journal, 559, 552
- Davis & Peebles (1983) Davis M., Peebles P., 1983, The Astrophysical Journal, 267, 465
- Davis et al. (1985) Davis M., Efstathiou G., Frenk C. S., White S. D. M., 1985, ApJ, 292, 371
- Deason et al. (2011) Deason A. J., et al., 2011, MNRAS, 415, 2607
- Dolag et al. (2009) Dolag K., Borgani S., Murante G., Springel V., 2009, MNRAS, 399, 497
- Dong et al. (2014) Dong X. C., Lin W. P., Kang X., Ocean Wang Y., Dutton A. A., Macciò A. V., 2014, ApJ, 791, L33
- Fleck & Kuhn (2003) Fleck J.-J., Kuhn J. R., 2003, The Astrophysical Journal, 592, 147
- Genel et al. (2014) Genel S., et al., 2014, MNRAS, 445, 175
- Jagvaral et al. (2022) Jagvaral Y., Singh S., Mandelbaum R., 2022, MNRAS, 514, 1021
- Jing (2002) Jing Y., 2002, Monthly Notices of the Royal Astronomical Society, 335, L89
- Johnston et al. (2019) Johnston H., et al., 2019, Astronomy & Astrophysics, 624, A30
- Kiessling et al. (2015) Kiessling A., et al., 2015, Space Sci. Rev., 193, 67
- Kirk et al. (2015) Kirk D., et al., 2015, Space Sci. Rev., 193, 139
- Lacerna et al. (2022) Lacerna I., et al., 2022, MNRAS, 513, 2271
- Libeskind et al. (2015) Libeskind N. I., Hoffman Y., Tully R. B., Courtois H. M., Pomarède D., Gottlöber S., Steinmetz M., 2015, MNRAS, 452, 1052
- Maier et al. (2022) Maier C., Haines C. P., Ziegler B. L., 2022, A&A, 658, A190
- Nelson et al. (2019) Nelson D., et al., 2019, Computational Astrophysics and Cosmology, 6, 2
- Otter et al. (2020) Otter J. A., Masters K. L., Simmons B., Lintott C. J., 2020, MNRAS, 492, 2722
- Pawlowski (2018) Pawlowski M. S., 2018, Modern Physics Letters A, 33, 1830004
- Paz et al. (2008) Paz D. J., Stasyszyn F., Padilla N. D., 2008, Monthly Notices of the Royal Astronomical Society, 389, 1127
- Paz et al. (2011) Paz D. J., Sgró M. A., Merchán M., Padilla N., 2011, Monthly Notices of the Royal Astronomical Society, 414, 2029
- Peebles (1980) Peebles P. J. E., 1980, The large-scale structure of the universe. Princeton university press
- Pen et al. (2000) Pen U.-L., Lee J., Seljak U., 2000, The Astrophysical Journal, 543, L107
- Peschken & Łokas (2019) Peschken N., Łokas E. L., 2019, MNRAS, 483, 2721
- Planck Collaboration et al. (2016) Planck Collaboration Ade P. A., et al., 2016, Astronomy & Astrophysics, 594, A13
- Porciani et al. (2002a) Porciani C., Dekel A., Hoffman Y., 2002a, Monthly Notices of the Royal Astronomical Society, 332, 325
- Porciani et al. (2002b) Porciani C., Dekel A., Hoffman Y., 2002b, Monthly Notices of the Royal Astronomical Society, 332, 339
- Ragone-Figueroa et al. (2020) Ragone-Figueroa C., Granato G. L., Borgani S., De Propris R., García Lambas D., Murante G., Rasia E., West M., 2020, MNRAS, 495, 2436
- Rodriguez & Merchán (2020) Rodriguez F., Merchán M., 2020, Astronomy & Astrophysics, 636, A61
- Rodriguez-Gomez et al. (2015) Rodriguez-Gomez V., et al., 2015, MNRAS, 449, 49
- Rodriguez et al. (2022) Rodriguez F., Merchán M., Artale M. C., 2022, Monthly Notices of the Royal Astronomical Society, 514, 1077
- Sales & Lambas (2004) Sales L., Lambas D. G., 2004, Monthly Notices of the Royal Astronomical Society, 348, 1236
- Samuroff et al. (2020) Samuroff S., Mandelbaum R., Di Matteo T., 2020, Monthly Notices of the Royal Astronomical Society, 491, 5330
- Shao et al. (2016) Shao S., Cautun M., Frenk C. S., Gao L., Crain R. A., Schaller M., Schaye J., Theuns T., 2016, MNRAS, 460, 3772
- Shi et al. (2021a) Shi J., Osato K., Kurita T., Takada M., 2021a, ApJ, 917, 109
- Shi et al. (2021b) Shi J., Kurita T., Takada M., Osato K., Kobayashi Y., Nishimichi T., 2021b, J. Cosmology Astropart. Phys., 2021, 030
- Springel (2010) Springel V., 2010, MNRAS, 401, 791
- Springel et al. (2001) Springel V., White S. D. M., Tormen G., Kauffmann G., 2001, MNRAS, 328, 726
- Stott (2022) Stott J. P., 2022, MNRAS, 511, 2659
- Tenneti et al. (2021) Tenneti A., Kitching T. D., Joachimi B., Di Matteo T., 2021, MNRAS, 501, 5859
- Usami & Fujimoto (1997) Usami M., Fujimoto M., 1997, The Astrophysical Journal, 487, 489
- Vogelsberger et al. (2014a) Vogelsberger M., et al., 2014a, MNRAS, 444, 1518
- Vogelsberger et al. (2014b) Vogelsberger M., et al., 2014b, Nature, 509, 177
- Wang et al. (2008) Wang Y., Yang X., Mo H. J., Li C., van den Bosch F. C., Fan Z., Chen X., 2008, MNRAS, 385, 1511
- Welker et al. (2018) Welker C., Dubois Y., Pichon C., Devriendt J., Chisari N. E., 2018, A&A, 613, A4
- Yang et al. (2005) Yang X., Mo H., Van Den Bosch F. C., Jing Y., 2005, Monthly Notices of the Royal Astronomical Society, 356, 1293
- Yang et al. (2006) Yang X., Van Den Bosch F. C., Mo H., Mao S., Kang X., Weinmann S. M., Guo Y., Jing Y., 2006, Monthly Notices of the Royal Astronomical Society, 369, 1293
- Zhang et al. (2022) Zhang B., Lee K.-G., Krolewski A., Shi J., Horowitz B., Kooistra R., 2022, arXiv e-prints, p. arXiv:2211.09331
- Zjupa et al. (2020) Zjupa J., Schäfer B. M., Hahn O., 2020, arXiv e-prints, p. arXiv:2010.07951