11email: ylin@mpe.mpg.de
First detection of CHD2OH towards pre-stellar cores
The inheritance of material across the star and planet formation process is traced by deuterium fractionation. We report here the first detection of doubly deuterated methanol towards pre-stellar cores. We study the deuterium fractionation of methanol, CH3OH, towards two starless and two pre-stellar cores. We derive a D/H ratio of 0.8-1.9 with CH2DOH in pre-stellar cores H-MM1 and L694-2, consistent with measurements in more evolved Class 0/I objects and comet 67P/Churyumov-Gerasimenko, suggesting a direct chemical link arising in the pre-stellar stage. Furthermore, the column density ratios of CHD2OH/CH2DOH are 50-80, consistently high as that towards Class 0/I objects, indicating an efficient formation mechanism of CHD2OH, possibly through H atom additions to D2CO. The CH2DOH/CH3OH and CHD2OH/CH3OH column density ratios in the two pre-stellar cores are larger than that in the two starless cores B68 and L1521E, representing an evolutionary trend of methanol deuteration in early-stage cores.
Key Words.:
ISM: pre-stellar core – ISM: H-MM1, L694-2, L1521E, B68– ISM: structure – stars: formation1 Introduction
High levels of deuterium fraction is an extraordinary chemical feature of dense cores, the precursors of low-mass stars and planetary systems. While the cosmic atomic D/H elemental ratio is 1.610-5 (Linsky 2003), the deuterium fraction (molecular D/H ratio) in dense, cold cores can be orders of magnitude larger (Ceccarelli et al. 2007). The enrichment of molecules in deuterium is favored by low temperatures and high CO-depletion environment (e.g., Dalgarno & Lepp 1984, Walmsley et al. 2004, Roueff et al. 2005). Molecules detected in dense cores have a wide range of D/H, which is reflective of the different formation times and mechanisms of different molecular species (Taquet et al. 2014, Ceccarelli et al. 2014). Amongst all molecules, methanol (CH3OH) shows a high D/H ratio of up to tens of percent (Parise et al. 2006). As CH3OH is a critical molecule in advancing the chemical complexity of star-forming regions (Garrod & Herbst 2006, Caselli & Ceccarelli 2012), measurements of the deuterium fraction provides important clues on its formation pathways and chemical evolution over the course of star formation.
The formation of CH3OH takes place mainly on the surface of icy grains mantles, through successive addition of H atoms to CO and H2CO, the so-called CO-H2CO-CH3OH solid-state hydrogenation reaction chain (e.g., Tielens & Hagen 1982, Watanabe & Kouchi 2002). Deuterated CH3OH follows a similar formation pathway, i.e., by addition of D atoms instead of H (Watanabe & Kouchi 2008, Hidaka et al. 2009, Taquet et al. 2012). Thus the deuteration of methanol depends primarily on the gaseous atomic D/H ratio, which is enhanced by CO depletion (Roberts et al. 2004). Gas-phase methanol observed towards cold cores is explained with the process of reactive desorption (Vasyunin et al. 2017), due to the exothermicity of the formation reactions on dust grain surfaces rich in CO ices. Compared to the D/H ratio which depends on the gas-phase enhancement of the main isotopolgue and is prone to the line-of-sight integration of different gas components, the D2/D ratio provides a more stringent constraint on the deuteration fractionation in situ and is thus critical for advancing the chemical models. However, the doubly deuterated form of CH3OH, which was first detected towards protostar IRAS 16293-2422 (Parise et al. 2002), has not been observed towards starless and pre-stellar cores, presenting a missing link to the more evolved star-forming cores (e.g., Drozdovskaya et al. 2022, Parise et al. 2006, Agúndez et al. 2019).
Complex organic molecules (COMs), defined as molecules with more than five atoms containing Carbon, Oxygen and Hydrogen (e.g., Herbst & van Dishoeck 2009), are ubiquitous in star-forming regions. They are very abundant around protostars, in the so-called “hot corinos” in low-mass star forming regions, and towards “hot massive cores” in high-mass star forming regions (e.g., Taquet et al. 2015, Bonfand et al. 2019). Very recently we started observing COMs also towards starless and pre-stellar cores (Bacmann et al. 2012, Bizzocchi et al. 2014, Jiménez-Serra et al. 2016), and it seems that these molecules trace very well the earliest phases of star-formation, before the ignition of the star. The formation of CH3OH is a starting point for the molecular complexity: along the CO-H2CO-CH3OH formation chain, recombination of the reaction intermediates result in larger COMs (e.g., Garrod et al. 2006, Chuang et al. 2016, 2017). However, it is still unclear how much of the chemical complexity observed towards protostars is inherited from the pre-stellar phase. Deuterium fractionation of CH3OH is likely the best tool to provide quantitative constraints to this question.
In this paper, we report the first detection of CHD2OH towards two pre-stellar cores, H-MM1 and L694-2. H-MM1 is a late-stage pre-stellar core which is located in active star-forming environment Ophiuchus and characterised by strong CO depletion and high level of deuteration (Parise et al. 2011, Harju et al. 2017). Recent work by Pineda et al. (2022) revealed evidence of NH3 freeze-out. L694-2 is a relatively isolated pre-stellar core (Lee & Myers 2011, Spezzano et al. 2016) and shows extended infall motions (Keown et al. 2016, Kim et al. 2022) resembling the proto-typical pre-stellar core L1544 (Keto & Caselli 2010, Redaelli et al. 2022), but appears less centrally concentrated (Williams et al. 2006). We also report the non-detection of CHD2OH towards two starless cores B68 and L1521E. Both show less CO freeze-out and smaller molecular D/H than the two pre-stellar cores (Bergin et al. 2002, Tafalla & Santiago 2004a, Crapsi et al. 2005, Nagy et al, in prep.). L1521E is located in Taurus as L1544, but it appears less evolved (Hirota et al. 2002, Tafalla & Santiago 2004a, Nagy et al. 2019). B68 is an isolated starless core that shows kinematic features of oscillations, presenting a stage prior to contraction (Lada et al. 2003, Keto & Caselli 2008). In this work, with the D/H ratios constrained from CH2DOH and CHD2OH towards the four cores, we reveal an evolutionary picture of the deuterium fractionation of CH3OH towards low-mass cores prior to star formation. These new observations provide important constraints for the state-of-the-art chemical models, and lend support to the formation pathways of CH3OH.
2 Observations
Observations of the singly and doubly deuterated CH3OH lines with upper level energies 6-10 K (Table 1) were taken towards the dust peak of the target cores (Table 2) with the IRAM 30m telescope (Pico Veleta, Spain), during August to September 2022 (Project: 061-22, PI: Y. Lin) with good weather conditions (0.03-0.05). The EMIR E090 receiver was used with the Fourier Transform Spectrometer backend (FTS) that has a spectral resolution of 50 kHz (0.18 km s-1 at 82.16 GHz). The achieved root mean square (rms) level (1) over the 0.18 km s-1 channel is mostly 1-3 mK (in scale), listed for each line and source specifically in Table 6. The rms achieved for B68 is a bit worse, of 4 mK, as in the end less observational time was spent on the source. The data were processed with Gildas software111https://www.iram.fr/IRAMFR/GILDAS/ (Pety 2005). The antenna temperatures () were converted to main-beam brightness temperature () with efficiencies interpolated according to the online table 222https://publicwiki.iram.es/Iram30mEfficiencies, e.g., = 0.81 at 86.6 GHz.
For L1521E, we additionally adopted a previous 30m observation (PI: Z. Nagy) of the CH2DOH 20,2-10,1 line. The rms level is 4 mK. The observations of the main isotopologue CH3OH were also taken previously and published in Spezzano et al. (2020). Six and -type CH3OH lines were available. The line parameters are also listed in Table 1.
| Molecule | Transitions | Frequency | |||
|---|---|---|---|---|---|
| (MHz) | (K) | 10-5 s-1 | (10cm-3) | ||
| CH2DOH | 11,0-10,1 | 85296.90 | 6.2 | 0.45 | - |
| 21,1-20,2 | 86668.86 | 10.6 | 0.46 | - | |
| a20,2-10,1 | 89407.91 | 6.4 | 0.20 | - | |
| CHD2OH | 20,1-10,1 | 83289.63 | 6.0 | 0.22 | - |
| 21,2-11,2 | 82165.82 | 9.1 | 0.16 | - | |
| CH3OH | 51,5-40,4 | 84521.17 | 40.4 | 0.20 | 57.1 |
| 21,2-11,1 | 96739.35 | 12.5 | 0.26 | 1.3 | |
| 20,2-10,1 | 96741.37 | 7.0 | 0.34 | 0.7 | |
| 20,2-10,1 | 96744.54 | 20.0 | 0.34 | 15.4 | |
| 21,2-11,1 | 96755.50 | 28.0 | 0.26 | 31.5 | |
| 2-1,2-1-1,1 | 97582.80 | 21.6 | 0.26 | 59.4 |
| Source | R.A. | Dec. | Type |
|---|---|---|---|
| (J2000) | (J2000) | ||
| L1521E | 04:29:15.7 | 26:14:05.0 | Starless |
| B68 | 17:22:38.9 | 23:49:46.0 | Starless |
| H-MM1 | 16:27:58.3 | 24:33:42.0 | Pre-stellar |
| L694-2 | 19:41:04.5 | 10:57:02.0 | Pre-stellar |
-
•
The coordinates listed correspond to the dust peak of each core (Spezzano et al. 2020).
3 Results
3.1 The obtained spectra
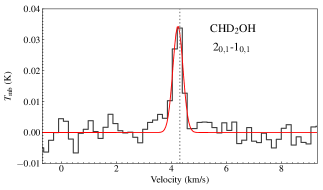
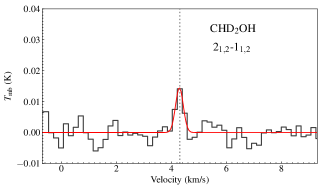
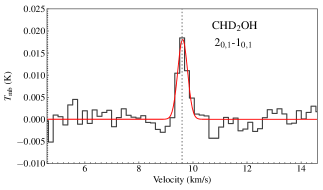
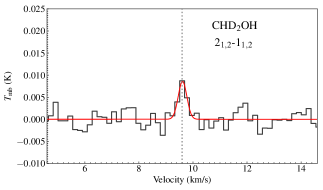
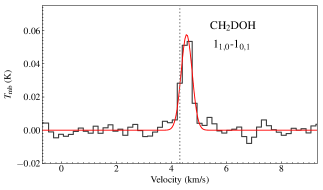
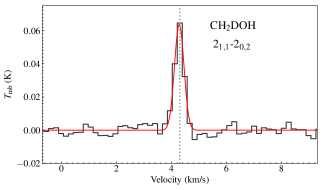
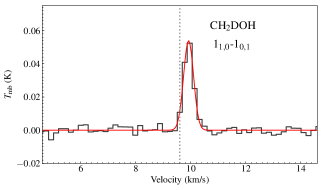
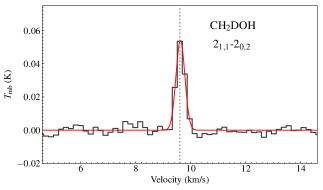
We detected two CH2DOH lines and two CHD2OH lines towards pre-stellar cores H-MM1 and L694-2. Towards the starless core L1521E we only detected CH2DOH lines, while towards starless core B68 none of the targeted lines were detected. The two CHD2OH lines are shown in Fig. 1, and the two CH2DOH lines are shown in Fig. 3. The detected CH2DOH and CHD2OH lines were fitted with a single Gaussian profile with parameters of peak main beam brightness temperature (), linewidth () and system velocity (). The parameters are listed in Table 6.
We find that the linewidths (Full width at half maximum, ) of CH2DOH and CHD2OH lines are similar (within 40 difference) and also close to that of CH3OH lines. The centroid velocities () are also consistent between the CH2DOH 21,1-20,2 line, two CHD2OH lines and the CH3OH lines. We note that if we use the CH2DOH line catalogue available on the JPL database333https://spec.jpl.nasa.gov/ftp/pub/catalog/c033004.cat, there is a 0.2-0.3 km/s shift between the rest velocities of the two CH2DOH lines and the lines of the main isotopologue. This discrepancy, however, is not present in one of the CH2DOH lines if we use the rest frequencies measured in the laboratory and tabulated in the corresponding paper (Coudert et al. 2014). The difference between the frequencies in the catalogue and that measured in the laboratory is small but appear significant in cold sources with small linewidths, and it is the consequence of the very complex hamiltonian required to reproduce the spectra for these asymmetric internal rotors. We note that for cold sources with very narrow lines, the spectroscopy papers should be checked together with the catalogues for any inconsistencies.
3.2 CH3OH column densities
The observed six CH3OH lines are listed in Table 1 and span a range of . For H-MM1 all six lines are detected (¿4), while for other sources only the three transitions with the lowest are detected (21,2-11,1 , 20,2-10,1 , 20,2-10,1 ). The 3 noise levels were used as upper limits for the line intensities of non-detections.
We use non-Local Thermal Equilibrium (non-LTE) RADEX (van der Tak et al. 2007) models to constrain the column densities of CH3OH (), following the Markov chain Monte Carlo procedure elaborated in Lin et al. (2022b). The observed CH3OH lines have a range of critical densities (Table 1), some of which are larger than the typical gas densities of pre-stellar cores, such that local thermal equilibrium (LTE) conditions are not met (c.f. Bizzocchi et al. 2014). The models of and -type CH3OH lines are computed separately, considering only collisions with para-H2 (Rabli & Flower 2010); the ortho- to para-H2 ratio (OPR) is assumed to be low, which is valid for dense molecular clouds, e.g., OPR0.01 at 10cm-3 (Lupi et al. 2021). Collisions with ortho-H2 are neglected in the modeling. Since the collisional de-excitation rates for temperatures lower than 10 K are not available, in the model we use the rates at 10 K for lower temperatures. The three parameters in the fitting are hydrogen volume densities (), gas kinetic temperature () and specific column densities of -CH3OH or -CH3OH (). and -type lines are fitted together assuming same column densities of and -type CH3OH.
For H-MM1, and can be well constrained with six transitions, and is estimated to be 10.70.5 K and (1.10.3)106 cm-3, respectively. For other sources with only three detected lines, in the fitting we assumed a on average of 10 K with a standard deviation of 5 K, following a normal distribution. The for L694-2, L1521E and B68 are estimated to be 0.7104 cm-3, 1.0104 cm-3 and 0.5104 cm-3, respectively. As a note, the central densities of the three cores, previously estimated from dust emission, are 1-3105 cm-3 (Redaelli et al. 2018, Tafalla & Santiago 2004b, Alves et al. 2001), while those for H-MM1 is 2106 cm-3 (Harju et al. 2017, Pineda et al. 2022). Within the uncertainties, the discrepancy of the constrained with the central densities of the three cores indicates that the emission of these lower transitions of CH3OH within the beam is dominated by outer gas layers, but nonetheless reflect the lower gas densities on average, w.r.t to H-MM1. The excitation temperatures for the three transitions of the three cores are constrained to be 4-5 K, indicating sub-thermal excitations, while transitions of H-MM1 are more close to LTE. Furthermore, the model results show that the optical depths of the two transitions with lowest for the three sources are already moderately optically thick (1.0-1.5), while that of H-MM1 are optically thin (0.2). The derived total for the four sources are listed in Table 3.
| Core | H-MM1 | L694-2 | L1521E | B68 |
|---|---|---|---|---|
| N/1013 cm-2 | ||||
| 3.2(0.2) | 6.0(3.0) | 5.4(2.6) | 3.6(1.4) | |
|
|
|
|
3.3 Singly deuterated methanol (CH2DOH) and doubly deuterated methanol (CHD2OH)
We calculated the column densities of CH2DOH and CHD2OH assuming LTE and optically thin emission, following the form (c.f. Bizzocchi et al. 2014),
Here is the degeneracy of the upper level, is the Einstein coefficient, is the energy of the upper level, is the excitation temperature and is the corresponding partition function, is the light speed, is the rest frequency, is the integrated emission. And stands for the Rayleigh-Jeans equivalent temperature.
The partition function for CHD2OH is adopted from the CDMS catalog, with values updated by Drozdovskaya et al. (2022). For CH2DOH we use the JPL entry, based on Pearson et al. (2012). We further estimated the at lower temperatures by summing up all energy levels (). We calculated the column densities ( and ) with variations of within 5-8 K and assumed a calibration error of 20 for deriving the uncertainties. For B68 and several lines of L1521E that have no robust detection, we derived column density upper limits assuming a peak intensity of 5 and a linewidth of 0.5 km s-1.
Incorporating the possible variations of and calibration errors, the for H-MM1 is estimated to be 1.8 cm-2, for L694-2 is 1.5 cm-2. For L1521E the upper limit of derived from the one non-detected CH2DOH line is 0.3 cm-2, compatible with the value estimated from one of the detected lines CH2DOH 11,1-10,1, but not the other, the 20,2-10,1 line. This is possibly due to the higher noise level of the latter observation of 3.5 mK (compared to 1.5 mK). Therefore for L1521E we took as 0.3 cm-2, accounting for these uncertainties. Upper limit of of B68 is 0.51012 cm-2. The for H-MM1 and L694-2 are 1.4 cm-2 and 0.8 cm-2, respectively. Upper limits of for B68 and L1521E are 1.0 cm-2 and 0.4 cm-2. The difference of the upper limits originates from the different rms levels reached for the two sources. The calculated column densities are listed in Table 4.
| N/1012 cm-2a | ||||||
| = | 5 K | 6.5 K | 8 K | 5 K | 6.5 K | 8 K |
| Core | H-MM1 | L694-2 | ||||
| CH2DOH 11,1-10,1 | 1.60.4 | 1.60.3 | 1.80.4 | 1.30.3 | 1.30.3 | 1.50.3 |
| CH2DOH 21,1-20,2 | 2.10.5 | 1.80.3 | 1.80.4 | 1.70.3 | 1.40.4 | 1.40.3 |
| CHD2OH 20,1-10,1 | 1.30.2 | 1.20.2 | 1.20.2 | 0.70.1 | 0.80.2 | 0.90.2 |
| CHD2OH 21,2-11,2 | 1.20.2 | 1.40.3 | 1.60.3 | 0.70.1 | 0.70.1 | 0.70.1 |
| B68 | L1521E | |||||
| CH2DOH 11,1-10,1 | ¡0.5 | ¡0.6 | ¡0.6 | 0.20.1 | 0.20.1 | 0.20.1 |
| CH2DOH 21,1-20,2 | ¡0.8 | ¡0.7 | ¡0.7 | ¡0.3 | ¡0.3 | ¡0.3 |
| CH2DOH 20,2-10,1 | - | - | - | 0.50.1 | 0.50.1 | 0.60.1 |
| CHD2OH 20,1-10,1 | ¡2.0 | ¡2.0 | ¡2.0 | ¡0.7 | ¡0.7 | ¡0.7 |
| CHD2OH 21,2-11,2 | ¡0.8 | ¡0.9 | ¡1.0 | ¡0.3 | ¡0.4 | ¡0.4 |
-
•
a Uncertainties are calculated considering 20 calibration errors.
3.4 Discussion and conclusions
We can first put the deuteration of CH3OH into a general context of molecular deuteration in pre-stellar cores. Deuterations of various molecules are well studied towards the proto-typical pre-stellar core L1544, which is on the verge of protostar formation and has a central density of 107 cm-3 (Keto & Caselli 2010). The two pre-stellar cores in our sample, L694-2 and H-MM1 appear less dense in the center than L1544 (see Sect. 3.2). Towards the dust peak of L1544, the column density ratios of the singly deuterated molecules w.r.t to the main isotopomers are [-C3HD]/[-C3H2]0.17, [HDCO]/[]0.04, [HDCS]/[]0.12, /0.04, /0.26 (Chacón-Tanarro et al. 2019, Redaelli et al. 2019, Spezzano et al. 2022). For CH3OH, Bizzocchi et al. (2014) and Chacón-Tanarro et al. (2019) derived a 0.08, which shows that the deuteration level of CH3OH is intermediate among these molecules. Vastel et al. (2014) suggests that the emission of CH3OH towards L1544 in fact traces an outer layer of the core (see also Spezzano et al. 2017, Lin et al. 2022a). The ratios of the column densities of doubly deuterated molecules and the singly deuterated ones, however, show a different picture among these molecules, with [-]/[-]0.10, []/[HDCO]1.15, [HDCS]/[]1.00 (Spezzano et al. 2013, 2022).
Since deuteration fractionation depends heavily on the physical and chemical parameters of the cores, it is critical to verify if the observed D/H ratios of the dense cores are legacies from the preceding evolutionary stages and remain as fossil records, and how they differ with that in comets and meteorites of solar system (Ceccarelli et al. 2014, Nomura et al. 2022). These questions can be answered by examining the variations of D/H ratios in dense cores prior to star formation. In this context, Chantzos et al. 2018 find that the D/H ratios of -C3H2 do not show significant variations over the core evolution. On the other hand, the D/H ratios of N2H+ show a considerable increase in the dynamically more evolved pre-stellar core L1544 (Crapsi et al. 2005). As a note, the N2D+/N2H+ ratio of H-MM1 is 0.43 (Punanova et al. 2016), and N2D+/N2H+ of L1544 and L694-2 are 0.25 (Crapsi et al. 2005). The D/H ratios of HCO+ and H2CO are suggested to have a similar evolutionary effect, showing correlations with CO depletion and gas density (Caselli et al. 1999, Bacmann et al. 2002, 2003).
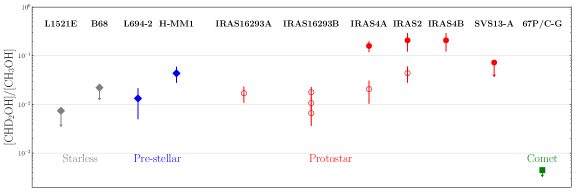
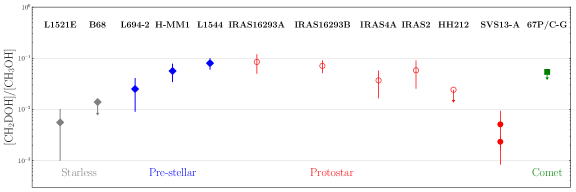
We estimated the column density ratios of []/[] and []/[] for the four starless and pre-stellar cores. We present summary plots in Fig. 2 of four types of objects: starless and pre-stellar cores, protostars, and comets, with values collected from the literature.
|
|
The for H-MM1 and L694-2 is 0.060.02 and 0.030.02, respectively, which are lower than what is measured towards L1544 (Bizzocchi et al. (2014), Chacón-Tanarro et al. 2019); starless cores L1521E and B68 show considerably lower values, for L1521E the ratio is 0.0060.005, and the upper limit for B68 is 0.014 (Fig. 2, left panel). Meanwhile, the for H-MM1 and L694-2 are 0.80.4 and 0.50.3. Compared with , these ratios suggest a higher D/H ratio of the di-deuterated molecules than the mono-deuterated ones, showing a similar picture as that in Class 0 objects (Drozdovskaya et al. 2022). High-angular resolution, interferometric observations towards Class 0 objects reveal that the are 0.2-0.7 (Drozdovskaya et al. 2022, Taquet et al. 2019), consistent with our results based on single-dish observations towards pre-stellar cores (Fig. 2, right panel). These higher than 0.5 ratios of are also consistent those derived by single-dish observations towards hot corinos (Parise et al. 2006, Agúndez et al. 2019, Bianchi et al. 2017a), with the latter supposedly tracing more of the extended envelope. Since the deuteration in hot corino is expected to be lower than in the colder envelope due to the gradient of deuteration in ices and evaporations of different parts of the ices (Taquet et al. 2014), our results, which are limited by angular resolution, do not yet suggest a strong evolutionary effect of from the pre-stellar stage to the star-forming stage (Fig. 2, right panel). Future interferometric observations of CHD2OH towards pre-stellar cores are required to properly separate different emitting gas components (that of the main isotopologue as well), and to pin down the emission region for more stringent determinations of the column density ratios.
Taking into consideration the statistical correction associated with the CH3 functional group (c.f. Appendix B of Manigand et al. 2019), the D/H ratios calculated from and for the two pre-stellar cores range from 0.01-0.02 and 0.07-0.12 (Table 5), respectively, consistent with that towards Class 0 objects (Parise et al. 2006, Taquet et al. 2019, Drozdovskaya et al. 2022). While starless cores L1521E and B68 show a lower D/H value (or upper limits). The increasing and relatively high D/H ratios of CH3OH in more evolved pre-stellar cores is a strong observational evidence that methanol form in relatively late-stage cores which are prior to collapse, an environment characterised by high D/H atomic ratio and abundant CO in the ice for hydrogenation. We summarise the two D/H ratios of the four cores in Table 5.
| Used abundance ratio | Derived D/H () | |||
|---|---|---|---|---|
| H-MM1 | L694-2 | L1521E | B68 | |
| CH2DOH/CH3OH | 1.90.7 | 0.80.5 | 0.20.1 | ¡0.5 |
| CHD2OH/CH3OH | 12.12.2 | 7.02.1 | ¡5 | ¡9 |
Ambrose et al. (2021) observed CH2DOH towards 12 starless and pre-stellar cores in Taurus and revealed an evolutionary variation of the D/H ratio. Our new observations confirm the evolutionary trend of deuterium fraction of CH3OH, from both singly- and doubly-deuterated forms, for starless and pre-stellar cores (Table 5). As previously suggested, the extreme deuterium fraction of the more evolved, star-forming cores is likely inherited from the pre-stellar stage (Ceccarelli et al. 2014). Linking to the measurements towards the volatiles and the dust of comet, Drozdovskaya et al. (2021) revealed a similar D/H ratio estimated from CH2DOH of comet 67P/Churyumov-Gerasimenko (hereafter 67P/C-G) and Class 0/I objects; we confirmed that the chemical heritage is generated from the pre-stellar stage. On the other hand, D/H based on CHD2OH show higher levels than comet 67P/C-G, which may imply a further processing of the doubly deuterated form or small-scale non-uniformity down to the comet scale. In particular, the warming up of the originally cold extended envelope, which has a lower molecular D/H ratio, likely causes the decrease of the observed molecular D/H from Class 0 to Class I object (Bianchi et al. 2017b, see Fig. 2 for SVS-13A, the only Class I object in category Protostar). There might be a similar origin for the materials ending up in comet; further evidence may be collected from more observations on the D/H ratios in spatially resolved Class I objects. Another possibility to explain this difference is that our Solar System probably formed in a warmer environment, e.g., in a large cluster-forming region, where external illumination may have increased the overall temperature of the Solar Nebula (Adams 2010), and is characterised by lower D/H ratio.
Compared to the laboratory experiment results of the D/H (Nagaoka et al. 2005, 2007, Hidaka et al. 2009), D/H from CHD2OH towards pre-stellar cores are lower, while D/H from CH2DOH are consistent with the measurements. Drozdovskaya et al. 2022 attribute this discrepancy as the over H-D substitution for the formation of the di-deuterated species; the over-availability of D atoms in the experiments resembles more of the conditions in pre-stellar stage. Our results confirm that towards the pre-stellar cores, the inconsistencies with experimental predictions still persist. On the other hand, the high D2/D ratio towards pre-stellar cores may point to an efficient H addition to D2CO in the formation of CHD2OH (Hidaka et al. 2009). In fact, the D2CO/HDCO column density ratio towards one proto-stellar core SM1 in Ophiuchi A (Kawabe et al. 2018, Chen & Hirano 2018), is estimated to be larger than 1 (Bergman et al. 2011), indicative of the efficient abstraction and substitution process in forming D2CO as ingredients of CHD2OH. Similarly, the D2CS/HDCS ratio was also found to be 1 towards L1544 (Spezzano et al. 2022), suggesting an efficient formation of the doubly deuterated form D2CX (with X = O or S).
Comparing the observed D/H with current theoretical studies of methanol deuteration based on gas-grain chemical models (Taquet et al. 2014), the D/H from CH2DOH are compatible, while D/H from CHD2OH is strongly underestimated (a factor of 10) by the models. This, together with the discrepancy between the observed D/H from CHD2OH and the aforementioned laboratory results, suggest that our current understanding of the formation pathways of the doubly deuterated CH3OH, and in a broader sense, the modeling of chemical reactions on interstellar ices, still need to be improved in future works.
Acknowledgements.
The authors acknowledge the financial support of the Max Planck Society. YL wishes to thank Pablo Torne, Damour Frédéric and Santiago Joaqín for their kind help during the 30m observations.References
- Adams (2010) Adams, F. C. 2010, ARA&A, 48, 47
- Agúndez et al. (2019) Agúndez, M., Marcelino, N., Cernicharo, J., Roueff, E., & Tafalla, M. 2019, A&A, 625, A147
- Alves et al. (2001) Alves, J. F., Lada, C. J., & Lada, E. A. 2001, Nature, 409, 159
- Ambrose et al. (2021) Ambrose, H. E., Shirley, Y. L., & Scibelli, S. 2021, MNRAS, 501, 347
- Bacmann et al. (2002) Bacmann, A., Lefloch, B., Ceccarelli, C., et al. 2002, A&A, 389, L6
- Bacmann et al. (2003) Bacmann, A., Lefloch, B., Ceccarelli, C., et al. 2003, ApJ, 585, L55
- Bacmann et al. (2012) Bacmann, A., Taquet, V., Faure, A., Kahane, C., & Ceccarelli, C. 2012, A&A, 541, L12
- Bergin et al. (2002) Bergin, E. A., Alves, J., Huard, T., & Lada, C. J. 2002, ApJ, 570, L101
- Bergman et al. (2011) Bergman, P., Parise, B., Liseau, R., & Larsson, B. 2011, A&A, 527, A39
- Bianchi et al. (2017a) Bianchi, E., Codella, C., Ceccarelli, C., et al. 2017a, MNRAS, 467, 3011
- Bianchi et al. (2017b) Bianchi, E., Codella, C., Ceccarelli, C., et al. 2017b, A&A, 606, L7
- Bizzocchi et al. (2014) Bizzocchi, L., Caselli, P., Spezzano, S., & Leonardo, E. 2014, A&A, 569, A27
- Bonfand et al. (2019) Bonfand, M., Belloche, A., Garrod, R. T., et al. 2019, A&A, 628, A27
- Caselli & Ceccarelli (2012) Caselli, P. & Ceccarelli, C. 2012, A&A Rev., 20, 56
- Caselli et al. (1999) Caselli, P., Walmsley, C. M., Tafalla, M., Dore, L., & Myers, P. C. 1999, ApJ, 523, L165
- Ceccarelli et al. (2014) Ceccarelli, C., Caselli, P., Bockelée-Morvan, D., et al. 2014, in Protostars and Planets VI, ed. H. Beuther, R. S. Klessen, C. P. Dullemond, & T. Henning, 859
- Ceccarelli et al. (2007) Ceccarelli, C., Caselli, P., Herbst, E., Tielens, A. G. G. M., & Caux, E. 2007, in Protostars and Planets V, ed. B. Reipurth, D. Jewitt, & K. Keil, 47
- Chacón-Tanarro et al. (2019) Chacón-Tanarro, A., Caselli, P., Bizzocchi, L., et al. 2019, A&A, 622, A141
- Chantzos et al. (2018) Chantzos, J., Spezzano, S., Caselli, P., et al. 2018, ApJ, 863, 126
- Chen & Hirano (2018) Chen, Y.-C. & Hirano, N. 2018, ApJ, 868, 80
- Chuang et al. (2016) Chuang, K. J., Fedoseev, G., Ioppolo, S., van Dishoeck, E. F., & Linnartz, H. 2016, MNRAS, 455, 1702
- Chuang et al. (2017) Chuang, K. J., Fedoseev, G., Qasim, D., et al. 2017, MNRAS, 467, 2552
- Coudert et al. (2014) Coudert, L. H., Zemouli, M., Motiyenko, R. A., Margulès, L., & Klee, S. 2014, The Journal of Chemical Physics, 140, 064307
- Crapsi et al. (2005) Crapsi, A., Caselli, P., Walmsley, C. M., et al. 2005, ApJ, 619, 379
- Dalgarno & Lepp (1984) Dalgarno, A. & Lepp, S. 1984, ApJ, 287, L47
- Drozdovskaya et al. (2022) Drozdovskaya, M. N., Coudert, L. H., Margulès, L., et al. 2022, A&A, 659, A69
- Drozdovskaya et al. (2021) Drozdovskaya, M. N., Schroeder I, I. R. H. G., Rubin, M., et al. 2021, MNRAS, 500, 4901
- Garrod et al. (2006) Garrod, R., Park, I. H., Caselli, P., & Herbst, E. 2006, Faraday Discussions, 133, 51
- Garrod & Herbst (2006) Garrod, R. T. & Herbst, E. 2006, A&A, 457, 927
- Harju et al. (2017) Harju, J., Daniel, F., Sipilä, O., et al. 2017, A&A, 600, A61
- Herbst & van Dishoeck (2009) Herbst, E. & van Dishoeck, E. F. 2009, ARA&A, 47, 427
- Hidaka et al. (2009) Hidaka, H., Watanabe, M., Kouchi, A., & Watanabe, N. 2009, ApJ, 702, 291
- Hirota et al. (2002) Hirota, T., Ito, T., & Yamamoto, S. 2002, ApJ, 565, 359
- Jiménez-Serra et al. (2016) Jiménez-Serra, I., Vasyunin, A. I., Caselli, P., et al. 2016, ApJ, 830, L6
- Jørgensen et al. (2016) Jørgensen, J. K., van der Wiel, M. H. D., Coutens, A., et al. 2016, A&A, 595, A117
- Kawabe et al. (2018) Kawabe, R., Hara, C., Nakamura, F., et al. 2018, ApJ, 866, 141
- Keown et al. (2016) Keown, J., Schnee, S., Bourke, T. L., et al. 2016, ApJ, 833, 97
- Keto & Caselli (2008) Keto, E. & Caselli, P. 2008, ApJ, 683, 238
- Keto & Caselli (2010) Keto, E. & Caselli, P. 2010, MNRAS, 402, 1625
- Kim et al. (2022) Kim, S., Lee, C. W., Tafalla, M., et al. 2022, arXiv e-prints, arXiv:2209.14943
- Lada et al. (2003) Lada, C. J., Bergin, E. A., Alves, J. F., & Huard, T. L. 2003, ApJ, 586, 286
- Lee & Myers (2011) Lee, C. W. & Myers, P. C. 2011, ApJ, 734, 60
- Lin et al. (2022a) Lin, Y., Spezzano, S., Sipilä, O., Vasyunin, A., & Caselli, P. 2022a, A&A, 665, A131
- Lin et al. (2022b) Lin, Y., Wyrowski, F., Liu, H. B., et al. 2022b, A&A, 658, A128
- Linsky (2003) Linsky, J. L. 2003, Space Sci. Rev., 106, 49
- Lupi et al. (2021) Lupi, A., Bovino, S., & Grassi, T. 2021, A&A, 654, L6
- Manigand et al. (2019) Manigand, S., Calcutt, H., Jørgensen, J. K., et al. 2019, A&A, 623, A69
- Nagaoka et al. (2005) Nagaoka, A., Watanabe, N., & Kouchi, A. 2005, ApJ, 624, L29
- Nagaoka et al. (2007) Nagaoka, A., Watanabe, N., & Kouchi, A. 2007, Journal of Physical Chemistry A, 111, 3016
- Nagy et al. (2019) Nagy, Z., Spezzano, S., Caselli, P., et al. 2019, A&A, 630, A136
- Nomura et al. (2022) Nomura, H., Furuya, K., Cordiner, M. A., et al. 2022, arXiv e-prints, arXiv:2203.10863
- Parise et al. (2011) Parise, B., Belloche, A., Du, F., Güsten, R., & Menten, K. M. 2011, A&A, 526, A31
- Parise et al. (2006) Parise, B., Ceccarelli, C., Tielens, A. G. G. M., et al. 2006, A&A, 453, 949
- Parise et al. (2002) Parise, B., Ceccarelli, C., Tielens, A. G. G. M., et al. 2002, A&A, 393, L49
- Pearson et al. (2012) Pearson, J. C., Yu, S., & Drouin, B. J. 2012, Journal of Molecular Spectroscopy, 280, 119
- Pety (2005) Pety, J. 2005, in SF2A-2005: Semaine de l’Astrophysique Francaise, ed. F. Casoli, T. Contini, J. M. Hameury, & L. Pagani, 721
- Pineda et al. (2022) Pineda, J. E., Harju, J., Caselli, P., et al. 2022, AJ, 163, 294
- Punanova et al. (2016) Punanova, A., Caselli, P., Pon, A., Belloche, A., & André, P. 2016, A&A, 587, A118
- Rabli & Flower (2010) Rabli, D. & Flower, D. R. 2010, MNRAS, 406, 95
- Redaelli et al. (2018) Redaelli, E., Bizzocchi, L., Caselli, P., et al. 2018, A&A, 617, A7
- Redaelli et al. (2019) Redaelli, E., Bizzocchi, L., Caselli, P., et al. 2019, A&A, 629, A15
- Redaelli et al. (2022) Redaelli, E., Chacón-Tanarro, A., Caselli, P., et al. 2022, arXiv e-prints, arXiv:2210.13571
- Roberts et al. (2004) Roberts, H., Herbst, E., & Millar, T. J. 2004, A&A, 424, 905
- Roueff et al. (2005) Roueff, E., Lis, D. C., van der Tak, F. F. S., Gerin, M., & Goldsmith, P. F. 2005, A&A, 438, 585
- Spezzano et al. (2016) Spezzano, S., Bizzocchi, L., Caselli, P., Harju, J., & Brünken, S. 2016, A&A, 592, L11
- Spezzano et al. (2013) Spezzano, S., Brünken, S., Schilke, P., et al. 2013, ApJ, 769, L19
- Spezzano et al. (2017) Spezzano, S., Caselli, P., Bizzocchi, L., Giuliano, B. M., & Lattanzi, V. 2017, A&A, 606, A82
- Spezzano et al. (2020) Spezzano, S., Caselli, P., Pineda, J. E., et al. 2020, A&A, 643, A60
- Spezzano et al. (2022) Spezzano, S., Sipilä, O., Caselli, P., et al. 2022, A&A, 661, A111
- Tafalla & Santiago (2004a) Tafalla, M. & Santiago, J. 2004a, A&A, 414, L53
- Tafalla & Santiago (2004b) Tafalla, M. & Santiago, J. 2004b, A&A, 414, L53
- Taquet et al. (2019) Taquet, V., Bianchi, E., Codella, C., et al. 2019, A&A, 632, A19
- Taquet et al. (2012) Taquet, V., Ceccarelli, C., & Kahane, C. 2012, ApJ, 748, L3
- Taquet et al. (2014) Taquet, V., Charnley, S. B., & Sipilä, O. 2014, ApJ, 791, 1
- Taquet et al. (2015) Taquet, V., López-Sepulcre, A., Ceccarelli, C., et al. 2015, ApJ, 804, 81
- Tielens & Hagen (1982) Tielens, A. G. G. M. & Hagen, W. 1982, A&A, 114, 245
- van der Tak et al. (2007) van der Tak, F. F. S., Black, J. H., Schöier, F. L., Jansen, D. J., & van Dishoeck, E. F. 2007, A&A, 468, 627
- Vastel et al. (2014) Vastel, C., Ceccarelli, C., Lefloch, B., & Bachiller, R. 2014, ApJ, 795, L2
- Vasyunin et al. (2017) Vasyunin, A. I., Caselli, P., Dulieu, F., & Jiménez-Serra, I. 2017, ApJ, 842, 33
- Walmsley et al. (2004) Walmsley, C. M., Flower, D. R., & Pineau des Forêts, G. 2004, A&A, 418, 1035
- Watanabe & Kouchi (2002) Watanabe, N. & Kouchi, A. 2002, ApJ, 571, L173
- Watanabe & Kouchi (2008) Watanabe, N. & Kouchi, A. 2008, Progress In Surface Science, 83, 439
- Williams et al. (2006) Williams, J. P., Lee, C. W., & Myers, P. C. 2006, ApJ, 636, 952
- Xu et al. (2008) Xu, L.-H., Fisher, J., Lees, R. M., et al. 2008, Journal of Molecular Spectroscopy, 251, 305
Appendix A CH2DOH spectra
The two CH2DOH spectra observed towards H-MM1 and L694-2 are shown in Fig. 3.
|
|
|
|
Appendix B Line parameters
The line parameters of our obtained spectra towards the four cores are listed in Table 6.
| Line parameter | rms | SNR | rms | SNR | ||||||
| mK km s-1 | km s-1 | km s-1 | mK | mK km s-1 | km s-1 | km s-1 | mK | |||
| Core | H-MM1 | L694-2 | ||||||||
| CH2DOH 11,0-10,1 | 28.8(1.4) | 4.5(0.01) | 0.49(0.03) | 2.5 | 22 | 24.1(0.7) | 9.9(0.01) | 0.37(0.01) | 1.9 | 32 |
| CH2DOH 21,1-20,2 | 27.2(1.1) | 4.3(0.01) | 0.42(0.02) | 1.9 | 32 | 21.7(0.8) | 9.6(0.01) | 0.39(0.02) | 1.9 | 27 |
| CHD2OH 20,1-10,1 | 15.8(1.3) | 4.2(0.02) | 0.43(0.04) | 2.1 | 16 | 8.6(0.8) | 9.6(0.02) | 0.43(0.05) | 1.5 | 12 |
| CHD2OH 21,2-11,2 | 5.9(1.1) | 4.3(0.03) | 0.36(0.07) | 2.4 | 6 | 3.4(0.7) | 9.6(0.04) | 0.38(0.10) | 1.7 | 5 |
| L1521E | B68 | |||||||||
| CH2DOH 11,0-10,1 | 2.9(0.5) | 6.5(0.01) | 0.39(0.11) | 1.3 | 5 | ¡10.0 | - | - | 4.0 | - |
| CH2DOH 21,1-20,2 | ¡4.0 | - | - | 1.5 | - | ¡10.0 | - | - | 4.0 | - |
| CH2DOH 20,2-10,1 | 6.1(1.0) | 6.7(0.05) | 0.41(0.09) | 3.5 | 4 | - | - | - | - | - |
| CHD2OH 20,1-10,1 | ¡4.0 | - | - | 1.5 | - | ¡10.0 | - | - | 4.0 | - |
| CHD2OH 21,2-11,2 | ¡4.0 | - | - | 1.5 | - | ¡10.0 | - | - | 4.0 | - |
-
•
- indicates non-detection and the corresponding upper limit of integrated intensity is estimated assuming 5 with a linewidth of 0.5 km s-1.
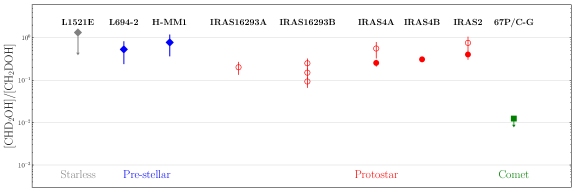
Appendix C The []/[] ratios
Similar to Fig. 2, we plot the []/[] ratios as a function of source types.