capbtabboxtable[][\FBwidth]
SEScore2: Learning Text Generation Evaluation via Synthesizing Realistic Mistakes
Abstract
Is it possible to train a general metric for evaluating text generation quality without human-annotated ratings? Existing learned metrics either perform unsatisfactorily across text generation tasks or require human ratings for training on specific tasks. In this paper, we propose SEScore2, a self-supervised approach for training a model-based metric for text generation evaluation. The key concept is to synthesize realistic model mistakes by perturbing sentences retrieved from a corpus. The primary advantage of the SEScore2 is its ease of extension to many other languages while providing reliable severity estimation. We evaluate SEScore2 and previous methods on four text generation tasks across three languages. SEScore2 outperforms unsupervised metric PRISM on four text generation evaluation benchmarks, with a Kendall improvement of . Surprisingly, SEScore2 even outperforms the supervised BLEURT and COMET on multiple text generation tasks. The code and data are available at https://github.com/xu1998hz/SEScore2111Part of the work is done while WX is an intern at ByteDance..
1 Introduction
Recently, researchers made significant progress in text generation: translation Birch (2021), structured data-to-text Gardent et al. (2017), dialogue generation Vinyals and Le (2015), and summarization Chopra et al. (2016). Automatic metrics are essential for the development of text generation models as they replace expensive human labor and are able to evaluate the generation performance Celikyilmaz et al. (2020), as well as guide the generation process Unanue et al. (2021); Freitag et al. (2022). How can we efficiently and effectively train a metric for general text generation tasks?
Depending on the inputs, we can categorize evaluation metrics into source-based, hybrid-based, and reference-based metrics. Source-based metrics estimate text quality through the source and are useful when reference is noisy or unavailable Louis and Nenkova (2013); Kepler et al. (2019), but they may produce sub-optimal results and explore spurious correlations Durmus et al. (2022). Reference-based metrics, when paired with high-quality references, can reflect text generation quality, regardless of source modalities (e.g audio and triples). Hybrid metric COMET Rei et al. (2020) uses both source and reference. In this work, we aim to construct a reference-based metric, as it is invariant to the source modality, making it suitable for use across various tasks.
Although learned metrics have been shown to be more effective than rule-based metrics (e.g BLEU Papineni et al. (2002)), they still have limitations in terms of evaluation capability and applicability to specific tasks. Supervised metrics such as BLEURT Sellam et al. (2020) and COMET Rei et al. (2020) are superior in evaluation, but restricted to tasks with human ratings of generated text. Unsupervised metrics, such as BERTScore Zhang et al. (2019) and BARTScore Yuan et al. (2021), do not require human ratings for training, but their correlation with human judgment on specific tasks is still inferior compared to the best supervised metrics Freitag et al. (2021b).
Our goal of this paper is to devise a reference-based automatic evaluation metric that 1) can be learned without a human quality score, 2) align well with human judgments, and 3) can be generalized to a wide variety of domains and NLG tasks. To achieve this, we propose a self-supervised training method using text with synthetic mistakes. Our main intuition is that these synthetic mistakes should contain errors at different severity levels and appear realistic ("realistic mistakes” are defined as natural and model output-like mistakes). We are inspired by the human evaluation protocol MQM Freitag et al. (2021a) which assesses translation quality by identifying errors with two levels of severity. To make the synthetic mistakes realistic, we mine surface differences among groups of similar sentences and use these different phrases to perturb the original text and construct mistakes (See Figure 2). Unlike previous methods that utilize generative models to synthesize errors Xu et al. (2022), our approach employs retrieved similar sentences, making it more general. To encompass text diversity, anchor texts are sampled from large-scale parallel corpora. Additionally, a novel pretraining signal is proposed to train SEScore2, which aims to resemble the way humans grade model outputs by estimating the severity levels of each mistake Freitag et al. (2021a). To date222May 25, 2023, we support six languages: English, German, Chinese, Japanese, Russian, Spanish. The primary advantage of the SEScore2 is its ease of extension to numerous other languages while providing reliable severity estimation. Our contributions to this paper are as follows:
-
•
We propose SEScore2, a self-supervised (SSL) method to train a metric for general text generation tasks without human ratings;
-
•
We develop a technique to synthesize candidate sentences with varying levels of mistakes for training. To make these self-constructed samples realistic, we introduce retrieval augmented synthesis on anchor text;
-
•
We annotate an additional human rating dataset for WMT21 German-to-English testing set fol- lowing MQM human annotation procedure and we release it for public use;
-
•
Our experiments demonstrate that SEScore2 is effective in a wide range of NLG tasks and surpasses the top unsupervised metrics PRISM by . Additionally, it also outperforms or matches the supervised metrics in terms of Kendall correlation.
2 Related Work
Human evaluation metrics such as crowd-worker evaluation using direct assessment (DA) are widely used in WMT shared task competition Ma et al. (2018, 2019); Mathur et al. (2020). Mathur et al. (2020); Freitag et al. (2021a) find that crowd-workers fail to discriminate human and machine outputs. Freitag et al. (2021a) improves human ratings by using Multidimensional Quality Metrics (MQM) framework Lommel et al. (2014) with language experts. Each annotated error can be categorized into multiple types and is associated with different severity levels, such as major and minor.
Automatic evaluation metrics such as rule-based metrics (e.g. n-gram matching BLEU Papineni et al. (2002), chrF Popović (2015)) and distance-based (e.g. TER Snover et al. (2006)) have been commonly used in text generation evaluations because they are fast and domain invariant. However, they have limitations in capturing semantics and long-distance dependencies Zhang et al. (2019). The supervised learned metrics Rei et al. (2020); Sellam et al. (2020) are directly optimized from human ratings. However, they may have poor generalization to unseen domains and tasks Freitag et al. (2021b). Unsupervised learned metrics attempt to obtain training objectives other than human ratings Zhang et al. (2019); Zhao et al. (2019); Thompson and Post (2020); Yuan et al. (2021). However, as pointed out by Freitag et al. (2021a), they are limited on the error types that they can evaluate (e.g accuracy) and can not go beyond (e.g fluency or style). Some recent studies attempt to mitigate this issue by generating synthetic data via paraphrasing and perturbations Sellam et al. (2020); Kryscinski et al. (2020); Gao et al. (2021). To further derive the fine-grained pretraining signals, SEScore Xu et al. (2022) leverages language models to generate multiple error types in one segment and estimate each error’s severity level. However, model-dependent data synthesis can intrinsically introduce model bias and limit the diversity of data samples.
SEScore2 develops a novel retrieval augmented synthesis technique, which is task-agnostic and can simulate diverse and realistic model mistakes using the parallel corpora. Inspired by Freitag et al. (2021a), we obtain our pretraining signals aligning with human grading process.
3 Problem Definition
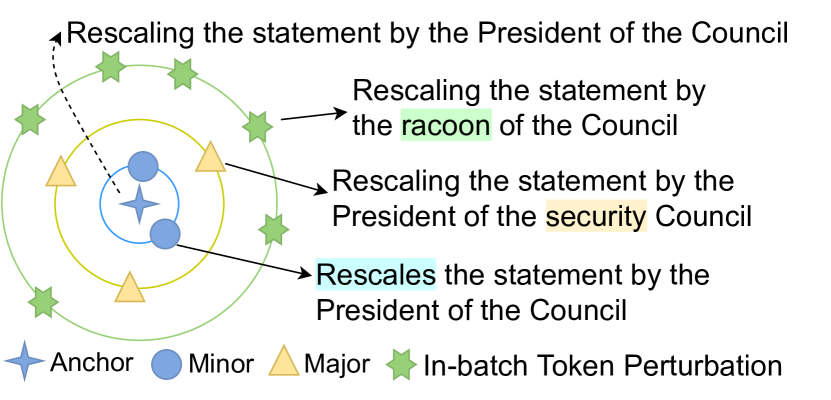
The task is to estimate the quality score between a reference and a model-generated hypothesis. Follow Freitag et al. (2021a), if the model error semantically alters the meaning of the sentence, we label it as major, otherwise as minor. See the example in Figure 1, where a 4-point star represents the reference, and circles and triangles represent the sentences with minor and major mistakes, respectively. A minor mistake contributes a score, and a major mistake contributes a score. The severity score of a hypothesis is the sum of all minor and major contributions and is no less than .
Given a set of reference, hypothesis, human-annotated severity score triples (, , ), our goal is to train a learned metric, . Due to the scarcity of human ratings, such triples are unavailable for most tasks. Thus, we propose an automatic way to generate synthetic training samples.
4 The SEScore2 Approach
SEScore2 is a SSL technique, initialized with pretrained embeddings, like BERT, then trained with task-agnostic NLG evaluation objective on large-scale synthetic data. No specific fine-tuning is required at inference time evaluation. There are three steps: 1) data construction that samples source-target pairs from machine translation (MT) corpora and creates synthetic text from using retrieval augmented synthesis; 2) severity score labeling that automatically generates label using ; 3) model training which pretrains a regression model using triples . During inference, SEScore2 only takes reference and model output as input and estimates the quality score, which can be applied to different text generation tasks. Detailed implementations of the model can be found in Appendix 5.
4.1 Retrieval Augmented Synthesis
Given a reference, a common way to generate a negative hypothesis is in-batch negative samplings or in-batch token insertions or replacements Fu et al. (2022). However, as shown in Figure 1, these approaches mainly produce negative samples that are syntactically or semantically incorrect, which are not the case for modern text generation models Freitag et al. (2021a), see Figure 1. Therefore training with these samples could not help distinguish model-generated hypotheses.
Thus we proposed to use retrieval-based approaches to search negative samples. More specifically, given a text corpus, SEScore2 finds the nearest neighbors of based on their vector representation using pretrained language embeddings (ex. LASER333We used LASER3, which supports over 200 languages.).
We control the text pair proximity by setting a margin criterion when retrieving the nearest neighbors Schwenk et al. (2021). For fast k-NN search, we use an index table. Details refer to Appendix B. Based on our preliminary study, the margin criterion () can retrieve sentences with similar text structure or semantics. Detailed numbers can be found in the Appendix C.
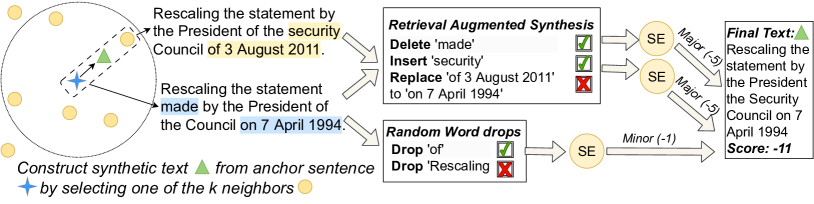
We did not always use the first nearest neighbor because, in many cases, they are too close to the anchor. To increase a diverse coverage of errors, we randomly pick one of those nearest neighbors (All circles within the loop have equal chances to be selected in Figure 2). We use edit distance algorithm Snover et al. (2006) to decompose the surface form difference between and into a chain of perturbations such as insertion, deletion, and replacement . In addition, we include random word drops to diversify the errors further. Each is a candidate perturbation to be applied to the text .
According to the human evaluation study Freitag et al. (2021a), models are most likely to produce fewer than 5 errors. Otherwise, they are labeled as catastrophic errors. Thus for each , we randomly select 5 out of the perturbations. Each time, we apply a random subset of the five perturbations to transform to a negative sample , which contains no more than 5 compositional errors. One challenge is synthesizing positive samples for the anchor since no ground truth is available. Inspired by Gao et al. (2021), we leverage the dropout function to simulate paraphrasing embeddings by feeding the anchor twice. In addition, In-batch negatives are used to approximate the catastrophic errors.
In figure 2, we demonstrate that our retrieval augmented synthesis can synthesize errors that are contextually sound but semantically or syntactically deviate from the reference. For example, drop of "of" introduces syntactical error whereas modifications of "made" and "security" introduces semantic errors.
4.2 Automatic Severity Score Labeling
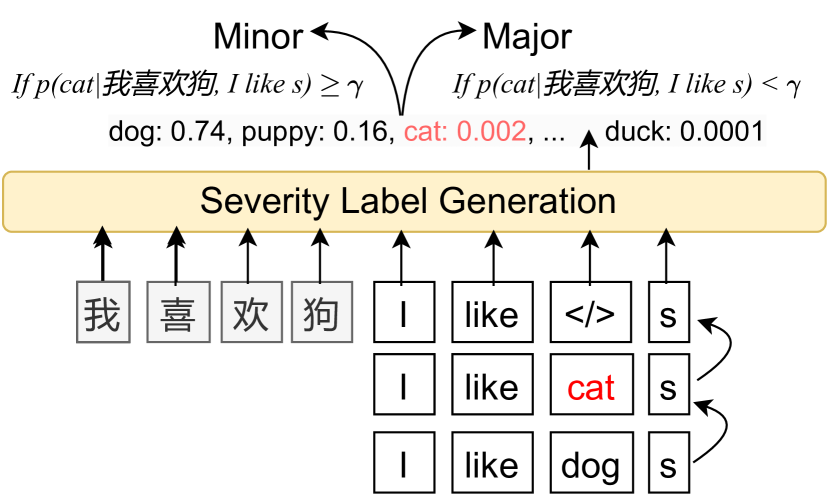
Once we get the synthesized text , we need to label its severity score. We design severity functions for all types of perturbations, and the score of a synthesized text is the sum of all severity estimations. Inspired by the human evaluation Freitag et al. (2021a), we consider two levels of severity measures: major (score: ) and minor (score: ), for each error in the candidate outputs. An error is major if it alters the core meaning of the sentence. See triangle and circle examples in Figure 1. Each perturbation is estimated independently to avoid the influence of the others. is the machine translation pair of . and will be used for insertion/replacement severity estimation.
For insertion and replacement, the severity score is determined by the likelihood of the inserted or replaced tokens. We use a cross-lingual MLM model such as XLM CONNEAU and Lample (2019) to estimate the likelihood. The intuition is that XLM with TLM can model co-occurrences and alignments between source-target tokens. If an error alters the meaning, XLM will be unlikely to restore altered tokens in the perturbed location under the MT source sentence and the rest of ’s contexts.
The severity estimation of a single perturbation on to can be decomposed into two steps: In the first step, we replace perturbed tokens of with masked tokens. Let denote the masked text after the first step, and denotes the perturbed tokens with length , probability represents the likelihood of this insertion or replacement. For the delete operation, we use TF-IDF weight to approximate the salience of deleted tokens. The importance weights of the deleted tokens are formulated as, , with tokens. Our intuition has two parts: First, we assume that delete operation creates a minor error if all deleted words lack meaningful semantics (e.g. stop words). Second, if one word in the word span has high importance weights (TF-IDF), deletion of the whole word span will alter the sentence semantics. Therefore, we find the maximum of for , instead of mean.
Lastly, an operation is minor if or , and major otherwise. where and are predefined threshold444 and for all three languages. Discussions of hyperparameter choices are included in Appendix G.
5 Quality Prediction Model
We initialized our quality prediction model with pretrained masked language model (e.g. XLM-R). During training, SEScore2 takes in text and synthesized text , supervised with regression score . We drive the sentence embedding from the average pooling of the last layer. Inspired by the prior approach Shimanaka et al. (2018), we extract two features between sentence embeddings and : 1) element-wise sentence product and 2) element-wise sentence difference. We concatenated above two features into one vector and feed into a neural network regressor and trained with mean squared error. During inference, when given unseen candidate and reference pair, SEScore2 can directly output a regression score.
6 Experiments
To verify the generalization ability of the SEScore2, we investigate the following questions:
-
•
Can SEScore2 be generalized to multiple domains of the same task?
-
•
Can SEScore2’s language checkpoint X be used to evaluate all languages Y to X’s outputs?
-
•
Can SEScore2’s language checkpoint X be used to evaluate all different text generation tasks on language X?
-
•
How to interpret SEScore2?
Corresponding to the aforementioned evaluation aspects:
-
•
We test SEScore2 over two different domains (News and TED) at WMT.
-
•
We test SEScore2 over multiple Y-to-English directions.
-
•
We test SEScore2’s English checkpoint over a diverse set of NLG tasks: Machine Translation, Speech Translation, Data-to-Text, and Dialogue Generation.
-
•
We test SEScore2 over multiple evaluation dimensions. Moreover, we conduct comprehensive experiments for each component of SEScore2 and analyze the leading factors contributing to the final result.
6.1 Pretraining Step
6.1.1 Pretraining Data
We collected our pretraining data from WMT17-19 publicly available datasets. Details of data collections can be found in the Appendix A. We randomly sampled 5M, 4.5M, and 5M sentence pairs for Zh-En, En-De, and En-Ja respectively. We use each target language sentence as an anchor to retrieve the 128 nearest neighbors to build the index table and use parallel sentences to compute severity measures. We train separate checkpoints for each language direction and we use the final English checkpoint to evaluate SEScore2 in different text generation tasks. To ensure diversity, our index table includes collected WMT News domain data and Wikipedia dumps (See Table 1 for details). We use WMT20 ZhEn and EnDe with MQM labels Freitag et al. (2021a) as our development sets.
| Index Table | Pretraining Data | |||
| Language | News | Wikipedia | Anchor | Retrieved |
| English | 20M | 20M | 5M | 13.5M |
| German | 4.5M | 16M | 4.5M | 13.2M |
| Japanese | 18M | 12M | 5M | 13.3M |
| MT(ZhEn) | MT(DeEn) | MT(EnDe) | ST(EnJa) | D2T(En) | Dialog(En) | Overall | ||
| With | BLEURT | 0.291 | 0.266 | 0.252 | 0.463 | 0.168 | 0.229 | 0.278 |
| COMET(DA) | 0.290 | 0.250 | 0.249 | 0.405 | - | - | - | |
| Without Supervision | TER | 0.173 | -0.046 | 0.115 | -0.082 | -0.090 | -0.087 | -0.003 |
| BLEU | 0.134 | 0.068 | 0.098 | 0.202 | 0.084 | 0.109 | 0.116 | |
| ChrF | 0.158 | 0.074 | 0.130 | 0.240 | 0.094 | 0.108 | 0.134 | |
| BARTScore | 0.208 | 0.047 | 0.042 | -0.123 | 0.113 | 0.203 | 0.082 | |
| BERTScore | 0.248 | 0.205 | 0.179 | 0.213 | 0.154 | 0.171 | 0.195 | |
| PRISM | 0.240 | 0.174 | 0.215 | 0.198 | 0.163 | 0.217 | 0.201 | |
| SEScore | 0.281 | 0.249 | 0.226 | 0.361 | 0.155 | 0.205 | 0.246 | |
| SEScore2 | 0.310 | 0.250 | 0.243 | 0.458 | 0.182 | 0.233 | 0.279 | |
6.1.2 Scoring Model
We use Rembert Chung et al. (2020) as the backbone for all text generation tasks (other backbone choices are discussed in the Appendix D). We use Adam optimizer and set batch size, learning rate, and dropout rate to 256, 3e-5, and 0.1 respectively. We use the mean squared error to train the metric model. All checkpoints from Rembert trained for 15,000 iterations. We use 8 A100 GPUs to train for 18 hours for each checkpoint.
6.2 Baseline Model
For all NLG tasks, we include 1) three n-gram, distance-based baseline metrics: BLEU Papineni et al. (2002), ChrF Popović (2015) and TER Snover et al. (2006); 2) four best performed learned metrics without human ratings: PRISM Thompson and Post (2020), BARTScore Yuan et al. (2021), BERTScore Zhang et al. (2019) and SEScore Xu et al. (2022); and 3) two SOTA supervised metrics: COMET 555Since COMET is a source-reference-based approach only applicable to translation tasks, we only used to generate results for machine and speech translation and BLEURT. Implementation details are discussed in Appendix E.
6.3 Evaluation Procedure
For all the text generation tasks, we compute segment-level Kendall correlation between metric outputs and human scores (We include all Spearman correlation in the Appendix Table 10, 13 and 14. They yield the same conclusion as Kendall correlation). We conduct William’s pair-wise significance test Graham and Baldwin (2014) to highlight the significant improvements.
Machine Translation
For En-De and Zh-En, we used publicly available WMT21 News and TED’s human annotations Freitag et al. (2021b). We also hired 3 professional linguists to annotate 1000 testing samples from WMT21 De-En News domain using MQM human evaluation procedures Freitag et al. (2021a). Detailed testing statistics are in Appendix Table 7 and detailed human annotation procedures are in Appendix F.
Dialogue Generation
Public BAGEL benchmark contains target utterance generation for spoken dialogue systems. This benchmark contains 202 model outputs. Each sample is annotated in the aspect of naturalness, informativeness, and quality.
Data-to-Text Generation
Public WebNLG2020 Zhou and Lampouras (2020) contains 17 models and each contains 177 outputs. Each sample is annotated by five aspects: correctness, data coverage, fluency, relevance, and text structure.
Speech-to-Text
We use IWSLT22 English-to-Japanese (En-Ja) human annotations. The benchmark contains four systems and each contains 118 outputs. All human annotations were done using JTF MQM variant JTF (2018).
6.4 Overall Performance
In Table 2, we demonstrate metrics’ overall performance in machine translation, speech translation, data-to-text, and dialogue generation. SEScore2 outperforms the best rule-based metric chrF (Kendall=) significantly in the overall Kendall correlation, with Kendall improvement of . SEScore2 outperforms all unsupervised learned metrics significantly in all four text generation tasks and three MT translation directions. In particular, SEScore2 outperforms PRISM (Kendall=) with Kendall improvement . More importantly, SEScore2 outperforms the supervised BLEURT in two of the four text generation tasks and achieves a higher Kendall correlation overall across four tasks, with Kendall improvement of in D2T(En) and in Dialog(En).
6.5 SEScore2 achieves consistent superior performance for different text generation tasks
For Machine Translation, SEScore2 outperforms all unsupervised metrics significantly across all three language directions. Despite all language directions being present in the training sets of both BLEURT and COMET, SEScore2 outperforms both supervised metrics COMET and BLEURT in Zh-En and achieves comparable performance to COMET and close performance to BLEURT at En-De and De-En. For speech translation, SEScore2 outperforms all unsupervised metrics significantly and leads COMET by a large margin. One explanation for this improvement could be that human ratings for English to Japanese were not included in COMET’s training data, highlighting the limitations of supervised metrics in unknown domains or language directions. Lastly, SEScore2 outperforms all supervised and unsupervised metrics at data-to-text and dialogue generation. Compared to BLEURT, which is supervised by translation human rating, SEScore2 can achieve superior generalization capability in non-translation tasks, such as data-to-text and dialogue generation.
6.6 SEScore2 achieves consistent superior performance for translation into the same target languages
SEScore2 is consistently better on a variety of text generation tasks with the same generation language. For the machine translation task, we further investigate SEScore2’s generalization capabilities over different languages to X translation outputs. From ZhEn and DeEn, SEScore2 outperforms all unsupervised metrics significantly. In comparison to supervised metrics, SEScore2 surpasses both BLEURT and COMET in ZhEn, and achieves a comparable performance to the COMET and 0.016 Kendall correlation gap to BLEURT at DeEn.
| Model Name | Machine Translation (WMT21) | ||||
| News | TED | Overall | |||
| With | BLEURT | 0.305 | 0.243 | 0.274 | 0.062 |
| COMET(DA) | 0.300 | 0.240 | 0.270 | 0.060 | |
| W.o Supervision | TER | 0.154 | 0.134 | 0.144 | 0.020 |
| BLEU | 0.130 | 0.103 | 0.117 | 0.027 | |
| ChrF | 0.158 | 0.135 | 0.147 | 0.023 | |
| BARTScore | 0.140 | 0.111 | 0.126 | 0.029 | |
| BERTScore | 0.232 | 0.194 | 0.213 | 0.038 | |
| PRISM | 0.239 | 0.216 | 0.228 | 0.023 | |
| SEScore | 0.273 | 0.235 | 0.254 | 0.038 | |
| SEScore2 | 0.287 | 0.265 | 0.276 | 0.022 | |
6.7 SEScore2 achieves consistent superior performance across different domains
We investigate the domain influence on the evaluation metrics when shifting the testing set from News to TED. As shown in Table 3, all metrics have lower Kendall correlations in TED compared to those in News. We conjectured that the cause is due to the domain differences between the two testing suites. Unlike News, TED contains sentences with informal and disfluent language styles Freitag et al. (2021b). The supervised learned metrics have the largest gap when shifting the domain from News to TED. The reason is that the entire supervised human rating data is from the News domain only. Although the rule-based metrics (TER. BLEU and Chrf) have relatively lower overall correlations, their correlation is less influenced by the domain shift, with an average 0.023 Kendall correlation difference. Unsupervised learned metrics can be less influenced by domain shift compared to supervised metrics. However, they still have more Kendall correlation drops compared to the rule-based metrics, with an average Kendall correlation 0.032. Most importantly, we observed that SEScore2 achieves the highest overall Kendall correlation and achieves the lowest gap (0.022) among learned metrics when shifting between domains. In Section 6.8.1, we demonstrate that SEScore2 can take advantage of the data scale and improve its performance on TED while scaling up the data. Full results can be found in Appendix Table 12.
6.8 Quantitative Analysis
To validate the ideas in SEScore2, we investigate the impact of data scaling, the risks of human rating supervision, effects of our retrieval augmented (RA) synthesis, ablation on RA operations and severity measures, and interpretation of SEScore2 at different evaluation dimensions. We include the effects of model initialization in Appendix D.
6.8.1 Law of the Data Scaling
We study the scaling effects on SEScore2’s performance, by testing checkpoints trained at 0.5M, 1M, 2M, and 4M training samples. For both Zh-En and En-De across two domains, we observe the sharp performance improvements at first 1M pretraining data. Larger pretraining data quantity leads to higher human correlations for both language directions. We get 2.5% and 1.8% improvements in Zh-En, and 2.5% and 1.1% improvements in En-De at 2M and 3M data points. Performance saturates from 3M to 4M synthetic data, with around 0.5% improvements in both language directions. This suggests that a data scale of 1M can train a competitive metric, and larger data can gradually improve the metric to fit into a general domain.
| Machine Translation WMT21 | ||||
| Metric Name | News | TED | Overall | |
| COMET | 0.300 | 0.240 | 0.270 | 0.060 |
| BLEURT | 0.305 | 0.243 | 0.274 | 0.062 |
| SEScore2 +FT | 0.312 | 0.229 | 0.271 | 0.083 |
| SEScore2 | 0.287 | 0.265 | 0.276 | 0.022 |
6.8.2 Danger of Fine-tuning
To address the question "Can fine-tuning always lead to better performance?", we fine-tune SEScore2 on existing 350K English and 59K German WMT17-19 News domain human rating data 666Like COMET, we use WMT17-19 DA human ratings. BLEURT uses WMT15-19 DA results for its training dataset.. For each domain, we report the average Kendall correlation between En-De and Zh-En. In Table 4, SEScore2 +FT improves by 8.7% over SEScore2 in the News domain. Additionally, it outperforms both BLEURT and COMET in the News domain with 4% and 2.3% Kendall improvements respectively. Despite the improvements in News, the supervised SEScore2 has a 13.6% correlation drop in the TED testing set, resulting in a larger correlation gap (0.083) between News and TED domains. This confirms our assumption that fine-tuning with domain-specific human ratings can fit the metric tightly to the trained domain distribution, but may decrease its generalization ability across domains. The unsupervised SEScore2 achieves the highest overall Kendall correlation across two domains.
6.8.3 Effectiveness of Retrieval Augmented Synthesis
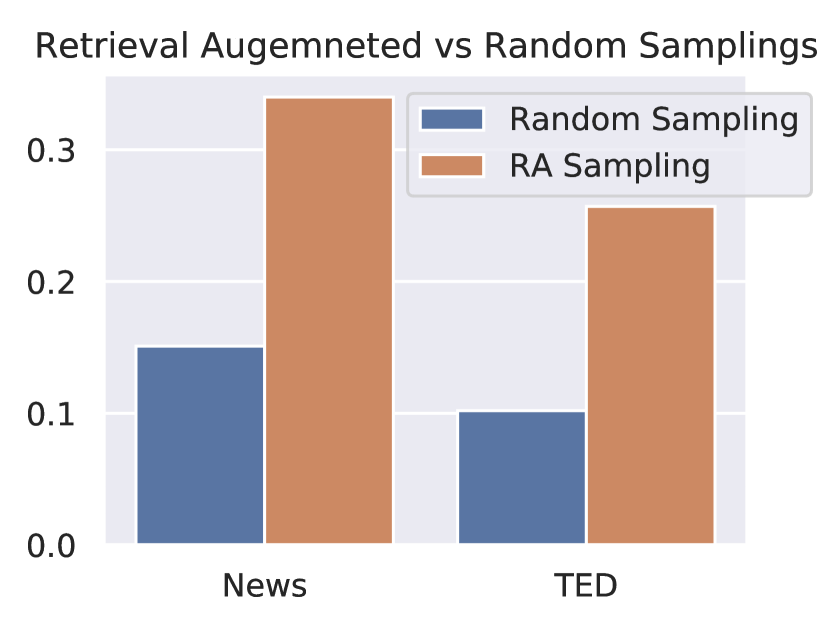
In Figure 4, we demonstrate the superior performance of retrieval augmented (RA) data construction compared to the random token transformations. Our observation is that most of the random in-batch tokens have low co-occurrence probabilities with their contexts. The sentence embeddings from those text transformations can be easily distinguished from the anchor embedding, by the pretrained language model Conneau et al. (2019). Therefore, further pretraining on negative samples with random token transformations does not lead to significant correlation improvements. We empirically demonstrate that RA data construction improves random token insert/replace by 114% in the News and TED domains.
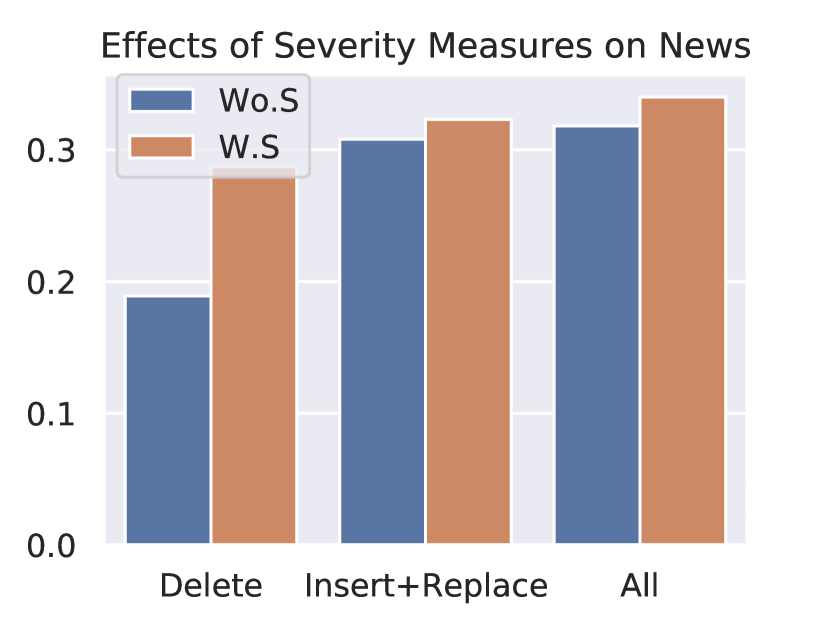
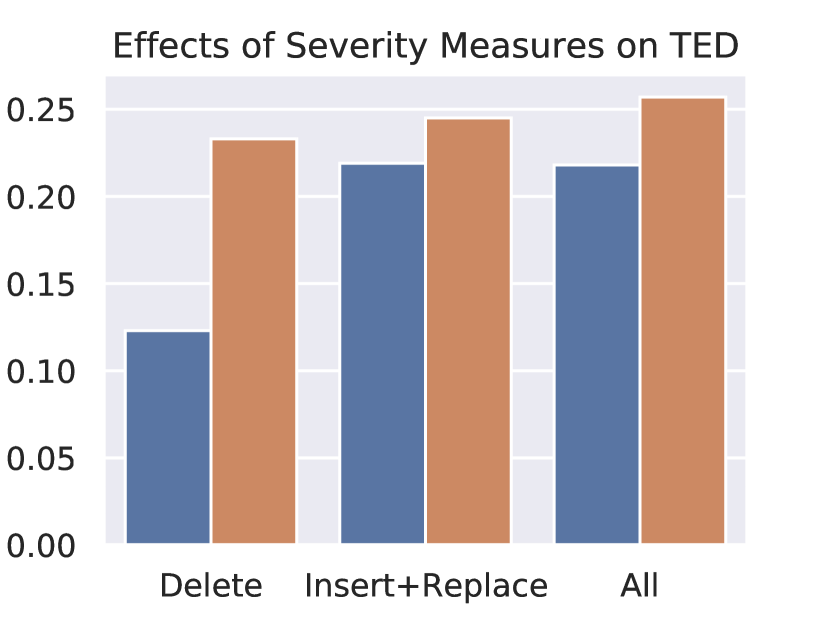
6.8.4 Ablation on RA operations
To evaluate the performance of each component at our retrieval augmented synthesis, we separately trained checkpoints with synthetic data that 1) contains delete operations only; 2) contains insert and replace operations according to our scheduled locations; 3) contains all operations with scheduled positions. To exclude the effects from the severity measures, we do not assign severity measures for each error and instead label each sentence with the number of errors it contains. In Figure 4, we observe that our RA insert/replace contributes the most of the human correlations, 0.308 at News and 0.219 at TED. This suggests that our scheduled positions to insert and replace are important to construct realistic synthetic sentences and learning meaningful embeddings. Despite the simple scheme, delete-only construction can achieve competitive performance, with Kendall correlation 0.189 and 0.123 in News and TED respectively. By combining all operations, the aggregated effect can further improve the Kendall correlation 3.2% at News.
6.8.5 Effects of Severity Measures
In Figure 4, we empirically verify two of our severity measures: 1) IDF-based 2) XLM-based approaches. Our IDF-based severity measures on delete operation can improve 51.9% Kendall correlation at News and 81.3% at TED. Our XLM-based severity measures on insert and delete can improve 4.9% at News and 11.9% at TED. Lastly, the joint effect of two severity measures can improve SEScore2 without severity measures by 6.92% at News and 17.9% at TED.
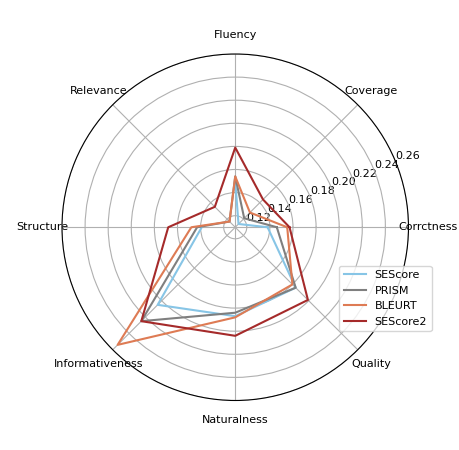
7 How to interpret SEScore2?
In order to interpret the evaluation dimensions of SEScore2, we conducted multi-dimensional human correlations in WebNLG and BAGEL benchmarks. In Figure 5, we observe that SEScore2 achieves the highest Kendall correlation across all dimensions except informativeness compared to the BLEURT. At WebNLG and BAGEL, SEScore2 is most correlated to fluency, text structure, naturalness, and quality, which leads the second highest metric BLEURT by 16.2% and 13.5%, 8.5% and 10.6% respectively. To conclude, despite producing an overall score, SEScore2 can be a great indicator of diverse evaluation aspects of text generation. In particular, SEScore2 has a significant advantage over baseline metrics in terms of the quality and fluency aspects of quality assessment. Full results are in Appendix Table 5 and Table 9. We further rescaled our results to the predefined range ( to ) to ensure consistency and interpretability across domains and tasks (See Appendix Section H for implementation details).
8 Supported Languages
Currently, SEScore2 supports English, German, Japanese, Spanish, Chinese and Russian. Our pipeline in extending SEScore2 to future languages is generic. It is straightforward to extend SEScore2 to up to 100 languages i.e. any language supported in XLM. To obtain reliable severity measures, we currently support 14 languages (Ar, Bg, De, El, Es, Fr, Hi, Ru, Sw Th, Tr, Ur, Vi and Zh). For detailed limitation discussion about severity measures, please refer to Section Limitations.
9 Conclusion
We propose a novel retrieval augmented synthesis method for generating diverse and realistic errors on a large scale, with varying severity levels. Our experiment demonstrates, SEScore2, with its human-aligned self-supervised objective, can outperform prior metrics or match supervised metrics in four text generation tasks across three languages. Lastly, we demonstrate SEScore2 can correlate well with multiple evaluation aspects, such as fluency and quality.
Limitations
One potential improvement to this work is the development of a method to evaluate the accuracy of the severity measure component. We have demonstrated the effectiveness of SEScore2 with a severity measure through improved Kendall correlations for various types of retrieval augmented synthesis in Figure 4. However, there is currently no widely accepted way to quantitatively measure the accuracy of the severity labels. This is because there is no existing dataset that can be used to benchmark severity measures. While Freitag et al. (2021a, b) have released MQM annotations with error spans for each segment, these annotations often include compositional errors that prevent the evaluation of individual severity labels without also considering other errors in the sentence. A potential future direction for this research would be to create a benchmark dataset that would allow direct assessment of individual severity estimation or explore alternative methods for evaluating the accuracy of severity measures.
Second, we have not been able to test SEScore2 on low-resource languages due to the lack of MQM-annotated testing sets in these languages. However, we have demonstrated that SEScore2 can still perform well without severity estimation by outperforming top unsupervised metrics such as BERTScore, BARTScore and PRISM as shown in Figure 4. This suggests that SEScore2 may be useful for low-resource languages since parallel corpora are not available for most low-resource language settings. To further verify this, a potential future direction would be to create testing sets with MQM labels for low-resource languages, to test the performance of SEScore2 and other learned metrics in such scenarios.
Lastly, since SEScore2 is based on proximity between reference and model output, its capabilities for open-ended text generation tasks have not yet been fully explored. This presents an opportunity for future research to investigate the potential of this method in such scenarios.
Ethics Consideration
We hired three human raters to annotate WMT21 DeEn testing set. The evaluated text is publicly available machine translation testing set which contains no sensitive or explicit languages. There is no risk of exposing annotators’ identities and they are fully aware the usage of their collected dataset. We use the standard MQM human evaluation procedures Freitag et al. (2021a) and all annotaters are experienced with this evaluation protocol. All collected human annotations will be released at the camera ready. The hourly salary for the raters are well above the minimum wage in the local region. Details can be found in Appendix F.
References
- Barrault et al. (2019) Loïc Barrault, Ondřej Bojar, Marta R. Costa-jussà, Christian Federmann, Mark Fishel, Yvette Graham, Barry Haddow, Matthias Huck, Philipp Koehn, Shervin Malmasi, Christof Monz, Mathias Müller, Santanu Pal, Matt Post, and Marcos Zampieri. 2019. Findings of the 2019 conference on machine translation (WMT19). In Proceedings of the Fourth Conference on Machine Translation (Volume 2: Shared Task Papers, Day 1), pages 1–61, Florence, Italy. Association for Computational Linguistics.
- Birch (2021) Alexandra Birch. 2021. Neural machine translation 2020, by philipp koehn, cambridge, cambridge university press, isbn 978-1-108-49732-9, pages 393. Natural Language Engineering, 27(3):377 – 378.
- Celikyilmaz et al. (2020) Asli Celikyilmaz, Elizabeth Clark, and Jianfeng Gao. 2020. Evaluation of text generation: A survey.
- Chopra et al. (2016) Sumit Chopra, Michael Auli, and Alexander M. Rush. 2016. Abstractive sentence summarization with attentive recurrent neural networks. In Proceedings of the 2016 Conference of the North American Chapter of the Association for Computational Linguistics: Human Language Technologies, pages 93–98, San Diego, California. Association for Computational Linguistics.
- Chung et al. (2020) Hyung Won Chung, Thibault Fevry, Henry Tsai, Melvin Johnson, and Sebastian Ruder. 2020. Rethinking embedding coupling in pre-trained language models. arXiv preprint arXiv:2010.12821.
- Conneau et al. (2019) Alexis Conneau, Kartikay Khandelwal, Naman Goyal, Vishrav Chaudhary, Guillaume Wenzek, Francisco Guzmán, Edouard Grave, Myle Ott, Luke Zettlemoyer, and Veselin Stoyanov. 2019. Unsupervised cross-lingual representation learning at scale.
- CONNEAU and Lample (2019) Alexis CONNEAU and Guillaume Lample. 2019. Cross-lingual language model pretraining. In Advances in Neural Information Processing Systems, volume 32. Curran Associates, Inc.
- Devlin et al. (2019) Jacob Devlin, Ming-Wei Chang, Kenton Lee, and Kristina Toutanova. 2019. BERT: Pre-training of deep bidirectional transformers for language understanding. In Proceedings of the 2019 Conference of the North American Chapter of the Association for Computational Linguistics: Human Language Technologies, Volume 1 (Long and Short Papers), pages 4171–4186, Minneapolis, Minnesota. Association for Computational Linguistics.
- Durmus et al. (2022) Esin Durmus, Faisal Ladhak, and Tatsunori Hashimoto. 2022. Spurious correlations in reference-free evaluation of text generation. In Proceedings of the 60th Annual Meeting of the Association for Computational Linguistics (Volume 1: Long Papers), pages 1443–1454, Dublin, Ireland. Association for Computational Linguistics.
- Freitag et al. (2021a) Markus Freitag, George Foster, David Grangier, Viresh Ratnakar, Qijun Tan, and Wolfgang Macherey. 2021a. Experts, errors, and context: A large-scale study of human evaluation for machine translation. Transactions of the Association for Computational Linguistics, 9:1460–1474.
- Freitag et al. (2022) Markus Freitag, David Grangier, Qijun Tan, and Bowen Liang. 2022. High quality rather than high model probability: Minimum Bayes risk decoding with neural metrics. Transactions of the Association for Computational Linguistics, 10:811–825.
- Freitag et al. (2021b) Markus Freitag, Ricardo Rei, Nitika Mathur, Chi-kiu Lo, Craig Stewart, George Foster, Alon Lavie, and Ondřej Bojar. 2021b. Results of the WMT21 metrics shared task: Evaluating metrics with expert-based human evaluations on TED and news domain. In Proceedings of the Sixth Conference on Machine Translation, pages 733–774, Online. Association for Computational Linguistics.
- Fu et al. (2022) Zhiyi Fu, Wangchunshu Zhou, Jingjing Xu, Hao Zhou, and Lei Li. 2022. Contextual representation learning beyond masked language modeling. In Proceedings of the 60th Annual Meeting of the Association for Computational Linguistics (Volume 1: Long Papers), pages 2701–2714, Dublin, Ireland. Association for Computational Linguistics.
- Gao et al. (2021) Tianyu Gao, Xingcheng Yao, and Danqi Chen. 2021. SimCSE: Simple contrastive learning of sentence embeddings. In Proceedings of the 2021 Conference on Empirical Methods in Natural Language Processing, pages 6894–6910, Online and Punta Cana, Dominican Republic. Association for Computational Linguistics.
- Gardent et al. (2017) Claire Gardent, Anastasia Shimorina, Shashi Narayan, and Laura Perez-Beltrachini. 2017. The WebNLG challenge: Generating text from RDF data. In Proceedings of the 10th International Conference on Natural Language Generation, pages 124–133, Santiago de Compostela, Spain. Association for Computational Linguistics.
- Graham and Baldwin (2014) Yvette Graham and Timothy Baldwin. 2014. Testing for significance of increased correlation with human judgment. In Proceedings of the 2014 Conference on Empirical Methods in Natural Language Processing (EMNLP), pages 172–176, Doha, Qatar. Association for Computational Linguistics.
- JTF (2018) Japan Translation Federation JTF. 2018. JTF Translation Quality Evaluation Guidelines.
- Kepler et al. (2019) Fabio Kepler, Jonay Trénous, Marcos Treviso, Miguel Vera, and André F. T. Martins. 2019. OpenKiwi: An open source framework for quality estimation. In Proceedings of the 57th Annual Meeting of the Association for Computational Linguistics: System Demonstrations, pages 117–122, Florence, Italy. Association for Computational Linguistics.
- Koehn (2005) Philipp Koehn. 2005. Europarl: A parallel corpus for statistical machine translation. In Proceedings of Machine Translation Summit X: Papers, pages 79–86, Phuket, Thailand.
- Kryscinski et al. (2020) Wojciech Kryscinski, Bryan McCann, Caiming Xiong, and Richard Socher. 2020. Evaluating the factual consistency of abstractive text summarization. In Proceedings of the 2020 Conference on Empirical Methods in Natural Language Processing (EMNLP), pages 9332–9346, Online. Association for Computational Linguistics.
- Kúdela et al. (2017) Jakub Kúdela, Irena Holubová, and Ondřej Bojar. 2017. Extracting parallel paragraphs from common crawl. The Prague Bulletin of Mathematical Linguistics, 107(1):39–56.
- Liu et al. (2020) Yinhan Liu, Jiatao Gu, Naman Goyal, Xian Li, Sergey Edunov, Marjan Ghazvininejad, Mike Lewis, and Luke Zettlemoyer. 2020. Multilingual denoising pre-training for neural machine translation. Transactions of the Association for Computational Linguistics, 8:726–742.
- Liu et al. (2019) Yinhan Liu, Myle Ott, Naman Goyal, Jingfei Du, Mandar Joshi, Danqi Chen, Omer Levy, Mike Lewis, Luke Zettlemoyer, and Veselin Stoyanov. 2019. Roberta: A robustly optimized bert pretraining approach. ArXiv, abs/1907.11692.
- Lommel et al. (2014) Arle Lommel, Hans Uszkoreit, and Aljoscha Burchardt. 2014. Mqm: Un marc per declarar i descriure mètriques de qualitat de la traducció. Tradumàtica: traducció i tecnologies de la informació i la comunicació, (12):455–463.
- Louis and Nenkova (2013) Annie Louis and Ani Nenkova. 2013. Automatically assessing machine summary content without a gold standard. Computational Linguistics, 39(2):267–300.
- Ma et al. (2018) Qingsong Ma, Ondřej Bojar, and Yvette Graham. 2018. Results of the WMT18 metrics shared task: Both characters and embeddings achieve good performance. In Proceedings of the Third Conference on Machine Translation: Shared Task Papers, pages 671–688, Belgium, Brussels. Association for Computational Linguistics.
- Ma et al. (2019) Qingsong Ma, Johnny Wei, Ondřej Bojar, and Yvette Graham. 2019. Results of the WMT19 metrics shared task: Segment-level and strong MT systems pose big challenges. In Proceedings of the Fourth Conference on Machine Translation (Volume 2: Shared Task Papers, Day 1), pages 62–90, Florence, Italy. Association for Computational Linguistics.
- Mathur et al. (2020) Nitika Mathur, Johnny Wei, Markus Freitag, Qingsong Ma, and Ondřej Bojar. 2020. Results of the WMT20 metrics shared task. In Proceedings of the Fifth Conference on Machine Translation, pages 688–725, Online. Association for Computational Linguistics.
- Papineni et al. (2002) Kishore Papineni, Salim Roukos, Todd Ward, and Wei-Jing Zhu. 2002. Bleu: a method for automatic evaluation of machine translation. In Proceedings of the 40th Annual Meeting of the Association for Computational Linguistics, pages 311–318, Philadelphia, Pennsylvania, USA. Association for Computational Linguistics.
- Popović (2015) Maja Popović. 2015. chrF: character n-gram F-score for automatic MT evaluation. In Proceedings of the Tenth Workshop on Statistical Machine Translation, pages 392–395, Lisbon, Portugal. Association for Computational Linguistics.
- Pryzant et al. (2018) Reid Pryzant, Youngjoo Chung, Dan Jurafsky, and Denny Britz. 2018. JESC: Japanese-English subtitle corpus. In Proceedings of the Eleventh International Conference on Language Resources and Evaluation (LREC 2018), Miyazaki, Japan. European Language Resources Association (ELRA).
- Rei et al. (2020) Ricardo Rei, Craig Stewart, Ana C Farinha, and Alon Lavie. 2020. COMET: A neural framework for MT evaluation. In Proceedings of the 2020 Conference on Empirical Methods in Natural Language Processing (EMNLP), pages 2685–2702, Online. Association for Computational Linguistics.
- Schwenk et al. (2021) Holger Schwenk, Vishrav Chaudhary, Shuo Sun, Hongyu Gong, and Francisco Guzmán. 2021. WikiMatrix: Mining 135M parallel sentences in 1620 language pairs from Wikipedia. In Proceedings of the 16th Conference of the European Chapter of the Association for Computational Linguistics: Main Volume, pages 1351–1361, Online. Association for Computational Linguistics.
- Sellam et al. (2020) Thibault Sellam, Dipanjan Das, and Ankur Parikh. 2020. BLEURT: Learning robust metrics for text generation. In Proceedings of the 58th Annual Meeting of the Association for Computational Linguistics, pages 7881–7892, Online. Association for Computational Linguistics.
- Shimanaka et al. (2018) Hiroki Shimanaka, Tomoyuki Kajiwara, and Mamoru Komachi. 2018. RUSE: Regressor using sentence embeddings for automatic machine translation evaluation. In Proceedings of the Third Conference on Machine Translation: Shared Task Papers, pages 751–758, Belgium, Brussels. Association for Computational Linguistics.
- Snover et al. (2006) Matthew Snover, Bonnie Dorr, Rich Schwartz, Linnea Micciulla, and John Makhoul. 2006. A study of translation edit rate with targeted human annotation. In Proceedings of the 7th Conference of the Association for Machine Translation in the Americas: Technical Papers, pages 223–231, Cambridge, Massachusetts, USA. Association for Machine Translation in the Americas.
- Thompson and Post (2020) Brian Thompson and Matt Post. 2020. Automatic machine translation evaluation in many languages via zero-shot paraphrasing. In Proceedings of the 2020 Conference on Empirical Methods in Natural Language Processing (EMNLP), pages 90–121, Online. Association for Computational Linguistics.
- Tiedemann (2012) Jörg Tiedemann. 2012. Parallel data, tools and interfaces in OPUS. In Proceedings of the Eighth International Conference on Language Resources and Evaluation (LREC’12), pages 2214–2218, Istanbul, Turkey. European Language Resources Association (ELRA).
- Unanue et al. (2021) Inigo Jauregi Unanue, Jacob Parnell, and Massimo Piccardi. 2021. Berttune: Fine-tuning neural machine translation with bertscore. In ACL.
- Vinyals and Le (2015) Oriol Vinyals and Quoc Le. 2015. A neural conversational model.
- Xu et al. (2022) Wenda Xu, Yi-lin Tuan, Yujie Lu, Michael Saxon, Lei Li, and William Yang Wang. 2022. Not all errors are equal: Learning text generation metrics using stratified error synthesis. In Proceedings of the 2022 Conference on Empirical Methods in Natural Language Processing.
- Yuan et al. (2021) Weizhe Yuan, Graham Neubig, and Pengfei Liu. 2021. Bartscore: Evaluating generated text as text generation.
- Zhang et al. (2019) Tianyi Zhang, Varsha Kishore, Felix Wu, Kilian Q. Weinberger, and Yoav Artzi. 2019. Bertscore: Evaluating text generation with bert.
- Zhao et al. (2019) Wei Zhao, Maxime Peyrard, Fei Liu, Yang Gao, Christian M. Meyer, and Steffen Eger. 2019. MoverScore: Text generation evaluating with contextualized embeddings and earth mover distance. In Proceedings of the 2019 Conference on Empirical Methods in Natural Language Processing and the 9th International Joint Conference on Natural Language Processing (EMNLP-IJCNLP), pages 563–578, Hong Kong, China. Association for Computational Linguistics.
- Zhou and Lampouras (2020) Giulio Zhou and Gerasimos Lampouras. 2020. WebNLG challenge 2020: Language agnostic delexicalisation for multilingual RDF-to-text generation. In Proceedings of the 3rd International Workshop on Natural Language Generation from the Semantic Web (WebNLG+), pages 186–191, Dublin, Ireland (Virtual). Association for Computational Linguistics.
- Ziemski et al. (2016) Michał Ziemski, Marcin Junczys-Dowmunt, and Bruno Pouliquen. 2016. The United Nations parallel corpus v1.0. In Proceedings of the Tenth International Conference on Language Resources and Evaluation (LREC’16), pages 3530–3534, Portorož, Slovenia. European Language Resources Association (ELRA).
| WebNLG Data-to-Text Generation | |||||
| Model Name | Cor | Cov | Flu | Rel | Str |
| TER | -0.075* | -0.060* | -0.082* | -0.067* | -0.082* |
| BLEU | 0.077* | 0.062* | 0.075* | 0.065* | 0.070* |
| ChrF | 0.088* | 0.087* | 0.082* | 0.076* | 0.073* |
| BARTScore | 0.096* | 0.085* | 0.107* | 0.079* | 0.102* |
| BERTScore | 0.141* | 0.110* | 0.143* | 0.108* | 0.142* |
| SEScore | 0.138* | 0.114* | 0.150* | 0.108* | 0.139* |
| PRISM | 0.146* | 0.121* | 0.154* | 0.117* | 0.143* |
| BLEURT | 0.155 | 0.128* | 0.154* | 0.117* | 0.148* |
| SEScore2 | 0.157 | 0.144 | 0.179 | 0.135 | 0.168 |
| WebNLG Data-to-Text Generation | |||||
| Model Name | Cor | Cov | Flu | Rel | Str |
| TER | -0.109* | -0.087* | -0.12* | -0.067* | -0.082* |
| BLEU | 0.112* | 0.091* | 0.110* | 0.095* | 0.102* |
| ChrF | 0.129* | 0.127* | 0.121* | 0.112* | 0.107* |
| BARTScore | 0.142* | 0.124* | 0.158* | 0.115* | 0.151* |
| BERTScore | 0.208* | 0.161* | 0.211* | 0.158* | 0.210* |
| SEScore | 0.202* | 0.167* | 0.220* | 0.158* | 0.204* |
| PRISM | 0.214* | 0.176* | 0.227* | 0.169* | 0.211* |
| BLEURT | 0.225 | 0.186* | 0.226* | 0.170* | 0.217* |
| SEScore2 | 0.231 | 0.212 | 0.263 | 0.197 | 0.248 |
Appendix A Pretraining Data Collection
For Chinese-to-English, we collect 20M sentence pairs from UN Parallel Ziemski et al. (2016), News Commentary Tiedemann (2012) and CWMT corpus Barrault et al. (2019). For English-to-German, we collect 4.5M sentence pairs from Europarl Koehn (2005), Common Crawl Kúdela et al. (2017) and News Commentary. For English-to-Japanese, We collect 18M sentence pairs from News Complimentary, WikiMatrix Schwenk et al. (2021) and En-Ja subtitle corpus Pryzant et al. (2018).
| News | TED | |||||
| LP | #H | #Sys | #Sents | #H | #Sys | #Sents |
| ZhEn | 2 | 13 | 650 | 1 | 13 | 529 |
| EnDe | 4 | 13 | 527 | 1 | 14 | 529 |
| DeEn | 1 | 9 | 100 | - | - | - |
Appendix B Index Table Construction
We use LASER library777https://github.com/facebookresearch/LASER to compute all the sentence embeddings and use Faiss library 888https://github.com/facebookresearch/faiss to build the index table for English, German and Japanese. We used 8*A100 GPUs for the index table construction. The duration for building index table for English, German and Japanese is 48 hours, 24 hours and 48 hours respectively. From the constructed index table, we extracted 128 nearest neighbors for each text sentence. To ensure our learned metrics can cover diverse domains and tasks, we sample millions of raw sentences from diverse domains of corpuses and build ten-million scale index tables. Detailed statistics are discussed at Section 6.1.1.
Appendix C Margin-based Criterion
We follow the implementation of margin criterion in Schwenk et al. (2021). We set the threshold of margin criterion to be 1.06 and extract 128 nearest neighbors to estimate mutual translation capability.
Appendix D Pretrained Model Initialization
All checkpoints from Rembert are trained for 15,000 iterations and all checkpoints from XLM-R are trained for 30,000 iterations. Since our pipeline utilized pretrained model, we try to answer the question that with the setting, can different pretrained model initialization lead to different performance? In particular, we studied two prior used pretrained models: RemBERT (used by BLEURT) and XLM-R (used by COMET). Based on prior study Chung et al. (2020), RemBERT emperically outperforms XLM-R over multiple multilingual downstream tasks. In Table 8, we demonstrates that compared to XLM-R initialization, our SEScore2 with RemBERT initialization can further improve Kendall correlations in all language directions. This finding suggests that SEScore2 with a better pretrained model initialization can increase its learning capacity of score distribution and improve its correlations to human ratings.
| ZhEn | EnDe | |||
| Initialization | News | TED | News | TED |
| SEScore2 (XLM-R) | 0.340 | 0.257 | 0.206 | 0.249 |
| SEScore2 (RemBERT) | 0.348 | 0.271 | 0.227 | 0.258 |
Appendix E Baseline Implementations
For WMT21 News and TED, we use WMT officially released output results Freitag et al. (2021b) from their official script999https://github.com/google-research/mt-metrics-eval. We use HuggingFace evaluate module (Open sourced library) to get baseline outputs for BLEURT Sellam et al. (2020), COMET Rei et al. (2020), SEScore Xu et al. (2022), BLEU Papineni et al. (2002), TER Snover et al. (2006) and ChrF Popović (2015). For BERTScore Zhang et al. (2019), BARTScore Yuan et al. (2021) and PRISMThompson and Post (2020), we use their open sourced Github repository. Specifically, following their recommendations, we use Roberta-large backbone Liu et al. (2019) for English assessment of BERTScore. We use multilingual BERTScore Devlin et al. (2019) to assess German and Japanese testing sets. For BARTScore, we use recommended Bart-large-cnn backbone for English testing sets and MBART backbone Liu et al. (2020) for German and Japanese testing sets. For SEScore, we use stratified error synthesis process Xu et al. (2022) to construct 120,000 Japanese synthesized texts with pseudo labels and trained a Japanese SEScore. We use this Japanese SEScore to test Japanese testing set.
Appendix F Human Annotation Procedure
We conduct a human evaluation on WMT21 de-en testing set at News domain. We randomly select systems outputs out of participating systems. We annotate testing segments for each selected system. In total, testing sentences are annotated. Following the prior study Freitag et al. (2021a), we hired 3 bilingual linguists in English and German. Following MQM evaluation procedure Freitag et al. (2021a), each rater can only access the source (in German) and model output (in English), without any reference text. Rater is given all the choices of possible error typologies and definitions of the severity levels. We directly use the instruction of MQM hierarchy, MQM severity levels and MQM annotator guidelines from prior work Freitag et al. (2021a) to our human raters (Please refer to Table 10, Table 11 and Table 12 for specific references). All three raters are well-trained to perform human ratings. The hourly rate for all raters is Chinese Yuan per hour. The local minimum wage is Chinese Yuan per hour. Our human evaluation study has no risk of exposing any annotator’s identities and text contains neither sensitive or explicit language.
| BAGEL Dialogue Generation | |||
| Model Name | Informativeness | Naturalness | Quality |
| TER | -0.055* | -0.127* | -0.079* |
| chrF | 0.182* | 0.078* | 0.064* |
| BLEU | 0.138* | 0.104* | 0.085* |
| BERTScore | 0.217* | 0.114* | 0.159* |
| BARTScore | 0.183* | 0.114* | 0.183* |
| SEScore | 0.205* | 0.187* | 0.184* |
| PRISM | 0.225 | 0.184* | 0.184* |
| BLEURT | 0.254 | 0.188* | 0.180* |
| SEScore2 | 0.225 | 0.204 | 0.199 |
| BAGEL Dialogue Generation | |||
| Model Name | Informativeness | Naturalness | Quality |
| TER | -0.073* | -0.170* | -0.105* |
| chrF | 0.244* | 0.103* | 0.083* |
| BLEU | 0.182* | 0.138* | 0.114* |
| BERTScore | 0.289* | 0.155* | 0.212* |
| BARTScore | 0.247* | 0.155* | 0.247* |
| SEScore | 0.272* | 0.248* | 0.243* |
| PRISM | 0.305 | 0.248* | 0.247* |
| BLEURT | 0.343 | 0.252* | 0.241* |
| SEScore2 | 0.304 | 0.273 | 0.264 |
| WMT20 | ||
| ZhEn | EnDe | |
| 0.1 | 0.160 | 0.288 |
| 0.2 | 0.156 | 0.283 |
| 0.3 | 0.158 | 0.286 |
| 0.4 | 0.154 | 0.281 |
Appendix G Hyperparameters on Severity Measures
We conducted preliminary experiments over hyperparameter choices for the severity measures. We hand-crafted 50 severity examples (each example only contains one major or minor example) to select the and . We determine the range of to be from 0.1 to 0.4 and to be 1. To select the best , we use our retrieval augmented perturbation to generate 200k German and English synthesized sentences, respectively. We greedy searched threshold from , for both languages. From Table 11, we construct labels based on each possible and construct corresponding training triples . Therefore, we obtain four checkpoints in each language direction. Based on the Kendall correlations, we concluded that is not a sensitive hyperparameter. Our best hypothesis is that the tokens that are not likely to occur under the source and target contexts have low probabilities (ex. ). Therefore, choosing the specific will not significantly affect the accuracy of the severity measures. In the end, we select for both En-De and Zh-En.
Appendix H Score Range Rescaling
In our pretraining data, the synthetic score range is between to . However, due to the last activation Tanh in our model, the learned score range is constrained between a positive constant and a negative constant . As a result, despite having a great ranking capability, our score is not interpretable for users. Ideally, we want our score to lie within the pre-defined range of to and remain invariant across domains and tasks.
To achieve this goal, we collected a large-scale dataset of raw data (2M) from Wikipedia for the target language. We randomly grouped 1M pairs without replacements. Given the random nature of the pairs, we hypothesize that they likely have low semantic or syntactic similarity, thus prohibiting low scores. Consequently, we can obtain a lower score bound from this set. We calculate score by averaging SEScore2 for all 1M sentence pairs in the set. Furthermore, we randomly select 1M sentences, and for each of them, we feed it twice into the forward layers of SEScore2 with a dropout rate of . In this case, the two computed embeddings should be nearly identical, allowing us to derive an upper bound for the score range. We obtain score by averaging SEScore2 for all 1M embedding pairs in this set.
| (1) |
From Eqn 1, we can normalize our SEScore2 roughly between to . We can use our pre-defined score for major errors (score: ) and minor errors (score: ) to interpret the final results. By normalizing the score, we can ensure better interpretability and maintain consistency across different domains and tasks.
| Model Name | ZhEn | EnDe | DeEn | |||
| News | TED | News | TED | News | ||
| With | BLEURT | 0.354 | 0.224 | 0.252 | 0.252 | 0.266 |
| COMET(DA) | 0.360 | 0.220 | 0.239 | 0.259 | 0.250 | |
| W.o Supervision | BLEU | 0.176 | 0.092 | 0.083 | 0.113 | 0.089 |
| ChrF | 0.201 | 0.124 | 0.114 | 0.147 | 0.098 | |
| TER | 0.210 | 0.136 | 0.098 | 0.131 | -0.060 | |
| BERTScore | 0.296 | 0.199 | 0.169 | 0.199 | 0.205 | |
| BARTScore | 0.262 | 0.154 | 0.038 | 0.001 | 0.047 | |
| PRISM | 0.285 | 0.194 | 0.192 | 0.238 | 0.174 | |
| SEScore | 0.334 | 0.228 | 0.211 | 0.241 | 0.249 | |
| SEScore2 | 0.347 | 0.271 | 0.227 | 0.258 | 0.250 | |
| Model Name | ZhEn | EnDe | DeEn | |||
| News | TED | News | TED | News | ||
| With | BLEURT | 0.487 | 0.296 | 0.332 | 0.328 | 0.351 |
| COMET(DA) | 0.495 | 0.290 | 0.315 | 0.336 | 0.328 | |
| W.o Supervision | BLEU | 0.248 | 0.122 | 0.111 | 0.148 | 0.104 |
| ChrF | 0.281 | 0.164 | 0.151 | 0.192 | 0.120 | |
| TER | 0.293 | 0.179 | 0.130 | 0.170 | -0.044 | |
| BERTScore | 0.411 | 0.264 | 0.223 | 0.247 | 0.269 | |
| BARTScore | 0.366 | 0.204 | 0.050 | 0.001 | 0.062 | |
| PRISM | 0.396 | 0.257 | 0.192 | 0.310 | 0.230 | |
| SEScore | 0.462 | 0.302 | 0.278 | 0.314 | 0.326 | |
| SEScore2 | 0.475 | 0.357 | 0.298 | 0.334 | 0.334 | |
| MT(ZhEn) | MT(EnDe) | MT(DeEn) | S2T(EnJa) | D2T | Dialogue | Overall | ||
| With | BLEURT | 0.392 | 0.330 | 0.351 | 0.619 | 0.247 | 0.323 | 0.377 |
| COMET(DA) | 0.393 | 0.326 | 0.328 | 0.557 | - | - | - | |
| Without Supervision | TER | 0.236 | 0.150 | -0.060 | -0.114 | -0.131 | -0.126 | -0.008 |
| BLEU | 0.185 | 0.130 | 0.089 | 0.287 | 0.124 | 0.168 | 0.164 | |
| ChrF | 0.223 | 0.172 | 0.098 | 0.336 | 0.139 | 0.168 | 0.189 | |
| BARTScore | 0.285 | 0.026 | 0.062 | -0.153 | 0.168 | 0.207 | 0.099 | |
| BERTScore | 0.338 | 0.235 | 0.269 | 0.300 | 0.228 | 0.282 | 0.275 | |
| PRISM | 0.327 | 0.296 | 0.230 | 0.274 | 0.241 | 0.307 | 0.279 | |
| SEScore | 0.382 | 0.296 | 0.326 | 0.493 | 0.228 | 0.298 | 0.337 | |
| SEScore2 | 0.416 | 0.316 | 0.334 | 0.616 | 0.269 | 0.325 | 0.379 | |