Statistical Dataset Evaluation: Reliability, Difficulty, and Validity
Abstract
Datasets serve as crucial training resources and model performance trackers. However, existing datasets have exposed a plethora of problems, inducing biased models and unreliable evaluation results. In this paper, we propose a model-agnostic dataset evaluation framework for automatic dataset quality evaluation. We seek the statistical properties of the datasets and address three fundamental dimensions: reliability, difficulty, and validity, following a classical testing theory. Taking the Named Entity Recognition (NER) datasets as a case study, we introduce statistical metrics for a statistical dataset evaluation framework. Experimental results and human evaluation validate that our evaluation framework effectively assesses various aspects of the dataset quality. Furthermore, we study how the dataset scores on our statistical metrics affect the model performance, and appeal for dataset quality evaluation or targeted dataset improvement before training or testing models.111The code and data are available at https://github.com/dqxiu/DataEval.
Statistical Dataset Evaluation: Reliability, Difficulty, and Validity
Chengwen Wang1 , Qingxiu Dong1 , Xiaochen Wang1, Haitao Wang2 and Zhifang Sui1 1 MOE Key Lab of Computational Linguistics, School of Computer Science, Peking University 2 China National Institute of Standardization {wangcw,szf}@pku.edu.cn, {dqx,wangxiaochen}@stu.pku.edu.cn wanght@cnis.ac.cn
1 Introduction
Recently, a large number of models have made breakthroughs in various datasets of natural language processing (NLP) Devlin et al. (2019); Liu et al. (2019). Meanwhile, an increasing number and variety of NLP datasets are proposed for model training and evaluation Malmasi et al. (2022); Yin et al. (2021); Srivastava et al. (2022).
However, despite the fact that datasets have a significant impact on model development and assessment Bommasani et al. (2021), their quality is seldom systematically verified. Recent literature has indicated various quality issues within NLP datasets, e.g., label mistakes Wang et al. (2019). Datasets with quality issues frequently give rise to model shortcuts Gururangan et al. (2018); Poliak et al. (2018) or induce incorrect conclusions Goyal et al. (2022); Rashkin et al. (2021).
In this paper, we aim to answer two primary questions: (1) How to evaluate dataset quality in a model-agnostic manner? A comprehensive dataset quality evaluation is crucial for selecting adequate training resources. Besides, when model performance conflicts across different datasets, the model-agnostic dataset quality evaluation results function as a good referee. (2) How do the statistical scores on dataset properties affect the model performance? The answer will guide us in improving dataset quality for deriving effective and unbiased models.
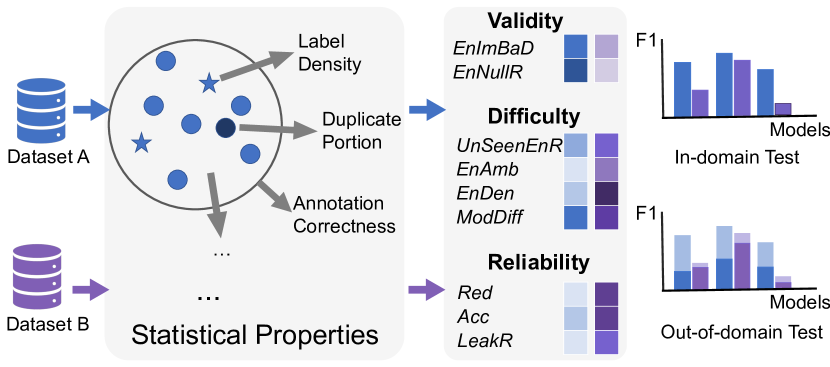
To this end, we present a dataset evaluation framework through the statistical properties of the datasets (shown in Fig. 3). Inspired by Classical Testing Theory (CTT) Novick (1966) in psychometrics, our dataset evaluation framework includes three key dimensions: reliability, difficulty, and validity. Reliability reflects how credible the dataset is, difficulty represents dataset difficulty and differentiation for models, and validity means how well the dataset fits the motivation and goal of the task. In particular, we take the Named Entity Recognition (NER) datasets for a case study. We introduce metrics under the three dimensions for the statistical properties of NER datasets and assess the quality of widely used NER datasets.
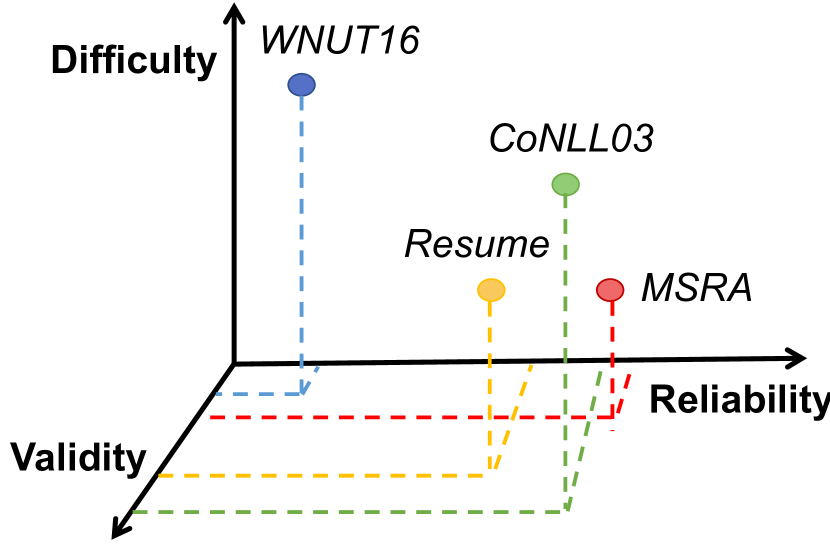
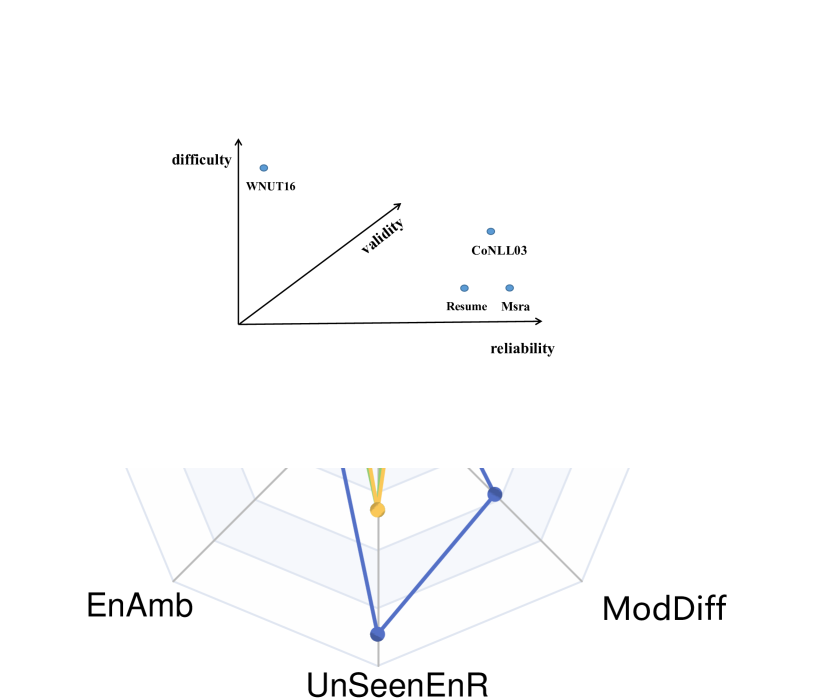
Extensive experimental results validate that our evaluation metrics derived from the dataset properties are highly related to the performance of NER models and human evaluation results. The evaluation results enhance our comprehension of the datasets and bring some novel insights. For example, one of the most widely used English NER datasets, CoNLL03 Tjong Kim Sang and De Meulder (2003), is far less challenging (, , and points lower on the Unseen Entity Ratio, Entity Ambiguity Degree and Model Differentiation metrics, respectively) than WNUT16 Strauss et al. (2016), which has received less attention previously. In addition, by controlled dataset adjustment (Sec. 5.3), we find the dataset quality on the statistical metrics, including Unseen Entity Ratio, Entity Ambiguity Degree, and En-Null Rate deriving affects the NER model performance significantly. Therefore, we appeal for dataset quality evaluation or targeted dataset improvement before training or testing models.
We believe that statistical dataset evaluation provides a direct and comprehensive reflection of the dataset quality. And we recommend dataset quality evaluation before training or testing models for a better understanding of tasks and data for other tasks in NLP.
2 Classical Testing Theory
Human tests or exams usually follow strict testing theories, such as Classical Testing Theory (CTT) Novick (1966), a statistical framework to measure the quality of the exams. CTT considers that a comprehensive and systematic evaluation should consider three dimensions: reliability, difficulty, and validity.
In this paper, we introduce CTT for Dataset Evaluation. Adapting traditional CTT to dataset evaluation, we specified the definitions of reliability, difficulty, and validity as follows:
-
•
reliability measures the reliability of the evaluation dataset. For instance, those datasets with many labeling errors do not have sufficient confidence to evaluate the performance of different models.
-
•
Difficulty is used to evaluate the difficulty of the dataset and its differentiation between different models and man-machine performance.
-
•
Validity aims to evaluate how well the dataset effectively measures the capability of models.
3 Dataset Quality Evaluation Framework
Following CTT for Dataset Evaluation, we build our statistical dataset evaluation framework and apply it to NER datasets. It includes nine fundamental metrics of the statistic properties in the NER datasets. In this section, we introduce the definition and the mathematical formulations of the proposed metrics.
For a dataset444Usually, the dataset includes the training set, the development set, and the test set. with instances, let represent the i-th instance () . The input sequence consists of tokens, and the output sequence consists of entity labels. Let represent the entity types in (including “Not an entity” ), and each entity type , where represents the total number of entity types. We use to represent the test set, the training set, and the development set, respectively. The function is defined to obtain a set of entities in the set of of , , and sometimes we omit for simplification.
| Reliability | Difficulty | Validity | |||||||
| Red | Acc | LeakR | UnSeenEnR | EnAmb | EnDen | ModDiff | EnImBaD | EnNullR | |
| CLUENER | 0.00 | 0.86 | 0.00 | 0.37 | 0.80 | 0.26 | 4.58 | 0.04 | 0.00 |
| OntoNotes4 | 0.02 | 0.98 | 0.04 | 0.47 | 2.54 | 1.02 | - | 0.13 | 0.46 |
| MSRA | 0.00 | 0.99 | 0.00 | 0.28 | 1.16 | 0.17 | 0.38 | 0.11 | 0.41 |
| PeopleDaily | 0.00 | 0.96 | 0.00 | 0.22 | 1.73 | 0.65 | - | 0.11 | 0.40 |
| Resume | 0.00 | 1.00 | 0.01 | 0.46 | 0.29 | 0.25 | 0.41 | 0.17 | 0.17 |
| 0.05 | 0.98 | 0.17 | 0.56 | 0.92 | 0.55 | 0.90 | 0.27 | 0.44 | |
| WikiAnn | 0.03 | 0.89 | 0.13 | 0.55 | 1.53 | 0.74 | - | 0.02 | 0.00 |
| CoNLL03 | 0.05 | 0.96 | 0.03 | 0.46 | 0.35 | 0.28 | 0.24 | 0.06 | 0.20 |
| WNUT16 | 0.01 | 0.97 | 0.00 | 0.89 | 0.65 | 0.51 | 2.87 | 0.08 | 0.56 |
| OntoNotes5 | 0.01 | 0.91 | 0.03 | 0.28 | 0.76 | 0.36 | 0.64 | 0.06 | 0.55 |
3.1 Metrics under Reliability
The metrics under reliability aim to evaluate how accurate and trustworthy a dataset is, including Redundancy, Accuracy, and Leakage Ratio.
Redundancy
represents the proportion of duplicate instances within a dataset .
To calculate the Redundancy of a dataset, we first count the number of the same instances that appeared more than once in the dataset, then use it to divide the total number of instances in the dataset.
Accuracy
aims to evaluate the annotation correctness of the dataset and can be calculated as follows:
We recommend selecting 100 instances from each dataset split and inviting at least professional linguists to annotate the accuracy. The value of Cohen Kappa Cohen (1960) between the annotators should be higher than .
Leakage Ratio
is used to measure how many instances in the test set have appeared in the training set or development set, defined as:
3.2 Metrics under Difficulty
We propose metrics under difficulty to assess how challenging the datasets are, including three intrinsic metrics (Unseen Entity Ratio, Entity Ambiguity Degree, and Text Complexity) and one extrinsic metric (Model Differentiation).
Unseen Entity Ratio
We use the Unseen Entity Ratio to measure the proportion of entities in the labels of the test set that have never been presented in the training set. It is calculated as:
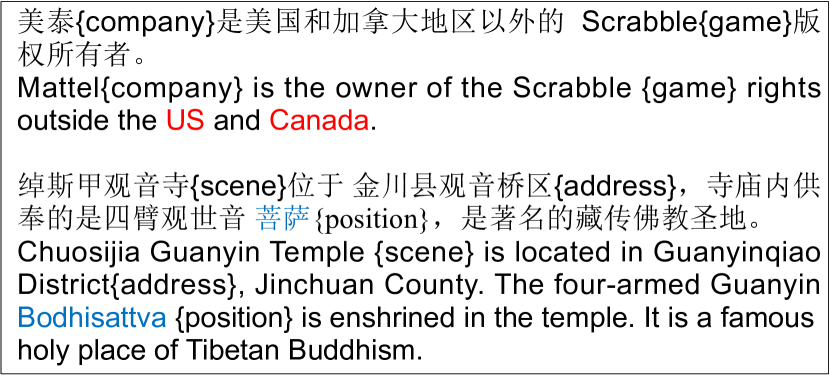
Entity Ambiguity Degree
is mainly used to measure how many entities are labeled with more than one kind of entities types. For example, if “apple” is labeled as “Fruit” in one instance and labeled as “Company” in another instance, then there is a conflict in . We introduce to represent the number of conflict entities in dataset and obtain the Entity Ambiguity Degree by:
Text Complexity
means the entity density of sentences in on average. It is simply formulated as follows:
Model Differentiation
is used to measure how well a dataset distinguishes the performance of different models. Here, we use the standard deviation of the scores of different models trained on the same dataset to indicate how well the dataset distinguishes between different models.
We recommend using the top 5 model scores on the dataset555From the Paperswithcode website. for ModDiff calculation.
3.3 Metrics under Validity
The metrics under validity, for example, Entity Imbalance Degree and Entity-Null Rate for NER datasets, are mainly proposed to evaluate the effectiveness of the dataset in evaluating the model’s ability on the specific task.
Entity Imbalance Degree
mainly measures the unevenness of the distribution of different entities in . Specifically, we use standard deviation to quantify the degree of dispersion of the distribution of all the different types of entities in the dataset.
Entity-Null Rate
measures the proportion of instances that do not cover any entity and is defined as follows:
4 Statistical Dataset Evaluation for NER
To validate our statistical dataset evaluation methods, we assess the quality of widely used NER datasets, including English NER datasets and Chinese NER datasets. The evaluation results are shown in Tab. 1.
4.1 Datasets
We provide the basic information about the datasets in Tab. 2.
English NER Datasets
CoNLL03 NER Tjong Kim Sang and De Meulder (2003) is a classical NER evaluation dataset consisting of 1,393 English news articles. WNUT16 NER Strauss et al. (2016) is provided by the second shared task at WNUT-2016 and consists of social media data from Twitter. OntoNotes5 Weischedel et al. (2013) is a multi-genre NER dataset collected from broadcast news, broadcast conversation, weblogs, and magazine genre, which is a widely cited English NER dataset.
Chinese NER Datasets
CLUENER Xu et al. (2020) is a well-defined named entity recognition dataset with more and finer-grained entity types. Specifically, apart from standard labels like person, organization, and location, it contains more diverse categories such as Company, Game, and Book, etc. OntoNotes4 Weischedel et al. (2011) is copyrighted by Linguistic Data Consortium666https://www.ldc.upenn.edu/ (LDC), a large manual annotated database containing various fields with structural information and shallow semantics. MSRA Levow (2006) is a large NER dataset in the field of news, containing distinctive text structure characteristics. PeopleDaily NER777https://github.com/zjy-ucas/ChineseNER is a very classic benchmark dataset to evaluate different NER models. Resume NER Zhang and Yang (2018a) is a resume dataset with high annotator agreement, which consists of resumes of senior executives from listed companies in the Chinese stock market. Weibo NER Peng and Dredze (2015); He and Sun (2017) is a dataset from the social media domain of Sina Weibo. WikiAnn Pan et al. (2017) is a Chinese part of a multilingual named entity recognition dataset from Wikipedia articles.
| Dataset | Lang | #Tags | Source |
|---|---|---|---|
| CLUENER | Zh | 10 | THUCNEWS |
| OntoNotes 4 | Zh | 4 | News, Broadcast etc. |
| MSRA | Zh | 3 | News |
| PeopleDaily | Zh | 3 | News |
| Resume | Zh | 8 | Sina Finance |
| Zh | 4 | Sina microblog | |
| WikiAnn | Zh | 3 | Wikipedia |
| CoNLL03 | En | 4 | Reuters News |
| WNUT16 | En | 10 | User-generated web text |
| OntoNotes 5 | En | 18 | Broadcast etc. |
4.2 Settings
According to the metrics we proposed in Sec. 3, we calculate the statistical scores for each dataset. Specifically, we average the scores of the training, the development, and the test split of the datasets for Redundancy, Accuracy, Entity Ambiguity Degree, Entity Density, Entity Imbalance Degree, and Entity-Null Rate, respectively. For Leakage Ratio, Unseen Entity Ratio, and Model Differentiation, we only calculate the scores on the specific splits involved according to Sec. 3.1.
4.3 Dataset Reliability
4.3.1 Annotation Accuracy
Accuracy scores quantitatively inform us that we cannot take it for granted that all benchmark datasets are reliable.
We observe that CLUENER has the lowest accuracy score. In particular, it has 17% errors in its development set (shown in Appendix Tab. 14). Conversely, the other datasets (e.g., Resume and WNUT16) have a relatively high accuracy score for both Chinese and English NER datasets.
4.3.2 Leakage Ratio
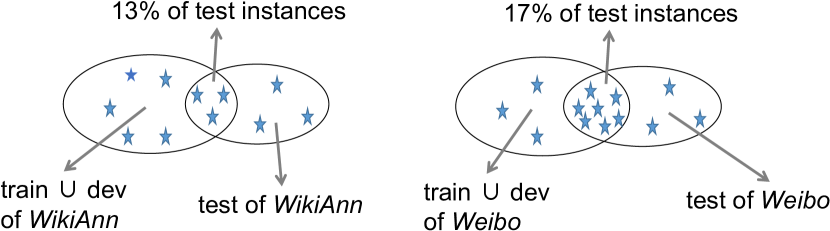
The dataset’s shortcomings (under the reliability dimension) can be effectively revealed by the Leakage Ratio. Given the Leakage Ratio results, we are surprised to find that Weibo and WikiAnn have serious data leakage issues.
4.3.3 Overall Reliability
Combining several metrics under the reliability dimension in Tab. 1, we can conclude that Resume and MSRA maintain high reliability.
In specific, there is no data redundancy in Resume and MSRA. That is to say, the instances of each part of the dataset are unique and non-repeating. Additionally, they achieve the highest Accuracy scores and hardly show data leakage problems, with a Leakage Ratio of 0.00 and 0.01, respectively.
4.4 Dataset Difficulty
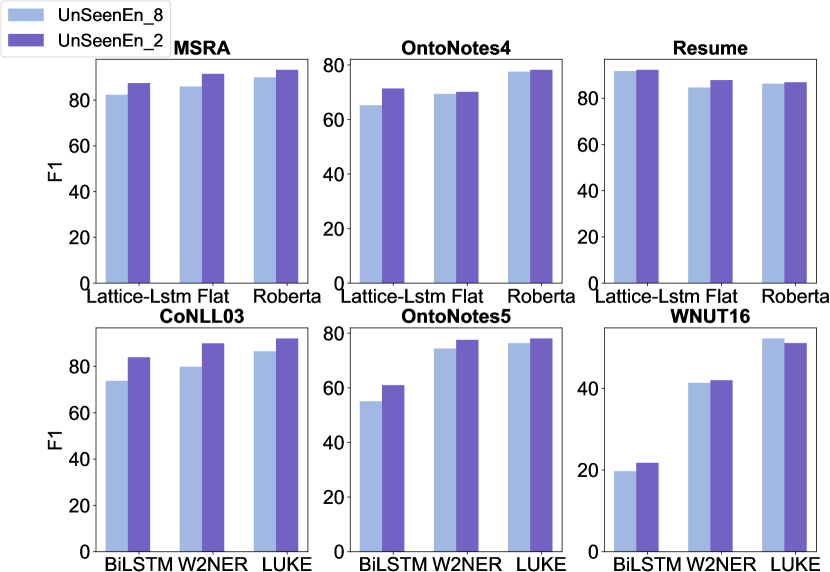
4.4.1 Unseen Entity Ratio
Results on Unseen Entity Ratio (UnSeenEnR) demonstrate the generalization ability of NER models on unseen entities.
The evaluation results show that Weibo and WNUT16 are more difficult in terms of UnSeenEnR because their test sets have a 0.56 and a 0.89 ratio of entities that have not appeared in training, respectively. WikiAnn is the Chinese dataset only second to Weibo that can better evaluate the generalization ability of NER Models. Conversely, PeopleDaily NER and OntoNotes5 are suboptimal for evaluating model generalization ability. Our experiment results in Sec. 5.4 reveals that model trained on them are more likely to perform better on seen entities compared to those that have not appeared in the training set.
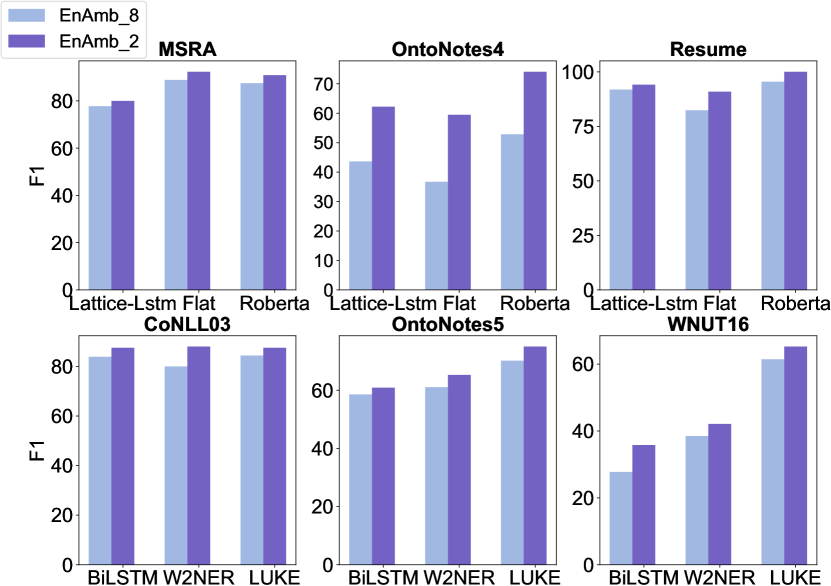
4.4.2 Entity Ambiguity Degree
Entity Ambiguity Degree (EnAmb) captures observable variation in the information complexity of datasets.
Given our findings, OntoNotes 4 and WNUT16 are the Chinese and English NER datasets with the highest Entity Ambiguity Degree, respectively, which means that they are more difficult for models to accurately predict entity types. Consistent with our conclusion (in Sec. 5.4), Bernier-Colborne and Langlais (2020) also argue that SOTA models cannot be able to deal well with those entities labeled with different types in different contexts.
4.4.3 Model Differentiation
Extrinsic evaluation metrics, such as Model Differentiation) are also necessary for evaluating the difficulty of datasets.
Unlike those intrinsic evaluation metrics (e.g., Entity Ambiguity Degree), Model Discrimination (ModDiff) aims to assess the dispersion of model scores on a unified benchmark dataset. That is to say, a more difficult dataset should have a clear distinction between models with different abilities. As shown in Tab. 1, CLUENER and WNUT16 are Chinese and English datasets that can better distinguish model performance, respectively.
4.4.4 Overall Difficulty
WNUT16 is a more difficult benchmark for English NER as a whole.
Although WNUT16 has less citations than CoNLL03 and OntoNotes5, as demonstrated in Tab. 1, WNUT16 has a higher Entity Ambiguity Degree and Unseen Entity Ratio than the other two English NER datasets. Meanwhile, we find that the model performance gap on WNUT16 is large, indicating that it is more difficult and can effectively distinguish models with different performances.
4.5 Dataset Validity
4.5.1 Entity Imbalace Degree
Datasets with uneven distribution of entity types may not effectively evaluate the ability of models on the long-tailed instances.
Intuitively, the model does not perform as well on those long-tailed entity types as other entities. We observe that Weibo achieves the highest Entity Imbalance Degree (EnImBaD) by a large margin, indicating that its distribution of entity types is heavily uneven. Therefore, datasets with severely uneven distribution of entity types can only evaluate the performance of the models on a large number of distributed entity types.
4.5.2 Entity-Null Rate
Surprisingly, there are a large number of instances without any entities in many datasets such as OntoNotes4, MSRA, WNUT16 and OntoNotes5.
Although certain naturally distributed texts will contain some sentences without named entities, a high number of entity-free samples in a NER dataset makes it impossible to give a sufficient number of instances for NER model validation.
4.5.3 Overall Validity
In general, CoNLL03 is the English NER dataset with the highest validity. As shown in Tab. 1, CoNLL03 has the lowest EnNullR, indicating that it can intensively test the entity recognition capabilities of NER models.
| Dataset | Train & Dev | W2NER | LSTM CRF | ||
|---|---|---|---|---|---|
| avg. | std. | avg. | std. | ||
| OntoNotes5 | EnNullR (0.80) | 68.99 | 0.6663 | 64.80 | 0.0031 |
| EnNullR (0.20) | 77.96 | 0.0134 | 75.01 | 0.0354 | |
| EnNullR (0.00) | 76.41 | 0.2037 | 74.75 | 0.0440 | |
| Original | 86.99 | 0.0672 | 80.91 | 9.8596 | |
| WNUT16 | EnNullR (0.80 | 49.66 | 1.3646 | 25.26 | 0.1722 |
| EnNullR (0.20) | 54.22 | 0.5449 | 36.99 | 0.9092 | |
| EnNullR (0.00) | 52.36 | 0.3577 | 36.04 | 1.3302 | |
| Original | 55.49 | 2.1829 | 36.89 | 0.0900 | |
| Dataset | Train & Dev | Lattice LSTM | Flat-Lattice | ||
|---|---|---|---|---|---|
| avg. | std. | avg. | std. | ||
| EnNullR (0.80) | 29.26 | 5.0456 | 30.96 | 0.3409 | |
| EnNullR (0.20) | 52.97 | 0.0408 | 53.55 | 2.7369 | |
| EnNullR (0.00) | 54.02 | 0.3600 | 55.89 | 6.2324 | |
| Original | 55.04 | 1.0192 | 57.92 | - | |
| MSRA | EnNullR (0.80) | 80.51 | 0.0750 | 83.26 | 0.0157 |
| EnNullR (0.20) | 91.11 | 0.0151 | 92.82 | 0.0259 | |
| EnNullR(0.00) | 91.94 | 0.0001 | 93.60 | 0.0097 | |
| Original | 92.50 | 0.0273 | 94.06 | - | |
5 How Dataset Properties Affect Model Performance?
To validate the metrics and results under our statistical evaluation framework and to further investigate how the statistical metric scores on dataset properties affect the model performance, we conduct controlled dataset adjustment in this section.
5.1 Models
We use models for experiments on the Chinese NER datasets, including: 1) Lattice LSTM Zhang and Yang (2018b), a model based on the Long Short-term Memory Networks Chiu and Nichols (2016), which finds the valuable words from the context through the gated recurrent cells automatically. 2) Flat-Lattice Li et al. (2020), which converts the lattice structure into a flat structure 3) Roberta Liu et al. (2019), a transformer-based pretrained model which removes the next sentence predict task in BERT.
For the English datasets, we also take models, including: 1) LSTM CRF Lample et al. (2016), a traditional model based on the bidirectional LSTM with conditional random fields (CRF). 2) LUKE Yamada et al. (2020), which provides new pretrained contextualized representations of words and entities by predicting masked words and entities in entity-annotated corpus based on the bidirectional transformer Vaswani et al. (2017). 3) W2NER Li et al. (2022), which converts NER to word-word relationship classification and models the neighboring relations between entity words with Next-Neighboring-Word (NNW) and Tail-Head-Word (THW) relations.
5.2 Experiment Settings
All the experiments are done on the NVIDIA RTX 2080 GPU and 3090 GPU and evaluated by seqeval 888https://github.com/chakki-works/seqeval. For the experiment with Train-Dev dataset adjustment (Sec. 5.3), we report the averaged results and variances over three random seeds.
5.2.1 Hyper-parameters and Word Embeddings
Specifically, we choose the no-BERT version Flat Lattice and add a CRF layer on Roberta. We select the best performance version of LSTM CRF with pretrained word embeddings, character-based modeling of words, and dropout rate. The more detailed settings and hyper-parameter are described in Appendix A. As known in Lample et al. (2016), models using pretrained word embeddings perform better than randomly initialized ones. Therefore, we use different word embedding methods to ensure the comprehensiveness of the experiment. The specific word embeddings selection is shown in Appendix B.
5.3 Controlled Dataset Adjustment
We conduct controlled dataset adjustment experiments to investigate how the statistical properties (measured by our metrics) affect model performance: 1) modifies the test set to construct two new test sets (of the same size) of which statistical values of one certain metric (e.g., Leakage Ratio and Unseen Entity Ratio) are clearly distinguishable (i.e., Test Dataset Adjustment). 2) modifies training set and development set to construct two new training sets and development sets (of the same size), respectively, of which statistical values of one certain metric are clearly distinguishable (i.e., Train-Dev Dataset Adjustment).
5.3.1 Test Dataset Adjustment
We adjust the test set around two metrics of Unseen Entity Ratio, and Entity Ambiguity Degree to construct two new test sets respectively, and make their statistical values on the corresponding metrics relatively discrete. For example, as for the Unseen Entity Ratio, we adjust the test set to construct two new test sets, one with an Unseen Entity Ratio of 0.80 (80%) and the other with an Unseen Entity Ratio of 0.20 (20%), while ensuring that the two newly constructed test sets have the same number of instances.
5.3.2 Train-Dev Dataset Adjustment
First, we selected some datasets with high En-Null Rates, i.e., WNUT16 and OntoNotes5 for English datasets, Weibo and OntoNotes4 for Chinese datasets. Then we filter the data in the training set and development set to make the En-Null Rate 20% and 80%, respectively, and ensure that the instance numbers of these two subsets are consistent. Finally, we use different models to train the data and then use the same test set to test and compare the scores.
5.4 Experiment Results and Analysis
Datasets with high Unseen Entity Ratio are more difficult for NER models.
Intuitively, those entities that were seen during training are more challenging for NER models compared to those that did not appear in the training set. Fig. 4 supports our intuition. Models perform better on datasets with a lower proportion of unseen entities than in datasets with a relatively high proportion of unseen entities.
Entities with strong Entity Ambiguity Degree are indeed more likely to confuse the model.
We can infer from Fig. 5 that datasets with a high Entity Ambiguity Degree are more challenging for the model. As for models tested on Chinese datasets, their average performance is 6.42 (F1) points higher on datasets with high entity ambiguity rates than on datasets with low entity ambiguity rates. The English NER model is more likely to be confused by entities with a high entity ambiguity rate and make wrong decisions.
Entity-Null Rate plays a small difference.
As shown in Tab. 3 and Tab. 4, the F1 score of the training set and development set with EnNullR of 0.20 (20%) is better than 0.80 (80%). Therefore, we conclude that the contribution of instances without entities to the model is less than the instances with entities during training. However, are instances without any entities completely useless for model training? We delete all these instances and show the results in Tab. 3 and Tab. 4. The performance of models trained on such datasets decreases, which indicates that the instances without entity are necessary, as they keep the distribution of the test set and training set relatively consistent.
6 Discussion
Our statistical evaluation framework can be used to analyze the factors that affect the dataset’s quality and, furthermore, to build a higher-quality dataset in a targeted manner or augment the data with statistical improvement guidance. In this section, we take an initial step to analyze how the dataset construction process affects the statistical properties of datasets.
As shown in Tab. 5, based on an overview of the literature that presented the 10 NER datasets, we provide a summary of how they were built. We can see that all datasets were created manually, with the exception of CLUENER and WikiAnn. As for CLUENER, Xu et al. (2020) pre-label their dataset using the distant-supervised approach with a vocabulary and then manually check and modify some labels. WikiAnn is constructed using a cross-lingual name tagging framework based on a series of new Knowledge Base (KB) mining methods Pan et al. (2017).
We observe from Tab. 1 that only 2 of the 10 NER datasets, CLUENER and WikiAnn, had Acc scores below 0.90 (90%), indicating that the NER dataset, which was not totally created manually, will have a significant number of annotation errors (shown in Appendix Fig. 6).
| Dataset | Construction Method |
|---|---|
| CLUENER | distant supervision + human |
| OntoNotes4 | human annotation |
| MSRA | human annotation |
| PeopleDaily | human annotation |
| Resume | human annotation |
| human annotation | |
| WikiAnn | cross-lingual name tagging framework |
| CoNLL03 | human annotation |
| WNUT16 | human annotation |
| OntoNotes5 | human annotation |
7 Related Work
Issues in NLP Datasets
Recent works have shown that NLP datasets have a number of quality problems, e.g., label mistakes Wang et al. (2019), entity missing999The target summary contains entities (names, dates, events, etc.) that are absent from the source. Tejaswin et al. (2021) in NER dataset. In addition, researchers propose that the model performance might be inflated on some machine reading comprehension Sugawara et al. (2020) datasets or natural language inference datasets Gururangan et al. (2018). Models trained on some specific datasets reach high performance by merely relying on spurious correlations, which results in poor generalization ability.
However, most work focus on a specific issue of the datasets, and most issues are highly related to the model training process. Inspired by CTT, we build our dataset quality evaluation framework from reliability, difficulty, and validity dimensions. And we developed metrics for assessing the quality of datasets under the above three dimensions in conjunction with NER task characteristics and experimentally validated the effectiveness of our metrics in dataset evaluation.
Data-centric AI
In these years, the dataset is gradually being valued by the NLP and machine learning community. Andrew Ng, Dillon Laird, and Lynn He (2021) first proposed a data-centric AI research paradigm, pointing out that focusing on optimizing data rather than models can often achieve better results. At the same time, Xu et al. (2021) propose DataCLUE, the first Data-centric benchmark applied in the NLP field. The data-centric research paradigm emphasizes improving the dataset quality in an automatic or semi-automatic way to improve the model performance. We believe our proposed evaluation metrics can point the way for dataset quality improvement efforts.
8 Conclusion and Future Work
In this paper, we investigate various statistical properties of the NER datasets and propose a comprehensive dataset evaluation framework with nine statistical metrics. We implement a fine-grained evaluation on ten widely used NER datasets and provide a fair comparison of the existing datasets from three dimensions: difficulty, validity, and reliability. We further explore how the statistical properties of the training dataset influence the model performance and how do dataset construction methods affect the dataset quality. In the future, we hope more works dive into dataset quality evaluation from a broader and more general perspective.
References
- Andrew Ng, Dillon Laird, and Lynn He (2021) Andrew Ng, Dillon Laird, and Lynn He. 2021. Datacentric ai competition.
- Bernier-Colborne and Langlais (2020) Gabriel Bernier-Colborne and Philippe Langlais. 2020. Hardeval: Focusing on challenging tokens to assess robustness of ner. In Proceedings of the 12th Language Resources and Evaluation Conference, pages 1704–1711.
- Blevins and Zettlemoyer (2020) Terra Blevins and Luke Zettlemoyer. 2020. Moving down the long tail of word sense disambiguation with gloss-informed biencoders. arXiv preprint arXiv:2005.02590.
- Bommasani et al. (2021) Rishi Bommasani, Drew A Hudson, Ehsan Adeli, Russ Altman, Simran Arora, Sydney von Arx, Michael S Bernstein, Jeannette Bohg, Antoine Bosselut, Emma Brunskill, et al. 2021. On the opportunities and risks of foundation models. arXiv preprint arXiv:2108.07258.
- Chiu and Nichols (2016) Jason PC Chiu and Eric Nichols. 2016. Named entity recognition with bidirectional lstm-cnns. Transactions of the association for computational linguistics, 4:357–370.
- Cohen (1960) Jacob Cohen. 1960. A coefficient of agreement for nominal scales. Educational and psychological measurement, 20(1):37–46.
- Devlin et al. (2019) Jacob Devlin, Ming-Wei Chang, Kenton Lee, and Kristina Toutanova. 2019. BERT: Pre-training of deep bidirectional transformers for language understanding. In Proceedings of the 2019 Conference of the North American Chapter of the Association for Computational Linguistics: Human Language Technologies (NAACL-HLT).
- Fu et al. (2020) Jinlan Fu, Pengfei Liu, and Graham Neubig. 2020. Interpretable multi-dataset evaluation for named entity recognition. arXiv preprint arXiv:2011.06854.
- Goyal et al. (2022) Tanya Goyal, Junyi Jessy Li, and Greg Durrett. 2022. News summarization and evaluation in the era of gpt-3. ArXiv, abs/2209.12356.
- Gupta and Gupta (2019) Shivani Gupta and Atul Gupta. 2019. Dealing with noise problem in machine learning data-sets: A systematic review. Procedia Computer Science, 161:466–474.
- Gururangan et al. (2018) Suchin Gururangan, Swabha Swayamdipta, Omer Levy, Roy Schwartz, Samuel Bowman, and Noah A. Smith. 2018. Annotation artifacts in natural language inference data. In Proceedings of the 2018 Conference of the North American Chapter of the Association for Computational Linguistics: Human Language Technologies, Volume 2 (Short Papers), pages 107–112, New Orleans, Louisiana. Association for Computational Linguistics.
- He and Sun (2017) Hangfeng He and Xu Sun. 2017. F-score driven max margin neural network for named entity recognition in Chinese social media. In Proceedings of the 15th Conference of the European Chapter of the Association for Computational Linguistics: Volume 2, Short Papers, pages 713–718, Valencia, Spain. Association for Computational Linguistics.
- Lample et al. (2016) Guillaume Lample, Miguel Ballesteros, Sandeep Subramanian, Kazuya Kawakami, and Chris Dyer. 2016. Neural architectures for named entity recognition. arXiv preprint arXiv:1603.01360.
- Levow (2006) Gina-Anne Levow. 2006. The third international chinese language processing bakeoff: Word segmentation and named entity recognition. In Proceedings of the Fifth SIGHAN Workshop on Chinese Language Processing, pages 108–117.
- Li et al. (2022) Jingye Li, Hao Fei, Jiang Liu, Shengqiong Wu, Meishan Zhang, Chong Teng, Donghong Ji, and Fei Li. 2022. Unified named entity recognition as word-word relation classification. In Proceedings of the AAAI Conference on Artificial Intelligence, volume 36, pages 10965–10973.
- Li et al. (2020) Xiaonan Li, Hang Yan, Xipeng Qiu, and Xuanjing Huang. 2020. Flat: Chinese ner using flat-lattice transformer. arXiv preprint arXiv:2004.11795.
- Liu et al. (2019) Yinhan Liu, Myle Ott, Naman Goyal, Jingfei Du, Mandar Joshi, Danqi Chen, Omer Levy, Mike Lewis, Luke Zettlemoyer, and Veselin Stoyanov. 2019. Roberta: A robustly optimized BERT pretraining approach. arXiv preprint, arXiv:1907.11692.
- Loshchilov and Hutter (2017) Ilya Loshchilov and Frank Hutter. 2017. Decoupled weight decay regularization. arXiv preprint arXiv:1711.05101.
- Malmasi et al. (2022) Shervin Malmasi, Anjie Fang, Besnik Fetahu, Sudipta Kar, and Oleg Rokhlenko. 2022. Multiconer: a large-scale multilingual dataset for complex named entity recognition. arXiv preprint arXiv:2208.14536.
- Novick (1966) Melvin R Novick. 1966. The axioms and principal results of classical test theory. Journal of mathematical psychology, 3(1):1–18.
- Pan et al. (2017) Xiaoman Pan, Boliang Zhang, Jonathan May, Joel Nothman, Kevin Knight, and Heng Ji. 2017. Cross-lingual name tagging and linking for 282 languages. In Proceedings of the 55th Annual Meeting of the Association for Computational Linguistics (Volume 1: Long Papers), pages 1946–1958, Vancouver, Canada. Association for Computational Linguistics.
- Peng and Dredze (2015) Nanyun Peng and Mark Dredze. 2015. Named entity recognition for Chinese social media with jointly trained embeddings. In Proceedings of the 2015 Conference on Empirical Methods in Natural Language Processing, pages 548–554, Lisbon, Portugal. Association for Computational Linguistics.
- Poliak et al. (2018) Adam Poliak, Jason Naradowsky, Aparajita Haldar, Rachel Rudinger, and Benjamin Van Durme. 2018. Hypothesis only baselines in natural language inference. In Proceedings of the Seventh Joint Conference on Lexical and Computational Semantics, pages 180–191, New Orleans, Louisiana. Association for Computational Linguistics.
- Rashkin et al. (2021) Hannah Rashkin, Vitaly Nikolaev, Matthew Lamm, Michael Collins, Dipanjan Das, Slav Petrov, Gaurav Singh Tomar, Iulia Turc, and D. Reitter. 2021. Measuring attribution in natural language generation models. ArXiv, abs/2112.12870.
- Srivastava et al. (2022) Aarohi Srivastava, Abhinav Rastogi, Abhishek Rao, Abu Awal Md Shoeb, Abubakar Abid, Adam Fisch, Adam R Brown, Adam Santoro, Aditya Gupta, Adrià Garriga-Alonso, et al. 2022. Beyond the imitation game: Quantifying and extrapolating the capabilities of language models. arXiv preprint arXiv:2206.04615.
- Strauss et al. (2016) Benjamin Strauss, Bethany Toma, Alan Ritter, Marie-Catherine de Marneffe, and Wei Xu. 2016. Results of the WNUT16 named entity recognition shared task. In Proceedings of the 2nd Workshop on Noisy User-generated Text (WNUT), pages 138–144, Osaka, Japan. The COLING 2016 Organizing Committee.
- Sugawara et al. (2020) Saku Sugawara, Pontus Stenetorp, Kentaro Inui, and Akiko Aizawa. 2020. Assessing the benchmarking capacity of machine reading comprehension datasets. In Proceedings of the AAAI Conference on Artificial Intelligence, volume 34, pages 8918–8927.
- Tejaswin et al. (2021) Priyam Tejaswin, Dhruv Naik, and Pengfei Liu. 2021. How well do you know your summarization datasets?
- Tjong Kim Sang and De Meulder (2003) Erik F. Tjong Kim Sang and Fien De Meulder. 2003. Introduction to the CoNLL-2003 shared task: Language-independent named entity recognition. In Proceedings of the Seventh Conference on Natural Language Learning at HLT-NAACL 2003, pages 142–147.
- Vaswani et al. (2017) Ashish Vaswani, Noam Shazeer, Niki Parmar, Jakob Uszkoreit, Llion Jones, Aidan N Gomez, Łukasz Kaiser, and Illia Polosukhin. 2017. Attention is all you need. Advances in neural information processing systems, 30.
- Wang et al. (2020) Boxin Wang, Shuohang Wang, Yu Cheng, Zhe Gan, Ruoxi Jia, Bo Li, and Jingjing Liu. 2020. Infobert: Improving robustness of language models from an information theoretic perspective. arXiv preprint arXiv:2010.02329.
- Wang et al. (2019) Zihan Wang, Jingbo Shang, Liyuan Liu, Lihao Lu, Jiacheng Liu, and Jiawei Han. 2019. CrossWeigh: Training named entity tagger from imperfect annotations. In Proceedings of the 2019 Conference on Empirical Methods in Natural Language Processing and the 9th International Joint Conference on Natural Language Processing (EMNLP-IJCNLP), pages 5154–5163, Hong Kong, China. Association for Computational Linguistics.
- Weischedel et al. (2013) Ralph Weischedel, Martha Palmer, Mitchell Marcus, Eduard Hovy, Sameer Pradhan, Lance Ramshaw, Nianwen Xue, Ann Taylor, Jeff Kaufman, Michelle Franchini, et al. 2013. Ontonotes release 5.0 ldc2013t19. Linguistic Data Consortium, Philadelphia, PA, 23.
- Weischedel et al. (2011) Ralph Weischedel, Sameer Pradhan, Lance Ramshaw, Martha Palmer, Nianwen Xue, Mitchell Marcus, Ann Taylor, Craig Greenberg, Eduard Hovy, Robert Belvin, et al. 2011. Ontonotes release 4.0. LDC2011T03, Philadelphia, Penn.: Linguistic Data Consortium.
- Xu et al. (2020) Liang Xu, Qianqian Dong, Yixuan Liao, Cong Yu, Yin Tian, Weitang Liu, Lu Li, Caiquan Liu, Xuanwei Zhang, et al. 2020. Cluener2020: fine-grained named entity recognition dataset and benchmark for chinese. arXiv preprint arXiv:2001.04351.
- Xu et al. (2021) Liang Xu, Jiacheng Liu, Xiang Pan, Xiaojing Lu, and Xiaofeng Hou. 2021. Dataclue: A benchmark suite for data-centric nlp. arXiv preprint arXiv:2111.08647.
- Yamada et al. (2020) Ikuya Yamada, Akari Asai, Hiroyuki Shindo, Hideaki Takeda, and Yuji Matsumoto. 2020. Luke: deep contextualized entity representations with entity-aware self-attention. arXiv preprint arXiv:2010.01057.
- Yin et al. (2021) Wenpeng Yin, Dragomir Radev, and Caiming Xiong. 2021. Docnli: A large-scale dataset for document-level natural language inference. arXiv preprint arXiv:2106.09449.
- Zeng et al. (2021) Qingkai Zeng, Mengxia Yu, Wenhao Yu, Tianwen Jiang, and Meng Jiang. 2021. Validating label consistency in ner data annotation. arXiv preprint arXiv:2101.08698.
- Zhang et al. (2021) Yifan Zhang, Bingyi Kang, Bryan Hooi, Shuicheng Yan, and Jiashi Feng. 2021. Deep long-tailed learning: A survey. arXiv preprint arXiv:2110.04596.
- Zhang and Yang (2018a) Yue Zhang and Jie Yang. 2018a. Chinese NER using lattice LSTM. In Proceedings of the 56th Annual Meeting of the Association for Computational Linguistics (Volume 1: Long Papers), pages 1554–1564, Melbourne, Australia. Association for Computational Linguistics.
- Zhang and Yang (2018b) Yue Zhang and Jie Yang. 2018b. Chinese ner using lattice lstm. arXiv preprint arXiv:1805.02023.
- Zhu et al. (2003) Xingquan Zhu, Xindong Wu, and Qijun Chen. 2003. Eliminating class noise in large datasets. In Proceedings of the 20th International Conference on Machine Learning (ICML-03), pages 920–927.
Appendix
Appendix A Settings for Different Models
W2NER, Roberta, and LUKE adopt AdamW Loshchilov and Hutter (2017) optimizer. Stochastic Gradient Descent (SGD) is used for optimation in Lattice LSTM, LSTM CRF, and Flat-Lattice. Furthermore, LUKE and W2NER optimize the model using AdamW with learning rate warmup and linear decay of the learning rate. LUKE also uses early stopping based on performance on the development set. The hyper-parameters of six models are shown below. In addition, the hyper-parameter used for the large dataset is the left one in the bracket.
Appendix B Word Embeddings
Static Word Embeddings
Lattice LSTM uses its own word 101010https://github.com/jiesutd/RichWordSegmentor, character and character bigram embeddings 111111https://github.com/jiesutd/LatticeLSTM. LSTM CRF also has its own pretained embedding, but it is not available. So we use the embedding of common-crawl vectors from fasttext 121212https://fasttext.cc/docs/en/english-vectors.html instead. Flat-Lattice uses the same pretained embeddings as Lattice-LSTM.
Dynamic Word Embeddings
Words have different meanings in different contexts, while static word embedding cannot consider different contexts. The word embedding representation obtained through BERT integrates more grammatical, lexical, and semantic information. Besides, dynamic word embedding can also enable words to have different word embedding representations in different contexts. LUKE proposes new pretrained contextualized representations of words and entities with Roberta. W2NER use bert-large-cased for the English dataset and bert-base-chinese for Chinese. Roberta is undoubtedly an optimized version of BERT.
| Hyper-parameter | Value |
|---|---|
| dist_emb_size | 20 |
| type_emb_size | 20 |
| bert_hid_size | [768, 1024] |
| conv_hid_size | [96, 64] |
| lstm_hid_size | [768, 512] |
| dropout | 0.5 |
| learning rate (BERT) | [1e-5, 5e-6] |
| learning rate (others) | 1e-3 |
| batch size | [2, 4, 8] |
| Hyper-parameter | Value |
| gradient clipping | 5.0 |
| layer dimension | 100 |
| LSTM layer | 1 |
| dropout | 0.5 |
| char_dim | 25 |
| char_lstm_dim | 25 |
| word_dim | 300 |
| word_lstm_dim | 100 |
| learning rate | 0.01 |
| Hyper-parameter | Value |
|---|---|
| decay | -0.05 |
| momentum | -0.9 |
| FFN_size | 480 |
| head | [8, 4, 12] |
| d_head | [16,20] |
| d_model | head d_head |
| embed dropout | 0.5 |
| output dropout | 0.3 |
| learning rate | [1e-3, 8e-4] |
| warmup | [10, 1, 5](epoch) |
| batch size | [10, 8] |
| Hyper-parameter | Value |
|---|---|
| embedding size | 50 |
| LSTM hidden | 200 |
| batch size | 1 |
| learning rate | 0.015 |
| dropout | 0.5 |
| learning rate | 5e-5 |
| Hyper-parameter | Value |
|---|---|
| batch size | 32 |
| max sentence length | 300 |
| weight decay rate | 0.1 |
| warmup | 100(step) |
| Hyper-parameter | Value |
|---|---|
| batch size | [4, 8] |
| adam | 0.9 |
| adam | 0.98 |
| adam | 1e-6 |
| dropout | 0.1 |
| warmup ratio | 0.06 |
| weight decay | 0.01 |
| maximum word length | 512 |
| learning rate | 1e-5 |
| gradient clipping | none |
Appendix C Validation Details of the Metrics under our Statistical Evaluation Framework
We justify and clarify those metrics under our evaluation framework that we have not discussed further in the main text.
Redundancy
International standards for data 131313https://iso25000.com/index.php/en/iso-25000-standards/iso-25012 require the uniqueness of data. Data sets are a special data type and should also follow the corresponding standards.
Accuracy
Text Complexity
Several experiments of Fu et al. (2020) on the English NER datasets support our use of entity density as a valid metric of the difficulty of the dataset. Their experiments showed that NER models are negatively correlated with entity density.
Model Differentiation
This metric is an extrinsic metric that aims to assess the dispersion of model scores on a unified benchmark dataset. As long as enough models are evaluated on the data set, we can measure the differentiation of a dataset by calculating the dispersion of the scores of different models.
Entity Imbalance Degree
Leakage Ratio
We validate the metric following the controlled data adjustment method in Sec. 5. As shown in Tab. 12, 3 models (i.e., Lattice LSTM, Flat-Lattice, and Roberta) consistently achieve better performance when the leakage rate of the test set is 0.80 (80%) than when it is 0.20 (20%). In particular, we found that the performance of Flat-Lattice on the Weibo test set with a Leakage Ratio of 0.80 (80%) outperformed the 0.20 (20%) by a large margin i.e., 25.69%. We speculate that because the model has seen the leaked data in the test set during training, it performs better on the test set with a relatively high data leakage rate. Looking at the experimental results from another perspective, researchers need to pay more attention to how to improve the generalization ability of the NER model.
| Dataset | Test | LSTM | Flat-Lattice | Roberta |
|---|---|---|---|---|
| Leakage (80%) | 73.68 | 74.24 | 78.52 | |
| Leakage (20%) | 64.86 | 48.65 | 70.40 |
Appendix D Mistakes in NER Datasets
Appendix E Specific assessment results for different splits of the dataset under the reliability metrics
As introduced in Sec. 4.2, we average the scores of the training, the development, and the test split of the datasets for Redundancy and Accuracy to obtain Redundancy and Accuracy of the corresponding datasets. Tab. 13 presents evaluated split values for different English NER datasets, and Tab. 14 is for Chinese NER datasets.
| CoNLL03 | WNUT16 | OntoNotes5 | |||||||
|---|---|---|---|---|---|---|---|---|---|
| train | dev | test | train | dev | test | train | dev | test | |
| Red | 0.06 | 0.03 | 0.05 | 0.04 | 0.00 | 0.00 | 0.01 | 0.01 | 0.01 |
| Acc | 0.93 | 0.96 | 0.98 | 0.95 | 0.98 | 0.97 | 0.90 | 0.88 | 0.95 |
| Dataset | Split | Red | Acc |
| CLUENER | train | 0.00 | 0.89 |
| dev | 0.00 | 0.83 | |
| OntoNotes4 | train | 0.02 | 0.98 |
| dev | 0.03 | 0.97 | |
| test | 0.01 | 0.98 | |
| MSRA | train | 0.00 | 0.99 |
| test | 0.00 | 1.00 | |
| PeopleDaily | train | 0.00 | 0.96 |
| dev | 0.00 | 0.94 | |
| test | 0.00 | 0.97 | |
| Resume | train | 0.00 | 1.00 |
| dev | 0.00 | 1.00 | |
| test | 0.00 | 1.00 | |
| train | 0.08 | 0.96 | |
| dev | 0.03 | 0.98 | |
| test | 0.03 | 0.99 | |
| WikiAnn | train | 0.04 | 0.90 |
| dev | 0.03 | 0.88 | |
| test | 0.03 | 0.90 |
Appendix F Model Replication Results
In the paper, we have reproduced Lattice LSTM, Flat-Lattice, Roberta, LSTM CRF, LUKE, and W2NER. The results of our reproduced models are compared to the performance of the cited works are listed in Tab. 15 and Tab. 16.
| Lattice LSTM | Flat-Lattice | Roberta | ||||
|---|---|---|---|---|---|---|
| ori. | repro. | ori. | repro. | ori. | repro. | |
| MSRA | 93.18 | 93.12 | 94.35 | 94.06 | - | 94.57 |
| OntoNotes4 | 73.88 | 73.43 | 75.70 | 75.84 | - | 80.30 |
| Resume | 94.46 | 94.46 | 94.93 | 95.11 | - | 96.19 |
| 58.79 | 56.49 | 63.42 | 57.92 | - | 67.92 | |
| LSTM CRF | W2NER | LUKE | ||||
|---|---|---|---|---|---|---|
| ori. | repro. | ori. | repro. | ori. | repro. | |
| CoNLL03 | 83.63 | 83.61 | 93.07 | 92.02 | 94.30 | 94.2 |
| WNUT16 | - | 26.04 | - | 45.81 | - | 56.99 |
| OntoNotes5 | - | 80.14 | 90.50 | 84.92 | - | 87.27 |