PHANGS-JWST First Results: Destruction of the PAH molecules in HII regions probed by JWST and MUSE
Abstract
Polycyclic aromatic hydrocarbons (PAHs) play a critical role in the reprocessing of stellar radiation and in balancing the heating and cooling processes in the interstellar medium (ISM), but appear to be destroyed in H ii regions. However, the mechanisms driving their destruction are still not completely understood. Using PHANGS-JWST and PHANGS-MUSE observations, we investigate how the PAH fraction changes in about 1500 H ii regions across four nearby star-forming galaxies (NGC 628, NGC 1365, NGC 7496, IC 5332). We find a strong anti-correlation between the PAH fraction and the ionization parameter (the ratio between the ionizing photon flux and the hydrogen density) of H ii regions. This relation becomes steeper for more luminous H ii regions. The metallicity of H ii regions has only a minor impact on these results in our galaxy sample. We find that the PAH fraction decreases with the equivalent width – a proxy for the age of the H ii regions – although this trend is much weaker than the one identified using the ionization parameter. Our results are consistent with a scenario where hydrogen-ionizing UV radiation is the dominant source of PAH destruction in star-forming regions.
1 Introduction
Polycyclic aromatic hydrocarbons (PAHs) are carbon-based macromolecules that are ubiquitous in the interstellar medium (ISM), and are traced by several strong emission features at 3.3, 6.2, 7.7, 8.6, 11.3, 12.7, and 17 m (Tielens, 2008; Li, 2020). Together with very small ( Å) dust grains that have been stochastically heated, PAHs can be a dominant contributor to the mid-infrared (mid-IR) spectra of galaxies (e.g. Draine & Li, 2007). The IR emission from PAHs is produced by the absorption and re-emission of ultraviolet (UV) photons, with PAHs reprocessing as much as 20% of all stellar UV radiation (Smith et al., 2007). Because of this, they have been proposed as indicators of star formation rate (Calzetti, 2013), but their usage for this purpose is complicated by our lack of understanding of the mechanisms for PAH formation and destruction (Whitcomb et al., 2020).
PAHs are formed in the carbon-rich atmospheres of evolved stars (e.g. Latter, 1991; Cherchneff et al., 1992), though these PAHs alone cannot account for all the PAH emission observed in the ISM (e.g. Matsuura et al., 2009, 2013). The precursor molecules for PAHs have been found in dense clouds (Burkhardt et al., 2021), and high PAH fractions are observed in molecular clouds, which is difficult to explain if they do not form there given cloud lifetimes (Sandstrom et al., 2010; Chastenet et al., 2019). A popular scenario for PAH formation is the shattering of larger dust grains (e.g. Jones et al., 1996; Hirashita & Yan, 2009; Seok et al., 2014; Wiebe et al., 2014). Both shocks and UV radiation play a critical but complex role in the evolution of PAHs. Shocks can increase the PAH fraction by dissociating large grains, but also decrease the PAH abundance by destroying them directly (e.g. O’Halloran et al., 2006; Micelotta et al., 2010a). Similarly, UV radiation excites the IR bands in PAHs, but can also destroy them (e.g. Allain et al., 1996; Pavlyuchenkov et al., 2013).
PAH destruction is thought to be regulated by the radiation field, either by the high intensity of ionizing photons (Montillaud et al., 2013) or the hardness111Various definitions are used in the literature (e.g., the effective temperature, or the spectral index of the UV spectrum). Here we define ‘hardness’ as the ratio of the fluxes over hard and soft UV ranges (see Appendix A). of the radiation (Madden et al., 2006; Gordon et al., 2008). Theoretical works also suggest that PAHs are subject to sputtering and fragmentation in ionized gas due to electronic and atomic interactions (Micelotta et al., 2010b; Bocchio et al., 2012). These processes should destroy PAH molecules, and thus reduce their abundance in H ii regions. Observationally, this has been seen as a lack of PAH emission in the interior of Galactic H ii regions (e.g. Povich et al., 2007), and an anti-correlation between the PAH fraction and tracers of the hardness and/or intensity of the ionizing radiation on large (global) scales (e.g. Madden et al., 2006; Gordon et al., 2008; Hunt et al., 2010; Lebouteiller et al., 2011; Maragkoudakis et al., 2018). Hydrogen-ionizing radiation is often considered a natural explanation for the observed decrease of the PAH abundances in low-metallicity galaxies and star-forming complexes (e.g. Engelbracht et al., 2005; Madden et al., 2006; Engelbracht et al., 2008; Khramtsova et al., 2013).
The properties of star-forming regions (e.g. age, metallicity, density) establish the balance between the PAH formation and destruction processes. Multi-wavelength observations of H ii regions, their stellar populations and associated photo-dissociation regions (PDR) are therefore key for understanding the evolution of PAHs in the ISM of galaxies, and high (100 pc) physical resolutions are critical to spatially isolating local from global effects (see also Chastenet et al., subm.a). Until now, such observations were possible mainly in H ii regions in our Galaxy (e.g. Povich et al., 2007; Binder & Povich, 2018), or very nearby galaxies (e.g. Bolatto et al., 2007; Sandstrom et al., 2010; Wiebe et al., 2011; Lebouteiller et al., 2011; Chastenet et al., 2017; Maragkoudakis et al., 2018; Chastenet et al., 2019; Mallory et al., 2022), while most extragalactic studies were focused on integrated observations of entire galaxies or of large star-forming complexes (e.g. Engelbracht et al., 2005; Madden et al., 2006; Gordon et al., 2008; Khramtsova et al., 2013, 2014; Maragkoudakis et al., 2018; Lin et al., 2020).
With the launch of the JWST, it is now possible to investigate individual H ii regions and their immediate surroundings in significantly more distant galaxies than ever before, covering a more representative view of physical conditions in the ISM. Combining new JWST data with the available high-resolution data in different wavelength ranges, we can probe now the evolution of the PAHs and other grains in connection with the star-forming H ii regions.
In this letter, we explore the abundance of PAH molecules within the boundaries of H ii regions at 28–64 pc resolution in four nearby star-forming galaxies observed with JWST as the first targets in the PHANGS-JWST treasury program (Lee et al., 2022a). We use MIRI images as tracers of emission from PAHs and very small dust grains. We combine these data with optical spectroscopy obtained from the MUSE integral-field spectrograph (Bacon et al., 2010) on the VLT as part of the PHANGS-MUSE program (Emsellem et al., 2022). Based on these data sets, we investigate the relation between the PAH fraction and properties of the H ii regions that could be potentially regulating their destruction (or formation). We refer the reader to the accompanying paper by Chastenet et al. (subm.a), where we analyze the PAH fraction on galaxy-wide scales.
This letter is organized as follows. In Section 2 we describe the underlying observational data. Section 3 provides details on the methods and criteria implemented for selection of the H ii regions and deriving the properties of the gas, dust and young stars there. Section 4 describes results from the comparison of our tracer for PAH abundance and properties of the H ii regions. Section 5 summarizes our results.
2 Observations
2.1 Galaxy sample
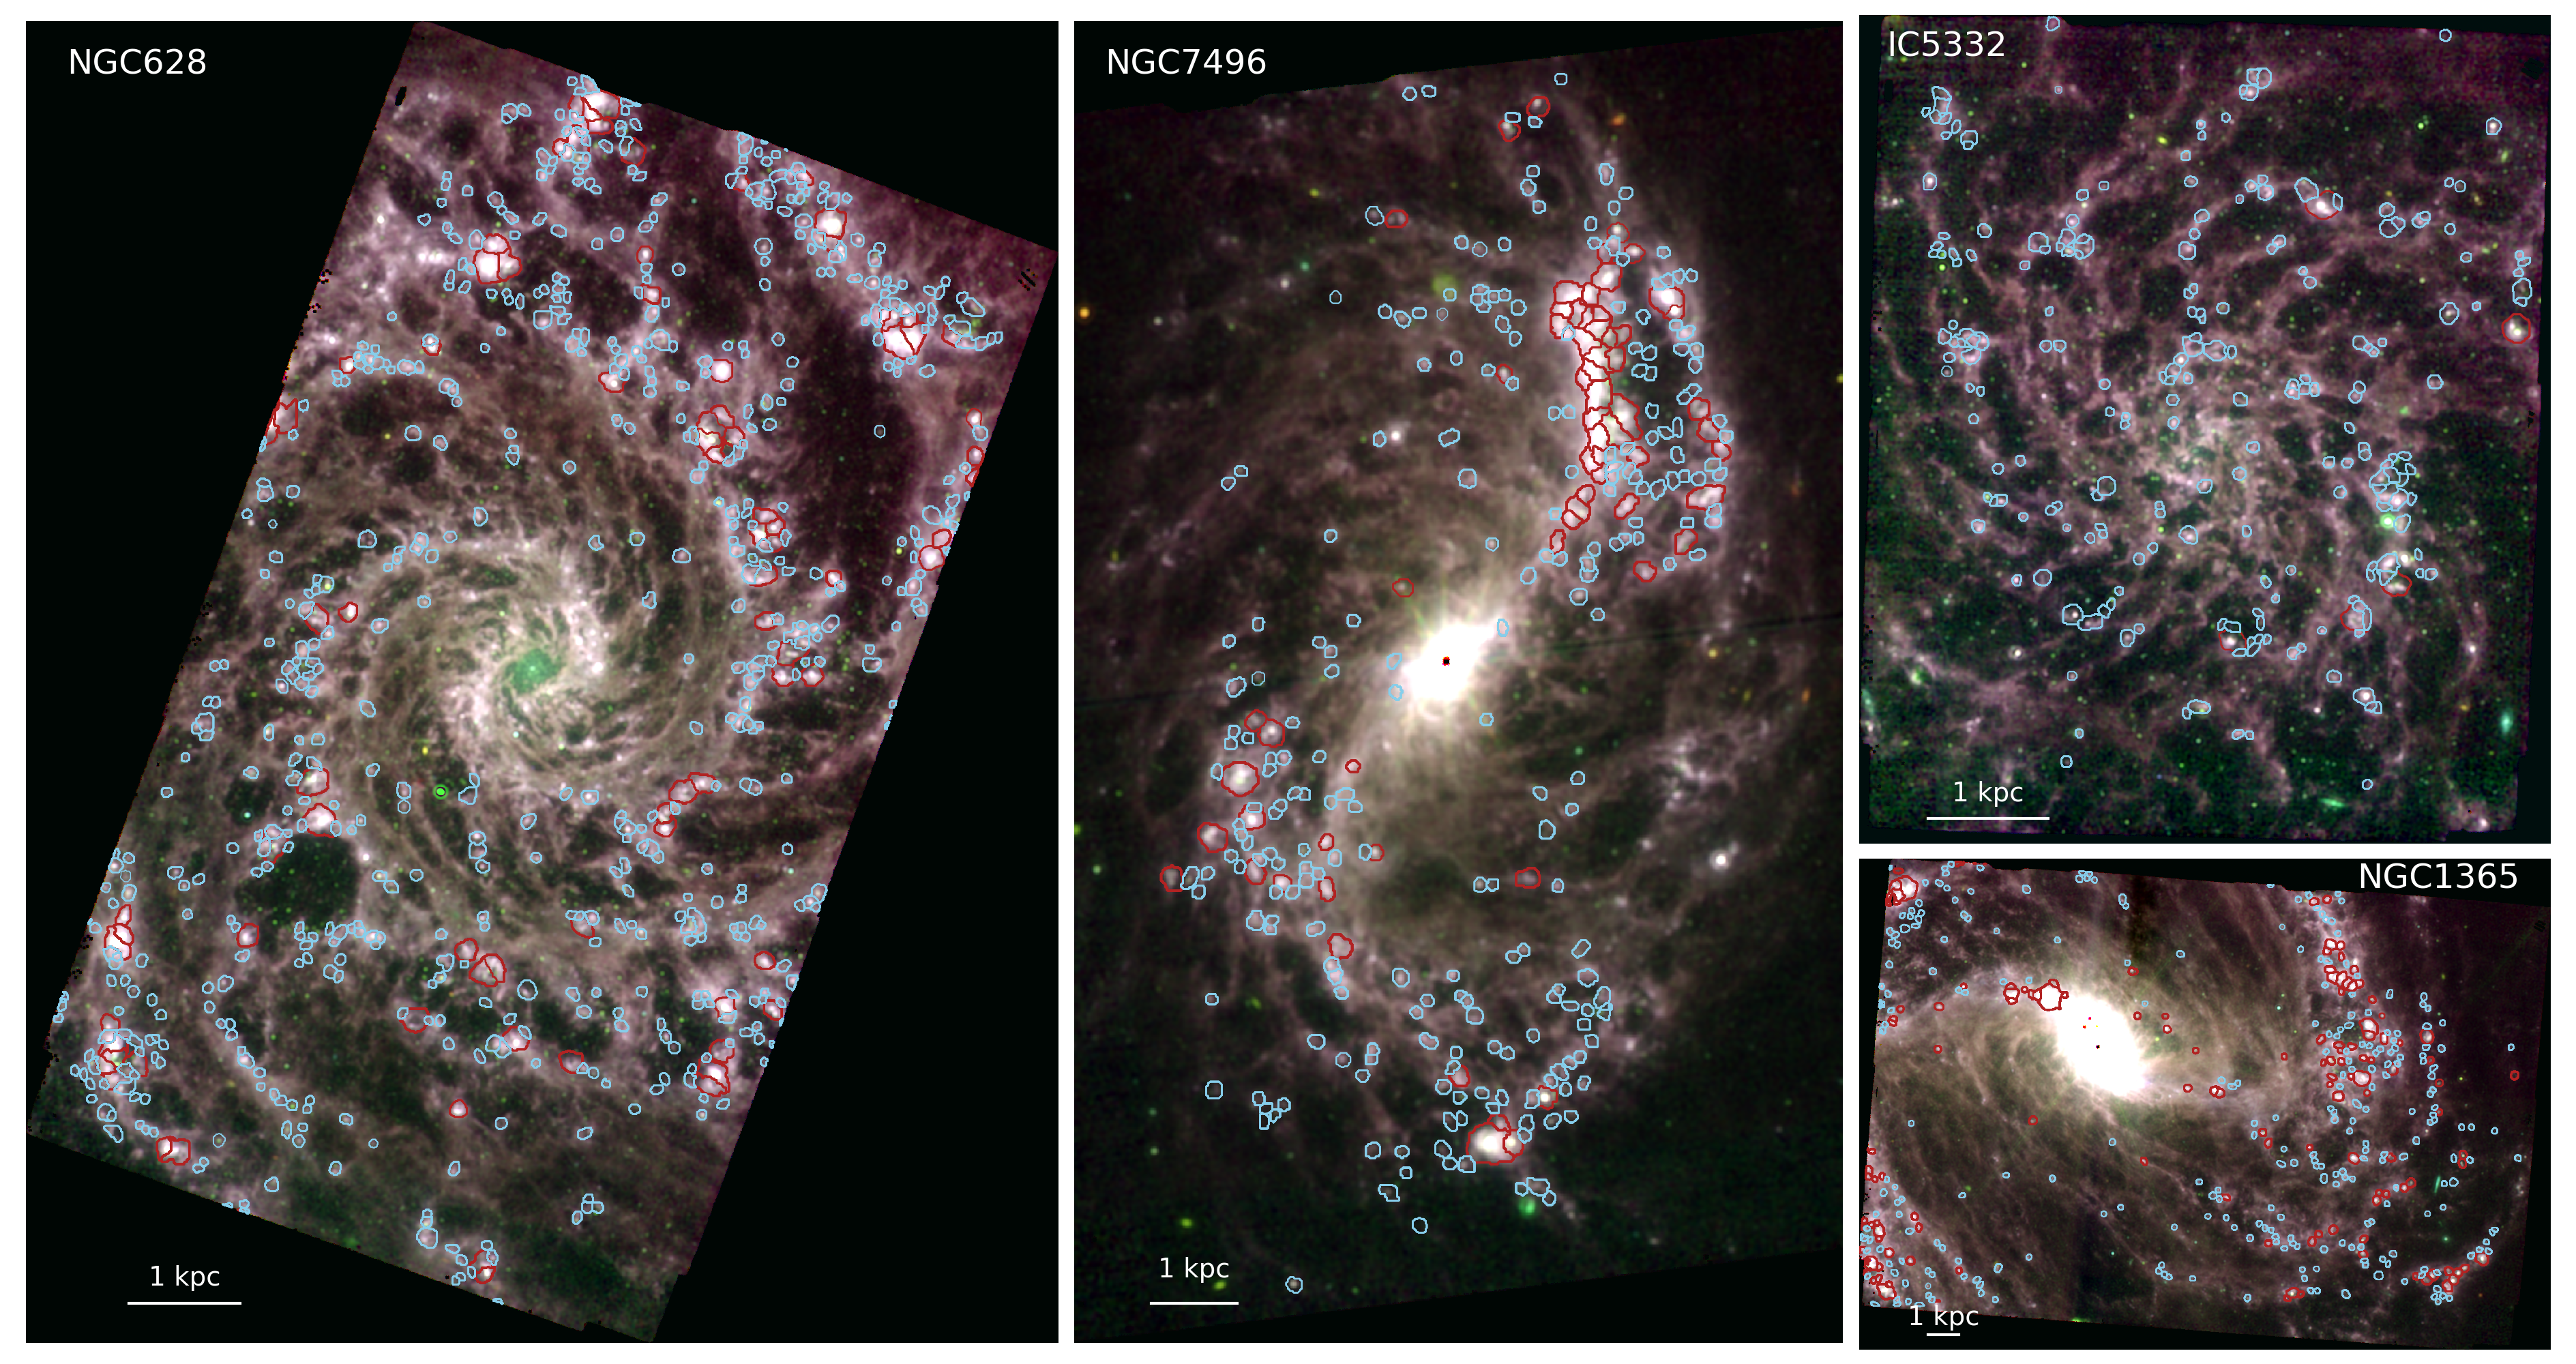
We analyze H ii regions in the first four PHANGS-JWST galaxies. These galaxies have all been observed with VLT/MUSE, and thus are ideal objects to relate the properties of ionized gas to the PAH emission. These nearby (D 9–20 Mpc) galaxies span an order of magnitude in stellar mass (see Table 1), and almost two orders of magnitude in star formation rate (SFR). Two galaxies (NGC 1365 and NGC 7496) host active galactic nuclei (AGNs) and strong bars. NGC 628 is a prototypical grand-design spiral, while IC 5332 shows a flocculent spiral morphology. They represent a good cross-section of the PHANGS-JWST sample (Fig. 1).
| Galaxy | (SFR)+ | 12+log(O/H)∗ | ||||
|---|---|---|---|---|---|---|
| (Mpc) | (kpc) | () | () | at | ||
| IC5332 | 9.011 | 8.0 | 9.67 | 0.39 | 8.30 | 208 |
| NGC628 | 9.841 | 14.1 | 10.34 | 0.24 | 8.48 | 668 |
| NGC1365 | 19.571 | 34.2 | 10.99 | 1.23 | 8.48 | 365 |
| NGC7496 | 18.722 | 9.1 | 10.00 | 0.35 | 8.51 | 288 |
2.2 PHANGS-JWST
The JWST data were obtained in Cycle 1 as part of the PHANGS-JWST program (ID 02107; PI: J. C. Lee). The survey targets 19 nearby star-forming galaxies with NIRCam (F200W, F300M, F335M and F360M) and MIRI (F770W, F1000W, F1130W and F2100W) imaging. The first four galaxies have been observed, and their MIRI images (Fig. 1) form the basis of our analysis. These galaxies have been imaged with two (for IC 5332 and NGC 7496), three (for NGC 628) or four (NGC 1365) MIRI pointings (88.8, 122.1, 310.8, 321.9 seconds per pointing in the F770W, F1000W, F1130W and F2100W bands, respectively, and with 4 dithers per pointing to properly sample the PSF), covering an area well-matched to the PHANGS-MUSE (Emsellem et al., 2022) and PHANGS-HST observations (Lee et al., 2022b). The sensitivity of the data is similar for all four galaxies in all MIRI bands ( MJy sr-1 at level) except F2100W ( MJy sr-1). We convolve all images to the PSF of the F2100W images (FWHM ; corresponding to 28–64 pc at the distance of our targets), as obtained via the webbpsf (Perrin et al., 2014) model222https://webbpsf.readthedocs.io/en/stable/index.html. Convolution kernels were created following the procedure from Aniano et al. (2011). Standard calibrations are applied, with minor modifications. A detailed description of the complete data reduction is presented in Lee et al. (2022a).
2.3 PHANGS-MUSE
All the galaxies in the PHANGS-JWST program were previously observed with VLT/MUSE as part of the PHANGS-MUSE large program (PI: Schinnerer). The reduced data are publicly available333https://archive.eso.org/scienceportal/home?data_collection=PHANGS, and the details of the observations and data reduction are given in Emsellem et al. (2022). The angular resolution of the MUSE data for the objects in this study is (45–95 pc), sufficient to isolate individual H ii regions from surrounding diffuse ionized gas (DIG).
Based on MUSE H emission line maps, a catalog of nebulae has been constructed (Santoro et al. 2022, Groves et al. submitted). The nebulae were selected using HIIphot (Thilker et al., 2000), which results in spatial masks that define the borders of each nebula. The catalog contains derived properties of each nebula (e.g., emission line fluxes, velocity dispersion, equivalent width, metallicity) based on their integrated spectra. The emission lines from each nebula are corrected for the effects of dust extinction using the Balmer decrement, as described in Groves et al. In the remainder of this paper, we use the extinction-corrected values. We do not correct the measured fluxes for the contribution of the DIG. H ii regions are selected from the nebulae catalog based on the Baldwin et al. (1981) diagnostics considering [O iii]/ vs [N ii]/ and [S ii]/ line ratios, as described in Groves et al. (submitted, see also Kewley et al. 2019 for a review). The present analysis is restricted to only those H ii regions that meet stringent surface brightness and signal-to-noise (S/N) criteria (see Sec. 3.1).
3 Deriving the properties of the ionized gas and PAHs in star-forming regions
3.1 Selection of the nebulae and associated PAH emission
We use the spatial masks from the PHANGS-MUSE nebular catalog (see Sec. 2.3) to identify the positions of H ii regions in the JWST data. To do that, we reproject these masks to the JWST images. Since two of our galaxies contain an AGN, which produces hard ionizing radiation that can significantly affect the PAH fraction (e.g. Jensen et al., 2017; Lai et al., 2022; García-Bernete et al., 2022), we exclude the centers of the galaxies from our analysis. Masks that isolate these particular environments are taken from Querejeta et al. (2021).
In order to minimize the DIG contribution to the regions’ flux, which could bias derived properties of the nebulae, we select only those H ii regions with high H equivalent width Å and H surface brightness (e.g. Belfiore et al., 2022). We also require in every emission line considered in this letter, and in the line. This ensures that we can recover accurate reddening-corrected fluxes of emission lines and derived properties for each of the nebulae.
In total, we select 1529 H ii regions across all four galaxies ( in Tab. 1) – about 25% of the H ii regions in our catalog (37% for NGC 1365). We derive the ratio 444While [S iii]9532 is outside the MUSE spectral range, the two [S iii] lines show a fixed ratio, which we assume to be [S iii][S iii]9069Å(Osterbrock & Ferland, 2006), which is a proxy for the ionization parameter (the ratio of the local ionizing photon flux and the local hydrogen density; Kewley & Dopita 2002), and we measure the oxygen abundance (a proxy for gas-phase metallicity) with the S-calibration from Pilyugin & Grebel (2016). We integrate the fluxes in each JWST MIRI band within the apertures corresponding to the reprojected mask for each region. Some ratios of these mid-IR fluxes trace the PAH abundance in the ISM. We do not correct the measured fluxes for possible contribution from the diffuse ISM. Note, however, that removing the local background measured in circular apertures around H ii regions does not affect qualitatively the results presented below.
3.2 Tracing the PAH fraction in the ISM
The ratio of total fluxes in the Spitzer bands is often considered as a tracer of – the mass fraction of PAH molecules with respect to the total dust mass (e.g. Engelbracht et al., 2005; Bolatto et al., 2007; Sandstrom et al., 2010; Khramtsova et al., 2014; Oey et al., 2017). Sandstrom et al. (2010) have shown that is indeed a good tracer of , although it has a large scatter in the diffuse low-metallicity ISM where %. Khramtsova et al. (2013) found a stronger correlation between these parameters in star-forming regions.
In the case of JWST, the flux of the F2100W band traces the emission from very small dust grains (similar to Spitzer 24 m) and correlates with the total IR luminosity (), whereas F770W and F1130W are dominated by PAH features at 7.7 m (similar to Spitzer 8 m) and 11.3 m, respectively, and trace the neutral and ionized ISM (Sandstrom et al., subm.). Models by Draine et al. (2021) show that is proportional to both and . Using as a proxy for introduces an unknown scaling, but provides a robust empirical tracer of (Chastenet et al., subm.a). In this letter, we consider both the m and m PAH features and assume that:
| (1) |
Similarly to the works mentioned above, we assume further that changes in H ii regions mostly due to variations of the PAH fraction regulated by the processes of their formation and destruction. Note, however, that redistribution of the dust grains of different sizes can also affect if the relative abundance of very small grains is changing in H ii regions. For example, Everett & Churchwell (2010) hypothesized that the very small grains could be re-supplied by the destruction of the dense embedded cloudlets overrun by the expansion of a bubble. Furthermore, radiation-pressure-driven shift or/and the stellar winds (Gail & Sedlmayr, 1979; Draine, 2011) can redistribute the PAHs and very small grains, which has been suggested as a mechanism for evacuating the dust grains from the interior of several Galactic H ii regions (Paladini et al., 2012). Shell-like morphology of the Galactic H ii regions is indeed clearly seen in the mid-IR bands, especially in PAH-sensitive bands (e.g. Anderson et al., 2014). However, small grains ( Å) drift much more slowly than larger grains, and the difference between the PAHs and the very small grains is insignificant (Draine, 2011). Thus, these processes should not significantly change the relative fraction of PAHs within the H ii regions. Nevertheless, both of these effects can change the relative brightness of the rims of the H ii regions in the mid-IR bands. Given that we analyze the ratios of the fluxes integrated over the H ii regions, excluding the surrounding PDR (at least for the resolved H ii regions, see Sec. 4.1), our results presented below are unlikely to be affected by these processes.
4 Results and discussion
4.1 Destruction of PAHs by UV radiation
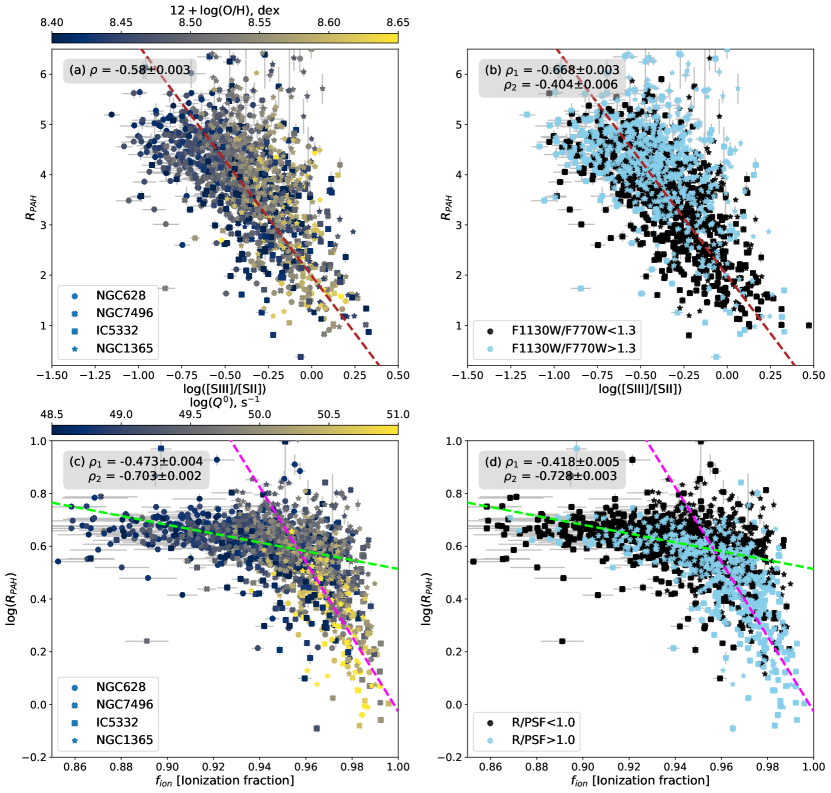
PAH destruction is expected to be correlated with the hardness and intensity of the radiation field (see Sec. 1). In previous works (e.g. Madden et al., 2006; Gordon et al., 2008; Lebouteiller et al., 2011; Maragkoudakis et al., 2018), the flux ratio of the neon IR lines [Ne iii]15.56 m/[Ne ii]12.81 m was used as a tracer of the hardness of the ionizing radiation field. As shown in Kewley et al. (2019), this ratio is dependent on both the ionization parameter and the metallicity. In turn, the hardness of the radiation field depends on the metallicity (e.g. Groves et al., 2008), and can be correlated with the ionization parameter in H ii regions (see discussion in Kumari et al., 2021). In this work, we use another tracer of the ionization parameter – [S iii]9069,9532Å/[S ii]6717,6731Å, which can be measured in optical spectra. In contrast to [Ne iii]/[Ne ii], this ratio of sulfur lines is almost independent of metallicity (Kewley et al., 2019) and thus allows us to explore the relation of PAH abundances with the properties of the ionizing radiation field and the metallicity separately.
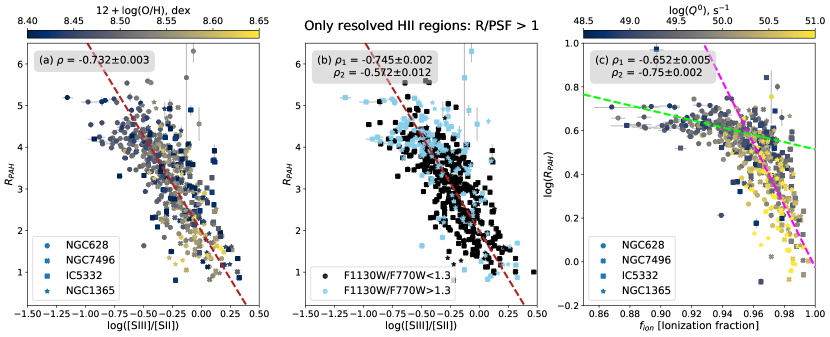
In Fig. 2(a, b) we demonstrate how depends on ([S iii]/[S ii]) in the 1529 H ii regions. The data shows a strong anti-correlation, implying that the PAH fraction in H ii regions is tightly related to the ionization parameter. This anti-correlation can be parameterized linearly as:
where accounts for any secondary dependence on metallicity. For now, we assume as we do not see a significant secondary correlation of with in Panel (a) (but see Sec. 4.2).
Panel (b) of Fig. 2 illustrates that the regions with higher have, in general, a higher ratio of . This ratio is often used as a diagnostic of the neutral-to-ionized PAH ratio (e.g. Draine & Li, 2001; Maragkoudakis et al., 2018). Neutral PAHs have a higher ratio of , which decreases as the fraction of ionized PAHs increases. Thus, the distribution of shown in this plot is consistent with a scenario where the PAHs are ionized and destroyed in the H ii regions with higher ionization parameter. Note, however, that this ratio can be affected by changes of the PAH size in higher intensity and harder radiation fields. The PAH feature at , together with , can help to disentangle the impact of PAH size from variations in the radiation field (Draine et al., 2021; Dale et al., 2022). We refer the reader to Chastenet et al. (subm.b), who demonstrate that PAHs are not only more ionized, but also have smaller sizes in H ii regions, which is consistent with their gradual destruction in such environments.
Panel (c) of Fig. 2 provides some tentative conversions from the empirical correlations in Panels (a) and (b) towards a more physical interpretation. It shows vs – the ionization fraction of hydrogen in each H ii region. The latter is calculated from ([S iii]/[S ii]) using the empirical parametrization from Kreckel et al. (2022). The color corresponds to the number of ionizing photons required to produce the observed luminosity : assuming K (Osterbrock & Ferland, 2006), and with expressed in units of erg s-1. In this representation, two different sequences are suggested when examining the dependence of PAH fraction on . Namely, only slightly decreases with increasing (and ionization parameter) for fainter H ii regions, even when the ionization fraction is high. In turn, bright regions (likely associated with more massive star clusters) more strongly affect the PAH fraction. We perform separate linear fits to the faint and bright H ii regions (shown by green and magenta dashed lines in Fig. 2c, respectively):
| (3) |
| (4) |
Given the well-known size – luminosity relation for H ii regions (e.g. Wisnioski et al., 2012), a probable explanation of the bi-modality of the vs relation is a difference in their sizes. This difference can have both a physical or observational origin (or a combination). On the one hand, the larger, brighter regions might encompass the full scale height of the galactic disk and exhibit because the ISM is fully ionized towards these regions. On the other hand, the size of regions that are unresolved with MUSE might be overestimated, while for well-resolved regions the reprojected masks (see Section 3.1) should better isolate the H ii regions. Thus, in the unresolved regions one may expect to see a higher contribution from the diffuse ISM to the measurements. The effects leading to the redistribution of the dust grains at the outskirts of H ii regions (mentioned in Sec. 3.2) may also be more prominent. Panel (d) of Fig. 2 shows the same plot as Panel (c), but all points are color-coded by – their effective angular radius relative to the resolution (FWHM of PSF) of the MUSE data. The color dashed lines show the regressions as on Panel (c) defined by Eqs. 3,4. Indeed, we start to resolve the H ii regions with MUSE at , which naturally explains the bi-modality. Future JWST observations of more nearby galaxies will help to clarify if the differences between the faint and bright H ii regions are real, or just an effect of the limited resolution. Note that excluding the unresolved regions with (64% of our sample) from consideration in Panels (a – c) of Fig. 2 does not affect our results, but the resolved regions do demonstrate a much tighter correlation with ([S iii]/[S ii]) (see Appendix B).
In our measurements we do not attempt to correct for the contribution of the diffuse ISM to the optical emission line fluxes, or to the mid-IR bands, because performing a local background subtraction depends heavily on the exact H ii region boundaries we define and potentially introduces large uncertainties into our measurements. Nevertheless, we validate in Appendix B that our results do not change if we keep only those regions where the background emission is negligible compared to our measured fluxes. From this, we conclude that unresolved regions and contamination by the DIG/background mid-IR emission do not change our results, but are responsible for the scatter in Fig. 2.
4.2 Dependence of the PAH abundance on metallicity
The dependence of the PAH abundance on metallicity has been explored for galaxy-wide scales and for individual large star-forming complexes (e.g. Engelbracht et al., 2005; Khramtsova et al., 2013; Aniano et al., 2020). While is clearly systematically lower in dwarf galaxies compared to spiral galaxies, in the high-metallicity regime this relation exhibits a considerable scatter. The galaxies in our sample have relatively high metallicity, and cover only 0.3 dex of dynamic range (8.3 8.6), which could contribute to the lack of a clear secondary dependence of with oxygen abundance in Fig. 2a.
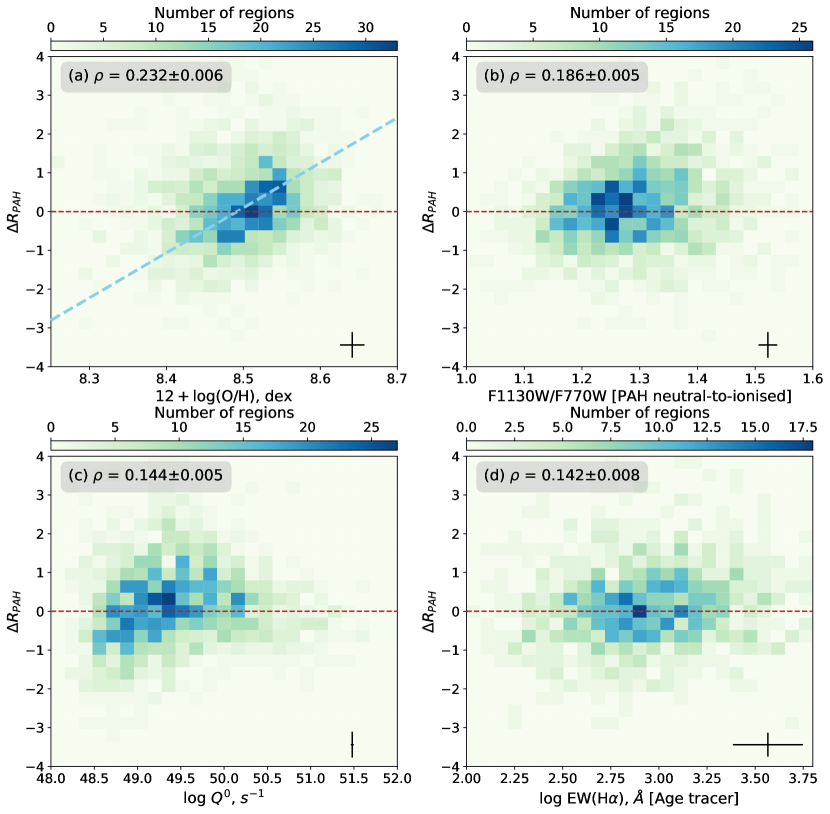
To explore the secondary dependence of with metallicity, we subtract the relation in Eq. 4.1 from our measurements and correlate the residuals with in Fig. 3a. We find a mild correlation between these values only considering the 2D histogram representing the statistical density of the points on this plot. This correlation can be parameterized linearly as:
| (5) | |||||
Using this in Eq. 4.1, we can describe the PAH fraction in H ii regions as a function of characteristics of the ionized gas – its ionization parameter and metallicity. The dominant factor defining is the ionization parameter, and the metallicity plays only a minor role leading to scatter in Fig. 2a,b. Note that we do not find any prominent secondary relation of the PAH fraction on other parameters (F1130W/F770W, ) explored in Fig. 2 (the bend in the trend for in Fig. 3c is probably due to the bi-modality discussed in Sec. 4.1).
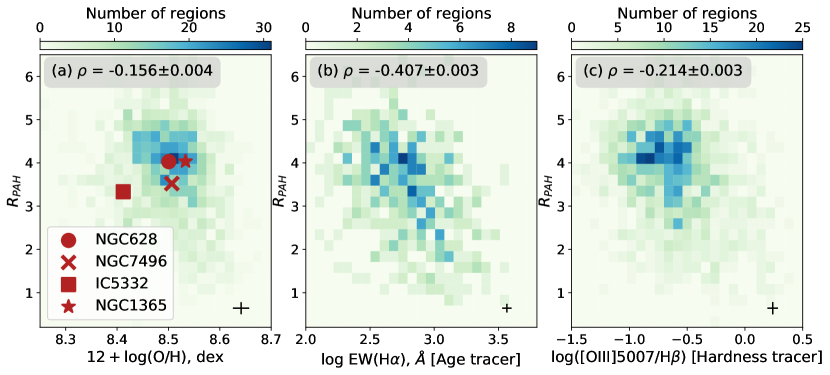
To demonstrate that we are not missing a primary correlation between and metallicity, we show the 2D histogram distribution of these values in Fig. 4a. Red symbols on this plot correspond to the values averaged over all regions within each galaxy. These averaged values show an expected mild trend of increasing PAH fraction with the higher metallicity. At the same time, the distribution of the individual H ii regions demonstrates the opposite trend – a very weak anti-correlation of with oxygen abundance (similarly to that for a small sample of high-metallicity galaxies in Engelbracht et al., 2008).
Overall, we conclude that the PAH destruction in H ii regions is nearly independent of metallicity, at least for the range of oxygen abundances we consider. Analyzing highly-resolved data for the LMC and SMC, Chastenet et al. (2019) also found similar in the luminous H ii regions of those two galaxies, despite their difference in metallicity and a difference in their global values. This supports our claim that the weakness of the metallicity dependence is not only due to the limited range of in our data. At the same time, Chastenet et al. (subm.a) find a much stronger correlation between and the metallicity of the diffuse ISM, where the intensity of is low. These results together imply that the metallicity regulates the PAH destruction and formation processes, but it becomes much less important in the H ii regions, where the presence of large amount of ionized gas and intense ionizing radiation plays a dominant role.
4.3 The role of UV hardness
The PAH fraction in H ii regions strongly correlates with the [S iii]/[S ii] line ratio, with only a mild secondary dependence on the metallicity. While [S iii]/[S ii] is a good tracer of the ionization parameter, it is also weakly dependent on the hardness of the UV radiation field (see Appendix A). Many previous studies found a correlation between the PAH fraction and the hardness of the radiation field at the scale of star-forming complexes (e.g. Madden et al., 2006; Gordon et al., 2008; Khramtsova et al., 2014; Maragkoudakis et al., 2018), and thus we cannot be sure that the trend seen in Fig. 2 is driven by the intensity of the hydrogen-ionizing radiation (or ionization parameter) and not by the hardness of the ionizing radiation field.
We cannot directly measure the hardness of the UV field from our data, but as was shown by Levesque et al. (2010) and Khramtsova et al. (2014) (see also Fig. 5 in Appendix A), [O iii]/ is a reasonable tracer of UV hardness at fixed metallicity. This ratio also depends on the ionization parameter, but to a lesser extent than [S iii]/[S ii]. Given this, we would expect to see a strong correlation between and [O iii]/ if the PAH destruction in H ii regions is regulated mostly by the hardness of the ionizing radiation field, and not by its intensity. In fact, we see only a relatively weak correlation between these parameters in Fig. 4c. Note that our result remains unchanged if we exclude IC 5332 from consideration (and only focus on the three galaxies of approximately similar metallicity). Thus, it is probable that it is indeed the ionization parameter, and not hardness, that drives the correlation in Fig. 2.
4.4 Towards an evolutionary sequence
The dependence of on the ionization parameter can be viewed within the context of an H ii region evolutionary sequence. We expect the ionization parameter to decrease with age, as older star clusters produce fewer ionizing photons and the H ii region expands (Dopita et al., 2006). The equivalent width of Balmer lines (e.g., )) is another (more common) indicator that decreases with the age of an H ii region (Levesque & Leitherer, 2013). In Fig. 4b, we identify a correlation between and ), where ) has been corrected for the contribution of the underlying old stellar population555This correction is performed by subtracting the corresponding continuum derived in a circular aperture surrounding each H ii region. For details, see Scheuermann et al. (submitted). decreases with ), however the correlation is not as prominent as the correlation with [S iii]/[S ii]. This suggests that the fraction of PAH molecules in the total dust mass increases slightly with time, if we assume that ) is a good tracer of the age of H ii region. Note that we do not find a secondary correlation between the residuals (obtained after subtraction of the relation defined by Eq. 4.1 from the observed data) on ) (Fig. 3d), probably because both ) and [S iii]/[S ii] should decrease with the age. If such correlation with age is real, then it implies that the PAH fraction is higher in older regions. This can be explained if we assume that the balance between PAH formation and destruction changes with time. For example, the relative fraction of PAHs can increase with time if the very small grains have been destroyed or cleared from the older H ii regions more efficiently than PAHs, or if PAHs (even gradually) build up as result of destruction of larger dust grains (e.g., as results of shattering).
Previous studies have revealed a possible evolution of the PAH abundance with the age of star-forming regions, but the behavior is quite complex and depends on the balance between the processes of formation and destruction of the dust grains and PAHs (e.g. Wiebe et al., 2014; Khramtsova et al., 2014; Lin et al., 2020). In particular, according to Khramtsova et al. (2014), increases with age for low-metallicity regions, and this trend flattens for higher metallicities. The correlation of with ) in Fig. 4b is relatively weak, and ) itself is not always a strong tracer of H ii region age (Scheuermann et al., in prep.), thus we are hesitant to interpret this trend as strong evidence for an age sequence. Future work linking H ii regions with age dating of ionizing stellar clusters using PHANGS-HST and PHANGS-JWST data will provide a more robust quantification of these tentative age trends (see also Dale et al. 2022).
4.5 The role of shocks
Beyond the correlations identified in this letter, we search for other properties regulating the PAH fraction on the scales of individual H ii regions. In particular, we tested whether shocks affect the PAH fraction by considering regions associated with high velocity dispersion (Egorov et al., in prep.) or classified as shock ionized by diagnostic optical emission lines ratios (Congiu et al., submitted), but did not find any significant differences from the trends we identify using the H ii regions in Fig. 2. Thus, the ionization parameter (intensity of hydrogen-ionizing radiation) appears to be the dominant factor in defining the mechanisms for PAH destruction in H ii regions.
5 Summary
With JWST it is now possible to systematically study the properties of the PAH component of the ISM at the scales of individual H ii regions in the galaxies beyond our Local Group, building a more representative picture of the interplay between ionizing sources and dust properties. As a pilot study, we analyze the PAH fraction in 1529 H ii regions within the disks of four nearby star-forming galaxies from the PHANGS-JWST program, and compare them with the properties of the ionized gas as obtained from PHANGS-MUSE observations. We find a strong anti-correlation between PAH fraction and ionization parameter, with a steeper dependence for more luminous regions. This is consistent with a scenario where the destruction of the PAH molecules is set by the hydrogen-ionizing UV radiation, though it is not clear if the observed trend reflects an evolutionary sequence. We find only a weak secondary dependence between PAH fraction and oxygen abundance, although we note that we cover a very limited range (0.3 dex) in metallicity in our sample. Together with the results presented in Chastenet et al. (subm.a), this implies that, in contrast to the diffuse ISM, the metallicity becomes unimportant in defining the balance between PAHs formation and destruction in H ii regions, where the presence of ionized gas and hard radiation dominate.
In this study leveraging new JWST observations for four star-forming galaxies, we have demonstrated that hydrogen-ionizing UV radiation is the dominant mechanism for PAH destruction in H ii regions.
Acknowledgments
This work is based on observations made with the NASA/ESA/CSA JWST. The data were obtained from the Mikulski Archive for Space Telescopes at the Space Telescope Science Institute, which is operated by the Association of Universities for Research in Astronomy, Inc., under NASA contract NAS 5-03127. The observations are associated with JWST program 2107. The specific observations analyzed can be accessed via http://dx.doi.org/10.17909/9bdf-jn24 (catalog 10.17909/9bdf-jn24). Based on observations collected at the European Southern Observatory under ESO programmes 094.C-0623 (PI: Kreckel), 095.C-0473, 098.C-0484 (PI: Blanc), 1100.B-0651 (PHANGS-MUSE; PI: Schinnerer), as well as 094.B-0321 (MAGNUM; PI: Marconi), 099.B-0242, 0100.B-0116, 098.B-0551 (MAD; PI: Carollo) and 097.B-0640 (TIMER; PI: Gadotti).
KK, OE and FS gratefully acknowledge funding from the Deutsche Forschungsgemeinschaft (DFG, German Research Foundation) in the form of an Emmy Noether Research Group (grant number KR4598/2-1, PI Kreckel). EJW, RSK, SCOG acknowledge funding from the Deutsche Forschungsgemeinschaft (DFG, German Research Foundation) – Project-ID 138713538 – SFB 881 (“The Milky Way System”, subprojects A1, B1, B2, B8, P1). HAP acknowledges support by the National Science and Technology Council of Taiwan under grant 110-2112-M-032-020-MY3. TGW and ES acknowledge funding from the European Research Council (ERC) under the European Union’s Horizon 2020 research and innovation programme (grant agreement No. 694343). MB acknowledges support from FONDECYT regular grant 1211000 and by the ANID BASAL project FB210003. JMDK gratefully acknowledges funding from the European Research Council (ERC) under the European Union’s Horizon 2020 research and innovation programme via the ERC Starting Grant MUSTANG (grant agreement number 714907). COOL Research DAO is a Decentralized Autonomous Organization supporting research in astrophysics aimed at uncovering our cosmic origins. E.C. acknowledges support from ANID Basal projects ACE210002 and FB210003. FB would like to acknowledge funding from the European Research Council (ERC) under the European Union’s Horizon 2020 research and innovation programme (grant agreement No.726384/Empire) MC gratefully acknowledges funding from the DFG through an Emmy Noether Research Group (grant number CH2137/1-1). RSK and SCOG acknowledge support from the European Research Council via the ERC Synergy Grant “ECOGAL” (project ID 855130), from the Heidelberg Cluster of Excellence (EXC 2181 - 390900948) “STRUCTURES”, funded by the German Excellence Strategy, and from the German Ministry for Economic Affairs and Climate Action for funding in project “MAINN” (funding ID 50OO2206). ER acknowledges the support of the Natural Sciences and Engineering Research Council of Canada (NSERC), funding reference number RGPIN-2022-03499. KG is supported by the Australian Research Council through the Discovery Early Career Researcher Award (DECRA) Fellowship DE220100766 funded by the Australian Government. KG is supported by the Australian Research Council Centre of Excellence for All Sky Astrophysics in 3 Dimensions (ASTRO 3D), through project number CE170100013. G.A.B. acknowledges the support from ANID Basal project FB210003. JC acknowledges support from ERC starting grant #851622 DustOrigin. AKL gratefully acknowledges support by grants 1653300 and 2205628 from the National Science Foundation, by award JWST-GO-02107.009-A, and by a Humboldt Research Award from the Alexander von Humboldt Foundation. JPe acknowledges support by the DAOISM grant ANR-21-CE31-0010 and by the Programme National “Physique et Chimie du Milieu Interstellaire” (PCMI) of CNRS/INSU with INC/INP, co-funded by CEA and CNES.
Appendix A Physical interpretation of emission line ratios in the context of photoionization modeling
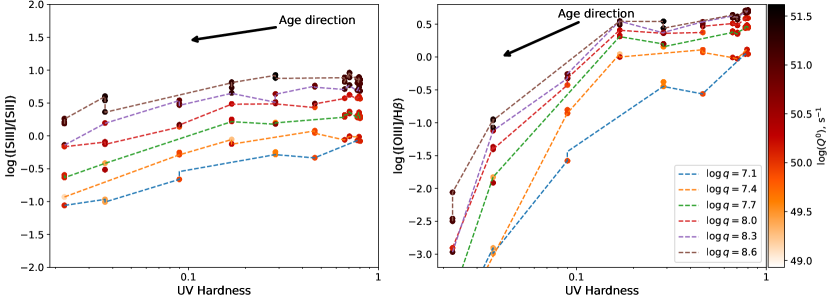
Here we consider how the hardness and intensity of the ionizing radiation impact the [S iii]/[S ii] and [O iii]/ line ratios, and how they evolve with the age of the H ii regions. Kreckel et al. (2022) presented starburst99 (Leitherer et al., 1999, 2014) and cloudy (Ferland et al., 2017) models computed for a grid of star clusters and H ii region physical properties matched to the observed properties as derived in the PHANGS-MUSE and PHANGS-HST data. Here we use a sub-set of their models for metallicity (approximately equal to the metallicity of the four galaxies considered in this work, see Table 1). We consider clusters of mass and age Myr (with step of 1 Myr) as the ionizing source of a cloud with constant hydrogen density cm-3. For simplicity, here we consider only one nebular geometry – a shell with an inner radius of 15 pc, and filling factor .
Similar to Khramtsova et al. (2014), we parameterize the hardness of the UV radiation as the ratio of the total flux in the ionizing continuum at short wavelengths (20 Å to 912 Å) to that at longer wavelengths (912 Å to 2000 Å). Fig. 5 shows how both ionization parameter and UV hardness are traced by the emission line ratios [S iii]/[S ii] and [O iii]/. These line ratios are sensitive to both parameters, but [S iii]/[S ii] shows a stronger dependence on the ionization parameter, while [O iii]/ is less sensitive to ionization parameter but varies significantly with the hardness of the UV radiation. Thus, by analyzing the dependence of PAH fraction in H ii regions using both of these line ratios, we can disentangle whether UV hardness or the number of ionizing photons (proportional to the ionization parameter) is the main driver for PAH destruction. We consider this in Sec. 4.3.
Appendix B Testing the impact of limited angular resolution and contamination by emission from the diffuse ISM
As we show in Section 4.1, a large fraction of the H ii regions analyzed in this paper are not well-resolved by our PHANGS-MUSE observations ( in Fig. 2d). Also, we do not correct the measured fluxes of the optical emission lines and mid-IR bands for a local background, as implementing such subtraction is a fairly uncertain process. Nevertheless, both these factors may affect our measurements. In order to check that our conclusions are not biased because of these factors, we perform several tests in this Section.
In unresolved H ii regions, the measured value of may be biased because of a larger contribution from the surrounding PDR and diffuse ISM to the aperture, which is indeed seen in Fig. 2d. In Fig. 6 we repeat the analysis presented in Sec. 4.1, but consider only the resolved H ii regions having (44% of total number of H ii regions in the analysis). As shown, the relations drawn from the entire sample are the same (but tighter) as the relations observed for the resolved H ii regions alone.
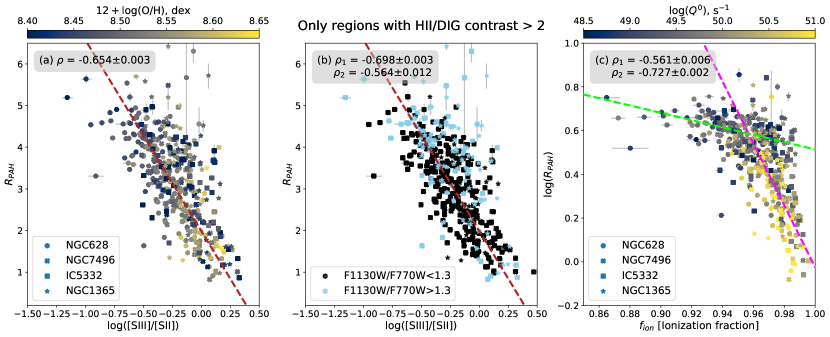
The second test shown in Fig. 6 allows us to confirm that the contamination by the diffuse ISM does not introduce a bias to our results. Here we follow the same approach as in Kreckel et al. (2022) – we consider only the H ii regions with a significant contrast in the and [S ii] fluxes and in the mid-IR bands compared to the local background. We estimate the contrast as the maximal value of among all considered lines/bands, where is a measured integral flux of the H ii region, is the median brightness of the surrounding local background estimated across a 10 circular aperture after masking all H ii regions, and is the area within the H ii region mask. In Fig. 6 we show only regions with a contrast , for which the contribution of the diffuse emission to the total flux is negligible (29% of the entire sample). This ‘clear’ sample demonstrates the same trends as the entire sample in Fig. 2.
We may thus conclude that the presence of unresolved H ii regions and contamination by the diffuse ISM (which is still unavoidable for galaxies outside the Local Group) does not affect the results of our analysis, but add scatter to the observed relations. Note, however, that when considering these sub-samples we cannot judge how reliable our findings are regarding the secondary dependence of the PAH fraction on metallicity (Sec. 4.2, Fig. 3) because the number of regions at the low-metallicity end of the ‘clear’ samples analyzed is too small.
References
- Allain et al. (1996) Allain, T., Leach, S., & Sedlmayr, E. 1996, A&A, 305, 602
- Anand et al. (2021a) Anand, G. S., Lee, J. C., Van Dyk, S. D., et al. 2021a, MNRAS, 501, 3621, doi: 10.1093/mnras/staa3668
- Anand et al. (2021b) Anand, G. S., Rizzi, L., Tully, R. B., et al. 2021b, AJ, 162, 80, doi: 10.3847/1538-3881/ac0440
- Anderson et al. (2014) Anderson, L. D., Bania, T. M., Balser, D. S., et al. 2014, ApJS, 212, 1, doi: 10.1088/0067-0049/212/1/1
- Aniano et al. (2011) Aniano, G., Draine, B. T., Gordon, K. D., & Sandstrom, K. 2011, PASP, 123, 1218, doi: 10.1086/662219
- Aniano et al. (2020) Aniano, G., Draine, B. T., Hunt, L. K., et al. 2020, ApJ, 889, 150, doi: 10.3847/1538-4357/ab5fdb
- Astropy Collaboration et al. (2013) Astropy Collaboration, Robitaille, T. P., Tollerud, E. J., et al. 2013, A&A, 558, A33, doi: 10.1051/0004-6361/201322068
- Astropy Collaboration et al. (2018) Astropy Collaboration, Price-Whelan, A. M., Sipőcz, B. M., et al. 2018, AJ, 156, 123, doi: 10.3847/1538-3881/aabc4f
- Bacon et al. (2010) Bacon, R., Accardo, M., Adjali, L., et al. 2010, in Society of Photo-Optical Instrumentation Engineers (SPIE) Conference Series, Vol. 7735, Ground-based and Airborne Instrumentation for Astronomy III, ed. I. S. McLean, S. K. Ramsay, & H. Takami, 773508, doi: 10.1117/12.856027
- Baldwin et al. (1981) Baldwin, J. A., Phillips, M. M., & Terlevich, R. 1981, PASP, 93, 5, doi: 10.1086/130766
- Belfiore et al. (2022) Belfiore, F., Santoro, F., Groves, B., et al. 2022, A&A, 659, A26, doi: 10.1051/0004-6361/202141859
- Binder & Povich (2018) Binder, B. A., & Povich, M. S. 2018, ApJ, 864, 136, doi: 10.3847/1538-4357/aad7b2
- Bocchio et al. (2012) Bocchio, M., Micelotta, E. R., Gautier, A. L., & Jones, A. P. 2012, A&A, 545, A124, doi: 10.1051/0004-6361/201219705
- Bolatto et al. (2007) Bolatto, A. D., Simon, J. D., Stanimirović, S., et al. 2007, ApJ, 655, 212, doi: 10.1086/509104
- Burkhardt et al. (2021) Burkhardt, A. M., Long Kelvin Lee, K., Bryan Changala, P., et al. 2021, ApJ, 913, L18, doi: 10.3847/2041-8213/abfd3a
- Calzetti (2013) Calzetti, D. 2013, in Secular Evolution of Galaxies, ed. J. Falcón-Barroso & J. H. Knapen (Cambridge University Press), 419
- Chastenet et al. (2017) Chastenet, J., Bot, C., Gordon, K. D., et al. 2017, A&A, 601, A55, doi: 10.1051/0004-6361/201629133
- Chastenet et al. (2019) Chastenet, J., Sandstrom, K., Chiang, I.-D., et al. 2019, ApJ, 876, 62, doi: 10.3847/1538-4357/ab16cf
- Chastenet et al. (subm.a) Chastenet, J., et al. subm.a, ApJ
- Chastenet et al. (subm.b) —. subm.b, ApJ
- Cherchneff et al. (1992) Cherchneff, I., Barker, J. R., & Tielens, A. G. G. M. 1992, ApJ, 401, 269, doi: 10.1086/172059
- Dale et al. (2022) Dale, D. A., Boquien, M., Barnes, A. T., et al. 2022, arXiv e-prints, arXiv:2212.00130. https://arxiv.org/abs/2212.00130
- Dopita et al. (2006) Dopita, M. A., Fischera, J., Sutherland, R. S., et al. 2006, ApJ, 647, 244, doi: 10.1086/505418
- Draine (2011) Draine, B. T. 2011, ApJ, 732, 100, doi: 10.1088/0004-637X/732/2/100
- Draine & Li (2001) Draine, B. T., & Li, A. 2001, ApJ, 551, 807, doi: 10.1086/320227
- Draine & Li (2007) —. 2007, ApJ, 657, 810, doi: 10.1086/511055
- Draine et al. (2021) Draine, B. T., Li, A., Hensley, B. S., et al. 2021, ApJ, 917, 3, doi: 10.3847/1538-4357/abff51
- Emsellem et al. (2022) Emsellem, E., Schinnerer, E., Santoro, F., et al. 2022, A&A, 659, A191, doi: 10.1051/0004-6361/202141727
- Engelbracht et al. (2005) Engelbracht, C. W., Gordon, K. D., Rieke, G. H., et al. 2005, ApJ, 628, L29, doi: 10.1086/432613
- Engelbracht et al. (2008) Engelbracht, C. W., Rieke, G. H., Gordon, K. D., et al. 2008, ApJ, 678, 804, doi: 10.1086/529513
- Everett & Churchwell (2010) Everett, J. E., & Churchwell, E. 2010, ApJ, 713, 592, doi: 10.1088/0004-637X/713/1/592
- Ferland et al. (2017) Ferland, G. J., Chatzikos, M., Guzmán, F., et al. 2017, Rev. Mexicana Astron. Astrofis., 53, 385. https://arxiv.org/abs/1705.10877
- Gail & Sedlmayr (1979) Gail, H. P., & Sedlmayr, E. 1979, A&A, 77, 165
- García-Bernete et al. (2022) García-Bernete, I., Rigopoulou, D., Alonso-Herrero, A., et al. 2022, MNRAS, 509, 4256, doi: 10.1093/mnras/stab3127
- Gordon et al. (2008) Gordon, K. D., Engelbracht, C. W., Rieke, G. H., et al. 2008, ApJ, 682, 336, doi: 10.1086/589567
- Groves et al. (2008) Groves, B., Dopita, M. A., Sutherland, R. S., et al. 2008, ApJS, 176, 438, doi: 10.1086/528711
- Hirashita & Yan (2009) Hirashita, H., & Yan, H. 2009, MNRAS, 394, 1061, doi: 10.1111/j.1365-2966.2009.14405.x
- Hunt et al. (2010) Hunt, L. K., Thuan, T. X., Izotov, Y. I., & Sauvage, M. 2010, ApJ, 712, 164, doi: 10.1088/0004-637X/712/1/164
- Jensen et al. (2017) Jensen, J. J., Hönig, S. F., Rakshit, S., et al. 2017, MNRAS, 470, 3071, doi: 10.1093/mnras/stx1447
- Jones et al. (1996) Jones, A. P., Tielens, A. G. G. M., & Hollenbach, D. J. 1996, ApJ, 469, 740, doi: 10.1086/177823
- Kewley & Dopita (2002) Kewley, L. J., & Dopita, M. A. 2002, ApJS, 142, 35, doi: 10.1086/341326
- Kewley et al. (2019) Kewley, L. J., Nicholls, D. C., & Sutherland, R. S. 2019, ARA&A, 57, 511, doi: 10.1146/annurev-astro-081817-051832
- Khramtsova et al. (2013) Khramtsova, M. S., Wiebe, D. S., Boley, P. A., & Pavlyuchenkov, Y. N. 2013, MNRAS, 431, 2006, doi: 10.1093/mnras/stt319
- Khramtsova et al. (2014) Khramtsova, M. S., Wiebe, D. S., Lozinskaya, T. A., & Egorov, O. V. 2014, MNRAS, 444, 757, doi: 10.1093/mnras/stu1482
- Kourkchi et al. (2020) Kourkchi, E., Courtois, H. M., Graziani, R., et al. 2020, AJ, 159, 67, doi: 10.3847/1538-3881/ab620e
- Kreckel et al. (2022) Kreckel, K., Egorov, O. V., Belfiore, F., et al. 2022, A&A, 667, A16, doi: 10.1051/0004-6361/202243858
- Kumari et al. (2021) Kumari, N., Amorín, R., Pérez-Montero, E., Vílchez, J., & Maiolino, R. 2021, MNRAS, 508, 1084, doi: 10.1093/mnras/stab2495
- Lai et al. (2022) Lai, T. S. Y., Armus, L., U, V., et al. 2022, arXiv e-prints, arXiv:2209.06741. https://arxiv.org/abs/2209.06741
- Latter (1991) Latter, W. B. 1991, ApJ, 377, 187, doi: 10.1086/170346
- Lebouteiller et al. (2011) Lebouteiller, V., Bernard-Salas, J., Whelan, D. G., et al. 2011, ApJ, 728, 45, doi: 10.1088/0004-637X/728/1/45
- Lee et al. (2022a) Lee, J. C., Sandstrom, K. M., Leroy, A. K., et al. 2022a, arXiv e-prints, arXiv:2212.02667. https://arxiv.org/abs/2212.02667
- Lee et al. (2022b) Lee, J. C., Whitmore, B. C., Thilker, D. A., et al. 2022b, ApJS, 258, 10, doi: 10.3847/1538-4365/ac1fe5
- Leitherer et al. (2014) Leitherer, C., Ekström, S., Meynet, G., et al. 2014, ApJS, 212, 14, doi: 10.1088/0067-0049/212/1/14
- Leitherer et al. (1999) Leitherer, C., Schaerer, D., Goldader, J. D., et al. 1999, ApJS, 123, 3, doi: 10.1086/313233
- Leroy et al. (2021) Leroy, A. K., Schinnerer, E., Hughes, A., et al. 2021, ApJS, 257, 43, doi: 10.3847/1538-4365/ac17f3
- Levesque et al. (2010) Levesque, E. M., Kewley, L. J., & Larson, K. L. 2010, AJ, 139, 712, doi: 10.1088/0004-6256/139/2/712
- Levesque & Leitherer (2013) Levesque, E. M., & Leitherer, C. 2013, ApJ, 779, 170, doi: 10.1088/0004-637X/779/2/170
- Li (2020) Li, A. 2020, Nature Astronomy, 4, 339, doi: 10.1038/s41550-020-1051-1
- Lin et al. (2020) Lin, Z., Calzetti, D., Kong, X., et al. 2020, ApJ, 896, 16, doi: 10.3847/1538-4357/ab9106
- Madden et al. (2006) Madden, S. C., Galliano, F., Jones, A. P., & Sauvage, M. 2006, A&A, 446, 877, doi: 10.1051/0004-6361:20053890
- Mallory et al. (2022) Mallory, K., Calzetti, D., & Lin, Z. 2022, ApJ, 933, 156, doi: 10.3847/1538-4357/ac7227
- Maragkoudakis et al. (2018) Maragkoudakis, A., Ivkovich, N., Peeters, E., et al. 2018, MNRAS, 481, 5370, doi: 10.1093/mnras/sty2658
- Matsuura et al. (2013) Matsuura, M., Woods, P. M., & Owen, P. J. 2013, MNRAS, 429, 2527, doi: 10.1093/mnras/sts521
- Matsuura et al. (2009) Matsuura, M., Barlow, M. J., Zijlstra, A. A., et al. 2009, MNRAS, 396, 918, doi: 10.1111/j.1365-2966.2009.14743.x
- Micelotta et al. (2010a) Micelotta, E. R., Jones, A. P., & Tielens, A. G. G. M. 2010a, A&A, 510, A36, doi: 10.1051/0004-6361/200911682
- Micelotta et al. (2010b) —. 2010b, A&A, 510, A37, doi: 10.1051/0004-6361/200911683
- Montillaud et al. (2013) Montillaud, J., Joblin, C., & Toublanc, D. 2013, A&A, 552, A15, doi: 10.1051/0004-6361/201220757
- Morisset (2013) Morisset, C. 2013, pyCloudy: Tools to manage astronomical Cloudy photoionization code. http://ascl.net/1304.020
- Oey et al. (2017) Oey, M. S., López-Hernández, J., Kellar, J. A., et al. 2017, ApJ, 844, 63, doi: 10.3847/1538-4357/aa73d3
- O’Halloran et al. (2006) O’Halloran, B., Satyapal, S., & Dudik, R. P. 2006, ApJ, 641, 795, doi: 10.1086/500529
- Osterbrock & Ferland (2006) Osterbrock, D. E., & Ferland, G. J. 2006, Astrophysics of gaseous nebulae and active galactic nuclei, 2nd edn. (University Science Books)
- Paladini et al. (2012) Paladini, R., Umana, G., Veneziani, M., et al. 2012, ApJ, 760, 149, doi: 10.1088/0004-637X/760/2/149
- Paturel et al. (2003) Paturel, G., Petit, C., Prugniel, P., et al. 2003, A&A, 412, 45, doi: 10.1051/0004-6361:20031411
- Pavlyuchenkov et al. (2013) Pavlyuchenkov, Y. N., Kirsanova, M. S., & Wiebe, D. S. 2013, Astronomy Reports, 57, 573, doi: 10.1134/S1063772913070056
- Perrin et al. (2014) Perrin, M. D., Sivaramakrishnan, A., Lajoie, C.-P., et al. 2014, in Society of Photo-Optical Instrumentation Engineers (SPIE) Conference Series, Vol. 9143, Space Telescopes and Instrumentation 2014: Optical, Infrared, and Millimeter Wave, ed. J. Oschmann, Jacobus M., M. Clampin, G. G. Fazio, & H. A. MacEwen, 91433X, doi: 10.1117/12.2056689
- Pilyugin & Grebel (2016) Pilyugin, L. S., & Grebel, E. K. 2016, MNRAS, 457, 3678, doi: 10.1093/mnras/stw238
- Povich et al. (2007) Povich, M. S., Stone, J. M., Churchwell, E., et al. 2007, ApJ, 660, 346, doi: 10.1086/513073
- Querejeta et al. (2021) Querejeta, M., Schinnerer, E., Meidt, S., et al. 2021, A&A, 656, A133, doi: 10.1051/0004-6361/202140695
- Sandstrom et al. (subm.) Sandstrom, K., et al. subm., ApJ
- Sandstrom et al. (2010) Sandstrom, K. M., Bolatto, A. D., Draine, B. T., Bot, C., & Stanimirović, S. 2010, ApJ, 715, 701, doi: 10.1088/0004-637X/715/2/701
- Santoro et al. (2022) Santoro, F., Kreckel, K., Belfiore, F., et al. 2022, A&A, 658, A188, doi: 10.1051/0004-6361/202141907
- Seok et al. (2014) Seok, J. Y., Hirashita, H., & Asano, R. S. 2014, MNRAS, 439, 2186, doi: 10.1093/mnras/stu120
- Shaya et al. (2017) Shaya, E. J., Tully, R. B., Hoffman, Y., & Pomarède, D. 2017, ApJ, 850, 207, doi: 10.3847/1538-4357/aa9525
- Smith et al. (2007) Smith, J. D. T., Draine, B. T., Dale, D. A., et al. 2007, ApJ, 656, 770, doi: 10.1086/510549
- Thilker et al. (2000) Thilker, D. A., Braun, R., & Walterbos, R. A. M. 2000, AJ, 120, 3070, doi: 10.1086/316852
- Tielens (2008) Tielens, A. G. G. M. 2008, ARA&A, 46, 289, doi: 10.1146/annurev.astro.46.060407.145211
- Whitcomb et al. (2020) Whitcomb, C. M., Sandstrom, K., Murphy, E. J., & Linden, S. 2020, ApJ, 901, 47, doi: 10.3847/1538-4357/abaef6
- Wiebe et al. (2011) Wiebe, D. S., Egorov, O. V., & Lozinskaya, T. A. 2011, Astronomy Reports, 55, 585, doi: 10.1134/S1063772911070080
- Wiebe et al. (2014) Wiebe, D. S., Khramtsova, M. S., Egorov, O. V., & Lozinskaya, T. A. 2014, Astronomy Letters, 40, 278, doi: 10.1134/S1063773714050065
- Wisnioski et al. (2012) Wisnioski, E., Glazebrook, K., Blake, C., et al. 2012, MNRAS, 422, 3339, doi: 10.1111/j.1365-2966.2012.20850.x