Low temperature magnetism of KAgF3
Abstract
KAgF3 is a quasi one-dimensional quantum antiferromagnet hosting a series of intriguing structural and magnetic transitions. Here we use powder neutron diffraction, SR spectroscopy, and Density Functional Theory calculations to elucidate the low temperature magnetic phases. Below K we find that the material orders as an A-type antiferromagnet with an ordered moment of 0.47 . Both neutrons and muons provide evidence for an intermediate phase at temperatures with K from a previous magnetometry study. However, the evidence is at the limit of detection and its nature remains an open problem.
I Introduction
Spin-1/2 systems show a profusion of fascinating phenomena due to strong quantum fluctuations, as the quantum effects in many-body systems increase when the mass and angular momentum of their constituents decrease. For example, light He remains liquid at zero temperature due to quantum fluctuations. By analogy, Anderson [1] proposed that spin-1/2 systems may form spin-liquid states at low temperatures, which lack long-range magnetic order. While at high dimension, the existence of spin-liquids is controversial [2], they certainly form in quasi-one-dimensional magnetic systems [3, 4]. The elementary excitations called spinons have been observed with a variety of probes [5, 6, 7, 8, 9, 10]. Spinons behave as Fermions and can be visualized as domain-walls of the local antiferromagnetic order. Although physical realizations of spin-1/2 systems are good correlated insulators, they can conduct heat as one-dimensional metals due to the fermionic properties of spinons [11]. Additionally, due to the Fermionic nature of excitations, spin-1/2 systems may support a spin-Peierls instability [12], the magnetic analogue of the Peierls instability in the one-dimensional electron gas.
Spin-1/2 realizations in condensed matter are represented mostly by Ti(III) or V(IV) compounds with the electronic configuration of the metal cation, and by Cu(II) systems with a electron configuration. A great diversity of the Cu(II) systems have been described in the literature with remarkable properties. For example, two-dimensional layered systems include the celebrated parent compounds [13] of high- superconductors. Their strong quantum fluctuations (unlike higher-spin systems) have been recently exposed in resonant inelastic x-ray scattering studies (RIXS) [14, 15]. \chCuGeO3 is a nice example of inorganic spin-Peierls system with a structural transition clearly linked to the magnetism [16, 17]. \chSr2CuO3 is an almost perfect realization of the one-dimensional Heisenberg model, showing an excellent example of a spinon spectra in optical properties [5, 6] and multispinon excitations in RIXS [7]. A gigantic spinon mean-free path has also been deduced from thermal transport[11]. CuO is a quasi one-dimensional spin-1/2 system with much lower symmetry than \chSr2CuO3. On lowering the temperature, it enters first into an incommensurate magnetic spiral phase and then into a commensurate antiferromagnetic phase. The incommensurate phase is also multiferroic [18]. The rich phenomenology of CuO can be understood from the intrinsic frustration built into the structure[19, 20].
The analogous heavier Ag(II) congeners are much less researched [21] but their similarities to cuprates [22, 23, 24] calls for an exploration of this family searching for analogous rich physics. KAgF3 is one of such systems which shows intriguing structural and magnetic phenomena [25].
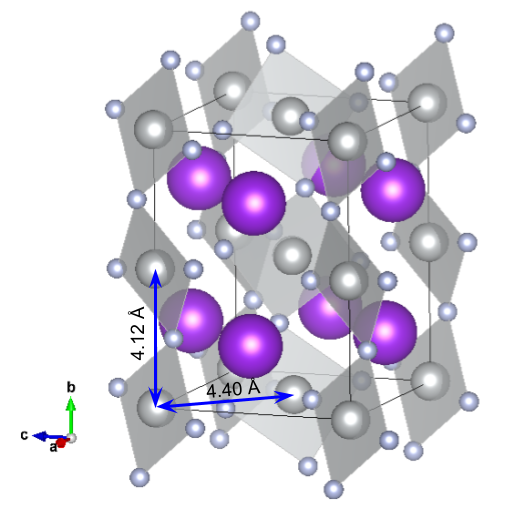
This compound crystallizes in an orthorhombic unit cell (Figure 1) which may be viewed as a distorted cubic perovskite structure. Silver-silver distances are significantly shorter along the axis, as indicated in the figure. The gray plaquettes indicate short Ag–F bonds of elongated \chAgF6 octahedra, with the long axis approximately perpendicular to the plaquette. The short Ag–Ag bond (4.12 Å) along the axis defines kinked chains which host very strong antiferromagnetic superexchange with the coupling constant of the order of meV from susceptibility measurements [25] or even larger according to DFT computations (see Refs. [26, 27, 28] and Supplementary Information). Simultaneously, the interchain interactions are much weaker and of the order of few meV. One can visualize the plaquettes as hosting Ag orbitals with approximately -symmetry, with lobes pointing towards the fluorines. These mix with -orbitals in F along the chain, providing a robust path for superexchange [22] as in \chAgF2.
A previous study [25] documented a structural transition near K, accompanied by an intriguing drop of the susceptibility on lowering the temperature, which is reminiscent of a spin-Peiers transition. Magnetic order appears at lower temperatures with two magnetic transitions at K and K, whose nature has not been explored in depth so far. DFT studies suggest predominant antiferromagnetic (AF) interactions [28, 25], thus we tentatively identify and as Néel temperatures using the notation that is common in CuO.
The present work aims at elucidating the low temperature magnetic phases of \chKAgF3 using SR spectroscopy, powder neutron diffraction, and Density Functional Theory calculations. Neutron scattering experiments were performed at ILL, and SR experiments were performed at ISIS and PSI. The continuous muon source at PSI is particularly suited for detailed measurements of the magnetic ordering, while the pulsed muon source at ISIS is better for measuring details of the entanglement between the muon and the fluorine nuclei to obtain details of the muon site.
II Sample preparation
II.1 Synthesis
Previous syntheses of KAgF3 have utilized either a direct synthesis from KF and AgF2 at elevated temperature, or a controlled thermal decomposition of a corresponding Ag(III) salt, KAgF4 [25]. The latter route is quite impractical for synthesis of a large specimen (10-20 g) which is needed for neutron studies. Therefore, we followed the former procedure while using diverse Ag precursors (AgF2, AgNO3 or KAg(CN)2). A total of eleven samples were prepared. A typical procedure consisted of firing of a well ground mixture of KF and AgF2 (usually with small molar excess of 1.05-1.15) in a nickel container (sometimes equipped with a teflon insert) at 300∘C for 9-10 days (with small excess of F2 gas or just with argon), followed by spontaneous cooling. The purity of each specimen was scrutinized using powder x-ray diffraction utilizing a laboratory x-ray source. The samples which proved to contain some unreacted AgF2 or K2AgF4 layered perovskite (which both order ferromagnetically) were discarded. Only the five samples which were crystallographically pure or which contained no more than 1 percent of diamagnetic AgF were selected for further studies. All these batches were mixed together and homogenized in a prefluorinated agate mortar.
II.2 Sample operations
Due to the exceptionally high reactivity of Ag(II) fluorides [21], the sample selected for neutron diffraction studies was placed inside a sealed vanadium container only shortly prior to measurements. Dry ice was used to cool the sample during its transportation, and the container was kept permanently in liquid nitrogen in ILL. Similarly, a small fraction of the sample (ca. 0.5-1g) from the same batch was filled into a copper container equipped with a gold O-ring, and this container was immediately chilled and transported to the relevant muon facility, where it was handled inside an argon-filled glovebox.
III Powder neutron diffraction
We performed powder neutron diffraction studies on KAgF3 to determine the magnetic structure on the powder diffractometer D20 at the Institut Laue-Langevin in Grenoble. We choose a large wavelength of and optimized the instrument for higher flux to focus on magnetic superstructure reflections. Due to the expected small moment of Ag2+ rather long counting was needed and indeed the observed magnetic Bragg peaks exhibit an intensity of only 0.4% compared to the strongest nuclear Bragg peak. Data sets were collected at ( ), (between and ) and () to cover the two magnetic transitions deduced from magnetization studies [25]. Data is available at Ref. 29 and refinements of magnetic and nuclear structure models were performed with the Fullprof program suite [30].
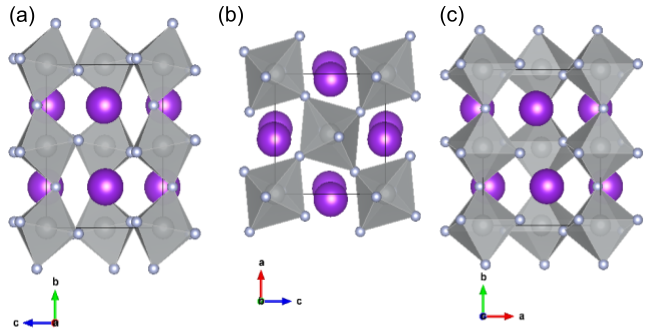
Previous powder x-ray diffraction studies on KAgF3 observed a distorted perovskite structure, which is described with spacegroup [25, 31]. Distortions with this symmetry are very common in perovskites [32], and correspond to a rotation of the octahedron around the orthorhombic axis [Fig. 2(b)], combined with tilting around nearly which is parallel to an octahedron edge [Fig. 2(a)]. In addition, there is an elongation of the octahedra along one of the bonds in the plane. This elongation rotates for neighboring sites in a layer. For example, the long bonds are oriented approximately along [101] in Fig. 2(b), for the four octahedra in the corners, and nearly along [10] for the octahedron in the center. Notice that due to the antiphase rotation of the octahedra all elongations approach the axis forming an angle of with it.
The elongation of octahedra in KAgF3 can be rationalized as originating in the Jahn-Teller distortion in the configuration and indicates an orbital order with holes alternatingly occupying and orbitals corresponding to the staggered pattern of plaquettes in Fig. 1 (notice that here long Ag-F bonds have not been drawn). This orbital ordering determines [28] the magnetic interactions as mentioned in the Introduction.
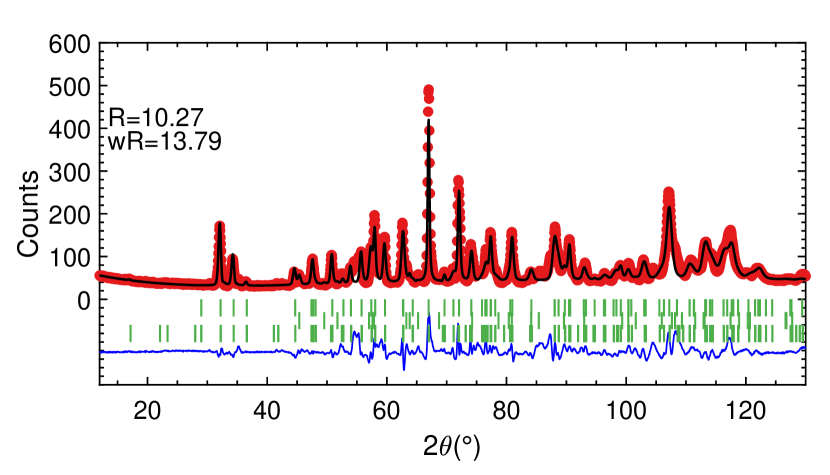
The D20 data taken at 2 K can be well described with such a structure model, as shown in Fig. 3. We apply a correction for microscopic strain and include a small impurity AgF2 phase, about 6% volume fraction. The refined lattice parameters are =6.4106(6) Å, =8.2597(7) Å, and =6.0609(6) Å and atomic positions are: Ag at (0,0,0), K at [0.043(2),0.25,0.483(2)], F1 at [0.479(2),0.25,0.5827(13)] and F2 at [0.3159(8),0.4630(7),0.2291(12)].
The main goal of the high-flux experiments at the D20 diffractometer was to determine the magnetic structure. We searched for magnetic Bragg reflections appearing below the Néel temperatures identified by the magnetization measurements. The three diffraction patterns shown in Fig. 4 exhibit very little differences, indicating that the crystal structure does not significantly change below 70 K. For most Bragg reflections and for the background the patterns perfectly superpose.
Due to the high statistics and the excellent reproducibility of the diffraction experiments, we are able to analyse the tiny changes in the diffraction patterns. In the pattern at one finds an extra peak emerging at , which exhibits an intensity of 410-3 compared to the strongest nuclear Bragg peaks. This intensity can be indexed as (0,1,0) in the lattice, which is extinct in this space group. This reflection can be explained by an -type magnetic order with ferromagnetic layers antiferromagnetically stacked along . Such a magnetic structure is expected for the antiferro-orbital ordering described above[28, 25]. Within an layer, the perpendicular orbital arrangement with alternating occupation of the and orbitals (hole picture) implies a ferromagnetic interaction that, however, should be weak. The strongest magnetic interaction is expected for the parallel orbital arrangement along due to strong hybridization. This orbital and magnetic arrangement was already proposed by X. Zhang et al. [28]. Since we observe the (0,1,0) Bragg reflection as the main magnetic Bragg peak the ordered moment must point perpendicular to which is consistent with our DFT computations (See Supplementary Information) and with the muon results to be shown below. The refinement of magnetic models cannot distinguish between alignment along or direction, but the symmetry analysis with representation theory indicates that an -type order with moments along the direction permits the occurrence of a weak ferromagnetic moment along , which is not seen in the magnetization data [25]. Therefore, only the -type order with moments along is possible. The model yields an ordered moment of assuming the Pd1+ form factor111Due to the rather small value the form factor has little impact in this case. See the supplementary information to Ref. [22] for a comparison of the \chPd1+ form factor and a DFT computation of \chAg^2+ form factors. and allows for a canting of moments with a -type and -type . For the Ag moment one may expect sizable canting but its determination is well beyond the precision of our experiment. This value of the magnetic moment agrees well with the moment determined by the SR experiments (as reported in the next section) when assuming a orientation, while for an orientation the muon analysis yields a much smaller moment. This gives further support to the conclusion that the main component of the magnetic moment in KAgF3 is parallel to .
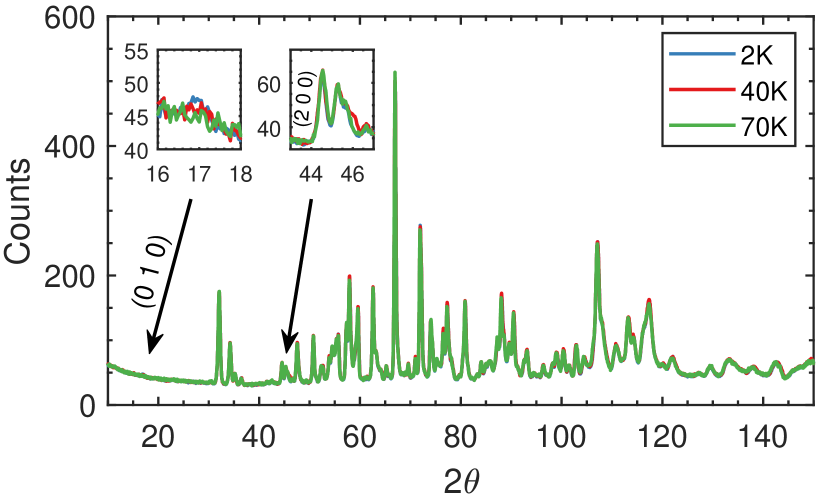
The (0,1,0) magnetic intensity is absent at 40 K (see Fig. 4) consistent with the lower magnetic transition observed in the susceptibility at K [25]. In the data at 40 K however, there is extra intensity at that is not visible neither in the nor in the data. Note that the higher magnetic transition is found at in the magnetization. This intensity can be indexed as (1.3,1,1.3) but with the single magnetic reflection the magnetic structure cannot be determined. Possibly this magnetic structure not only differs in the propagation vector but also in the direction of the ordered moment. A tempting possibility would be a spiral, possibly commensurate magnetic structure at (1/3,0,1/3). Notice that in this case, the canting of adjacent moments would occur along small- bonds. Indeed, our DFT computations lead to a very small cost of the spiral (see Supplementary Information). Thus, it is plausibly that the small energetic penalty of forming the spiral is overcome by entropic effects. Such intermediate spiral phases are common in frustrated systems, for example in the multiferroic phase of CuO[18, 19, 20]. Here, such a possibility would make \chKAgF3 an analogue of CuO, perhaps with multiferroic properties.
In the next Section, we will report on the magnetic phases from the point of view of SR spectroscopy. This will provide further information on the magnetic phases. The SR experiment, however, does not find evidence for magnetic order at this temperature range. This discrepancy requires further analysis.
IV SR Results and Analysis
SR spectroscopy is an excellent technique to detect local magnetic environments: in this technique, positive muons are implanted in the sample, and stop somewhere in the crystal [34]. Hence, muons act as local magnetometers, so for a fully quantitative analysis of SR data it is important to determine the stopping site. To this aim we have performed ab initio DFT+ calculations [35, 36], which we report now.
IV.1 Muon Site Calculations
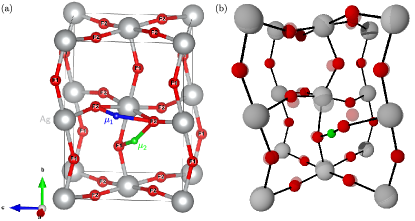
The DFT+ calculations resulted in two possible sites, which are shown in Table 1, with all other sites discounted due to having an energy far above these. These two candidate muon sites are depicted in Figure 5(a). As is usually the case for muons implanting in fluoride samples, DFT+ predicts that the muon will draw in the two nearest fluorines towards it for both sites. Although DFT often struggles to calculate the extent of these distortions to a high accuracy, we estimate that for site 1 the nearest-neighbour fluorine goes from being 1.35 Å from the muon to 1.09 Å, and for site 2 the nearest-neighbour moves from 1.82 Å to 1.05 Å, and we expect these bond-length estimates to be correct to within 0.1–0.2 Å. These large lattice distortions have been observed in other fluorides and are attributed to the formation of so called “strong” hydrogen-like bonds [37, 38, 39, 40] analogous to the ones in HF ions [41]. Figure 5(b) shows the extent of these lattice distortions in site 2 (site 1 has similar distortions, but this site is inconsistent with the data, which we will discuss later).
| Site | Position (fractional coordinates) | Energy (meV) |
|---|---|---|
| 1 | 0 | |
| 2 | 123 |
IV.2 : Measuring the collinear magnetic order
The sample was contained in a Cu sample holder and placed in the GPS spectrometer at PSI. Data from this experiment is shown in Figure 6(a), and show a clear oscillatory feature at short timescales which is very heavily damped, and this remains present up to around 31 K. Above 31 K, no oscillations due to magnetic ordering were observed in the muon asymmetry.

Some muons were found to stop in the Cu sample holder, which creates a Kubo-Toyabe component in the muon asymmetry [42, 43], which was modelled by the function
| (1) |
where is the standard deviation of the internal fields at the muon site in the Cu, is the amplitude of the asymmetry due to muons stopping in the sample holder, and is a phenomenological parameter to model muon diffusion. For the data, these parameters were found to be µs-1, , and µs-1, and this function was subtracted from the data for all subsequent analysis.
The data, with the Cu background subtracted, were fitted with the function
| (2) |
where each component usually represents muons stopped in different sites in the sample, precessing in their local magnetic fields (, with MHz T-1), with a relaxation due to field fluctuations caused by spin dynamics and inhomogenities [34]. Many of these fitting parameters were found to be constant throughout the range of the temperatures studied. Therefore, they were fixed to the following values: , , , , MHz, and µs-1. After initially being allowed to vary, it was found that the ratio between the frequencies and was constant at , and was also fixed for the subsequent analysis. The values of the parameters which were allowed to vary are plotted in Figure 6(b). The oscillations with amplitudes and are clearly due to muons stopping in the KAgF3 sample, and we will discuss the origin of these in Section IV.4. As the term exhibits no order parameter-like behaviour, it can be assumed to be due to a muon stopping in an impurity in the sample, the frequency of which is consistent with precession in a very small magnetic field, or indeed it may be due the muon becoming entangled with fluoride impurities leading to very low amplitude F––F oscillations 222See the supplemental information for a discussion of these states, which contains Refs. [52, 34, 39, 40].. The temperature dependence of and is very unusual and is a significant point we will return to later.
The values were fitted to the phenomenological fitting function
| (3) |
to model the critical behaviour of the low temperature phase. The fitting parameters obtained were K, MHz, and . The critical temperature is slightly lower than the 35 K measured by magnetic susceptibility [25], but this is consistent with what was measured at ISIS (see next section and the Supplemental Information). The value of characterises the critical behaviour of the sample, and is consistent with the value one would expect from a 3D Ising-like system (which predicts ), though the number of data points in the critical regime is very low and so this should only be taken as a crude estimate. This result suggests an easy axis anisotropy, which is indeed confirmed by the DFT computations reported below.
IV.3 : Muon–fluorine entangled states
The sample was also placed in the MuSR spectrometer at the STFC-ISIS muon facility, Rutherford Appleton Laboratory, UK. Below the transition temperature, it was possible to observe characteristic signs of magnetic ordering, but it was not possible to resolve these with the time resolution of the spectrometer 333The ISIS data for are shown in the Supplemental Information. Above the transition temperature, the characteristic oscillations expected from muon–fluorine entanglement were observed [37, 38, 39, 40].
Therefore, the muon asymmetry data for temperatures above were fitted to the function
| (4) |
where the first term represents muons stopped in the KAgF3 crystal and evolving due to the entanglement between itself and the surrounding fluoride nuclei, which is calculated as described in the Supplemental Information. This function has the fitting parameters and to represent the distance from the muon to the closest and next-closest nearest neighbour fluorides respectively ( to the nearest F2 and F1 in Figure 5 respectively), and is the distance from the muon to the nearest-neighbour Ag ion. The second term represents muons stopped in the Cu sample holder, and the final term represents muons stopped elsewhere but not undergoing any precession or relaxation which is measurable. The Cu sample holder again produces a Kubo-Toyabe background, which was modelled by the dynamical Kubo-Toyabe function as described by Kadono et al. [42] using the strong collision model to model the dynamics, so 444Using the more rigorous strong collision model to model the dynamics was not for the PSI data, as the the dynamics only affect the data at long times and at higher temperatures.,
| (5) |
with
| (6) |
We found that calculating for both the sites found with DFT+ in Table 1 produced a very similar result, meaning that the two muon sites were indistinguishable with the ISIS data. However, the careful analysis of the dipole fields of both sites and the comparison of this to the PSI data (as discussed in Section IV.4), shows that the only site which is realised by the muon is site 2.
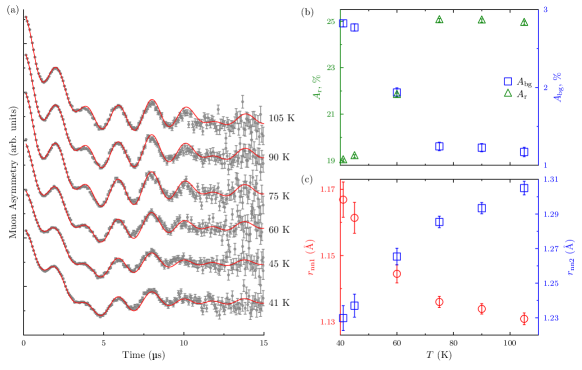
The fits to Equation (4) are shown in Figure 7a and the fitting parameters obtained are plotted in Figure 7b and c. Figure 7a demonstrates the impressive agreement between the model and the data up to 105 K (muon diffusion occurs at very high temperatures and this is outside the scope of our model). The change in and is somewhat unusual, suggesting some sort of phase transition between 50 and 70 K, perhaps related to the susceptibility anomaly [25] at and giving further support for the existence of an intermediate magnetic phase. Unfortunately, there is insufficient muon data in this temperature range to be able to determine the cause of this. Yet, it is important to note that as F––F states are highly suppressed by magnetic fields (since the field at the muon site due to the ordering of the electronic moments tends to be much larger than that due to the nuclear moments).
The fits also show that the F––F complex changes slightly with temperature, with a change in bond length of around 0.08 Å across the whole temperature range. This is likely to be due to the way in which the entire structure of the crystal changes with temperature, as has been reported previously [25]. The DFT+ results show that the two nearest neighbour fluorines are Åand Å, which are close to the values measured here. Additionally, the –Ag distance varied very little with temperature, and was found to be Å, very close to the value of 2.35 Å calculated with DFT.
IV.4 Calculation of the Ag magnetic moment with SR
A muon implanted in a sample precessses in its local magnetic field due to the Zeeman interaction. Assuming that the only origin of this field in KAgF3 is due to the dipolar field of the surrounding magnetic moments , the local field of the muon can be calculated as
| (7) |
where the sum is over the surrounding Ag ions with a magnetic moment at a distance from the muon. This sum is taken over a large Lorentz sphere of radius 150 Å, and as the material is antiferromagnetic the lack of bulk magnetization means no additional term is required to account for moments beyond this.
One can then use Equation (7) to calculate the dipole fields at both the muon sites predicted by DFT, assuming ferromagnetically ordered moments in the plane and antiferromagnetic along , with all moments constrained to point in the direction, as predicted by our DFT calculations of the magnetic structure reported in the Supplemental Information. From this, assuming the moment of the Ag ions , the field at the muon site would be 643 Gauss for site 1, and 260 Gauss for site 2, leading to muon precession frequencies of around 8.7 MHz and 3.5 MHz respectively. In accord with the analysis of Sec. IV.2, the precession frequency of site 2 is significantly closer to that measured, and therefore we will assume that this is the correct muon site for the rest of the analysis. As the distance between the muon and the nearest Ag ion was found to be 2.33(6) Å by fitting the ISIS data, the moment on the Ag ion can be determined. Again using the dipole field calculations, the moment on the Ag ions is calculated as , in excellent agreement to the value determined with neutrons (Sec. III) and slightly smaller than the value of predicted by our DFT results (see the Supplemental Information). Such an overestimation is not surprising, as is common[47, 48] to other mean-field like approaches that neglect transverse quantum fluctuations.
Other valid potential magnetic structures for this compound have the moments aligned along the direction, and in any other direction along the plane. If the spins are aligned along , following the same calculation as above results in an Ag electronic moment of , which is significantly smaller than the moment calculated both from the neutron data and by the DFT calculations, and is therefore an unlikely magnetic structure. If the moments are aligned along an intermediate direction in the plane, one would expect the muon data to have two frequencies with an equal magnitude (owing to the site symmetry), which is not realised in the data (although it is important to note that the measured muon precession at this frequency relaxes very quickly, so moments pointing in an intermediate direction cannot conclusively be ruled out).
IV.5 Origin of the two frequencies in the PSI data
As discussed in Section IV.2, the PSI data show two oscillations with frequencies and which follow the same order parameter. The two frequencies could be associated with two distinct muon sites, but the temperature-dependent nature of the amplitudes and shown in Figure 6(b), together with the single site assumed for fitting the F––F oscillations (which works so well, as shown in Figure 7(a) point instead to a different interpretation. We propose that the origin of the second oscillation is due to the effect of the nearest-neighbour fluorine nucleus precessing in its own local magnetic field resulting from the ordered Ag2+ electronic moments, which then affects the state of the muon. One can picture this by considering both the muon and fluorine to be classical dipoles in a magnetic field. Before the muon implantation, the fluorine nuclear spin is in a fully mixed state. But once the polarised muon is implanted and the lattice distorted, the fluorine becomes slightly polarised by the muon, and the field at the fluorine is modified due to the strong lattice distortion. Hence, the fluorine and muon both undergo Larmor precession in the field produced by the ordered Ag2+ moments, but the dipole-dipole interaction between them creates a field at the muon site that depends on the orientation of the nuclear spin of the fluorine with respect to the local field direction at the fluorine site. The field at the nearest-neighbour fluorine site (assuming the magnetic structure of KAgF3 described above) is calculated as 347 Gauss, which is larger than that of the muon (235 Gauss), and points in a different direction.
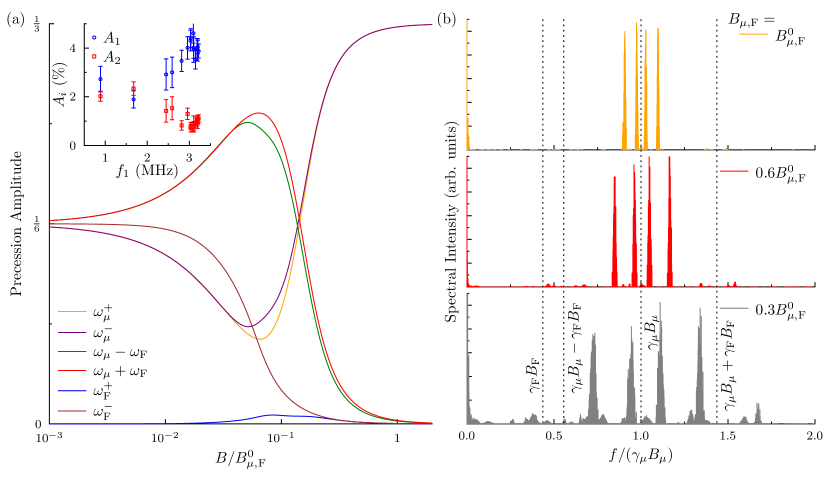
In order to model the two frequencies, one can calculate the expected amplitudes and frequencies of the muon polarization using the Hamiltonian in the Supplemental information, for the case of a system with a muon and one fluorine (the other fluorine is further away, so does not have such a large effect). This produces the precession frequencies (for a large magnetic field) of
where and are the splittings due to the dipole-dipole coupling between the muon and the fluorine, which depends on the geometry of the F– bond with respect to the magnetic fields, and is around for this case ( Mrad s-1 from the ISIS data for this geometry). The amplitude of the signals corresponding to these states is plotted in Figure 8(a), for the field at the muon and fluorine sites, scaled by various amounts. This shows that, when the fields at the muon and fluorine sites are very large, the only precession frequencies observable are due to the muon precessing at its Larmor frequency. However, for the relatively small fields seen in KAgF3, the figure shows that the and terms increase as the magnetic fields decrease, which occurs when the temperature approaches the transition.
The inset to Figure 8(a) shows how the amplitudes of the two components and vary with the precession frequency . This shows a clear trend of decreasing as increases, which is consistent with this model, despite the effect being more pronounced in the data as one would expect from the theory. Expanding this model to consider also the next-nearest neighbour interactions, the amplitudes of these oscillations change slightly, as shown in Figure 8(b). This shows the Fourier components of the expected muon polarization, showing peaks close to many of the frequencies of the F– case (but many of these are broadened out by the next-nearest neighbour dipole-dipole interactions making them very small). Decreasing the field further, it can be seen that the peaks just below around 50 % of the muon Larmor frequency start to emerge, which is broadly consistent with the ratio found previously.
V Conclusions
| Compound | TN | J1D | Jperp | TN/J1D | -Jperp/J1D |
|---|---|---|---|---|---|
| KCuF3 | 39 | 406 | -21 | 9.6 x | 5.2 x |
| KAgF3 | 29.3 | 1160 | -13.5 | 2.5 x | 1.2 x |
The combined powder neutron diffraction and muon spin rotation studies as well as theoretical DFT calculations on KAgF3 allowed us to unequivocally determine the magnetic ground state of this compound as an ordered A-type antiferromagnet with a Néel temperature K. This is close to the temperature of 35 K, where an anomaly was found in the susceptibility data [25]. In Ref. [25], another anomaly was reported at K, so it is natural to ask if there is an intermediate magnetically ordered phase between and . Neutron diffraction experiments provide evidence for an incommensurate phase in this temperature region, however the signal is rather weak and insufficient to determine the magnetic structure. A strong temperature dependence of a background contribution in the analysis of the muon data suggest some kind of phase transition in the same temperature range. On the other hand, there is no evidence of static moments, even with an incommensurate arrangement, as would be suggested by the neutrons. Therefore, the possibility of an intermediate magnetic phase between the ground state and the disordered paramagnet, analogous to CuO [18], remains an open problem. Another interesting open problem is the origin of the structural transitions near K and the relationship between this with the magnetic ordering, if any. A detailed structural study is under way to solve this issue.
It is interesting to compare the present results with \chKCuF3. Following Yasuda et al.[50], we may now determine the value of Jperp, which turns out to amount to K (as shown in Table 2). From our DFT computations we estimate a value of meV ( 2000 K) and taking an effective ( 50 K) meV (obtained by averaging over calculated interchain exchange interactions, see Supplementary Information) we obtain , of the same order of magnitude as the experimental one. The theoretical appears somewhat larger than the experimental result and previous DFT studies[28, 25], probably because of details on the functional used. We notice, however, that even if we plug the calculated in the formula of Yasuda et al.[50], we get K, with a marginal impact on the ratio . Therefore, KAgF3 seems to exhibit a ca. four times larger bond anisotropy in inter- and intra-chain exchange interactions than its Cu analogue, which is manifested in a smaller TN value for the former, and the J1D being at least 3-times larger for the Ag than for the Cu compound.
VI Acknowledgements
Research was carried out with the use of CePT infrastructure financed by the European Union - the European Regional Development Fund within the Operational Programme “Innovative economy” for 2007-2013 (No. POIG.02.02.00-14-024/08-00). The Polish authors are grateful to NCN for support (Maestro, No. 2017/26/A/ST5/00570). The Italian authors acknowledge financial support from the Italian MIUR through Projects No. PRIN 2017Z8TS5B and 20207ZXT4Z. The Slovenian authors acknowledge the financial support of the Slovenian Research Agency (research core funding No. P1-0045; Inorganic Chemistry and Technology). The German authors acknowledge funding by the Deutsche Forschungsgemeinschaft (DFG, German Research Foundation) Project No. 277146847 - CRC 1238, Project B04. W.G. is grateful to the Interdisciplinary Center for Mathematical and Computational Modelling, University of Warsaw, for the availability of high performance computing resources (okeanos, topola) within the projects No. G29-3 and GA83-34. The muon data for were taken at the Swiss Muon Source, PSI, Switzerland, and J. M. W. and S. J. B. would like to thank Chennan Wang for running the experiment. The muon data for were taken at the ISIS Neutron and Muon Source, UK, and we would like to thank Francis Pratt for his assistance [51]. The DFT+ calculations were done both on the Redwood cluster at the University of Oxford with the assistance of Jonathan Patterson, and also using the STFC’s SCARF cluster.
References
- Anderson [1973] P. W. Anderson, Materials Research Bulletin 8, 153 (1973).
- Sorella et al. [2012] S. Sorella, Y. Otsuka, and S. Yunoki, Sci. Rep. 2, 992 (2012), arXiv:1207.1783 .
- Dutton et al. [2012] S. E. Dutton, M. Kumar, M. Mourigal, Z. G. Soos, J.-J. Wen, C. L. Broholm, N. H. Andersen, Q. Huang, M. Zbiri, R. Toft-Petersen, and R. J. Cava, Phys. Rev. Lett. 108, 187206 (2012).
- Savary and Balents [2016] L. Savary and L. Balents, Rep. Prog. Phys. 80, 016502 (2016).
- Suzuura et al. [1996] H. Suzuura, H. Yasuhara, A. Furusaki, N. Nagaosa, and Y. Tokura, Phys. Rev. Lett. 76, 2579 (1996).
- Lorenzana and Eder [1997] J. Lorenzana and R. Eder, Phys. Rev. B-Condensed Matter 55, R3358 (1997).
- Schlappa et al. [2018] J. Schlappa, U. Kumar, K. J. Zhou, S. Singh, M. Mourigal, V. N. Strocov, A. Revcolevschi, L. Patthey, H. M. Rønnow, S. Johnston, and T. Schmitt, Nature Communications 2018 9:1 9, 1 (2018).
- Enderle et al. [2010] M. Enderle, B. Fåk, H. J. Mikeska, R. K. Kremer, A. Prokofiev, and W. Assmus, Physical Review Letters 104, 237207 (2010).
- Lake et al. [2013] B. Lake, D. A. Tennant, J. S. Caux, T. Barthel, U. Schollwöck, S. E. Nagler, and C. D. Frost, Physical Review Letters 111, 137205 (2013).
- Mourigal et al. [2013] M. Mourigal, M. Enderle, A. Klöpperpieper, J. S. Caux, A. Stunault, and H. M. Rønnow, Nature Physics 2013 9:7 9, 435 (2013).
- Hess [2019] C. Hess, Phys. Rep. 811, 1 (2019), arXiv:1805.01746 .
- Giamarchi [2004] T. Giamarchi, Quantum Physics in One Dimension (International Series of Monographs on Physics) (Oxford University Press, USA, Oxford, 2004).
- Kastner et al. [1998] M. A. Kastner, R. J. Birgeneau, G. Shirane, and Y. Endoh, Rev. Mod. Phys. 70, 897 (1998).
- Betto et al. [2021] D. Betto, R. Fumagalli, L. Martinelli, M. Rossi, R. Piombo, K. Yoshimi, D. Di Castro, E. Di Gennaro, A. Sambri, D. Bonn, et al., Physical Review B 103, L140409 (2021).
- Martinelli et al. [2022] L. Martinelli, D. Betto, K. Kummer, R. Arpaia, L. Braicovich, D. Di Castro, N. B. Brookes, M. M. Sala, and G. Ghiringhelli, Physical Review X 12, 021041 (2022).
- Hase et al. [1993] M. Hase, I. Terasaki, and K. Uchinokura, Phys. Rev. Lett. 70, 3651 (1993).
- Braden et al. [1996] M. Braden, G. Wilkendorf, J. Lorenzana, M. Aïn, G. McIntyre, M. Behruzi, G. Heger, G. Dhalenne, and A. Revcolevschi, Phys. Rev. B 54, 1105 (1996).
- Kimura et al. [2008] T. Kimura, Y. Sekio, H. Nakamura, T. Siegrist, and a. P. Ramirez, Nat. Mater. 7, 291 (2008).
- Giovannetti et al. [2011] G. Giovannetti, S. Kumar, A. Stroppa, J. van den Brink, S. Picozzi, and J. Lorenzana, Phys. Rev. Lett. 106, 026401 (2011), arXiv:1007.3220 .
- Hellsvik et al. [2014] J. Hellsvik, M. Balestieri, T. Usui, A. Stroppa, A. Bergman, L. Bergqvist, D. Prabhakaran, O. Eriksson, S. Picozzi, T. Kimura, and J. Lorenzana, Phys. Rev. B - Condens. Matter Mater. Phys. 90, 014437 (2014).
- Grochala and Hoffmann [2001] W. Grochala and R. Hoffmann, Angew. Chemie - Int. Ed. 40, 2743 (2001).
- Gawraczyński et al. [2019] J. Gawraczyński, D. Kurzydłowski, R. A. Ewings, S. Bandaru, W. Gadomski, Z. Mazej, G. Ruani, I. Bergenti, T. Jaroń, A. Ozarowski, S. Hill, P. J. Leszczyński, K. Tokár, M. Derzsi, P. Barone, K. Wohlfeld, J. Lorenzana, and W. Grochala, Proc. Natl. Acad. Sci. U. S. A. 116, 1495 (2019), arXiv:1804.00329 .
- Bachar et al. [2022] N. Bachar, K. Koteras, J. Gawraczynski, W. Trzciński, J. Paszula, R. Piombo, P. Barone, Z. Mazej, G. Ghiringhelli, A. Nag, K.-j. Zhou, J. Lorenzana, D. van der Marel, and W. Grochala, Phys. Rev. Res. 4, 023108 (2022), arXiv:2105.08862 .
- Piombo et al. [2022] R. Piombo, D. Jezierski, H. P. Martins, T. Jaroń, M. N. Gastiasoro, P. Barone, K. Tokár, P. Piekarz, M. Derzsi, Z. Mazej, M. Abbate, W. Grochala, and J. Lorenzana, Phys. Rev. B 106, 035142 (2022).
- Kurzydłowski et al. [2013] D. Kurzydłowski, Z. Mazej, Z. Jagličić, Y. Filinchuke, and W. Grochala, Chem. Commun. 49, 6262 (2013).
- Kurzydłowski and Grochala [2017a] D. Kurzydłowski and W. Grochala, Angew. Chemie Int. Ed. 56, 10114 (2017a).
- Kurzydłowski and Grochala [2017b] D. Kurzydłowski and W. Grochala, Phys. Rev. B 96, 155140 (2017b), arXiv:1704.08902 .
- Zhang et al. [2011] X. Zhang, G. Zhang, T. Jia, Y. Guo, Z. Zeng, and H. Q. Lin, Phys. Lett. A 375, 2456 (2011).
- Grochala et al. [2019] W. Grochala, S. Biesenkamp, M. Braden, T. Hansen, K. Koteras, and J. Lorenzana, (2019), Spin-Peierls transitions and magnetic ordering in KAgF3. Institut Laue-Langevin (ILL) doi:10.5291/ILL-DATA.5-31-2635.
- Rodríguez-Carvajal [1993] J. Rodríguez-Carvajal, Physica B: Condensed Matter 192, 55 (1993).
- Mazej et al. [2009] Z. Mazej, E. Goreshnik, Z. Jagličić, B. Gaweł, W. Łasocha, D. Grzybowska, T. Jaroń, D. Kurzydłowski, P. Malinowski, W. Koźminski, J. Szydłowska, P. Leszczyński, and W. Grochala, CrystEngComm 11, 1702 (2009).
- Zhou and Goodenough [2005] J.-S. Zhou and J. B. Goodenough, Phys. Rev. Lett. 94, 065501 (2005).
- Note [1] Due to the rather small value the form factor has little impact in this case. See the supplementary information to Ref. [22] for a comparison of the \chPd1+ form factor and a DFT computation of \chAg^2+ form factors.
- Blundell et al. [2022] S. J. Blundell, R. De Renzi, T. Lancaster, and F. L. Pratt, eds., Introduction to Muon Spectroscopy (Oxford University Press, Oxford, 2022).
- Möller et al. [2013] J. S. Möller, D. Ceresoli, T. Lancaster, N. Marzari, and S. J. Blundell, Phys. Rev. B 87, 121108 (2013).
- Bernardini et al. [2013] F. Bernardini, P. Bonfà, S. Massidda, and R. De Renzi, Phys. Rev. B 87, 115148 (2013).
- Brewer et al. [1986] J. H. Brewer, S. R. Kreitzman, D. R. Noakes, E. J. Ansaldo, D. R. Harshman, and R. Keitel, Phys. Rev. B 33, 7813 (1986).
- Noakes et al. [1993] D. R. Noakes, E. J. Ansaldo, S. R. Kreitzman, and G. M. Luke, J. Phys. Chem. Solids 54, 785 (1993).
- Wilkinson and Blundell [2020] J. M. Wilkinson and S. J. Blundell, Phys. Rev. Lett. 125, 087201 (2020).
- Wilkinson et al. [2021] J. M. Wilkinson, F. L. Pratt, T. Lancaster, P. J. Baker, and S. J. Blundell, Phys. Rev. B 104, L220409 (2021).
- Emsley and Bonds [1968] B. J. Emsley and S. H. Bonds, Chem. Soc. Rev. 9, 91 (1968).
- Kadono et al. [1989] R. Kadono, J. Imazato, T. Matsuzaki, K. Nishiyama, K. Nagamine, T. Yamazaki, D. Richter, and J.-M. Welter, Phys. Rev. B 39, 23 (1989).
- Luke et al. [1991] G. M. Luke, J. H. Brewer, S. R. Kreitzman, D. R. Noakes, M. Celio, R. Kadono, and E. J. Ansaldo, Phys. Rev. B 43, 3284 (1991).
- Note [2] See the supplemental information for a discussion of these states, which contains Refs. [52, 34, 39, 40].
- Note [3] The ISIS data for are shown in the Supplemental Information.
- Note [4] Using the more rigorous strong collision model to model the dynamics was not for the PSI data, as the the dynamics only affect the data at long times and at higher temperatures.
- Hirsch and Tang [1989] J. E. Hirsch and S. Tang, Phys. Rev. Lett. 62, 591 (1989).
- Lorenzana et al. [2005] J. Lorenzana, G. Seibold, and R. Coldea, Phys. Rev. B - Condens. Matter Mater. Phys. 72, 224511 (2005).
- de Pinho Ribeiro Moreira and Illas [1999] I. de Pinho Ribeiro Moreira and F. Illas, Phys. Rev. B - Condens. Matter Mater. Phys. 60, 5179 (1999).
- Yasuda et al. [2005] C. Yasuda, S. Todo, K. Hukushima, F. Alet, M. Keller, M. Troyer, and H. Takayama, Phys. Rev. Lett. 94, 5 (2005), arXiv:0312392 [cond-mat] .
- [51] Data will be made available at doi:10.5286/ISIS.E.RB2010120-1.
- Cox [1987] S. F. J. Cox, J. Phys. C: Solid State Phys. 20, 3187 (1987).