Scale invariance in X-ray flares of gamma-ray bursts
Abstract
X-ray flares are generally believed to be produced by the reactivation of the central engine, and may have the same energy dissipation mechanism as the prompt emission of gamma-ray bursts (GRBs). X-ray flares can therefore provide important clues to understanding the nature of the central engines of GRBs. In this work, we study for the first time the physical connection between differential size and return distributions of X-ray flares of GRBs with known redshifts. We find that the differential distributions of duration, energy, and waiting time can be well fitted by a power-law function. In particular, the distributions for the differences of durations, energies, and waiting times at different times (i.e., the return distributions) well follow a -Gaussian form. The values in the -Gaussian distributions remain nearly steady for different temporal interval scales, implying a scale-invariant structure of GRB X-ray flares. Moreover, we verify that the parameters are related to the power-law indices of the differential size distributions, characterized as . These statistical features can be well explained within the physical framework of a self-organizing criticality system.
pacs:
05.65.+b, 98.70.Rz, 05.45.TpI Introduction
X-ray flares are one of the most intriguing phenomena in the afterglow phase of gamma-ray bursts (GRBs) in the Swift era (Burrows et al., 2005; Nousek et al., 2006; Zhang et al., 2006; Chincarini et al., 2007; Falcone et al., 2007; Chincarini et al., 2010; Margutti et al., 2011; Bernardini et al., 2011). Nearly one third of Swift GRBs have remarkable X-ray flares with rapid rise and fall times (Chincarini et al., 2007; Falcone et al., 2007). Unexpected X-ray flares with an isotropic-equivalent energy release from to ergs have been observed in both long and short GRBs (Campana et al., 2006; Falcone et al., 2006; Romano et al., 2006; Margutti et al., 2011). They typically occur at a few seconds to seconds after the GRB trigger (Bernardini et al., 2011). By studying the temporal behaviors and spectral properties, there is a general agreement that X-ray flares are produced by late central engine activities, and may share the same physical origin with the prompt emission of GRBs (Burrows et al., 2005; Mészáros, 2006; Zhang, 2007).
The concept of self-organized criticality (SOC) (Katz, 1986; Bak et al., 1987) has been widely applied to explain the dynamical behaviors of astrophysics systems (Aschwanden et al., 2016). A generalized definition of SOC is a critical state of a nonlinear dissipation system that is continuously and slowly driven towards a critical value of a system-wide instability threshold, resulting in scale-free, fractal-diffusive, and intermittent avalanches with power-law-like size distributions (Aschwanden, 2014). Thus, the emergence of scale-free power-law size distributions is the fundamental property that SOC systems have in common (Aschwanden, 2011, 2012, 2015). Interestingly, Ref. Wang and Dai (2013) compared the statistical properties of 83 GRB X-ray flares and 11,597 solar hard X-ray flares from RHESSI during 2002-2007. They found that the differential distributions of energy and duration for GRB X-ray flares exhibit power-law tails similar to those of solar flares, but with different power-law indices. Although the power-law indices for both classes of flares are apparently different, Ref. Wang and Dai (2013) suggested that these statistical properties can be well understood with the framework of fractal-diffusive SOC systems (footnote1, ). The solar-flare-like behavior also indicates that GRB X-ray flares may be driven by magnetic reconnection processes (footnote2, ). Some theoretical models have indeed argued that GRB X-ray flares could be magnetically dominated explosive events (Dai et al., 2006; Metzger et al., 2011; Proga and Zhang, 2006).
It was proposed that another SOC hallmark is the scale invariance of the avalanche size differences (Caruso et al., 2007; Wang et al., 2015). Ref. Caruso et al. (2007) showed that when criticality appears, the probability density functions (PDFs) for the avalanche size differences at different times have the shape of -Gaussian. Moreover, such a -Gaussian form does not depend on the time interval adopted for the avalanche size difference, and it is rightly so when considering energy differences between real earthquakes (Caruso et al., 2007). That is, the values in -Gaussian distributions are nearly equal for different scale intervals, implying a scale-invariant structure of earthquakes (see also Wang et al. (2015)). Ref. Chang et al. (2017) found that the soft gamma repeater (SGR) J1550–5418 has the property of scale invariance similar to that of earthquakes. Ref. Wei et al. (2021) further confirmed that the PDFs of the differences of fluences, fluxes, and durations for other SGRs (i.e., SGR 1806–20 and SGR J1935+2154) also exhibit a common -Gaussian distribution at different scale intervals, which indicates that there is a common scale-invariant property in SGRs (see also Sang and Lin (2022)). Ref. Lin and Sang (2020) analyzed 93 bursts from the repeating fast radio burst (FRB) 121102 in a continuous observation by the Green Bank Telescope, and showed that FRB 121102 has a similar scale-invariant behavior. Very recently, the detection of 1652 independent bursts from FRB 121102 using the Five-hundred-meter Aperture Spherical radio Telescope has been reported (Li et al., 2021). Based on this largest burst sample, Ref. Wei et al. (2021) suggested that scale invariance in both FRB 121102 and SGRs can be explained with the physical framework of fractal-diffusive SOC systems.
Besides the power-law distribution of the avalanche size, the -Gaussian distribution of the avalanche size differences at different times (i.e., the scale-invariant structure) provides a new powerful way for characterizing the presence of SOC (Caruso et al., 2007). Although power-law size distributions have been found in GRB X-ray flares (Wang and Dai, 2013), their scale-invariant property has not yet been explored. On the other hand, a theoretical relation between the power-law index of the avalanche size distribution and the value of the appropriate -Gaussian has been proposed (Caruso et al., 2007; Celikoglu et al., 2010). Taking advantage of this relation, one can easily estimate parameter values of the appropriate -Gaussians a priori from the known power-law indices of the system. In this work, we study for the first time the scale-invariant behaviors of GRB X-ray flares, and then test the validity of the proposed relation between the values of and using real data.
The rest of the paper is arranged as follows. The differential distributions of duration, energy, and waiting time of GRB X-ray flares are shown in Section II. In Section III, for the first time, we calculate the cumulative distributions of the differences of these three quantities and investigate the scale-invariant property. The evidence that may shed light on the theoretical – relation is presented in Section IV. Lastly, discussions and conclusions are given in Section V.
II Power-law Size Distributions of GRB X-ray Flares
Recently, Ref. Yi et al. (2016) presented a catalog of GRB X-ray flares observed by Swift between 2005 April and 2015 March. A total of 200 X-ray flares of GRBs with known redshifts are reported in this catalog, representing the largest sample at present. The catalog contains the start time , end time , and fluence of each flare. In this work, we use this sample to study the statistical properties of the energy release, duration, and waiting-time distributions of GRB X-ray flares. The isotropic energy of each flare in the 0.3–10 keV energy band can be calculated by , where is the redshift and is the luminosity distance calculated for a flat CDM cosmological model with km s-1 Mpc-1, , and (Planck Collaboration et al., 2020). The flare duration in the source frame can be obtained by , where accounts for the relativistic time dilation factor. The waiting time in the source frame can be estimated by , where and are the observed start times of the -th and -th flares, respectively. For the first flare appearing in a GRB, the source-frame waiting time is taken to be .
Power-law-like size distributions are ubiquitous in astrophysical instabilities (Aschwanden, 2015). That is, the differential size distribution of extreme events can be well described with a power-law function,
| (1) |
where is the power-law index. Here we explore the differential distributions of duration, energy, and waiting time for GRB X-ray flares, and then fit them with the power-law model. We apply a uniformly logarithmic binning to the data for the differential distributions. Empirically, the number of bins is set to be , where and are the minimum and maximum values of the sampled data, respectively (Aschwanden, 2015). The counted number of events per (logarithmic) bin is , while the resulting differential distribution is determined by dividing with the (non-equidistant) bin width , so that . The expected uncertainty of the differential distribution is then
| (2) |
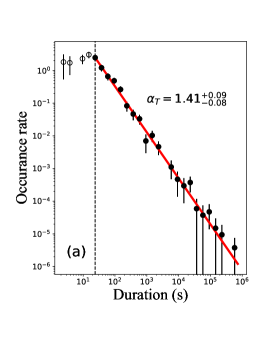
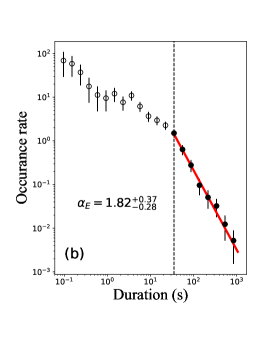
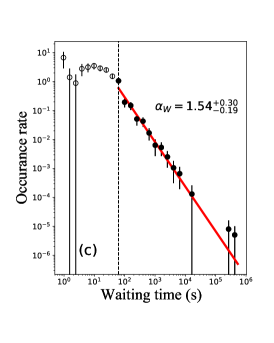
As shown in Figure 1, due to incomplete sampling of the smallest events, the observed differential distribution often deviates from an ideal power law at the lower end. It is therefore necessary to find a lower bound or threshold that defines an upper range [, ] where events are completely sampled and a power-law fit can be performed. A reliable threshold can be obtained from the bin where the counted number of events per bin has a maximum, i.e., (Aschwanden, 2015). The determined threshold values of the differential distributions of duration, energy, and waiting time are s, erg, and s, respectively (corresponding to the vertical dashed lines in Figure 1).
| Parameters | Duration | Energy | Waiting time |
|---|---|---|---|
For the upper range [, ], we obtain the best-fitting parameters by minimizing the statistic,
| (3) |
where is the observed differential distribution and is the theoretical distribution function obtained from Equation (1). We adopt the Python implementation, EMCEE (Foreman-Mackey et al., 2013), to apply the Markov Chain Monte Carlo technique to perform the fitting. From Figure 1, we find that the differential distributions (above the threshold ) of duration, energy, and waiting time for GRB X-ray flares can be well fitted by a power-law function (see red solid lines). The best-fitting parameters and their uncertainties are presented in Table 1. The power-law indices of duration, energy, and waiting time are (with a reduced ), (), and (), respectively (all quoted uncertainties will hereafter be at the 95% confidence level). These power-law distributions are natural predictions of SOC theory (Aschwanden, 2011).
| 1 | 20 | 40 | ||
|---|---|---|---|---|
| Duration | ||||
| Energy | ||||
| Waiting time | ||||
III Scale Invariance in GRB X-ray Flares
SOC models have been widely investigated considering time intervals between avalanches in the critical regime (Corral, 2004). In this section, we focus our attention on the “returns” , i.e., on the differences between two avalanche sizes, where is the size (duration, energy, or waiting time) of the -th flare in temporal order, and the integer is the temporal interval scale. In practice, is rescaled as , where is the standard deviation of . Here we study the statistical distributions of the dimensionless returns .
The return distributions of earthquakes, SGRs, and repeating FRB 121102 have been shown to follow the -Gaussian function (Caruso et al., 2007; Wang et al., 2015; Chang et al., 2017; Lin and Sang, 2020; Wei et al., 2021; Sang and Lin, 2022). The -Gaussian function is defined as (Tsallis, 1988; Tsallis et al., 1998)
| (4) |
where is a normalization constant, and the parameters and determine the width and sharpness of the distribution, respectively. When , the -Gaussian function reduces to an ordinary Gaussian function with and . Thus, indicates a deviation from Gaussian statistics. Inspired by this, we try to fit the return distributions of GRB X-ray flares using the -Gaussian function. Due to the limited number of GRB X-ray flares, we use the cumulative distribution of -Gaussian in the fitting to avoid binning,
| (5) |
For a fixed , the free parameters (, , and ) can be optimized by minimizing the statistics,
| (6) |
where is the uncertainty of the data point, with being the cumulative number of the returns. In our analysis, we choose wide flat priors for , , and .
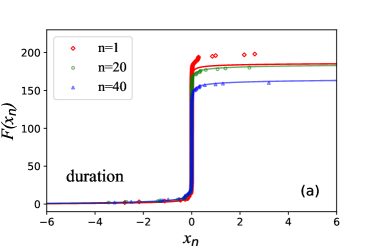
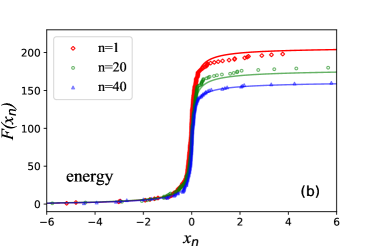
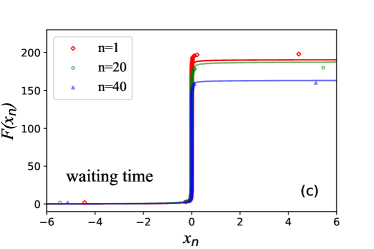
Figure 2 displays some examples of the fits for the data of GRB X-ray flares. In this figure, we show the cumulative distributions of the differences of durations (panel (a)), energies (panel (b)), and waiting times (panel (c)) for the temporal interval scale (diamonds), (circles), and (triangles). To make the data points to be more distinguishable, their uncertainties are not plotted in this figure. But the uncertainties have been employed to weight the data points in the fitting procedure. Note that for a fixed , the number of the dimensionless returns should be , where is the total number of the avalanche sizes. That is, the maximum values of the data points in Figure 2 are , , and for , , and , respectively. The red, green, and blue smooth curves show the -Gaussian fits for , , and , respectively. If the normalized cumulative distributions of the size differences at different temporal intervals are considered, then we would see that the data points in each panel of Figure 2 are almost independent of , and that the three fitted curves overlap almost completely. The best-fitting values and their uncertainties for , , are listed in Table 2, along with the value for the fit. One can see that the cumulative distributions of the differences of durations, energies, and waiting times are well reproduced by means of -Gaussians.
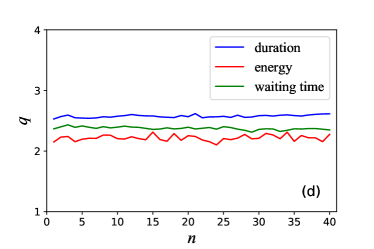
Furthermore, we calculate the cumulative distributions of the differences of durations, energies, and waiting times at different scale intervals , and fit the cumulative distributions with the -Gaussian function. Figure 2(d) shows the best-fitting values as a function of . We find that the values are nearly invariant and independent of . The mean values of for duration, energy, and waiting time are , , and , respectively, which are listed in Table 1. Here the uncertainties represent the standard deviations of values. The steadiness of values for different temporal interval scales implies the scale invariance of GRB X-ray flares. This property is very similar to that of earthquakes (Caruso et al., 2007; Wang et al., 2015), SGRs (Chang et al., 2017; Wei et al., 2021; Sang and Lin, 2022), and repeating FRBs (Lin and Sang, 2020; Wei et al., 2021).
IV Avalanche Size and Return Distributions
As mentioned above, Ref. Caruso et al. (2007) proposed an analysis method to characterize the presence of SOC in the limited number of earthquakes by taking advantage of the return distributions [i.e., distributions of the size (released energy) differences of the avalanches (earthquakes) at different times]. They presented the first evidence that the return distributions are in the shape of -Gaussians, standard distributions generating naturally within the framework of non-extensive statistical mechanics (Tsallis, 1988; Tsallis et al., 1998). In the hypothesis of no correlation between the sizes of two avalanches, a theoretical relation connecting the power-law index of the avalanche size distribution and the value of the appropriate -Gaussian has been derived as (Caruso et al., 2007; Celikoglu et al., 2010)
| (7) |
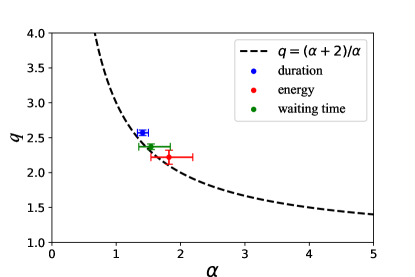
which is rather important because it enables the parameter determined a priori from the well-known power-law index of the system. The – relation expected from Equation (7) is shown in Figure 3 (dashed line). It is obvious that the value decreases with increasing , and tends to when .
With the best-fitting power-law indices of differential size distributions and the average values of the appropriate -Gaussians for GRB X-ray flares in hand, we now have the opportunity to test the validity of Equation (7). The observed - values for duration, energy, and waiting time are plotted as the blue, red, and green dots in Figure 3, along with their corresponding error bars. The values we get for the avalanche size power laws are , , and , which correspond, according to Equation (7), to the theoretical values of , , and , respectively. The observed values are , , and , which agree well with the predictions of Equation (7) at the confidence levels of , , and , respectively. These results support the validity of the theoretical relation (Equation (7)) to a certain extent.
V Summary and Discussion
SOC phenomena can be identified and diagnosed by analyzing the power-law or power-law-like distributions of the avalanche sizes, and therefore the determination of the power-law index is an important quest. Alternative, real SOC dynamics can also be discriminated in a quantitative way by analyzing avalanche size differences. When the system is approaching to a critical state, the PDFs for the avalanche size differences at different times are well fitted with a -Gaussian function. Another remarkable feature is the so-called scale invariance, where the values in the -Gaussian distributions are nearly invariant and independent of the temporal interval scale adopted. Moreover, a theoretical relation between the power-law index and the value of the appropriate -Gaussian has been established as (Caruso et al., 2007; Celikoglu et al., 2010). This is important as it makes the parameter estimated a priori and therefore it rescues from being a fitting parameter.
In this work, we investigate the statistical properties of X-ray flares of GRBs with known redshifts. We first show that the differential distributions of duration, energy, and waiting time of GRB X-ray flares can be well fitted by a power-law function, confirming previous findings. We then find that the probability distributions of the differences of durations, energies, and waiting times can be well fitted by a -Gaussian function and the values remain nearly constant for different time scales. Our research reveals for the first time that GRB X-ray flares have the scale-invariant property. Lastly, we verify that the real values of and found for the durations, energies, and waiting times of GRB X-ray flares are roughly consistent with the predictions of Equation (7). This is the first study to test the validity of Equation (7) using real data. Our findings support the argument that a dissipative SOC mechanism with long-range interactions is at the origin of GRB X-ray flares. In the future, many more X-ray flares of GRBs will be detected. The physical connection between avalanche size and return distributions can be further investigated based on the larger sample of GRB X-ray flares.
Acknowledgements.
This work is partially supported by the National Key Research and Development Program of China (2022SKA0130100), the National Natural Science Foundation of China (grant Nos. 11725314 and 12041306), the Key Research Program of Frontier Sciences (grant No. ZDBS-LY-7014) of Chinese Academy of Sciences, the Natural Science Foundation of Jiangsu Province (Grant No. BK20221562), and the Young Elite Scientists Sponsorship Program of Jiangsu Association for Science and Technology.References
- Burrows et al. (2005) D. N. Burrows, P. Romano, A. Falcone, S. Kobayashi, B. Zhang, A. Moretti, P. T. O’Brien, M. R. Goad, S. Campana, K. L. Page, et al., Bright X-ray Flares in Gamma-Ray Burst Afterglows, Science 309, 1833 (2005).
- Nousek et al. (2006) J. A. Nousek, C. Kouveliotou, D. Grupe, K. L. Page, J. Granot, E. Ramirez-Ruiz, S. K. Patel, D. N. Burrows, V. Mangano, S. Barthelmy, et al., Evidence for a Canonical Gamma-Ray Burst Afterglow Light Curve in the Swift XRT Data, Astrophys. J. 642, 389 (2006).
- Zhang et al. (2006) B. Zhang, Y. Z. Fan, J. Dyks, S. Kobayashi, P. Mészáros, D. N. Burrows, J. A. Nousek, and N. Gehrels, Physical Processes Shaping Gamma-Ray Burst X-Ray Afterglow Light Curves: Theoretical Implications from the Swift X-Ray Telescope Observations, Astrophys. J. 642, 354 (2006).
- Chincarini et al. (2007) G. Chincarini, A. Moretti, P. Romano, A. D. Falcone, D. Morris, J. Racusin, S. Campana, S. Covino, C. Guidorzi, G. Tagliaferri, et al., The First Survey of X-Ray Flares from Gamma-Ray Bursts Observed by Swift: Temporal Properties and Morphology, Astrophys. J. 671, 1903 (2007).
- Falcone et al. (2007) A. D. Falcone, D. Morris, J. Racusin, G. Chincarini, A. Moretti, P. Romano, D. N. Burrows, C. Pagani, M. Stroh, D. Grupe, et al., The First Survey of X-Ray Flares from Gamma-Ray Bursts Observed by Swift: Spectral Properties and Energetics, Astrophys. J. 671, 1921 (2007).
- Chincarini et al. (2010) G. Chincarini, J. Mao, R. Margutti, M. G. Bernardini, C. Guidorzi, F. Pasotti, D. Giannios, M. Della Valle, A. Moretti, P. Romano, et al., Unveiling the origin of X-ray flares in gamma-ray bursts, Mon. Not. R. Astron. Soc. 406, 2113 (2010).
- Margutti et al. (2011) R. Margutti, G. Chincarini, J. Granot, C. Guidorzi, E. Berger, M. G. Bernardini, N. Gehrels, A. M. Soderberg, M. Stamatikos, and E. Zaninoni, X-ray flare candidates in short gamma-ray bursts, Mon. Not. R. Astron. Soc. 417, 2144 (2011).
- Bernardini et al. (2011) M. G. Bernardini, R. Margutti, G. Chincarini, C. Guidorzi, and J. Mao, Gamma-ray burst long lasting X-ray flaring activity, Astron. & Astrophys. 526, A27 (2011).
- Campana et al. (2006) S. Campana, G. Tagliaferri, D. Lazzati, G. Chincarini, S. Covino, K. Page, P. Romano, A. Moretti, G. Cusumano, V. Mangano, et al., The X-ray afterglow of the short gamma ray burst 050724, Astron. & Astrophys. 454, 113 (2006).
- Falcone et al. (2006) A. D. Falcone, D. N. Burrows, D. Lazzati, S. Campana, S. Kobayashi, B. Zhang, P. Mészáros, K. L. Page, J. A. Kennea, P. Romano, et al., The Giant X-Ray Flare of GRB 050502B: Evidence for Late-Time Internal Engine Activity, Astrophys. J. 641, 1010 (2006).
- Romano et al. (2006) P. Romano, A. Moretti, P. L. Banat, D. N. Burrows, S. Campana, G. Chincarini, S. Covino, D. Malesani, G. Tagliaferri, S. Kobayashi, et al., X-ray flare in XRF 050406: evidence for prolonged engine activity, Astron. & Astrophys. 450, 59 (2006).
- Mészáros (2006) P. Mészáros, Gamma-ray bursts, Reports on Progress in Physics 69, 2259 (2006).
- Zhang (2007) B. Zhang, Gamma-Ray Bursts in the Swift Era, Chin. J. Astron. Astrophys. 7, 1 (2007).
- Katz (1986) J. I. Katz, A model of propagating brittle failure in heterogeneous media, J. Geophys. Res. 91, 10412 (1986).
- Bak et al. (1987) P. Bak, C. Tang, and K. Wiesenfeld, Self-organized criticality: An explanation of the 1/f noise, Phys. Rev. Lett. 59, 381 (1987).
- Aschwanden et al. (2016) M. J. Aschwanden, N. B. Crosby, M. Dimitropoulou, M. K. Georgoulis, S. Hergarten, J. McAteer, A. V. Milovanov, S. Mineshige, L. Morales, N. Nishizuka, et al., 25 Years of Self-Organized Criticality: Solar and Astrophysics, Space Sci. Rev. 198, 47 (2016).
- Aschwanden (2014) M. J. Aschwanden, A Macroscopic Description of a Generalized Self-organized Criticality System: Astrophysical Applications, Astrophys. J. 782, 54 (2014).
- Aschwanden (2011) M. J. Aschwanden, Self-Organized Criticality in Astrophysics (Springer-Praxis, Berlin, 2011).
- Aschwanden (2012) M. J. Aschwanden, A statistical fractal-diffusive avalanche model of a slowly-driven self-organized criticality system, Astron. & Astrophys. 539, A2 (2012).
- Aschwanden (2015) M. J. Aschwanden, Thresholded Power law Size Distributions of Instabilities in Astrophysics, Astrophys. J. 814, 19 (2015).
- Wang and Dai (2013) F. Y. Wang and Z. G. Dai, Self-organized criticality in X-ray flares of gamma-ray-burst afterglows, Nature Physics 9, 465 (2013).
- (22) For a fractal-diffusive avalanche model, the avalanche size grows as a diffusive random walk with time , following , and the frequency distributions based on spatially uniform probabilities in a SOC system are argued as for three Euclidean dimensions (, , ). This analytical model predicts power-law distributions for durations and energies, with the indices and (Aschwanden, 2012, 2014). Ref. (Wang and Dai, 2013) showed that the derived power-law indices of GRB X-ray flares and solar flares correspond to the predictions of the one-dimensional () and three-dimensional () cases, respectively. Therefore, the energy and duration frequency distributions for both types of flares can be explained with the same framework of SOC systems, but with different Euclidean dimensions Wang and Dai (2013).
- (23) Many observations suggest that the central engines of GRBs have long periods of activity and X-ray flares originate from late internal shocks, which could be created through collisions of relativistic shells ejected after the prompt emission has ended (Burrows et al., 2005; Mészáros, 2006; Zhang, 2007). In such relativistic jets, the magnetic reconnection is expected to derive the current sheets, from which the electrons are accelerated to emit observed GRB luminosity (solar flares are also believed to be driven by magnetic reconnection processes (Shibata and Magara, 2011)). Relativistic shells could be ejected from ultra-strongly magnetized millisecond pulsars (Dai et al., 2006; Metzger et al., 2011) or from long-term hyperaccreting disks around stellar-mass black holes (Proga and Zhang, 2006).
- Shibata and Magara (2011) K. Shibata and T. Magara, Solar Flares: Magnetohydrodynamic Processes, Living Reviews in Solar Physics 8, 6 (2011).
- Dai et al. (2006) Z. G. Dai, X. Y. Wang, X. F. Wu, and B. Zhang, X-ray Flares from Postmerger Millisecond Pulsars, Science 311, 1127 (2006).
- Metzger et al. (2011) B. D. Metzger, D. Giannios, T. A. Thompson, N. Bucciantini, and E. Quataert, The protomagnetar model for gamma-ray bursts, Mon. Not. R. Astron. Soc. 413, 2031 (2011).
- Proga and Zhang (2006) D. Proga and B. Zhang, The late time evolution of gamma-ray bursts: ending hyperaccretion and producing flares, Mon. Not. R. Astron. Soc. 370, L61 (2006).
- Caruso et al. (2007) F. Caruso, A. Pluchino, V. Latora, S. Vinciguerra, and A. Rapisarda, Analysis of self-organized criticality in the Olami-Feder-Christensen model and in real earthquakes, Phys. Rev. E 75, 055101 (2007).
- Wang et al. (2015) P. Wang, Z. Chang, H. Wang, and H. Lu, Scale-invariant structure of earthquake energy fluctuations for different faulting styles, European Physical Journal B 88, 206 (2015).
- Chang et al. (2017) Z. Chang, H.-N. Lin, Y. Sang, and P. Wang, Scale-invariance in soft gamma repeaters, Chinese Physics C 41, 065104 (2017).
- Wei et al. (2021) J.-J. Wei, X.-F. Wu, Z.-G. Dai, F.-Y. Wang, P. Wang, D. Li, and B. Zhang, Similar Scale-invariant Behaviors between Soft Gamma-Ray Repeaters and an Extreme Epoch from FRB 121102, Astrophys. J. 920, 153 (2021).
- Sang and Lin (2022) Y. Sang and H.-N. Lin, Statistical similarity between soft gamma repeaters and repeating fast radio bursts, Mon. Not. R. Astron. Soc. 510, 1801 (2022).
- Lin and Sang (2020) H.-N. Lin and Y. Sang, Scale-invariance in the repeating fast radio burst 121102, Mon. Not. R. Astron. Soc. 491, 2156 (2020).
- Li et al. (2021) D. Li, P. Wang, W. W. Zhu, B. Zhang, X. X. Zhang, R. Duan, Y. K. Zhang, Y. Feng, N. Y. Tang, S. Chatterjee, et al., A bimodal burst energy distribution of a repeating fast radio burst source, Nature (London) 598, 267 (2021).
- Celikoglu et al. (2010) A. Celikoglu, U. Tirnakli, and S. M. D. Queirós, Analysis of return distributions in the coherent noise model, Phys. Rev. E 82, 021124 (2010).
- Yi et al. (2016) S.-X. Yi, S.-Q. Xi, H. Yu, F. Y. Wang, H.-J. Mu, L.-Z. Lü, and E.-W. Liang, Comprehensive Study of the X-Ray Flares from Gamma-ray Bursts Observed by Swift, Astrophys. J. Suppl. Ser. 224, 20 (2016).
- Planck Collaboration et al. (2020) Planck Collaboration, N. Aghanim, Y. Akrami, M. Ashdown, J. Aumont, C. Baccigalupi, M. Ballardini, A. J. Banday, R. B. Barreiro, N. Bartolo, et al., Planck 2018 results. VI. Cosmological parameters, Astron. & Astrophys. 641, A6 (2020).
- Foreman-Mackey et al. (2013) D. Foreman-Mackey, D. W. Hogg, D. Lang, and J. Goodman, emcee: The MCMC Hammer, Pub. Astro. Soc. Pacific 125, 306 (2013).
- Corral (2004) Á. Corral, Long-Term Clustering, Scaling, and Universality in the Temporal Occurrence of Earthquakes, Phys. Rev. Lett. 92, 108501 (2004).
- Tsallis (1988) C. Tsallis, Possible generalization of Boltzmann-Gibbs statistics, Journal of Statistical Physics 52, 479 (1988).
- Tsallis et al. (1998) C. Tsallis, R. Mendes, and A. R. Plastino, The role of constraints within generalized nonextensive statistics, Physica A Statistical Mechanics and its Applications 261, 534 (1998).