Ghost in the Shell: Evidence for Past AGN Activities in NGC 5195
from a Newly Discovered large-scale Ionized Structure
Abstract
The early-type galaxy NGC 5195 (alternatively known as M51b) possesses extended gas features detected in multi-wavelength, postulated to be associated with previous activities of the central supermassive black hole (SMBH). Using integral field spectroscopic observations from the Canada-France-Hawaii Telescope (CFHT)/SITELLE, we report on the discovery of a new large-scale ionized gas structure traced by [O iii], [N ii], and H line emission, extending to from the nucleus of NGC 5195. Its bipolar morphology, emission line ratio diagnostics, and comparison with the X-ray image from Chandra and low-frequency radio data from LOFAR all indicate that it is likely an outflow inflated by a past episode of elevated active galactic nucleus (AGN) activity. Assuming the ionized gas is outflowing from the central region of NGC 5195, the estimated mass and energy outflow rates are – and –, respectively, which cannot be provided by current star formation and the low luminosity nucleus. Alternatively, considering the history of gravitational interaction between the M51 pair and the presence of HI tidal tail, the northern large-scale ionized gas could very likely be associated with tidally stripped material illuminated by a luminous AGN in the past.
1 Introduction
Galaxy interactions and mergers are thought to play an important role in triggering star formation and active galactic nuclei (AGNs) activities. Galactic outflows driven by AGNs are predicted by theoretical models and simulations during such a key stage of galaxy evolution. Unequivocally, multiphase AGN outflows on various scales have been detected in galaxies at different redshifts (e.g. Fabian, 2012; Tombesi et al., 2015; Woo et al., 2016; Venturi et al., 2018). Such AGN activities are postulated to be episodic, possibly governed by accretion disk physics and large-scale gas supply (Shankar et al., 2009; Shen, 2021). The impact on the surrounding galactic medium leaves imprints that provide useful diagnostics on the historic radiative and mechanical power of these AGNs (e.g., Schweizer et al., 2013; Sartori et al., 2016; Keel et al., 2017; Harvey et al., 2022).
The interacting system Messier 51 (M51) contains a grand design spiral galaxy NGC 5194 (M51a) and an early-type galaxy NGC 5195 (M51b). NGC 5195 is classified as different types of the galaxy, such as SB-pec (Sandage & Tammann, 1981) and I0-pec (de Vaucouleurs et al., 1991), due to its peculiar morphology that is tidally disturbed in the interaction. An SMBH with mass is believed to reside in the nucleus of NGC 5195 (e.g. Schlegel et al., 2016; Rampadarath et al., 2018). According to the optical emission-line ratios, the nucleus is classified as the low ionization nuclear emission-line region (LINER) (Ho et al., 1997). An AGN is suggested to inhabit the center of this galaxy based on the detection of the high-excitation emission line [Ne v] (Goulding & Alexander, 2009). The current level of the nuclear activity of NGC 5195 is expected to be very low with an unabsorbed X-ray luminosity of and weak radio emission of (e.g. Rampadarath et al., 2018).
Schlegel et al. (2016) revealed a double-arc-like X-ray structure in the southern region of the NGC 5195 nucleus with – away from the center using the Chandra data. A slender H-emitting feature (first detected by Greenawalt et al., 1998) locates just outside the outer X-ray arc, which was expected to be plowed up by the X-ray-emitting gaseous outflow. They attributed the arcs to episodic outbursts of the nuclear SMBH. Later Rampadarath et al. (2018) confirmed the kpc-scale arcs in the radio bands with Very Large Array (VLA) observations and detected a linear radio spur near the nucleus pointing towards the arcs. They suggested that the kpc-scale structures likely resemble a jet-inflated bubble associated with past AGN activities. Additionally, a vast H cloud north of the M51 system was detected by Watkins et al. (2018), which was expected to be associated with the tidal stripping or AGN activities during the interaction.
In this work, we present the results of our new integral field spectroscopic (IFS) observations focusing on the large ionized gas structure in NGC 5195. The observations and data reduction are described in Section 2. Main results including the flux and velocity maps, the emission-line diagnostic diagram and map, and the comparison with other observational results in different bands are presented in Section 3. In Section 4 and Section 5, we discuss the findings and draw brief conclusions. For consistency with Schlegel et al. (2016) and Rampadarath et al. (2018), the distance to NGC 5195 is adopted as ().
2 Observations and Data Reduction
2.1 CFHT/SITELLE data
NGC 5195 was observed by the instrument SITELLE (Grandmont et al., 2012) installed on the 3.6m CFHT, on 2019-04-08, 2019-04-10, and 2019-05-10 (Program 19AS002, PI: J. Wang). SITELLE is an imaging Fourier transform spectrometer (IFTS) designed for the CFHT, which can provide IFS abilities in the visible band (350 to 900 nm), with a large field of view (FOV) arcmin2 and variable spectral resolution (R = 2 to 10000) (Drissen et al., 2019). We used the SN2 (480-520 nm) and SN3 (651-685 nm) filters, with exposure time 4.5 hours for SN2 and 3.55 hours for SN3, to cover main emission lines e.g. H, H, [O iii], [N ii]6548,6583, and [S ii]6716,6731. The spectral resolution of the SN2 and SN3 datacubes is set to be .
The calibrated datacubes of SN2 and SN3 were retrieved from the Canadian Astronomy Data Centre (CADC)111https://www.cadc-ccda.hia-iha.nrc-cnrc.gc.ca/en/. The ORCS222https://github.com/thomasorb/orcs (Martin et al., 2015) is used to analyse the data, which is a python module for analysis of SITELLE spectral cubes. To obtain extended emission lines with enough signal-to-noise ratio (SNR), we rebinned the spectral cubes with a factor of 10. The Voronoi binning technique (Cappellari & Copin, 2003) was also used to rebin the datacubes for cross-checking the faint extended structure. Comparing the results of these two binning methods, no significant improvements can be gained using the Voronoi binning, hence the 1010 binning is sufficient for the main purpose of this work. We follow the method described by Rousseau-Nepton et al. (2018) to subtract the stellar continuum from the spectra. The spectrum without emission lines extracted from the nuclear region with a radius of is used as the continuum template, which is subtracted in every spectrum extracted from the FOV after normalized to the continuum levels of those spectra. Due to the low spectral resolution, we only used the “sinc” model, the natural instrument line shape of IFTS, to fit emission lines of the SN2 and SN3 datacube and thus we cannot obtain the velocity dispersion of emission lines. We followed the procedure described in Martin et al. (2018) to refine the wavelength calibration by measuring the velocity of the night sky emission lines.
For the extinction correction, the flux ratio of H and H (the Balmer decrement) was used. The attenuation law from Calzetti (2001) and an intrinsic Balmer decrement (Osterbrock & Ferland, 2006) were adopted.
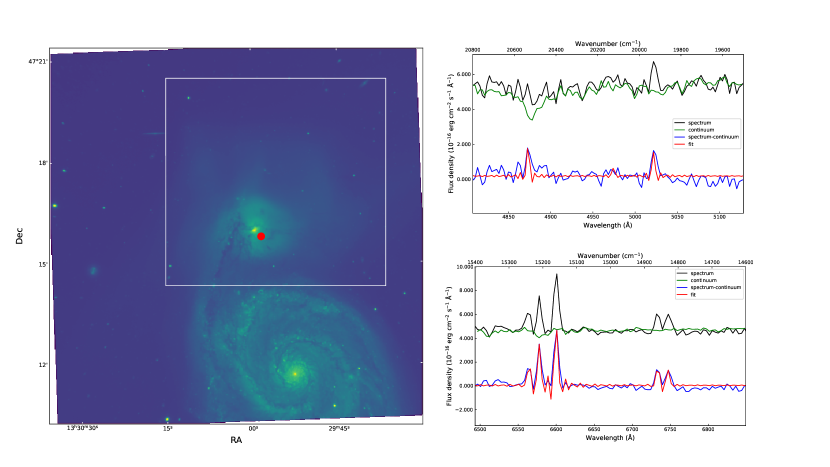
Figure 1 shows the deep image derived from the SN2 datacube. The region covering NGC 5195 is selected for fitting and analysis, shown as a white box. A large circle region far away from the M51 system and including no apparent point sources is selected to extract a spectrum as the background. Two examples of spectra extracted from the red circular region in the left panel of Figure 1 are shown in the right panels, in which the top is for the SN2 and the bottom is for the SN3 datacube. The spectral fitting illustrates that the continuum templates perform well especially for the emission line fitting.
2.2 Chandra X-ray data
The X-ray emission of the NGC 5195 has been thoroughly studied in detail by Schlegel et al. (2016) and Rampadarath et al. (2018). This work would not repeat their analysis but only derive the soft X-ray image to compare with our IFS results. We obtained all available Chandra observations of M51 from Chandra Data Archive333https://cda.harvard.edu/chaser/ except ObsID 414 and ObsID 12562 (for the reason described in Schlegel et al., 2016), including all data used by Schlegel et al. (2016) and Rampadarath et al. (2018) supplemented with ObsID 20998, 23472, 23473, 23474, and 23475. The total exposure time reaches 1.04 Ms. All data were reprocessed and merged using CIAO 4.13 (Fruscione et al., 2006) with CALDB version 4.9.4.
3 Results
3.1 Flux and velocity maps
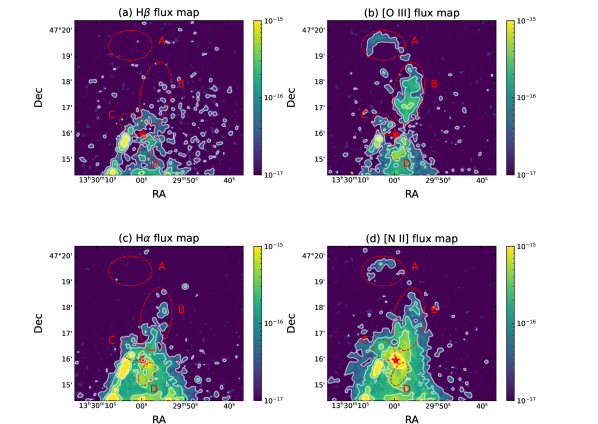
In Figure 2, the rebinned flux maps of H, [O iii], H, and [N ii] are shown. Due to the low SNRs of [S ii]6716,6731 in most spaxels, we do not show the flux maps of these two emission lines. To obtain robust measurements, the spaxels with SNR are rejected. Note that the lowest level of flux contours shown corresponds to , and emission structures fainter than this threshold are not reliable, which can be affected by the instrumental modulation of SITELLE. The most intriguing structure is the large hook-like [O iii] cloud (region A and B in Figure 2(b)) in the north of NGC 5195, extending in projection () from the nucleus, which is not known from previous works. Its presence is further confirmed in the [N ii] flux map. The H flux maps also show extended features in the region B along the direction of the [O iii] hook with away from the nucleus. This ionized gas structure is consistent with a similar faint bubble-like H feature detected by Watkins et al. (2018) using deep narrow-band imaging. Although the H flux map exhibit relatively weak emission, the main features are basically consistent with other flux maps.
In previous studies, a double arc-like structure in the south region of NGC 5195 had been detected in the soft X-ray band (Schlegel et al., 2016), and corresponding structures are detected in H narrowband image and radio band (Greenawalt et al., 1998; Schlegel et al., 2016; Rampadarath et al., 2018). These structures can also be found in our emission-line flux maps, e.g. a blurred arc feature in H, [O iii], and [N ii] map (region D), which is extending to (for [O iii]) in projection.
[O iii] emission appears to be very weak or absent in the nuclear region. The dust extinction in the nuclear region of NGC 5195 is up to (Wei et al., 2021), which can reduce the observed flux of the [O iii] emission line. Considering the low X-ray (an absorption corrected luminosity ) and radio luminosity () in the nuclear region of NGC 5195 (e.g. Rampadarath et al., 2018), the nuclear [O iii] emission is considered to be intrinsically very weak.
In all these flux maps, a spiral arm from the NGC 5194 connecting with region C can be seen in the southeastern region of the NGC 5195’s nucleus. A low flux gap can be seen in the bottom of the FoV and under region D in all flux maps, which is suggestive that the gap separates the ionized gas emission from NGC 5195 (above the gap) and NGC 5194 (under the gap).
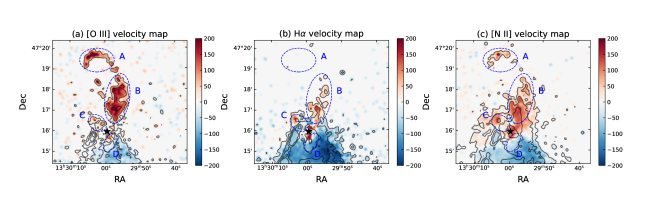
In Figure 3, the velocity maps of [O iii], H, and [N ii] are presented. The systemic velocity of NGC 5195 (Falco et al., 1999) is used to calibrate these velocity maps. As the [O iii] velocity map shows, the velocities in regions A, B, and C are redshifted while in region D are blueshifted, which is suggestive of a bipolar outflow. Other velocity maps also support this interpretation. Considering the strong interaction between NGC 5195 and NGC 5194, the northern ionized gas structure can also be produced by tidal stripping. The highest velocity gas is seen in region A with the median velocity of [O iii] emission line reaching . The median velocities of [O iii] in the region B, C and D are , and , respectively. The [N ii] and H velocity maps also exhibit similar kinematics as the [O iii] map in these four regions.
3.2 Emission-line diagnostic diagram and map
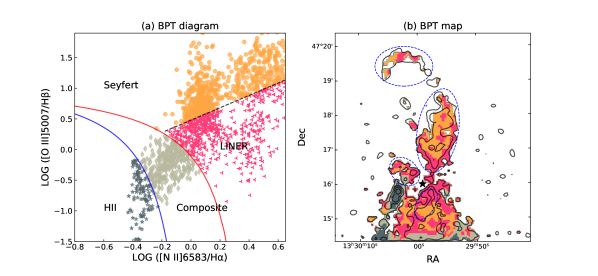
The Baldwin, Phillips, and Telervich (BPT) diagnostic diagram (Baldwin et al., 1981) is usually used to distinguish the ionization and excitation mechanisms of the ionized gas. To obtain statistically robust results, the spaxels with the flux of the [O iii] () or the [N ii] ( lower than are masked out in the diagram and map. For spaxels with the flux of H of , upper limits of Balmer emission lines of and are given.
In Figure 4, the BPT diagram and map are presented. The ionization sources in NGC 5195 are dominated by AGN and LINER. Region A and B are dominated by AGN photoionization, only the edges of region B are classified as LINER. In region D, the LINER dominates the area near the nucleus, while the AGN becomes the main source of ionization with the increasing distance to the nucleus.
The spiral arm under region C, which is from NGC 5194, is dominated by regions classified as HII and composite. Considering the bottom of the field is dominated by composite regions and the lower part of the FoV is located at a spiral arm of NGC 5194 (Figure 1), most of the ionized gas here should be from the NGC 5194, which is consistent with our initial suggestion in Section 3.1.
3.3 Comparison with the radio and X-ray data
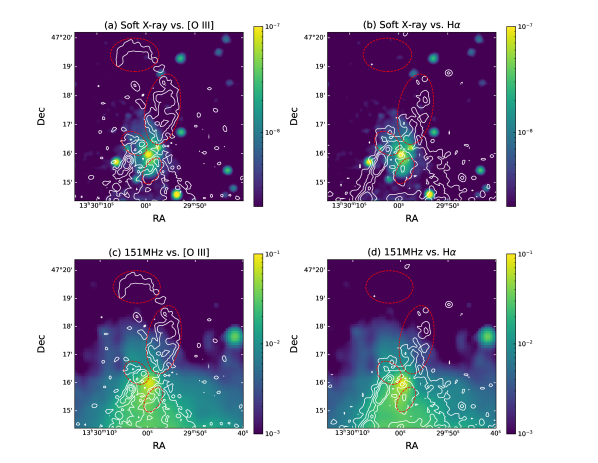
Figure 5(a) and (b) show the adaptively smoothed Chandra soft X-ray (0.4–) image superposed with contours of [O iii]5007 and H emission, respectively. The southern double-arc-like X-ray structure found by Schlegel et al. (2016) is spatially coincident with the inner part of [O iii] arc (region D), whereas the northern extended X-ray feature is inside the rims of the northern [O iii] structure (region B and C). Compared to the H flux contours, The soft X-ray emission also corresponds to the diffuse H structure spatially, which is consistent with previous works (Schlegel et al., 2016; Rampadarath et al., 2018).
The Low Frequency Array (LOFAR) images (Mulcahy et al., 2014) superposed with contours of [O iii]5007 and H are presented in Figure 5(c) and (d), respectively. As Figure 5(c) shows, a radio lobe or bubble extends from the nucleus to the northeast and just inside the northern [O iii] emission, indicating a likely association with a jet or outflow. In Figure 5(d), the northern H structure is similar to [O iii] but extends to a smaller scale. The low-frequency radio extension is consistent with the northern radio bubble detected by Rampadarath et al. (2018) using VLA, although that bubble-like feature is weaker with a smaller scale. Note that Rampadarath et al. (2018) also detected a radio bubble in L, C, and X bands in the southern region, which is spatially associated with the southern H, [O iii], and soft X-ray emission features.
4 Discussion
4.1 Origin of the large-scale ionized gas structure
As the flux and velocity maps show (Figure 2 and 3), the main ionized gas structure in NGC 5195 (regions A, B, C, and D) closely resembles a bipolar outflow. According to the bubble-like morphology detected in different bands ([O iii], H, [N ii], and the soft X-ray) and the corresponding LOFAR radio bubble feature (Figure 5), we suggest that this large-scale ionized structure can be associated with an AGN jet or outflow, which is consistent with Rampadarath et al. (2018) but on a larger scale. The BPT diagram and map (Figure 4) also suggest that the main ionized structures (regions A, B, and D) should be photoionized by an AGN. The LINER regions in the BPT map spatially correspond to the superposed areas of the soft X-ray, radio, and ionized gas emission, which indicates these regions can be excited by the shocks produced by a jet or outflow. Considering the current low state of the SMBH in the center of NGC 5195 (Rampadarath et al., 2018) and the weak [O iii] flux in the nuclear region, the large-scale ionized gas structure should relate to past epochs of AGN activities, which is consistent with the suggestion in previous works (Schlegel et al., 2016; Rampadarath et al., 2018).
The dynamical timescale of the ionized outflow can be estimated to be , where denotes the distance away from the nucleus and is the outflow velocity. The simulation expects that the recent interaction between NGC 5195 and NGC 5194 has occurred – ago (Salo & Laurikainen, 2000). Considering the gas infalling timescale (Schlegel et al., 2016), the dynamical timescale of the ionized outflow is roughly corresponding to the recent interaction between NGC 5195 and NGC 5194.
Distant ionized clouds originated from tidal stripping and illuminated by past AGN activities have been detected in some galaxies (e.g. Keel et al., 2017), and such a connection appears to be quite common as revealed by systematic surveys (Keel et al., 2022). The Hanny’s Voorwerp is a famous example extending in projection from the nucleus of IC 2497, which is inferred as a part of massive HI tidal tail and photoionized by past luminous AGN (Józsa et al., 2009; Lintott et al., 2009; Keel et al., 2012). In the M51 system, large-scale neutral gas structures originating from tidal stripping have been revealed by Rots et al. (1990) using VLA. The large ionized gas structure (regions A and B) is coincident with a part of a giant tidal tail traced by HI emission extending from NGC 5195 to the north. Considering the velocity of the corresponding HI tidal feature is about 30– (Rots et al., 1990), which is several times lower than the median velocity (–) of the northern [O iii] structure, the ionized gas feature may be a shocked, relatively higher velocity component of the tidal stream or photoionized and accelerated by a more active AGN in the past. Combining the dominant AGN photoionization mechanism in this ionized structure suggested by the BPT diagram, the spatial correspondence with the HI tidal tail and the faded AGN in the nucleus of NGC 5195, the northern large-scale ionized gas structure is similar to Hanny’s Voorwerp, which can be a part of tidal tail photoionized by past AGN activities.
In fact, tidal stripping and AGN activities can both be important here. In such complicated interacting galaxy pairs, it is challenging to pinpoint the origin of the large-scale ionized gas structure. More sensitive observations on the faint structures are needed to resolve this issue.
4.2 Energetics of the ionized outflow
Assuming the ionized gas structure in NGC 5195 is a biconical outflow, we can estimate the mass and energy outflow rate. The mass of an ionized outflow can be estimated using H emission line (e.g. Harrison et al., 2014) or [O iii] line (e.g. Carniani et al., 2015; Karouzos et al., 2016). We firstly use the [O iii] line to calculate the outflow mass following (e.g. Carniani et al., 2015):
| (1) |
where is the luminosity of [O iii] and is the electron density, assuming the solar metallicity. The electron density can be estimated from the flux ratio of [S ii][S ii], assuming the case B and the electron temperature K (Osterbrock & Ferland, 2006). However, the [S ii] doublets are very weak in most areas of our datacube, especially in regions A, B, and C. In region D, the [S ii] doublets can be fitted but with , and the corresponding is estimated to be a very low value (), which is much lower than the sensitive range () of these doublets (Osterbrock & Ferland, 2006). Rampadarath et al. (2018) estimated the density to be following the method described by Pakull et al. (2006), which is consistent with the very low value indicated by the flux ratio of the [S ii] doublets. The mass and energy outflow rate can be calculated following:
| (2) | ||||
| (3) |
where denotes the averaged velocity of the outflow, and is the outflow size. Only the luminosity of [O iii] from regions A, B, C, and D is considered in estimating the outflow rates. Adopting , , and , we obtain and . This estimated is lower than but consistent with the value (a few ) calculated by Rampadarath et al. (2018), because the outflow mass estimated from the [O iii] flux is normally a lower limit (Carniani et al., 2015).
The upper limit of outflow mass can be estimated using the total H luminosity of NGC 5195, which is derived using . The outflow mass traced by H emission line can be calculated following (e.g. Harrison et al., 2014; Xu & Wang, 2022):
| (4) |
We obtain the upper limits of the mass and energy outflow rate of and , respectively, which are nearly one order of magnitude larger than the lower limits.
Comparing with the kinetic power resulting from the stellar winds and SNe (Rampadarath et al., 2018) given the current of NGC 5195 (Alatalo et al., 2016), even the lower limit of the energy outflow rate is larger by a factor of two to three, which imply that the current star formation process cannot drive the ionized outflow. A starburst that occurred 370–480 Myr ago had been suggested by Mentuch Cooper et al. (2012), while this is not consistent with the timescale of the ionized outflow ().
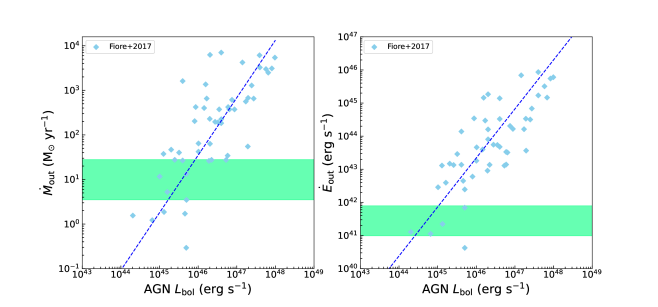
To compare the outflow rates of NGC 5195 with observational results of other AGNs, we show the outflow rates as a function of the AGN bolometric luminosity following Fiore et al. (2017) in the Figure 6. The green regions in the two panels denote the ranges of the outflow rates derived above. The outflow rates of NGC 5195 are comparable to the lower part of the correlations. If the ionized outflow of NGC 5195 is radiatively driven by the AGN and follows the correlation of Fiore et al. (2017), an AGN bolometric luminosity of – is inferred, which is approaching or exceed the Eddington luminosity of , adopting for the mass of the SMBH. Alternatively, if the ionized outflow is driven by an AGN jet (Rampadarath et al., 2018), the outflow rate can be much higher than expected from the correlation of Fiore et al. (2017) for a low luminosity AGN. In either case, the outflow is likely powered by the past powerful AGN activities, given that the AGN in NGC 5195 is currently very weak with a small-scale radio jet (e.g. Schlegel et al., 2016; Rampadarath et al., 2018).
Combining the large size and the relatively high outflow rates of this bipolar outflow, feedback effects might be significant in this galaxy.
5 Conclusions
In this work, we report the observation of the nearby interacting galaxy NGC 5195 using the CFHT/SITELLE, and study the spatially resolved ionized gas. To identify the ionization mechanism of the emission line gas structure, the BPT diagnostic diagram and map are derived. Multiwavelength observations including the soft X-ray (0.4–) data from the Chandra archive and the LOFAR image from Mulcahy et al. (2014) are used to compare with our spatially resolved data. The main results and conclusions are summarized as follows:
- 1.
-
2.
According to the BPT diagram and map, the large-scale structure is dominated by the region classified as Seyfert and LINER (Figure 4), which indicates that the structure is likely associated with AGN activities or shocks.
-
3.
The northern soft X-ray and the LOFAR bubble-like feature is just located inside the ionized gas structure, which strongly indicates that the ionized gas feature is associated with an AGN jet or outflow (Figure 5). Considering the strong interaction in the M51 system, the northern large-scale ionized gas structure may have a complicated origin. This structure can be a part of the giant HI tidal tail revealed by previous works (Rots et al., 1990) and photoionized by past AGN activities.
-
4.
Assuming the ionized gas structure is a bipolar outflow, the mass and energy outflow rates can be estimated to be – and –, which cannot be provided by the current star formation activities (Section 4.2). In lieu of the currently weak AGN, the ionized outflow is likely associated with the past powerful AGN activities.
The NGC 5195 galaxy could be the closest example exhibiting a projected kpc scale ionized structure associated with past AGN outflow/jet activities or light echoes, which makes it an ideal laboratory for studying the AGN feedback, past AGN activities, and the interaction between the galaxy pair. Our future work will study the M51 system in more detail deploying the rich archival multi-wavelength data.
6 Acknowledgments
We thank the anonymous referee for helpful comments that significantly improved the clarity of our work. We thank Thomas Martin for the instructions on the SITELLE data analysis. J.W. acknowledges the NSFC grants U1831205, 12033004, 12221003 and the science research grants from CMS-CSST-2021-A06 and CMS-CSST-2021-B02. Our SITELLE observation (19AS002) is kindly supported by China Telescope Access Program (TAP). Based on observations obtained at the Canada-France-Hawaii Telescope (CFHT) which is operated from the summit of Maunakea by the National Research Council of Canada, the Institut National des Sciences de l’Univers of the Centre National de la Recherche Scientifique of France, and the University of Hawaii. The observations at the Canada-France-Hawaii Telescope were performed with care and respect from the summit of Maunakea which is a significant cultural and historic site. Based on observations obtained with SITELLE, a joint project between Universit Laval, ABB-Bomem, Universit de Montral and the CFHT with funding support from the Canada Foundation for Innovation (CFI), the National Sciences and Engineering Research Council of Canada (NSERC), Fond de Recheche du Qubec - Nature et Technologies (FRQNT) and CFHT. This research has made use of data obtained from the Chandra Data Archive and the Chandra Source Catalog, and software provided by the Chandra X-ray Center (CXC) in the application packages CIAO and Sherpa.
References
- Alatalo et al. (2016) Alatalo, K., Aladro, R., Nyland, K., et al. 2016, The Astrophysical Journal, 830, 137, doi: 10.3847/0004-637X/830/2/137
- Astropy Collaboration et al. (2013) Astropy Collaboration, Robitaille, T. P., Tollerud, E. J., et al. 2013, Astronomy and Astrophysics, 558, A33, doi: 10.1051/0004-6361/201322068
- Astropy Collaboration et al. (2018) Astropy Collaboration, Price-Whelan, A. M., Sipőcz, B. M., et al. 2018, The Astronomical Journal, 156, 123, doi: 10.3847/1538-3881/aabc4f
- Baldwin et al. (1981) Baldwin, J. A., Phillips, M. M., & Terlevich, R. 1981, Publications of the Astronomical Society of the Pacific, 93, 5, doi: 10.1086/130766
- Calzetti (2001) Calzetti, D. 2001, Publications of the Astronomical Society of the Pacific, 113, 1449, doi: 10.1086/324269
- Cappellari & Copin (2003) Cappellari, M., & Copin, Y. 2003, Monthly Notices of the Royal Astronomical Society, 342, 345, doi: 10.1046/j.1365-8711.2003.06541.x
- Carniani et al. (2015) Carniani, S., Marconi, A., Maiolino, R., et al. 2015, Astronomy and Astrophysics, 580, A102, doi: 10.1051/0004-6361/201526557
- Cid Fernandes et al. (2010) Cid Fernandes, R., Stasińska, G., Schlickmann, M. S., et al. 2010, Monthly Notices of the Royal Astronomical Society, 403, 1036, doi: 10.1111/j.1365-2966.2009.16185.x
- de Vaucouleurs et al. (1991) de Vaucouleurs, G., de Vaucouleurs, A., Corwin, Herold G., J., et al. 1991, Third Reference Catalogue of Bright Galaxies
- Drissen et al. (2019) Drissen, L., Martin, T., Rousseau-Nepton, L., et al. 2019, Monthly Notices of the Royal Astronomical Society, 485, 3930, doi: 10.1093/mnras/stz627
- Fabian (2012) Fabian, A. C. 2012, Annual Review of Astronomy and Astrophysics, 50, 455, doi: 10.1146/annurev-astro-081811-125521
- Falco et al. (1999) Falco, E. E., Kurtz, M. J., Geller, M. J., et al. 1999, Publications of the Astronomical Society of the Pacific, 111, 438, doi: 10.1086/316343
- Fiore et al. (2017) Fiore, F., Feruglio, C., Shankar, F., et al. 2017, Astronomy and Astrophysics, 601, A143, doi: 10.1051/0004-6361/201629478
- Fruscione et al. (2006) Fruscione, A., McDowell, J. C., Allen, G. E., et al. 2006, in Society of Photo-Optical Instrumentation Engineers (SPIE) Conference Series, Vol. 6270, Society of Photo-Optical Instrumentation Engineers (SPIE) Conference Series, ed. D. R. Silva & R. E. Doxsey, 62701V, doi: 10.1117/12.671760
- Goulding & Alexander (2009) Goulding, A. D., & Alexander, D. M. 2009, Monthly Notices of the Royal Astronomical Society, 398, 1165, doi: 10.1111/j.1365-2966.2009.15194.x
- Grandmont et al. (2012) Grandmont, F., Drissen, L., Mandar, J., Thibault, S., & Baril, M. 2012, in Society of Photo-Optical Instrumentation Engineers (SPIE) Conference Series, Vol. 8446, Ground-based and Airborne Instrumentation for Astronomy IV, ed. I. S. McLean, S. K. Ramsay, & H. Takami, 84460U, doi: 10.1117/12.926782
- Greenawalt et al. (1998) Greenawalt, B., Walterbos, R. A. M., Thilker, D., & Hoopes, C. G. 1998, The Astrophysical Journal, 506, 135, doi: 10.1086/306232
- Harrison et al. (2014) Harrison, C. M., Alexander, D. M., Mullaney, J. R., & Swinbank, A. M. 2014, Monthly Notices of the Royal Astronomical Society, 441, 3306, doi: 10.1093/mnras/stu515
- Harvey et al. (2022) Harvey, T., Maksym, W. P., Keel, W., et al. 2022, arXiv e-prints, arXiv:2208.05915. https://arxiv.org/abs/2208.05915
- Ho et al. (1997) Ho, L. C., Filippenko, A. V., & Sargent, W. L. W. 1997, The Astrophysical Journal Supplement Series, 112, 315, doi: 10.1086/313041
- Joye & Mandel (2003) Joye, W. A., & Mandel, E. 2003, in Astronomical Society of the Pacific Conference Series, Vol. 295, Astronomical Data Analysis Software and Systems XII, ed. H. E. Payne, R. I. Jedrzejewski, & R. N. Hook, 489
- Józsa et al. (2009) Józsa, G. I. G., Garrett, M. A., Oosterloo, T. A., et al. 2009, Astronomy and Astrophysics, 500, L33, doi: 10.1051/0004-6361/200912402
- Karouzos et al. (2016) Karouzos, M., Woo, J.-H., & Bae, H.-J. 2016, The Astrophysical Journal, 833, 171, doi: 10.3847/1538-4357/833/2/171
- Kauffmann et al. (2003) Kauffmann, G., Heckman, T. M., Tremonti, C., et al. 2003, Monthly Notices of the Royal Astronomical Society, 346, 1055, doi: 10.1111/j.1365-2966.2003.07154.x
- Keel et al. (2022) Keel, W. C., Moiseev, A., Kozlova, D. V., et al. 2022, Monthly Notices of the Royal Astronomical Society, 510, 4608, doi: 10.1093/mnras/stab3656
- Keel et al. (2012) Keel, W. C., Lintott, C. J., Schawinski, K., et al. 2012, The Astronomical Journal, 144, 66, doi: 10.1088/0004-6256/144/2/66
- Keel et al. (2017) Keel, W. C., Lintott, C. J., Maksym, W. P., et al. 2017, The Astrophysical Journal, 835, 256, doi: 10.3847/1538-4357/835/2/256
- Kewley et al. (2001) Kewley, L. J., Dopita, M. A., Sutherland, R. S., Heisler, C. A., & Trevena, J. 2001, The Astrophysical Journal, 556, 121, doi: 10.1086/321545
- Lintott et al. (2009) Lintott, C. J., Schawinski, K., Keel, W., et al. 2009, Monthly Notices of the Royal Astronomical Society, 399, 129, doi: 10.1111/j.1365-2966.2009.15299.x
- Martin et al. (2015) Martin, T., Drissen, L., & Joncas, G. 2015, in Astronomical Society of the Pacific Conference Series, Vol. 495, Astronomical Data Analysis Software an Systems XXIV (ADASS XXIV), ed. A. R. Taylor & E. Rosolowsky, 327
- Martin et al. (2018) Martin, T. B., Drissen, L., & Melchior, A.-L. 2018, Monthly Notices of the Royal Astronomical Society, 473, 4130, doi: 10.1093/mnras/stx2513
- Mentuch Cooper et al. (2012) Mentuch Cooper, E., Wilson, C. D., Foyle, K., et al. 2012, The Astrophysical Journal, 755, 165, doi: 10.1088/0004-637X/755/2/165
- Mulcahy et al. (2014) Mulcahy, D. D., Horneffer, A., Beck, R., et al. 2014, Astronomy and Astrophysics, 568, A74, doi: 10.1051/0004-6361/201424187
- Osterbrock & Ferland (2006) Osterbrock, D. E., & Ferland, G. J. 2006, Astrophysics of gaseous nebulae and active galactic nuclei
- Pakull et al. (2006) Pakull, M. W., Grisé, F., & Motch, C. 2006, in Populations of High Energy Sources in Galaxies, ed. E. J. A. Meurs & G. Fabbiano, Vol. 230, 293–297, doi: 10.1017/S1743921306008489
- Rampadarath et al. (2018) Rampadarath, H., Soria, R., Urquhart, R., et al. 2018, Monthly Notices of the Royal Astronomical Society, 476, 2876, doi: 10.1093/mnras/sty390
- Rots et al. (1990) Rots, A. H., Bosma, A., van der Hulst, J. M., Athanassoula, E., & Crane, P. C. 1990, The Astronomical Journal, 100, 387, doi: 10.1086/115522
- Rousseau-Nepton et al. (2018) Rousseau-Nepton, L., Robert, C., Martin, R. P., Drissen, L., & Martin, T. 2018, Monthly Notices of the Royal Astronomical Society, 477, 4152, doi: 10.1093/mnras/sty477
- Salo & Laurikainen (2000) Salo, H., & Laurikainen, E. 2000, Monthly Notices of the Royal Astronomical Society, 319, 377, doi: 10.1046/j.1365-8711.2000.03650.x
- Sandage & Tammann (1981) Sandage, A., & Tammann, G. A. 1981, A Revised Shapley-Ames Catalog of Bright Galaxies
- Sartori et al. (2016) Sartori, L. F., Schawinski, K., Koss, M., et al. 2016, MNRAS, 457, 3629, doi: 10.1093/mnras/stw230
- Schlegel et al. (2016) Schlegel, E. M., Jones, C., Machacek, M., & Vega, L. D. 2016, The Astrophysical Journal, 823, 75, doi: 10.3847/0004-637X/823/2/75
- Schweizer et al. (2013) Schweizer, F., Seitzer, P., Kelson, D. D., Villanueva, E. V., & Walth, G. L. 2013, The Astrophysical Journal, 773, 148, doi: 10.1088/0004-637X/773/2/148
- Shankar et al. (2009) Shankar, F., Weinberg, D. H., & Miralda-Escudé, J. 2009, The Astrophysical Journal, 690, 20, doi: 10.1088/0004-637X/690/1/20
- Shen (2021) Shen, Y. 2021, The Astrophysical Journal, 921, 70, doi: 10.3847/1538-4357/ac1ce4
- Tombesi et al. (2015) Tombesi, F., Meléndez, M., Veilleux, S., et al. 2015, Nature, 519, 436, doi: 10.1038/nature14261
- Venturi et al. (2018) Venturi, G., Nardini, E., Marconi, A., et al. 2018, Astronomy and Astrophysics, 619, A74, doi: 10.1051/0004-6361/201833668
- Watkins et al. (2018) Watkins, A. E., Mihos, J. C., Bershady, M., & Harding, P. 2018, The Astrophysical Journal, 858, L16, doi: 10.3847/2041-8213/aabba1
- Wei et al. (2021) Wei, P., Zou, H., Lin, L., et al. 2021, Research in Astronomy and Astrophysics, 21, 006, doi: 10.1088/1674-4527/21/1/6
- Woo et al. (2016) Woo, J.-H., Bae, H.-J., Son, D., & Karouzos, M. 2016, The Astrophysical Journal, 817, 108, doi: 10.3847/0004-637X/817/2/108
- Xu & Wang (2022) Xu, X., & Wang, J. 2022, The Astrophysical Journal, 933, 110, doi: 10.3847/1538-4357/ac7222