The Cherenkov Telescope Array Will Test Whether Pulsars Generate the Galactic Center Gamma-Ray Excess
Abstract
The GeV-scale gamma-ray excess observed from the region surrounding the Galactic Center has been interpreted as either the products of annihilating dark matter particles, or as the emission from a large population of faint and centrally-located millisecond pulsars. If pulsars are responsible for this signal, they should also produce detectable levels of TeV-scale emission. In this study, we employ a template-based analysis of simulated data in an effort to assess the ability of the Cherenkov Telescope Array (CTA) to detect or constrain the presence of this emission, providing a new and powerful means of testing whether millisecond pulsars are responsible for the observed excess. We find that after even a relatively brief observation of the Inner Galaxy, CTA will be able to definitively detect this TeV-scale emission, or rule out pulsars as the source of the Galactic Center Gamma-Ray Excess.
I Introduction
An excess of GeV-scale gamma rays from the region surrounding the Galactic Center has been identified in the publicly available data collected by the Fermi Gamma-Ray Space Telescope Goodenough and Hooper (2009); Hooper and Goodenough (2011); Hooper and Linden (2011). The spectral shape, morphology, and intensity of this emission are each consistent with arising from the annihilation of dark matter particles. More specifically, the characteristics of this signal match those predicted from a dark matter particle with an annihilation cross section of , and that is distributed slightly more steeply around the Galactic Center than described by the canonical Navarro-Frenk-White profile, Daylan et al. (2016); Calore et al. (2015a, b); Ackermann et al. (2017); Di Mauro (2021); Cholis et al. (2022). The possibility that Fermi could be detecting dark matter annihilation products has generated a great deal of interest (see, for example, Refs. Berlin et al. (2014a); Izaguirre et al. (2014); Ipek et al. (2014); Agrawal et al. (2014); Berlin et al. (2014b); Abdullah et al. (2014); Martin et al. (2014); Alves et al. (2014); Boehm et al. (2014); Berlin et al. (2015); Karwin et al. (2017)).
The leading alternative explanation for this excess is that it is instead generated by a large population of unresolved millisecond pulsars Hooper and Goodenough (2011); Abazajian (2011); Hooper et al. (2013); Gordon and Macias (2013); Cholis et al. (2015); Hooper et al. (2013); Petrović et al. (2015); Brandt and Kocsis (2015); Hooper and Mohlabeng (2016); Hooper and Linden (2016). This possibility is motivated in large part by the fact that pulsars are the only known class of astrophysical objects that produce a gamma-ray spectrum with a shape that is similar to that of the Galactic Center Gamma-Ray Excess. As the stellar population of the Galactic Bulge consists predominantly of old stars, we expect relatively few young or middle-aged pulsars to be found in the Inner Galaxy. In contract, pulsars with millisecond-scale periods (known as millisecond pulsars, or recycled pulsars) can remain bright for billions of years, and could plausibly be more abundant in this region of the Galaxy.
The hypothesis that millisecond pulsars produce the observed gamma-ray excess was elevated substantially in 2015, when two independent groups claimed to have identified evidence that the photons constituting this excess are spatially clustered Lee et al. (2016); Bartels et al. (2016). Furthermore, it was claimed in Refs. Bartels et al. (2018a); Macias et al. (2018, 2019); Pohl et al. (2022) that this excess is not distributed with spherical symmetry around the Galactic Center (as would be expected from dark matter), but is instead correlated with the distribution of stars that make up the Galactic Bulge and Bar. If true, these results would have significantly favored the conclusion that the excess originates from a population of near-threshold astrophysical point-sources, rather than from annihilating dark matter.
The conclusions described in the previous paragraph have been strongly challenged in recent years (for a summary, see Ref. Hooper (2022)). In particular, the small scale power identified in Ref. Lee et al. (2016) was shown in Refs. Leane and Slatyer (2019, 2020a, 2020b) to be an artifact of insufficiently understood backgrounds, causing smooth signals to be mischaracterized as clumpy. Furthermore, the evidence for unresolved point sources claimed in Ref. Bartels et al. (2016) was found to disappear when the point source catalog was updated Zhong et al. (2020). Even more recently, it was shown in Refs. Di Mauro (2021) and Cholis et al. (2022) that the angular distribution of the excess emission is best fit by a spherical and dark matter-like morphology, and does not significantly correlate with any known stellar populations; the Fermi data prefers the excess to have a bulge-like morphology only when the background model provides a poor fit to the overall dataset McDermott et al. (2022). To the best of our ability to measure, the gamma-ray excess appears to be both smooth, and distributed with spherical symmetry around the Galactic Center. Furthermore, Fermi data has been used to place strong constraints on the luminosity function of any point source population that might be responsible for this signal Bartels et al. (2018b); Zhong et al. (2020); Dinsmore and Slatyer (2022), posing a significant challenge for millisecond pulsar interpretations of the gamma-ray excess.
None of the results described above preclude the possibility that the gamma-ray excess could be produced by a large population of very faint millisecond pulsars, distributed with approximate spherical symmetry around the Galactic Center. If this is the case, however, there are accompanying signals that should be present in the GeV Bartels et al. (2018b); Dinsmore and Slatyer (2022), radio Calore et al. (2016), and X-ray Haggard et al. (2017) bands. Such signals could be used to potentially constrain or confirm the hypothesis that millisecond pulsars generate the gamma-ray excess. Furthermore, observations by the High Altitude Water Cherenkov (HAWC) Observatory and the Large High Altitude Air Shower Observatory (LHAASO) have shown that young and middle-aged pulsars are typically surrounded by bright, spatially-extended, multi-TeV emitting regions known as “TeV halos” Hooper et al. (2017); Linden et al. (2017); Albert et al. (2021); Abeysekara et al. (2020). Even more recently, it has been shown (at the 99% C.L.) that millisecond pulsars also generate TeV halos Hooper and Linden (2022). If this result is robustly confirmed, it will be possible to use ground-based gamma-ray telescopes, such as the Cherenkov Telescope Array (CTA), to search for the TeV-scale emission from any millisecond pulsars that might be present near the Galactic Center. Such a measurement would provide an independent – and potentially definitive – measurement of our Inner Galaxy’s millisecond pulsar population Hooper and Linden (2018).
In this paper, we perform a template-based analysis of simulated data to assess the ability of the Cherenkov Telescope Array (CTA) to identify and measure the very high-energy gamma-ray emission from a population of millisecond pulsars that are located in the region surrounding the Galactic Center. When the intensity of this emission is normalized to the measurements of other pulsars by HAWC and LHAASO, we find that if the Galactic Center Gamma-Ray Excess originates from pulsars, this source population should produce the dominant contribution to the TeV-scale emission from the Inner Galaxy. Such a signal would be easily detectable by CTA, even after a relatively short observation of this region. We conclude that CTA will either be able to clearly identify the TeV halo emission associated with such a pulsar population, or rule out the hypothesis that the Galactic Center Gamma-Ray Excess originates from millisecond pulsars.
II Gamma-Ray Emission From TeV Halos Around Millisecond Pulsars
In 2017, observations by the HAWC Observatory identified bright, multi-TeV emission from the regions surrounding the nearby Geminga and Monogem pulsars Albert et al. (2020); Abeysekara et al. (2017a, b) (for earlier observations by Milagro, see Ref. Abdo et al. (2009)). It has since been found that similar TeV halos are present around most, if not all, young and middle-aged pulsars Linden et al. (2017); Albert et al. (2021); Sudoh et al. (2021). This emission is produced through the inverse Compton scattering of very high-energy electrons and positrons, and the intensity of the observed emission implies that of the pulsars’ total energy budget (i.e., spindown power) goes into the acceleration of such particles Hooper et al. (2017); Sudoh et al. (2021). Applying these characteristics to the larger population of pulsars, one expects TeV halos to dominate the Milky Way’s diffuse gamma-ray emission at TeV-scale energies Linden and Buckman (2018), and to contribute significantly to the isotropic gamma ray background Xu and Hooper (2022).
Until recently, it was not clear whether or not pulsars with millisecond-scale periods are also surrounded by TeV halos. Based on theoretical considerations, it was generally expected that millisecond pulsars should produce TeV-scale emission in their magnetospheres, at a level similar to that which takes place among young and middle-aged pulsars Venter et al. (2015); Bednarek et al. (2016); Venter et al. (2016). On the other hand, young and middle-aged pulsars are thought to accelerate TeV-scale electrons as they reach the termination shock, and it is not clear to what extent this might occur within millisecond pulsars Sironi and Spitkovsky (2011); Gaensler and Slane (2006). Some light was shed on these questions recently, when an analysis of publicly available HAWC data demonstrated that millisecond pulsars also generate TeV emission, with an efficiency similar to that of young and middle-aged pulsars Hooper and Linden (2022) (see also, Ref. Hooper and Linden (2018)). More specifically, that study considered 37 nearby and high-spindown power millisecond pulsars, finding (at the 99% confidence level) that these sources produce TeV-scale emission with a luminosity proportional to their spindown power. Furthermore, the efficiency of this emission was constrained to lie between 39-108% of that measured for the TeV halo associated with the middle-aged pulsar, Geminga. Future observations by telescopes including HAWC, LHAASO, and CTA should be able to confirm and further refine this conclusion, potentially confirming that millisecond pulsars have TeV halos, and also measuring the spectra, intensity, and morphology of these sources.
In calculating the gamma-ray emission from TeV halos, we adopt the following parameterization for the spectrum of the injected electrons and positrons:
| (1) |
where observations indicate that and for typical TeV halos. These particles lose energy through both inverse Compton scattering and synchrotron processes, producing emission in the gamma-ray and radio bands, respectively BLUMENTHAL and GOULD (1970). These processes lead to the following energy loss rate:
where is the Thomson cross section and
| (2) |
The sum in these expressions is carried out over the relevant components of the radiation field. In our analysis, we adopt a three component radiation model, consisting of the cosmic microwave background (CMB), infrared emission, and starlight. We treat the spectra of these radiation components as blackbodies with temperatures given by TCMB = 2.7 K, TIR = 20 K, and Tstar = 5000 K. In normalizing the infrared and starlight components, we adopt two models, with energy densities equal to and . For the energy density of the magnetic field, we adopt (corresponding to and in the max and min models, respectively.111Note that our “max” and “min” models for the radiation and magnetic fields are defined such that they maximize or minimize the resulting gamma-ray emission, respectively.
At very high energies, inverse Compton scattering takes places in the Klein-Nishina regime, leading to approximately the following degree of suppression Schlickeiser and Ruppel (2010):
| (3) |
The instantaneous spectrum of inverse Compton emission from an electron of energy, , is given by
| (4) |
where is the spectrum of the target radiation, and the differential cross section is given by Aharonian and Atoyan (1981)
| (5) | |||||
where and .
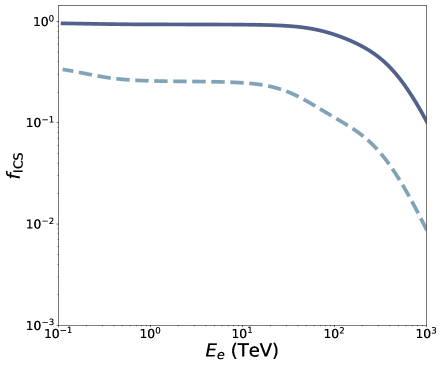
Since we are interested in the steady state inverse Compton emission produced from the Inner Galaxy’s millisecond pulsar population, we can integrate the spectrum described by Eq. 4 over the lifetime of an electron to obtain the total emission from a single injected electron. In performing this calculation, we take into account the energy that is lost to synchrotron, as shown in Fig. 1. We then integrate this result over the spectrum of injected electrons, as parameterized in Eq. 1, to obtain the spectrum of inverse Compton emission that is generated per unit energy injected from millisecond pulsars in the form of very high-energy electrons and positrons.
From this spectrum of the inverse Compton emission per unit of leptonic power, , we can calculate the spectrum and angular distribution of the gamma-ray emission from the Inner Galaxy’s millisecond pulsar population:
| (6) |
The integrals in this expression are performed over a given angular bin, , and over the line-of-sight, . The quantity, , is the average spindown power per millisecond pulsar, and is the average fraction of the spindown power that goes into the production of electrons and positrons with . For the spatial distribution of millisecond pulsars, we adopt , where is the distance from the Galactic Center. This profile was selected because it provides provides a good fit to the observed morphology of the Galactic Center Gamma-Ray Excess Daylan et al. (2016); Calore et al. (2015a, b); Ackermann et al. (2017); Di Mauro (2021); Cholis et al. (2022).
The gamma-ray and radio emission from millisecond pulsars is powered by the loss of rotational kinetic energy, and thus the energy budget of such an object is set by its spindown power, , where and are the pulsar’s moment of inertia and period. In Ref. Hooper and Linden (2018), the contents of the Fermi pulsar catalog Abdo et al. (2013) were used to estimate the efficiency at which millisecond pulsars produce GeV-scale emission, finding that such objects produce an average luminosity in the GeV-band (i.e., integrated above 0.1 GeV) equal to times their spindown power. This quantity, however, does not take into account the fact that some pulsars have beams which are not aligned in our direction. Combining these factors, the luminosity of the GeV-scale emission from the Inner Galaxy’s millisecond pulsar population can be expressed as follows:
| (7) |
where is the fraction of millisecond pulsars whose gamma-ray beam is pointed in the direction of Earth, and is the sum of the spindown power of all of the millisecond pulsars in a given region of the Inner Galaxy. Comparing this to the intensity of the Galactic Center Gamma-Ray Excess observed within a radius around the Galactic Center, (), we can determine the total spindown power of the pulsar population required to accommodate , as a function of and . From this total spindown power and the TeV halo efficiency, , the intensity of the TeV halo emission from the Inner Galaxy’s millisecond pulsar population will be equal to
| (8) |
where is the fraction of the Galactic Center Gamma-Ray Excess that is generated by millisecond pulsars.
III Observations With The Cherenkov Telescope Array
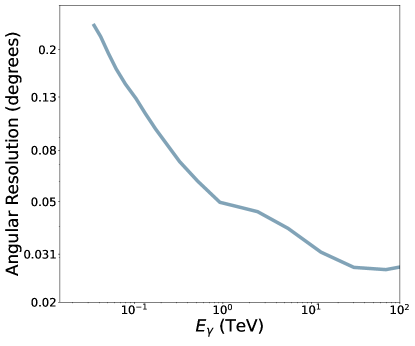
The Cherenkov Telescope Array (CTA) is a next-generation ground-based gamma-ray telescope, designed to be sensitive to photons in the energy range of 20 GeV to 300 TeV Maier (2019). Although CTA will occupy two sites, we will focus here on the southern hemisphere array, located in Paranal, Chile. This southern array will consist of 14 medium-sized and 37 small-sized telescopes, covering an area of approximately 4 km2. This instrument is expected to have angular resolution on the order of two arcminutes, and energy resolution better than 10%.
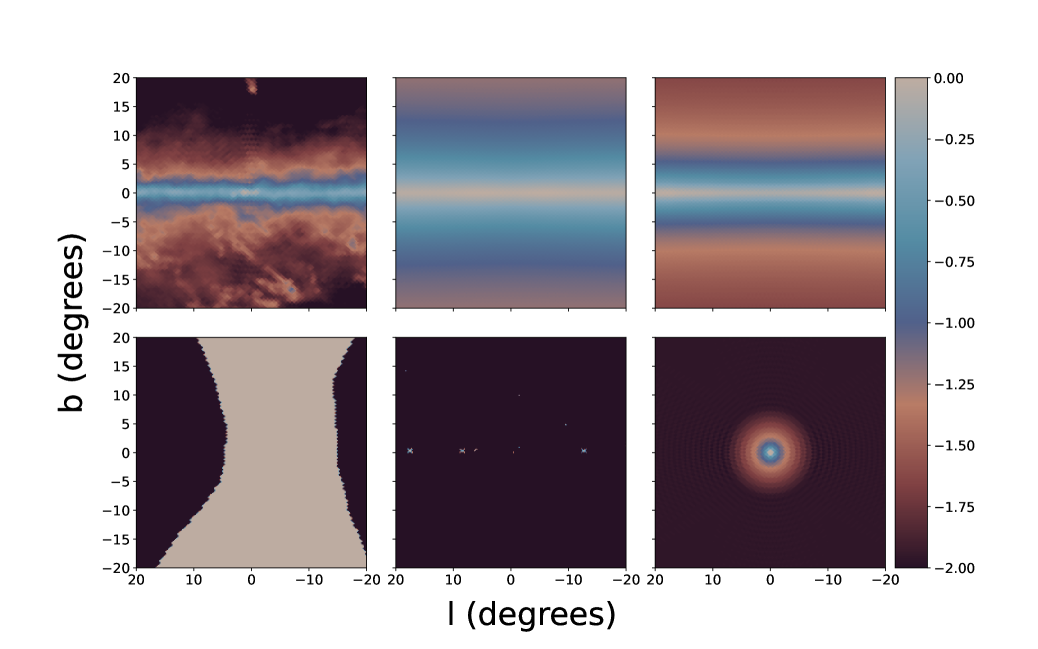
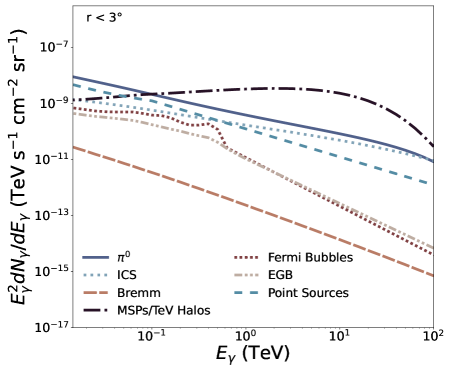
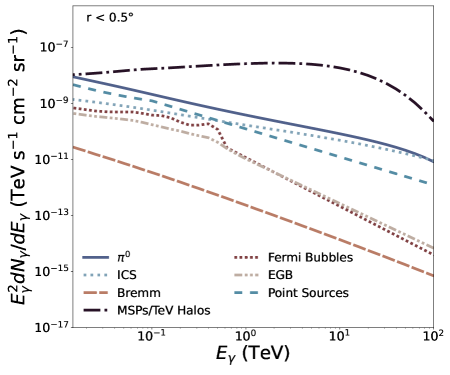
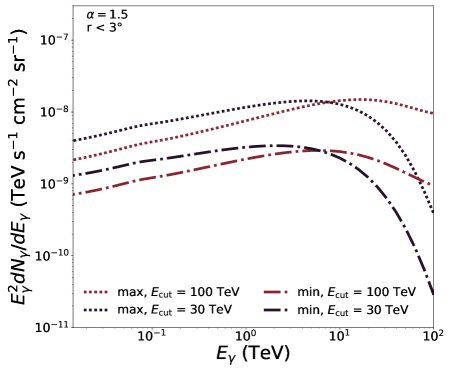
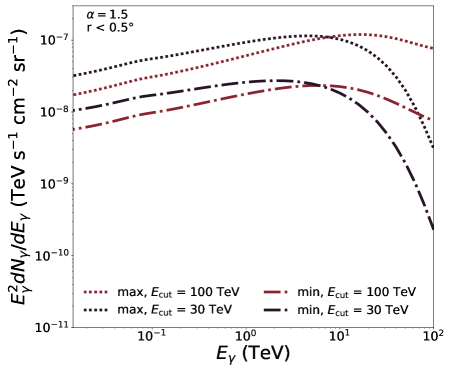
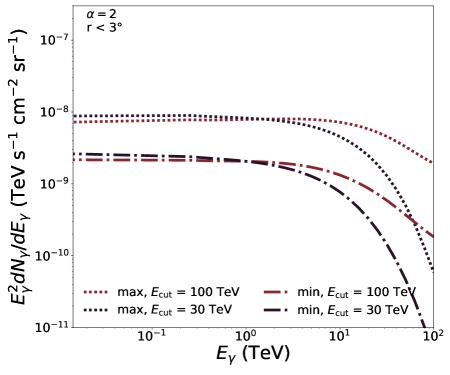
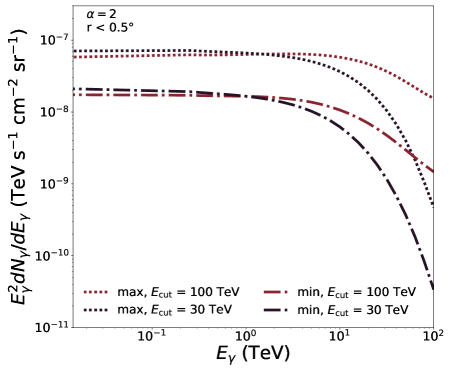
To evaluate the sensitivity of CTA to a population of TeV halos associated with millisecond pulsars in the Inner Galaxy, we have created a series of simulated data sets based on the proposed design of CTA, and analyzed this simulated data utilizing a set of spatial templates. Such template-based analyses are extremely powerful in that they allow us to simultaneously exploit both spectral and morphological distinctions between the signal being searched for, and the various astrophysical backgrounds that are present. In addition to the TeV halo template, our analysis includes spatial templates associated with the processes of pion production, bremsstrahlung, and (non-TeV halo) inverse Compton scattering, as well a template for the point sources described by the Fermi 4FGL-DR2 catalog Abdollahi et al. (2020), and a template that is isotropic throughout our region-of-interest (a radius circle centered on the Galactic Center) which accounts for the emission associated with the Fermi Bubbles Ackermann et al. (2014) and the extragalactic gamma-ray background Ackermann et al. (2015), as well as misidentified cosmic rays.222For the rate and spectrum of misidentified cosmic-ray, we use the background rate given at https://www.cta-observatory.org/science/ctao-performance/ for CTA’s Southern Array. Note that this background significantly exceeds those associated with the Fermi Bubbles and the extragalactic gamma-ray background. The templates associated with pion production, bremsstrahlung, and inverse Compton scattering were each generated using the publicly available code, GALPROP Vladimirov et al. (2011); Górski et al. (2005).333In using GALPROP, we have adopted the default parameters from GALPROP WebRun, https://galprop.stanford.edu/webrun.php, which have been selected to reproduce a wide variety of cosmic-ray and gamma-ray observations. These templates are shown in Fig. 2, and the gamma-ray spectrum associated with each of these components is shown in Fig. 3. In Fig. 4, we show the spectrum associated with the TeV halo template for a selection of different parameter choices. Note that in modeling the emission associated with the Fermi bubbles, point sources, and the extragalactic gamma-ray background, we are forced to extrapolate to energies well above those measured by Fermi, as shown in Fig. 3.
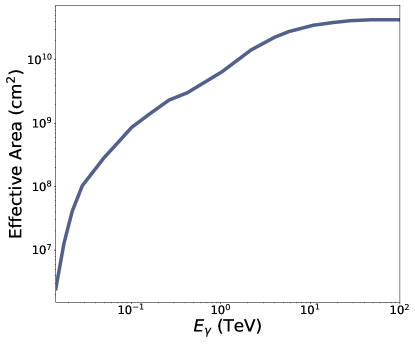
To produce a simulated data set, we first convolve each of the templates by the point spread function of CTA, which we treat as a gaussian with a 68% containment radius as given in the left frame of Fig. 5 Maier et al. (2019). Because of CTA’s very high angular resolution, this convolution has very little effect on our results. We divide our region-of-interest (taken to be a radius circle around the Galactic Center) into 0.2098 square degree HEALPix bins, corresponding to . We also divide the spectrum into 10 energy bins per decade, spanning 10 GeV to 100 TeV. Then, after summing the templates described above, we calculate the mean number of events in a given angular and energy bin. This is done by multiplying the flux in that bin by the effective area of CTA (as given in the right frame of Fig. 5) Maier et al. (2019), and by 20 hours of observation time. For each bin, we then draw from a Poisson distribution using the mean number of events predicted by our model to obtain the simulated number of events in that bin. Using a simulated data set, we then calculate the likelihood as a function of our model’s parameters. These parameters consist of the normalizations of each of our templates, in each energy bin. This procedure allows us to place constraints on the spectra of each of our background components, as well as on the spectrum of the emission from TeV halos associated with millisecond pulsars. In presenting our projected constraints, we show results as averaged over five sets of simulated data, to reduce the presence of statistical variation.444We use the publicly available MINUIT algorithm Dembinski and et al. (2020) to perform our likelihood analysis. Given that MINUIT can occasionally identify false minima of the likelihood landscape, we also utilize the PyMultiNest package Buchner et al. (2014) to test the robustness of our results by searching for the global minimum in case it was not encountered in our MINUIT scan.
IV Projected Sensitivity
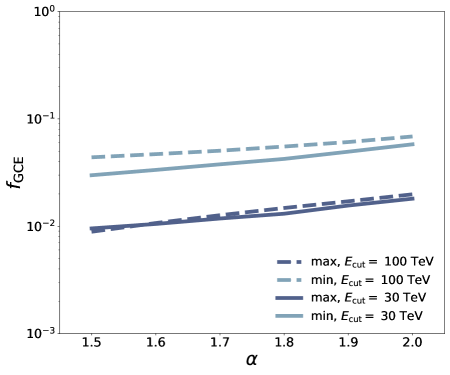


We begin by generating a series of simulated data sets under the assumption that no TeV halos are present in the Inner Galaxy. We then perform our template analysis on this simulated data to place constraints on the TeV halo population. More specifically, we place an upper limit on the quantity, , as a function of and . Equivalently, we can use Eq. 8 to instead express this result as an upper limit on the fraction of the Galactic Center Gamma-Ray Excess that is generated by millisecond pulsars, , for a given choice of .
The main result from this first analysis is shown in Fig. 6, where we plot the upper limit on , for the case of . From this figure, we conclude that if no TeV halo emission is present in the Inner Galaxy, we can expect CTA to place an extremely stringent constraint on the fraction of the Galactic Center Gamma-Ray Excess that is generated by millisecond pulsars, at a level of approximately . This projected limit is able to be so restrictive simply because the emission from the TeV halo population is incredibly bright in this case. This is illustrated in the spectra shown in Figs. 3 and 4, as well as in Fig. 7, where we show a sky map of the gamma-ray intensity in the Inner Galaxy above 0.1 TeV for the case of our background model, and for our background model plus the TeV halo emission, normalized to or 0.2 for . The presence of TeV halos in the Inner Galaxy dramatically changes the morphology and spectrum of the very high-energy gamma-ray emission from this region, and should be easily detectable after even a brief observation by CTA.
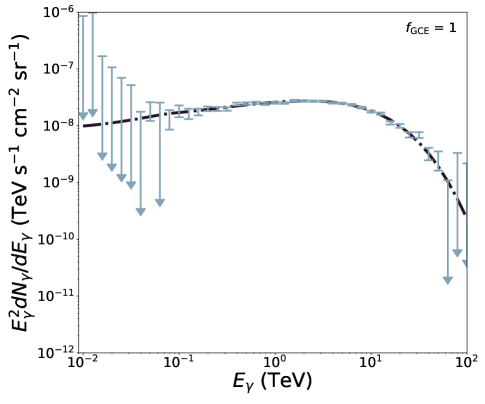
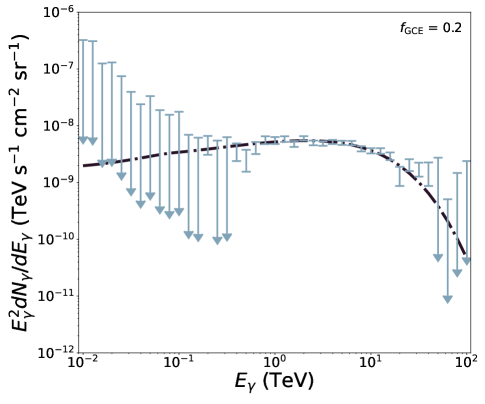
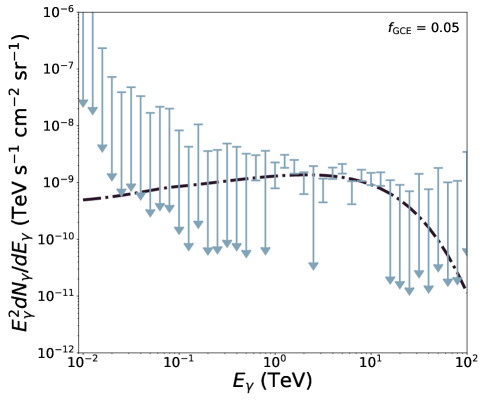
For our second analysis, we have generated a series of simulated data sets assuming that TeV halos are present in the Inner Galaxy. The ability of CTA to measure the spectrum of the gamma-ray emission from these Inner Galaxy TeV halos is shown in Fig. 8, for values of , or 0.05 (and in each case adopting , , , , , and our “min” model for the radiation and magnetic fields). Note that these figures depict the results of an individual simulated data set, explaining the bin-to-bin variations seen in the projected error bars. These results demonstrate that CTA should be able to clearly identify and measure the gamma-ray emission from a centrally-located TeV halo population, even if only a relatively small fraction of the Galactic Center Gamma-Ray is generated by millisecond pulsars.
V Discussion
Measurements of the very high-energy gamma-ray emission from the Inner Galaxy have already been reported by the HESS Collaboration Abramowski et al. (2016). That study, however, produced spectra only from the innermost around the Galactic Center. In that region, the observed emission is approximately equal to that expected from TeV halos in a scenario in which the entire Galactic Center Gamma-Ray Excess originates from millisecond pulsars Hooper and Linden (2018) (see also, Ref. Hooper et al. (2018)). This information allows us to place an upper limit of roughly on our TeV halo/MSP parameters. Furthermore, it has been argued by the HESS Collaboration that this emission is correlated with the observed distribution of molecular gas, suggesting a hadronic origin Abramowski et al. (2016), and thereby further limiting how much of this emission could originate from TeV halos. With CTA’s greater sensitivity and larger field-of-view, it should be possible to rigorously test this interpretation, in particular by measuring the spectrum and intensity of the gamma-ray emission from the regions several degrees north or south of the Galactic Center.
A number of assumptions have gone into our analysis which could potentially impact our conclusions. First, we have assumed that the emission from TeV halos has the same angular distribution as that from the GeV-scale emission from MSPs (and thus traces the morphology of the Galactic Center Gamma-Ray Excess). The transport of electrons and positrons could, however, broaden the TeV halo signal, at least in principle. The TeV halos observed by HAWC are extended on scales of roughly 20-30 pc, corresponding to an angular extent of for sources located near the Galactic Center. This has motivated our choice for the size of the angular bins used in our study, 0.2098 square degrees, which is slightly larger than the size of a typical TeV halo, limiting the impact of particle transport on our signal. At this time, however, it has not yet been established whether diffusion is inhibited within the volumes surrounding MSPs, as it is observed to be around young and middle-aged pulsars Evoli et al. (2018); Fang et al. (2019). If diffusion is more efficient around MSPs, the signal of these TeV halos could be broadened by up to , while still leaving the total flux of gamma-ray emission from these sources approximately unchanged. Future measurements of the TeV halos surrounding nearby MSPs will inform the shape of our TeV halo template.
Second, if the magnetic fields are very large in the Inner Galaxy, most of the energy injected into very high-energy electron-positron pairs could emitted as synchrotron emission, rather than as inverse Compton, suppressing the signal at TeV-scale energies. While this is unlikely to be an important factor over most of our region-of-interest, it could be significant in the innermost volume around the Galactic Center, where magnetic fields could potentially be quite large. This scenario, however, is limited by radio observations of the Inner Galaxy Crocker et al. (2010). If millisecond pulsars generate all or most of the Galactic Center Gamma-Ray Excess, their TeV halos will produce electrons and positrons which lose most of the energy to inverse Compton scattering Hooper and Linden (2018).
Third, throughout this study, we have scaled our results to . As the predicted intensity of the TeV halo emission scales with this combination of parameters, our constraints would be less stringent if the true value of were significantly smaller than our default value. Fortunately, CTA should be able to measure the value (or distribution) of across a large number of pulsars, including many with millisecond-scale periods, reducing this uncertainty considerably. In light of this, we expect that the uncertainty on will not qualitatively impact our conclusions.
Lastly, while the conclusions reached in this study are in broad agreement with those presented in Ref. Macias et al. (2021), that paper’s projections for CTA’s sensitivity to a centrally-located TeV halo population are somewhat more modest than those reported here. While the precise origin of this difference is not entirely clear, we note that the authors of Ref. Macias et al. (2021) have adopted a model for the gamma-ray emission associated with the Fermi Bubbles that significantly increases in brightness at low galactic latitudes. In contrast, we have used the fact that the brightness of the Bubbles is approximately uniform between Ackermann et al. (2014) to motivate the assumption that this emission is comparably bright at . Regardless of this distinction, both groups reach the same conclusion that CTA should be able to clearly identify the emission associated from TeV halos if the Galactic Center Gamma-Ray Excess originates from millisecond pulsars.
VI Summary and Conclusions
The Galactic Center Gamma-Ray Excess, as observed by Fermi, has a spectrum, angular distribution, and overall intensity that is in good agreement with that expected to be produced by annihilating dark matter particles. The leading alternative to this interpretation is that this signal is instead generated by a large number of unresolved millisecond pulsars. If millisecond pulsars are responsible for this signal, however, they should also produce detectable levels of TeV-scale emission, as recent observations indicate that pulsars appear to be universally surrounded by bright, spatially-extended, multi-TeV emitting regions known as “TeV halos”.
In this study, we have performed a template-based analysis of simulated data to assess the ability of the Cherenkov Telescope Array (CTA) to identify and measure the very high-energy gamma-ray emission from a population of millisecond pulsars surrounding the Galactic Center. When the intensity of this emission is normalized to the measurements of other pulsars by HAWC and LHAASO, we find that if the Galactic Center Gamma-Ray Excess originates from pulsars, this source population should produce a very bright flux of gamma rays, dominating the total TeV-scale emission from the direction of the Inner Galaxy. Such a signal would be easily detectable by CTA, even after a relatively brief period of observation. If such a pulsar population is present in the Inner Galaxy, we conclude that CTA should be able to clearly identify the TeV halo emission associated with these sources. If this emission is not observed by CTA, this would strongly rule out the hypothesis that the Galactic Center Gamma-Ray Excess originates from millisecond pulsars.
Acknowledgements.
CK is supported by the National Science Foundation Graduate Research Fellowship Program under grant No. DGE-1746045, and by the U.S. Department of Energy Office of Science Graduate Student Research (SCGSR) program under contract number DE‐SC0014664. DH is supported by the Fermi Research Alliance, LLC under Contract No. DE-AC02-07CH11359 with the U.S. Department of Energy, Office of Science, Office of High Energy Physics. TL is partially supported by the Swedish Research Council under contract 2019-05135, the Swedish National Space Agency under contract 117/19 and the European Research Council under grant 742104. CK would like to thank Elyssa Cotter for helpful conversations.References
- Goodenough and Hooper (2009) L. Goodenough and D. Hooper, (2009), arXiv:0910.2998 [hep-ph] .
- Hooper and Goodenough (2011) D. Hooper and L. Goodenough, Phys. Lett. B 697, 412 (2011), arXiv:1010.2752 [hep-ph] .
- Hooper and Linden (2011) D. Hooper and T. Linden, Phys. Rev. D 84, 123005 (2011), arXiv:1110.0006 [astro-ph.HE] .
- Daylan et al. (2016) T. Daylan, D. P. Finkbeiner, D. Hooper, T. Linden, S. K. N. Portillo, N. L. Rodd, and T. R. Slatyer, Phys. Dark Univ. 12, 1 (2016), arXiv:1402.6703 [astro-ph.HE] .
- Calore et al. (2015a) F. Calore, I. Cholis, and C. Weniger, JCAP 03, 038 (2015a), arXiv:1409.0042 [astro-ph.CO] .
- Calore et al. (2015b) F. Calore, I. Cholis, C. McCabe, and C. Weniger, Phys. Rev. D 91, 063003 (2015b), arXiv:1411.4647 [hep-ph] .
- Ackermann et al. (2017) M. Ackermann et al. (Fermi-LAT), Astrophys. J. 840, 43 (2017), arXiv:1704.03910 [astro-ph.HE] .
- Di Mauro (2021) M. Di Mauro, Phys. Rev. D 103, 063029 (2021), arXiv:2101.04694 [astro-ph.HE] .
- Cholis et al. (2022) I. Cholis, Y.-M. Zhong, S. D. McDermott, and J. P. Surdutovich, Phys. Rev. D 105, 103023 (2022), arXiv:2112.09706 [astro-ph.HE] .
- Berlin et al. (2014a) A. Berlin, D. Hooper, and S. D. McDermott, Phys. Rev. D 89, 115022 (2014a), arXiv:1404.0022 [hep-ph] .
- Izaguirre et al. (2014) E. Izaguirre, G. Krnjaic, and B. Shuve, Phys. Rev. D 90, 055002 (2014), arXiv:1404.2018 [hep-ph] .
- Ipek et al. (2014) S. Ipek, D. McKeen, and A. E. Nelson, Phys. Rev. D 90, 055021 (2014), arXiv:1404.3716 [hep-ph] .
- Agrawal et al. (2014) P. Agrawal, B. Batell, D. Hooper, and T. Lin, Phys. Rev. D 90, 063512 (2014), arXiv:1404.1373 [hep-ph] .
- Berlin et al. (2014b) A. Berlin, P. Gratia, D. Hooper, and S. D. McDermott, Phys. Rev. D 90, 015032 (2014b), arXiv:1405.5204 [hep-ph] .
- Abdullah et al. (2014) M. Abdullah, A. DiFranzo, A. Rajaraman, T. M. P. Tait, P. Tanedo, and A. M. Wijangco, Phys. Rev. D 90, 035004 (2014), arXiv:1404.6528 [hep-ph] .
- Martin et al. (2014) A. Martin, J. Shelton, and J. Unwin, Phys. Rev. D 90, 103513 (2014), arXiv:1405.0272 [hep-ph] .
- Alves et al. (2014) A. Alves, S. Profumo, F. S. Queiroz, and W. Shepherd, Phys. Rev. D 90, 115003 (2014), arXiv:1403.5027 [hep-ph] .
- Boehm et al. (2014) C. Boehm, M. J. Dolan, C. McCabe, M. Spannowsky, and C. J. Wallace, JCAP 05, 009 (2014), arXiv:1401.6458 [hep-ph] .
- Berlin et al. (2015) A. Berlin, S. Gori, T. Lin, and L.-T. Wang, Phys. Rev. D 92, 015005 (2015), arXiv:1502.06000 [hep-ph] .
- Karwin et al. (2017) C. Karwin, S. Murgia, T. M. P. Tait, T. A. Porter, and P. Tanedo, Phys. Rev. D 95, 103005 (2017), arXiv:1612.05687 [hep-ph] .
- Abazajian (2011) K. N. Abazajian, JCAP 03, 010 (2011), arXiv:1011.4275 [astro-ph.HE] .
- Hooper et al. (2013) D. Hooper, I. Cholis, T. Linden, J. Siegal-Gaskins, and T. Slatyer, Phys. Rev. D 88, 083009 (2013), arXiv:1305.0830 [astro-ph.HE] .
- Gordon and Macias (2013) C. Gordon and O. Macias, Phys. Rev. D 88, 083521 (2013), [Erratum: Phys.Rev.D 89, 049901 (2014)], arXiv:1306.5725 [astro-ph.HE] .
- Cholis et al. (2015) I. Cholis, D. Hooper, and T. Linden, JCAP 06, 043 (2015), arXiv:1407.5625 [astro-ph.HE] .
- Petrović et al. (2015) J. Petrović, P. D. Serpico, and G. Zaharijas, JCAP 02, 023 (2015), arXiv:1411.2980 [astro-ph.HE] .
- Brandt and Kocsis (2015) T. D. Brandt and B. Kocsis, Astrophys. J. 812, 15 (2015), arXiv:1507.05616 [astro-ph.HE] .
- Hooper and Mohlabeng (2016) D. Hooper and G. Mohlabeng, JCAP 03, 049 (2016), arXiv:1512.04966 [astro-ph.HE] .
- Hooper and Linden (2016) D. Hooper and T. Linden, JCAP 08, 018 (2016), arXiv:1606.09250 [astro-ph.HE] .
- Lee et al. (2016) S. K. Lee, M. Lisanti, B. R. Safdi, T. R. Slatyer, and W. Xue, Phys. Rev. Lett. 116, 051103 (2016), arXiv:1506.05124 [astro-ph.HE] .
- Bartels et al. (2016) R. Bartels, S. Krishnamurthy, and C. Weniger, Phys. Rev. Lett. 116, 051102 (2016), arXiv:1506.05104 [astro-ph.HE] .
- Bartels et al. (2018a) R. Bartels, E. Storm, C. Weniger, and F. Calore, Nature Astron. 2, 819 (2018a), arXiv:1711.04778 [astro-ph.HE] .
- Macias et al. (2018) O. Macias, C. Gordon, R. M. Crocker, B. Coleman, D. Paterson, S. Horiuchi, and M. Pohl, Nature Astron. 2, 387 (2018), arXiv:1611.06644 [astro-ph.HE] .
- Macias et al. (2019) O. Macias, S. Horiuchi, M. Kaplinghat, C. Gordon, R. M. Crocker, and D. M. Nataf, JCAP 09, 042 (2019), arXiv:1901.03822 [astro-ph.HE] .
- Pohl et al. (2022) M. Pohl, O. Macias, P. Coleman, and C. Gordon, Astrophys. J. 929, 136 (2022), arXiv:2203.11626 [astro-ph.HE] .
- Hooper (2022) D. Hooper, in 14th International Workshop on the Identification of Dark Matter 2022 (2022) arXiv:2209.14370 [astro-ph.HE] .
- Leane and Slatyer (2019) R. K. Leane and T. R. Slatyer, Phys. Rev. Lett. 123, 241101 (2019), arXiv:1904.08430 [astro-ph.HE] .
- Leane and Slatyer (2020a) R. K. Leane and T. R. Slatyer, Phys. Rev. D 102, 063019 (2020a), arXiv:2002.12371 [astro-ph.HE] .
- Leane and Slatyer (2020b) R. K. Leane and T. R. Slatyer, Phys. Rev. Lett. 125, 121105 (2020b), arXiv:2002.12370 [astro-ph.HE] .
- Zhong et al. (2020) Y.-M. Zhong, S. D. McDermott, I. Cholis, and P. J. Fox, Phys. Rev. Lett. 124, 231103 (2020), arXiv:1911.12369 [astro-ph.HE] .
- McDermott et al. (2022) S. D. McDermott, Y.-M. Zhong, and I. Cholis, (2022), arXiv:2209.00006 [astro-ph.HE] .
- Bartels et al. (2018b) R. Bartels, D. Hooper, T. Linden, S. Mishra-Sharma, N. L. Rodd, B. R. Safdi, and T. R. Slatyer, Phys. Dark Univ. 20, 88 (2018b), arXiv:1710.10266 [astro-ph.HE] .
- Dinsmore and Slatyer (2022) J. T. Dinsmore and T. R. Slatyer, JCAP 06, 025 (2022), arXiv:2112.09699 [astro-ph.HE] .
- Calore et al. (2016) F. Calore, M. Di Mauro, F. Donato, J. W. T. Hessels, and C. Weniger, Astrophys. J. 827, 143 (2016), arXiv:1512.06825 [astro-ph.HE] .
- Haggard et al. (2017) D. Haggard, C. Heinke, D. Hooper, and T. Linden, JCAP 05, 056 (2017), arXiv:1701.02726 [astro-ph.HE] .
- Hooper et al. (2017) D. Hooper, I. Cholis, T. Linden, and K. Fang, Phys. Rev. D 96, 103013 (2017), arXiv:1702.08436 [astro-ph.HE] .
- Linden et al. (2017) T. Linden, K. Auchettl, J. Bramante, I. Cholis, K. Fang, D. Hooper, T. Karwal, and S. W. Li, Phys. Rev. D 96, 103016 (2017), arXiv:1703.09704 [astro-ph.HE] .
- Albert et al. (2021) A. Albert et al. (HAWC), Astrophys. J. Lett. 911, L27 (2021), arXiv:2101.07895 [astro-ph.HE] .
- Abeysekara et al. (2020) A. U. Abeysekara et al. (HAWC), Phys. Rev. Lett. 124, 021102 (2020), arXiv:1909.08609 [astro-ph.HE] .
- Hooper and Linden (2022) D. Hooper and T. Linden, Phys. Rev. D 105, 103013 (2022), arXiv:2104.00014 [astro-ph.HE] .
- Hooper and Linden (2018) D. Hooper and T. Linden, Phys. Rev. D 98, 043005 (2018), arXiv:1803.08046 [astro-ph.HE] .
- Albert et al. (2020) A. Albert et al. (HAWC), Astrophys. J. 905, 76 (2020), arXiv:2007.08582 [astro-ph.HE] .
- Abeysekara et al. (2017a) A. U. Abeysekara et al., Astrophys. J. 843, 40 (2017a), arXiv:1702.02992 [astro-ph.HE] .
- Abeysekara et al. (2017b) A. U. Abeysekara et al. (HAWC), Science 358, 911 (2017b), arXiv:1711.06223 [astro-ph.HE] .
- Abdo et al. (2009) A. A. Abdo et al., Astrophys. J. Lett. 700, L127 (2009), [Erratum: Astrophys.J.Lett. 703, L185 (2009), Erratum: Astrophys.J. 703, L185 (2009)], arXiv:0904.1018 [astro-ph.HE] .
- Sudoh et al. (2021) T. Sudoh, T. Linden, and D. Hooper, JCAP 08, 010 (2021), arXiv:2101.11026 [astro-ph.HE] .
- Linden and Buckman (2018) T. Linden and B. J. Buckman, Phys. Rev. Lett. 120, 121101 (2018), arXiv:1707.01905 [astro-ph.HE] .
- Xu and Hooper (2022) F. Xu and D. Hooper, Phys. Rev. D 106, 023005 (2022), arXiv:2111.03646 [astro-ph.HE] .
- Venter et al. (2015) C. Venter, A. Kopp, A. K. Harding, P. L. Gonthier, and I. Büsching, Astrophys. J. 807, 130 (2015), arXiv:1506.01211 [astro-ph.HE] .
- Bednarek et al. (2016) W. Bednarek, J. Sitarek, and T. Sobczak, Mon. Not. Roy. Astron. Soc. 458, 1083 (2016), arXiv:1602.03629 [astro-ph.HE] .
- Venter et al. (2016) C. Venter, A. Kopp, A. K. Harding, P. L. Gonthier, and I. Büsching, PoS ICRC2015, 462 (2016), arXiv:1508.04676 [astro-ph.HE] .
- Sironi and Spitkovsky (2011) L. Sironi and A. Spitkovsky, Astrophys. J. 741, 39 (2011), arXiv:1107.0977 [astro-ph.HE] .
- Gaensler and Slane (2006) B. M. Gaensler and P. O. Slane, Ann. Rev. Astron. Astrophys. 44, 17 (2006), arXiv:astro-ph/0601081 .
- BLUMENTHAL and GOULD (1970) G. R. BLUMENTHAL and R. J. GOULD, Rev. Mod. Phys. 42, 237 (1970).
- Schlickeiser and Ruppel (2010) R. Schlickeiser and J. Ruppel, New Journal of Physics 12, 033044 (2010), arXiv:0908.2183 [astro-ph.HE] .
- Aharonian and Atoyan (1981) F. A. Aharonian and A. M. Atoyan, Phys. Lett. B 99, 301 (1981).
- Vladimirov et al. (2011) A. E. Vladimirov, S. W. Digel, G. Jóhannesson, P. F. Michelson, I. V. Moskalenko, P. L. Nolan, E. Orlando, T. A. Porter, and A. W. Strong, Computer Physics Communications 182, 1156 (2011), arXiv:1008.3642 [astro-ph.HE] .
- Górski et al. (2005) K. M. Górski, E. Hivon, A. J. Banday, B. D. Wandelt, F. K. Hansen, M. Reinecke, and M. Bartelmann, Astrophys. J. 622, 759 (2005), arXiv:astro-ph/0409513 [astro-ph] .
- Ackermann et al. (2014) M. Ackermann et al. (Fermi-LAT), Astrophys. J. 793, 64 (2014), arXiv:1407.7905 [astro-ph.HE] .
- Abdollahi et al. (2020) S. Abdollahi et al. (Fermi-LAT), Astrophys. J. Suppl. 247, 33 (2020), arXiv:1902.10045 [astro-ph.HE] .
- Abdo et al. (2013) A. A. Abdo et al. (Fermi-LAT), Astrophys. J. Suppl. 208, 17 (2013), arXiv:1305.4385 [astro-ph.HE] .
- Ackermann et al. (2015) M. Ackermann et al. (Fermi-LAT), Astrophys. J. 799, 86 (2015), arXiv:1410.3696 [astro-ph.HE] .
- Maier et al. (2019) G. Maier, L. Arrabito, K. Bernlöhr, J. Bregeon, P. Cumani, T. Hassan, J. Hinton, and A. Moralejo, “Performance of the cherenkov telescope array,” (2019).
- Maier (2019) G. Maier, in 36th International Cosmic Ray Conference (ICRC2019), International Cosmic Ray Conference, Vol. 36 (2019) p. 733, arXiv:1907.08171 [astro-ph.IM] .
- Dembinski and et al. (2020) H. Dembinski and P. O. et al., (2020), 10.5281/zenodo.3949207.
- Buchner et al. (2014) J. Buchner, A. Georgakakis, K. Nandra, L. Hsu, C. Rangel, M. Brightman, A. Merloni, M. Salvato, J. Donley, and D. Kocevski, Astron. Astrophys. 564, A125 (2014), arXiv:1402.0004 [astro-ph.HE] .
- Abramowski et al. (2016) A. Abramowski et al. (H.E.S.S.), Nature 531, 476 (2016), arXiv:1603.07730 [astro-ph.HE] .
- Hooper et al. (2018) D. Hooper, I. Cholis, and T. Linden, Phys. Dark Univ. 21, 40 (2018), arXiv:1705.09293 [astro-ph.HE] .
- Evoli et al. (2018) C. Evoli, T. Linden, and G. Morlino, Phys. Rev. D 98, 063017 (2018), arXiv:1807.09263 [astro-ph.HE] .
- Fang et al. (2019) K. Fang, X.-J. Bi, and P.-F. Yin, Mon. Not. Roy. Astron. Soc. 488, 4074 (2019), arXiv:1903.06421 [astro-ph.HE] .
- Crocker et al. (2010) R. M. Crocker, D. Jones, F. Melia, J. Ott, and R. J. Protheroe, Nature 468, 65 (2010), arXiv:1001.1275 [astro-ph.GA] .
- Macias et al. (2021) O. Macias, H. van Leijen, D. Song, S. Ando, S. Horiuchi, and R. M. Crocker, Mon. Not. Roy. Astron. Soc. 506, 1741 (2021), arXiv:2102.05648 [astro-ph.HE] .