Triangulating Python Performance Issues with Scalene
Abstract
This paper proposes Scalene, a profiler specialized for Python. Scalene combines a suite of innovations to precisely and simultaneously profile CPU, memory, and GPU usage, all with low overhead. Scalene’s CPU and memory profilers help Python programmers direct their optimization efforts by distinguishing between inefficient Python and efficient native execution time and memory usage. Scalene’s memory profiler employs a novel sampling algorithm that lets it operate with low overhead yet high precision. It also incorporates a novel algorithm that automatically pinpoints memory leaks, whether within Python or across the Python-native boundary. Scalene tracks a new metric called copy volume, which highlights costly copying operations that can occur when Python silently converts between C and Python data representations, or between CPU and GPU. Since its introduction, Scalene has been widely adopted, with over 500,000 downloads to date. We present experience reports from developers who used Scalene to achieve significant performance improvements and memory savings.
1 Introduction
Python is now one firmly established as one of the most popular programming languages, with first place rankings from TIOBE [43] and IEEE Spectrum [6], second place on the Redmonk Rankings [24], and fourth place in the 2022 Stack Overflow Developer Survey [39]. Large-scale industrial users of Python include Dropbox [4], Facebook [18], Instagram [15], Netflix [22], Spotify [48], and YouTube [45].
At the same time, Python is (in)famously slow. The standard Python implementation, known as CPython, is a stack-based bytecode interpreter written in C [49]. Pure Python code typically runs 1–2 orders of magnitude slower than native code. As an extreme example, the Python implementation of matrix-matrix multiplication takes more than as long as the native BLAS version.
Python’s performance costs are nearly matched by its high memory overhead. Python data types consume dramatically more memory than their native counterparts. For example, the integer 1 consumes 4 bytes in C, but 28 bytes in Python; "a" consumes 2 bytes in C, but 50 bytes in Python. This increased space demand is primarily due to metadata that Python maintains for every object, including reference counts and dynamic type information. Python is also a garbage collected language; because garbage collection delays memory reclamation, it can further increase the amount of memory consumed compared to native code [14].
Because of these costs, one of the most effective ways for Python programmers to optimize their code is to identify performance-critical and/or memory-intensive code that uses pure Python, and replace it with native libraries. Python’s ecosystem includes numerous high-performance packages with native implementations, which are arguably the key driver of its adoption and popularity. These libraries include the NumPy numeric library [25], the machine learning libraries SciKit-Learn [29] and TensorFlow [2, 3], among many others. By writing code that makes effective use of these packages, Python programmers can sidestep Python’s space and time costs, and at the same time take full advantage of underlying hardware resources like multiple cores, vector instructions, and GPUs.
Unfortunately, past Python profilers—which can be viewed as ports of traditional profilers for native code—fail to meet this challenge. While the approaches they embody are satisfactory for profiling native code, they fall short in the context of Python. We contend that Python programmers need a profiler that provides a holistic, granular view of their program’s execution to help them identify and remedy inefficiencies in their programs, especially in steering them towards and improving the efficiency of their use of native libraries.
This paper proposes Scalene , a profiler comprising a suite of profiling innovations designed specifically for Python. Unlike all past Python profilers, Scalene simultaneously profiles CPU, memory usage, and GPU usage. It provides fine-grained information targeted specifically at the problems of optimizing Python code. In particular, Scalene teases apart time and memory consumption that stems from Python vs. native code, revealing where they can optimize by switching to native code. Scalene reports a new metric, copy volume, that helps identify costly (and often inadvertent) copying across the Python/native divide, or copying between CPU and GPU. Its memory profiler accurately tracks memory consumption over time, and automatically identifies memory leaks, whether within Python or spanning the Python-native code divide. Its GPU profiler tracks GPU utilization and memory consumption, letting it identify when native libraries are not being used to their best advantage. At the same time, Scalene imposes low overhead (median: 0% for CPU+GPU, 32% for CPU+GPU+memory).
Since its introduction, Scalene has become a popular tool among Python developers, with over 500,000 downloads to date. We report on case studies supplied by external users of Scalene, including professional Python open source developers and industrial users, highlighting how Scalene helped them diagnose and then remedy their performance problems, leading to improvements ranging from 45% to .
This paper makes the following contributions: it proposes Scalene, a profiler specifically tailored to Python; it presents several novel algorithms, including (1) its algorithm for attributing time consumption to Python or native code; (2) its sampling-based memory profiling that is both accurate and low overhead; and (3) its automatic memory leak detector, which identifies leaks with low overhead. It also introduces and demonstrates the value of a new metric, copy volume, that surfaces hidden costs due to copying.
The next sections explain Scalene’s implementation and algorithms. We first outline how Scalene efficiently performs line-level CPU profiling, focusing on its approach to teasing apart time spent running in the Python interpreter from native code execution and system time (2). We then describe Scalene’s memory profiling component (3), including its threshold-based sampling approach that reduces overhead while ensuring accuracy, its memory leak detection algorithm, and how it tracks copy volume. We then explain how Scalene profiles GPU utilization and memory consumption (4). Finally, we present technical details underpinning Scalene’s user interface (5). We then present our evaluation (6) and a number of case studies of user experiences with Scalene (7); we conclude with a discussion of related work (8).
2 CPU Profiling
Scalene’s CPU profiler employs sampling, but unlike past profilers, it leverages how Python delivers signals to extract more granular information. As we explain, Python signals complicate this task.
Sampling profilers like Scalene work by periodically interrupting program execution and examining the current program counter. Given a sufficiently large number of samples, the number of samples each program counter receives is proportional to the amount of time that the program was executing. Sampling can be triggered by the passage of real (wall-clock) time, which accounts for CPU time as well as time spent waiting for I/O or other events, or virtual time (the time the application was scheduled for execution), which only accounts for CPU time.
Unfortunately, in Python, using sampling to drive profiling can lead to erroneous profiles. Like other scripting languages such as Perl and Ruby, Python only delivers signals to the main thread [31]. Also like those languages, Python defers signal delivery until the virtual machine (i.e., the interpreter loop) regains control, and only checks for pending signals after specific opcodes such as jumps.
The result is that, during the entire time that Python spends executing external library calls, no timer signals are delivered. The effect can be that the profiler will reflect no time spent executing native code, no matter how long it actually took. In addition, because only main threads are interrupted, sampling profilers can fail to account for any time spent in child threads
In fact, this is a failure mode for one of the profilers we examine here. pprofile (stat.) relies exclusively on timer signal delivery to perform CPU profiling. Because it fails to cope with the cases described above, this profiler reports zero elapsed time for all native execution or code executing in multiple threads.
2.1 Accurate Python-C Profiling
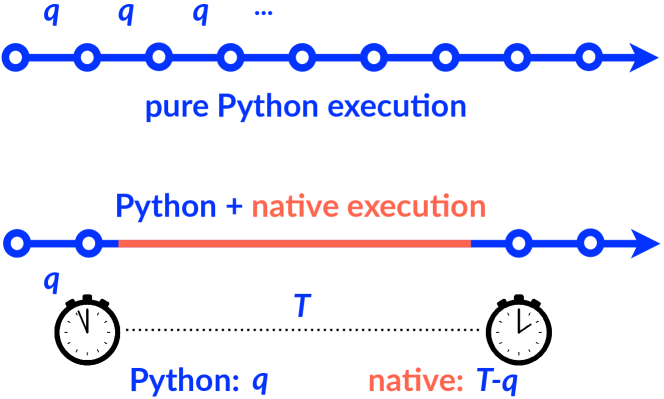
Scalene’s CPU profiler turns these limitations of Python signals to its advantage, inferring whether a line spent its time executing Python or native (C) code. It leverages the following insight: any delay in signal delivery corresponds to time spent executing outside the interpreter. That is, if Scalene’s signal handler received the signal immediately (that is, in the requested timing interval), then all that time must have been spent in the interpreter. If it was delayed, it must be due to running code outside the interpreter, which is the only cause of delays (at least, in virtual time).
Figure 3 depicts how Scalene handles signals and attributes time to either Python or native code. Scalene tracks time between interrupts recording the current virtual time whenever it receives a CPU timer interrupt (using time.process_time()). When it receives the next interrupt, it computes , the elapsed virtual time, and compares it to the timing interval (for quantum).
Scalene uses these values to attribute time spent to Python or native code. Whenever Scalene receives a signal, Scalene walks the Python stack until it reaches code being profiled (that is, outside of libraries or the Python interpreter itself), and attributes time to the identified line of code. Scalene maintains two counters for every line of code being profiled: one for Python, and one for C (native) code. Each time a line is interrupted by a signal, Scalene increments the Python counter by , the timing interval, and it increments the C counter by , the delay.
2.2 Accurate Python-C Profiling of Threads
The approach described above attributes execution time for Python vs. C code in the main thread, but it does not attribute execution time at all for subthreads, which, as described above, never receive signals. To attribute Python and C time for code running in subthreads, Scalene applies a different algorithm, this time leveraging a combination of Python features: monkey patching, thread enumeration, stack inspection, and bytecode disassembly.
Monkey patching refers to the redefinition of functions at runtime. Scalene uses monkey patching to ensure that signals are always received by the main thread, even when the main thread is blocking (e.g., waiting to join with child threads). Scalene replaces blocking functions like threading.join with ones that always use timeouts. It sets these timeouts to Python’s own thread quantum, obtained via sys.getswitchinterval(). Replacing these calls ensures that the main thread yields periodically, allowing signals to be delivered.
In addition, to attribute execution times correctly, Scalene maintains a status flag for every thread, all initially executing. In each of the calls it intercepts, before Scalene issues the blocking call, it sets the calling thread’s status as sleeping. Once that thread returns (either after successfully acquiring the desired resource or after a timeout), Scalene resets the status of the calling thread to executing. Scalene only attributes time to currently executing threads.
Now, when the main thread receives a signal, Scalene invokes threading.enumerate() to collect a list of all running threads. It then obtains the Python stack frame from each thread using Python’s sys._current_frames() method. As above, Scalene walks the stack to find the appropriate line of code to attribute execution time.
Finally, Scalene uses bytecode disassembly (via the dis module) to distinguish between time spent in Python vs. C code. Whenever Python invokes an external function, it does so using a bytecode whose textual representation is either CALL_FUNCTION, CALL_METHOD, or, as of Python 3.11, CALL. Scalene builds a map of all such bytecodes at startup.
For each running thread, Scalene checks the stack and its associated map to determine if the currently executing bytecode is a call instruction. Scalene can use this information to infer with high likelihood whether the thread is currently executing Python or C code.
If a thread is running Python code, it is likely to spend almost no time in a bytecode before executing another Python bytecode. By contrast, if if it is running C code, it will be “stuck” on the CALL bytecode for the duration of native execution. Leveraging this lets Scalene accurately attribute execution time straightforwardly: if it finds that a stack is executing CALL, Scalene assigns time elapsed to the C counter; otherwise, it assigns time elapsed to the Python counter.
3 Memory and Copy Volume Profiling
Almost all past profilers either report CPU time or memory consumption; Scalene reports both, at a line granularity. It is vital that Scalene track memory both inside Python and out, as external libraries are often responsible for a considerable fraction of memory consumption.
3.1 Intercepting Allocation Calls
Scalene intercepts all system allocator calls (malloc, free, etc.) as well as Python internal memory allocator by inserting its own “shim” memory allocator, using Python’s built-in memory hooks. This two-fold approach lets Scalene distinguish between native memory allocated by libraries and Python memory allocated in the interpreter.
The shim allocator extends and uses code from the Heap Layers memory allocator infrastructure [5]; Scalene injects it via library interposition before Python begins executing using LD_PRELOAD on Linux and DYLD_INSERT_LIBRARIES on Mac OS X. To interpose on Python’s internal memory allocator, Scalene uses Python’s custom allocator API (PyMem_SetAllocator).
Each shim allocator function handles calls by sampling for inclusion in the profiling statistics (3.2) and then passing these to the original (Python or system) allocator. A complication arises from the fact that the Python allocators themselves may handle allocation requests by calling into the system allocator. To avoid counting Python allocations also as native allocations, Scalene sets a flag, stored in thread-specific data, indicating it is within a memory allocator. When a shim allocator function is called with this flag set, it skips over the profiling, just forwarding to the original allocator. This approach both avoids double counting and simplifies writing profiling code, as it can allocate memory normally without causing infinite recursion.
3.2 Threshold-Based Sampling
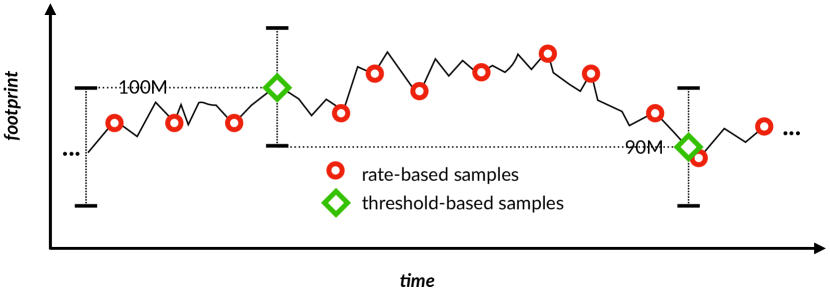
The standard approach to sampling memory profilers, as exemplified by several non-Python memory profilers in Android, Chrome, Go, and Google’s tcmalloc [41] and in Java TLAB based sampling [1], use a rate-based sampling approach. This sampler triggers samples at a rate proportional to the number of bytes allocated or freed. In effect, each byte allocated or freed corresponds to a Bernoulli trial with a given probability of sampling; e.g., if , then (in expectation) there will be one sample per T bytes. In practice, for efficiency, these samplers initialize counters to random numbers drawn from a Poisson process or a geometric distribution with the same parameter. Each allocation and free then decrements this counter by the number of bytes allocated and freed, and triggers a sample when the counter drops below 0.
By contrast, the Scalene sampler introduces threshold-based sampling. The allocator maintains a count of all memory allocations and frees, in bytes. Once the absolute difference between allocations and frees crosses a threshold (), Scalene triggers a sample, corresponding to appending an entry to a sampling file and resets the counters. Figure 4 illustrates this operation. The sampling threshold is currently set to a prime number slightly above 10MB; Scalene uses a prime number to reduce the risk of stride behavior interfering with sampling.
Threshold-based sampling has several advantages over rate-based sampling. Unlike rate-based sampling, which is triggered by all allocation activity (even when it has almost no effect on footprint), threshold-based sampling is only triggered by significant memory use growth or decline. Table 2 shows the dramatic reduction in the number of samples, as high as (median: ) fewer. This reduced number of samples translates directly to lower runtime overhead.
At the same time, threshold-based sampling deterministically triggers a new sample whenever a significant change in footprint occurs. This approach improves repeatability over rate-based sampling (which is probabilistic) and avoids the risk of missing these changes.
Crucially, threshold-based sampling avoids two sources of bias inherent to rate-based sampling. Rate-based sampling can overstate the importance of allocations that do not contribute to an increased footprint since it does not take memory reclamation or footprint into account. It also biases the attribution of memory consumption to lines of code running Python code that exercises the allocator, rather than code responsible for footprint changes. By constrast, threshold-based sampling filters out the vast number of short-lived objects that are created by the Python interpreter itself, and only triggers based on events that change footprint.
3.3 Collecting and Processing Samples
When a memory sample is taken, Scalene temporarily enables tracing using Python’s PyEval_SetTrace. Tracing remains active only until it detects execution has moved on from that line. This approach lets Scalene properly account for average memory consumption per line.
Each entry in Scalene’s sampling file includes information about allocations or frees, the fraction of Python (vs. native) allocations in the total sample, as well as an attribution to a line of Python source code.
Scalene attributes each sample to Python source code at the time the sample is taken. It does so by obtaining the current thread’s call stack from the interpreter and skipping over frames until one within profiled source code is found. This attribution needs to happen whenever a sample is taken, so it is implemented as a C++ extension module, using read-only accesses to Python structures. Scalene loads this module upon startup, which in turn uses a symbol exported by the shim library to complete the linkage, making itself available to the shim.
A background thread in Scalene’s Python code reads from the sampling file and updates the profiling statistics. Scalene also tracks the current memory footprint, which it uses both to report maximum memory consumption and memory trends. Scalene records a timestamp and the current footprint at each threshold crossing, which Scalene uses to generate memory trend visualizations (5).
3.4 Memory Leak Detection
Like other garbage-collected languages, Python can suffer from memory leaks when references to objects are accidentally retained so that the garbage collector cannot reclaim them. As in other garbage collected languages, identifying leaks in Python programs is generally a slow, manual process.
In Python, the standard approach to identifying leaks is to first activate tracemalloc, which records the size, allocation site, and stack frame for each allocated object. The programmer then inserts calls at the appropriate place to produce a series of heap snapshots, and then manually inspects snapshot diffs to identify growing objects. This approach suffers from several drawbacks. First, it is laborious and depends on a post hoc analysis of the heap. Second, it can be quite slow. In our tests, just activating tracemalloc can slow Python applications down by .
Instead, Scalene incorporates a novel sampling-based memory leak detection algorithm that is both simple and efficient. The algorithm piggybacks on threshold-based sampling (3.2). Whenever the threshold-based sampler triggers because of memory growth, Scalene checks to see if this growth has led to a new high-water mark (maximum footprint). If so, Scalene records the sampled allocation. Every call to free then checks to see whether this object is ever reclaimed. This checking is cheap and highly predictable, consisting of a pointer comparison that is almost always false.
Leak Score:
At the next crossing of a maximum, Scalene updates a leak score for the sampled object. The leak score tracks the historic likelihood of reclamation of the sampled object, and consists of a pair of . Scalene first increments the mallocs field when it starts tracking an object, and then increments the frees field only if it reclaimed the allocated object. It then resumes tracking with a newly sampled object.
Intuitively, leak scores capture the likelihood that an allocation site is leaking. A site with a high number of mallocs and no frees is a plausible leak. By contrast, a site with a matching number of mallocs and frees is probably not a leak. The more observations we make, the higher the likelihood that we are observing or ruling out a leak.
We use Laplace’s Rule of Succession to compute the likelihood of a success or failure in the next Bernoulli trial, given a history of successes and failures [51]. Here, successes correspond to reclamations (frees) and failures are non-reclamations (mallocs - frees). According to the Rule of Succession, Scalene computes the leak probability as .
Leak Report Filtering and Prioritization:
To provide maximal assistance to Python developers, Scalene filters and augments leak information. First, to limit the number of leak reports, Scalene only reports leaks whose likelihood exceeds a 95% threshold, and only when the slope of overall memory growth is at least 1%. Second, Scalene makes it possible for developers to prioritize leaks by associating each leak with an estimated leak rate. Leak rate corresponds to the average amount of memory allocated at a given line divided by time elapsed, in MB per second. We expect Python programmers to focus their attention on high-confidence leaks with a high leak rate, since these are the most serious.
3.5 Copy Volume
Scalene uses sampling to collect information about copy volume (megabytes per second of copying) by line. This metric, which Scalene introduces, helps identify costly (and often inadvertent) copying across the Python/native divide, or copying between CPU and GPU.
The Scalene shim library used for memory allocation also interposes on memcpy, which is invoked both for general copying (including to and from the GPU, and copying across the Python/C boundary). As with memory allocations, Scalene writes an entry to a sampling file once a threshold number of bytes has been copied. However, unlike memory sampling, copy volume sampling employs classical rate-based sampling. The current memcpy sampling rate is set at a multiple of the allocation sampling rate.
4 GPU Profiling
Scalene performs both line-granularity GPU utilization and memory profiling on systems equipped with NVIDIA GPUs. This feature helps Python programmers identify whether they are efficiently making use of their GPUs.
Scalene piggybacks GPU sampling on top of its CPU sampler. Every time Scalene obtains a CPU sample, it also collects the total currently used GPU memory and utilization, which it associates with the currently executing line of code. Whenever possible, it employs per-process ID accounting, which can substantially increase accuracy in a shared GPU setting.
At startup, Scalene checks to see if per-process ID accounting has been enabled on the attached NVIDIA GPU. If not, Scalene offers to enable it, a process that requires that the user invoke Scalene once with super-user privileges.
5 GUI Design and Implementation
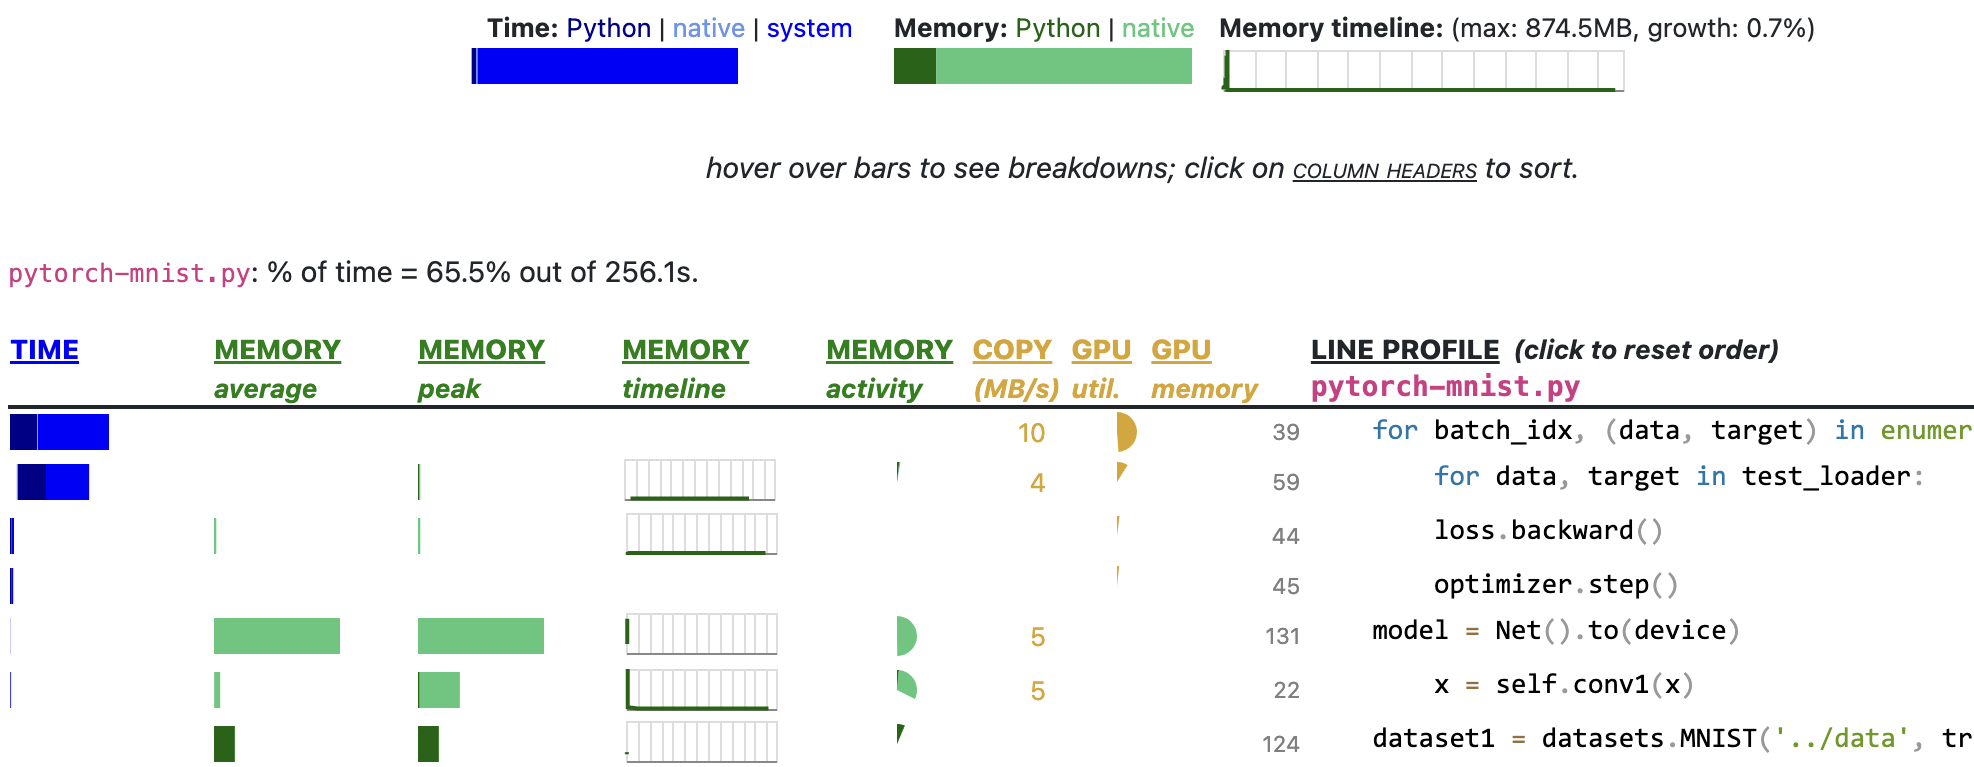
Scalene’s primary user interface is web-based, though it also offers a non-interactive rich text-based CLI. The web UI, written in JavaScript, uses Vega-Lite to generate its visualizations, including bar graphs, pie charts, and the line graphs used for visualizing memory consumption over time [38]. To avoid CORS issues, Scalene produces a single HTML payload that includes the actual JSON-based profile (which it also outputs as a separate file), and then launches a local browser tab to open it. This approach also makes it trivial to upload, share, or archive profiles.
In the UI, Scalene not only reports net memory consumption per line, but also reports memory usage over time, both for the program as a whole and for each individual line. Figure 2 presents several examples. The x-axis corresponds to execution time, and the y-axis corresponds to the footprint of the program, as seen by that line of code.
Because it can be expensive to visualize graphs with large numbers of points, Scalene limits the number of points it outputs in its JSON payload and HTML output. Prior to generating the profile output, Scalene applies the Ramer-Douglas-Peucker (RDP) algorithm [9, 32] to each line’s memory footprint log (if any). The RDP algorithm aims to reduce the total number of points while preserving the overall shape of the curve. The RDP algorithm depends on a parameter which corresponds to a distance parameter below which RDP merges adjacent points; Scalene sets to a value that approximately reduces the total number of points to a manageable size (100 points). Sometimes this process fails to reduce the number of points sufficiently. To guarantee that the number of points is always bounded, after applying RDP, Scalene randomly downsamples all memory logs to exactly 100 points.
To further ensure the scalability of the user interface, Scalene only reports lines of code that are responsible for at least 1% of execution time (CPU or GPU) or at least 1% of total memory consumption, along with the preceding and following line. This approach guarantees that a Scalene profile never contains more than 300 lines. In practice, profiles are generally skewed and resulting profilers are often far more abbreviated.
6 Evaluation
Our evaluation answers the following questions: (1) How does Scalene’s CPU profiling accuracy compare to other CPU profilers? (6.2) (2) How does Scalene’s memory profiling accuracy compare to other memory profilers? (6.3) (3) How does Scalene’s CPU profiling overhead compare to other CPU profilers? (6.4) (4) How does Scalene’s memory profiling overhead compare to other memory profilers? (6.5)
6.1 Experimental Setup
Our prototype of Scalene consists of roughly 3,500 lines of Python 3 code and 1,700 lines of C++-17 code; its user interface comprises 800 lines of JavaScript, excluding white space and comments as measured by cloc [8]. This prototype runs on Linux, Microsoft Windows, and Mac OS X, for Python versions 3.8 and higher; we report Linux results here. We use the latest version of Scalene, released 12/08/2022.
We perform all experiments on an 8-core 4674 MHz AMD Ryzen 7, equipped with 32GB of RAM and an NVIDIA GeForce RTX 2070 GPU, running Linux 5.13.0-35-generic. All C/C++ code is compiled with g++ version 9, and we use CPython version 3.10.9 (release date 12/06/2022) For overhead numbers, we report the interquartile mean of 10 runs.
6.2 CPU Profiling Accuracy
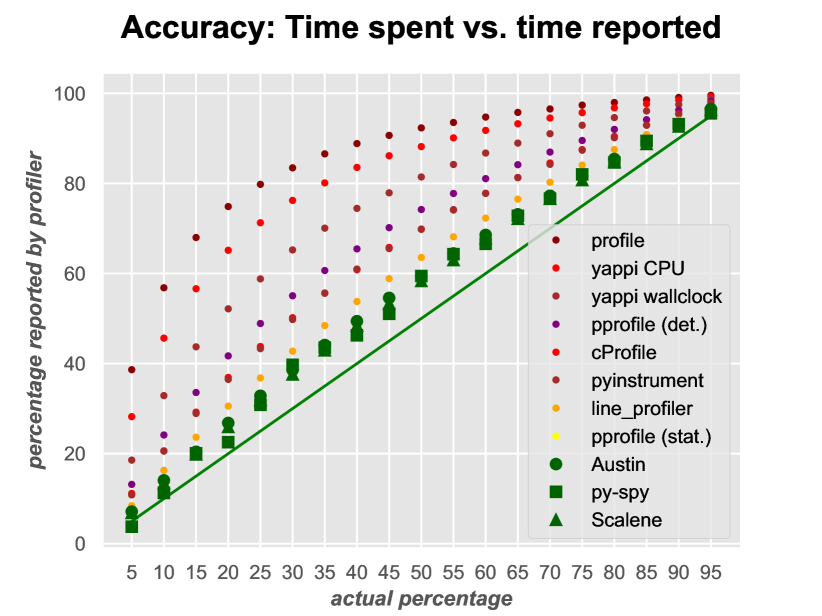
Here, we explore a specific threat to the accuracy of Python CPU profilers. We hypothesize that some might exhibit a probe effect that could distort the time spent by applications. Specifically, we suspect that Python profilers that rely on Python’s tracing facility might exhibit a bias caused by tracing triggering both on function calls and lines of code, dilating the apparent time spent in function calls. We call this phenomenon function bias; we hypothesize that sampling-based profilers like Scalene would not suffer from this bias.
We wrote a microbenchmark to test this hypothesis. The microbenchmark executes a varying number of iterations of two semantically identical functions: one invokes another function inside its loop, while the other inlines the same logic. Our experiments where vary a parameter of the microbenchmark—the amount of time spent in one function versus the other—and compare the profiler results to the ground truth, as measured with high resolution timers.
Figure 5 presents the results of this experiment. The x-axis corresponds to the amount of time measured while running the variant with a function call (the ground truth), while the y-axis corresponds to the amount of time reported by each profiler. The ideal is a diagonal running from the origin.
The results confirm our hypothesis. The trace-based profilers exhibit a high degree of inaccuracy; trace-based profilers exhibit significant function bias. In the worst case, one such profiler reports a function takes 80% of execution time while in fact it only consumes 25%. We conclude that such profilers may be too potentially misleading to be of practical value for developers.
Summary:
Scalene produces accurate profiles on a microbenchmark that stresses function bias, placing it among the most accurate CPU profilers.
6.3 Memory Profiling Accuracy
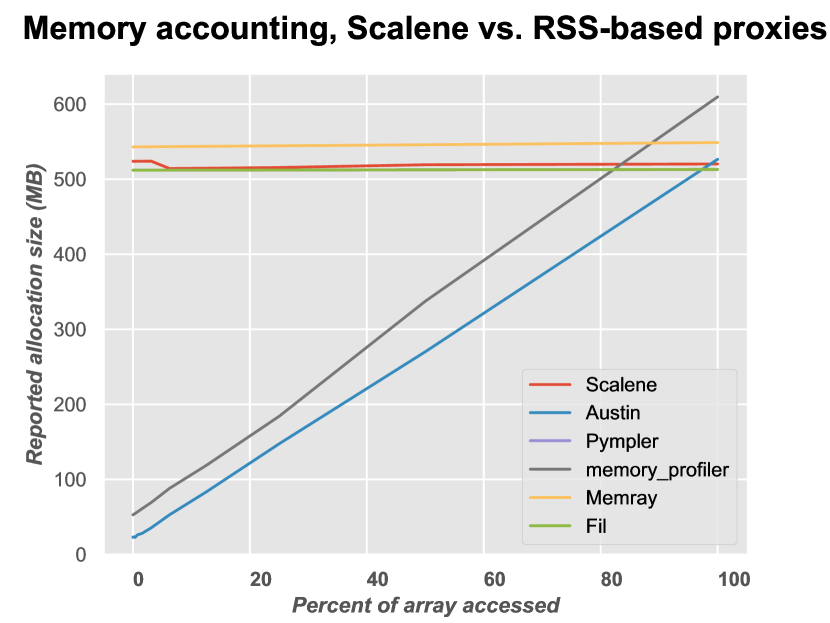
We next compare the accuracy of memory profilers with a simple test designed to explore the effect of using resident-set size instead of direct memory tracking. Our hypothesis was that RSS would be an imperfect proxy, since it corresponds to the use of memory rather than the allocation of objects. Our test first allocates a single 512MB array, and then accesses a varying amount of the array (from 0% to 100%).
Figure 6 presents the result, confirming our hypothesis. Both memory_profiler and Austin rely on resident set size (RSS) as a proxy for memory consumption. The figure clearly shows that this can be wildly inaccurate, leading to under-reporting and even over-reporting the size of the allocated object. The other profilers directly measure allocation, and produce much more accurate results. Both Scalene and Fil report within 1% of the actual size of the allocated object (512MB), while Memray is within 6%.
Drawbacks of peak-only profiling:
Both Fil and Memray only report live objects at the point of peak memory allocation by a program. This information can be useful, but it can both exaggerate the potential for reducing memory and obscure other sources of memory consumption. Consider a program that allocates and discards a 4GB object, and then allocates a 4GB + 8 byte object. A report that only contains information at the point of peak allocation will reveal the second object but not the first. That profile will suggest an enormous opportunity to save memory, but eliminating the second object entirely would have almost no effect on peak memory consumption. Unlike peak profilers, Scalene provides information about all significant memory allocation over time, giving programmers a global view of memory consumption.
Summary:
Scalene’s memory profiling is highly accurate, while capturing memory consumption over time.
6.4 CPU Profiling Overhead
| Benchmark | Repetitions | Time |
|---|---|---|
| 22 | 11.9s | |
| 9 | 12.0s | |
| 14 | 12.3s | |
| 16 | 10.6s | |
| docutils | 5 | 12.5s |
| fannukh | 3 | 12.1s |
| mdp | 5 | 13.4s |
| pprint | 7 | 12.8s |
| raytrace | 25 | 11.1s |
| sympy | 25 | 11.3s |
| Benchmark | Rate | Threshold | Ratio |
|---|---|---|---|
| 556 | 215 | ||
| 524 | 187 | ||
| 719 | 167 | ||
| 375 | 167 | ||
| docutils | 20 | 5 | |
| fannukh | 426 | 5 | |
| mdp | 316 | 6 | |
| pprint | 7976 | 23 | |
| raytrace | 215 | 7 | |
| sympy | 6757 | 10 | |
| Median: |
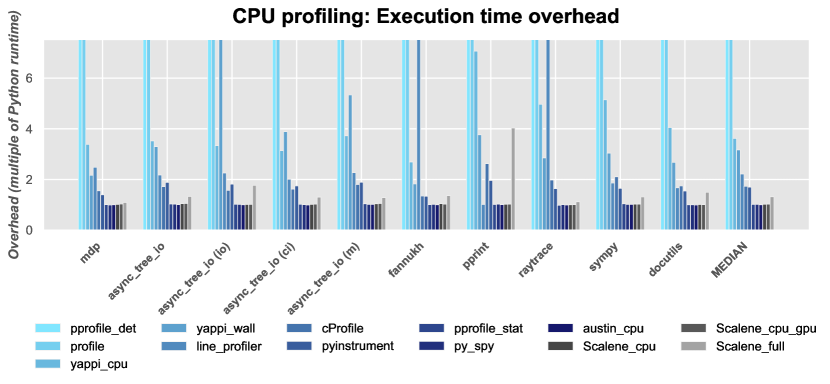
In our evaluation, we use the ten longest-running benchmarks from pyperformance, the standard suite for evaluating Python performance (Figure 1). We modify these benchmarks to run in a loop so that they execute for at least 10 seconds on our experimental platform. We also modify the benchmarks slightly by adding @profile decorators, as these are required by some profilers; we also add code to ignore the decorators when they are not used. Finally, we add a call to system.exit(-1) to force py-spy to generate output. Figure 7 provides the results of running the profilers across all these benchmarks.
Summary:
In general, Scalene imposes low to modest overhead (median: 2% for CPU+GPU, and 30% for full functionality), placing it among the profilers with the lowest overhead.
6.5 Memory Profiling Overhead
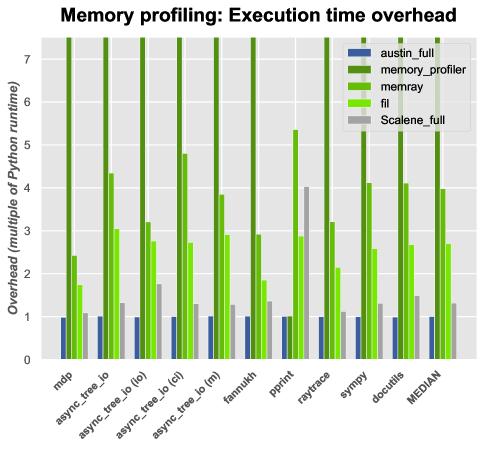
Next, we evaluate the overhead of memory profilers (memory_profiler, Fil, Memray and Austin), and compare them to Scalene. We use the same benchmarks as we used for measuring runtime overhead for CPU profilers.
Figure 8 shows the results. Because it can slow down execution by at least , we omit memory_profiler from the graph. Scalene’s performance is competitive with the other profilers; while Austin is faster, as Section 6.3 shows, it provides inaccurate estimates of memory consumption.
| mdp | a_t_i | (io) | (ci) | (m) | fannukh | pprint | raytrace | sympy | docutils | Median | |
|---|---|---|---|---|---|---|---|---|---|---|---|
| py_spy | |||||||||||
| cProfile | |||||||||||
| yappi_wall | |||||||||||
| yappi_cpu | |||||||||||
| pprofile_stat | |||||||||||
| pprofile_det | |||||||||||
| line_profiler | |||||||||||
| profile | |||||||||||
| pyinstrument | |||||||||||
| austin_cpu | |||||||||||
| austin_full | |||||||||||
| memray | |||||||||||
| fil | |||||||||||
| memory_profiler | |||||||||||
| Scalene_cpu | |||||||||||
| Scalene_cpu_gpu | |||||||||||
| Scalene_full |
Log file growth:
Some memory profilers feature a surprising other source of overhead. Two of the memory profilers, Memray and Austin, produce detailed (and copious) logs of memory activity that may limit their usefulness for profiling long-lived applications.
Memray deterministically logs information including all allocations, all updates to the Python stack, and context switches, which it later post-processes for reporting. Austin similarly generates logs meant to be consumed by an external tool. These files can grow rapidly: in our tests, Memray’s output file grows by roughly 3MB/second, while Austin’s grows by 2MB/second.
By contrast, Scalene only records samples when memory consumption grows or shrinks by a large amount (3.2), leading to vastly smaller logs. For example, when running the mdp benchmark, Austin’s log file consumes 27MB and Memray’s log file consumes almost 100MB, while Scalene’s log file consumes just 32K.
Summary:
Among the accurate memory profilers, Scalene operates with the lowest overhead (median: vs. (memray) and (Fil), while capturing memory usage over time and producing small log files.
7 Case Studies
This section includes reports on real-world experience by external developers using Scalene to identify and resolve performance issues. For each, we identify the features of Scalene that were instrumental in enabling these optimizations.
Rich:
A user reported severe slowness when printing large tables to the developer of Rich [20], an immensely popular Python library for formatting text in the terminal (downloaded over 130 million times, with 41K stars on GitHub). When Rich’s developer profiled it using Scalene, he identified two lines occupying a disproportional amount of runtime. Scalene indicated that a call to isinstance was taking an unexpectedly large amount of time–though each call takes very little time, the developer reported that it was being called 80,000 times. Rich’s developer replaced these calls with a lower-cost function, hasattr. In our benchmarks, isinstance (when marked as a runtime protocol via @typing.runtime_checkable) can run over slower than hasattr. The developer also indicated that an unnecessary copy was being performed once every cell. Optimizing these calls led to a reported 45% improvement in runtime when rendering a large table. [Feature: Fine-grained CPU profiling, copy volume.]
Pandas – Chained Indexing:
A developer was seeing suboptimal performance in their code using Pandas [42]. Scalene identified that a list comprehension performing nested indexes into a Pandas dataframe was taking an unexpectedly large amount of time and resulting in a significant amount of copy volume. The developer noted that the first level of indexing was repeatedly using a string that was loop invariant; the way this was being done in Pandas caused it to perform copies rather than using views, a problem known as chained indexing (https://pandas.pydata.org/pandas-docs/stable/user_guide/indexing.html#returning-a-view-versus-a-copy). After manually hoisting this outer indexing operation, the developer obtained an speedup. [Features: Copy volume and fine-grained CPU profiling.]
Pandas – concat and groupby queries:
An instructor had their students use Scalene in a tutorial designed to teach higher performance Pandas. The instructor found that Scalene revealed significant issues in both performance and space consumption when using Pandas. First, Scalene revealed that calling concat on Pandas dataframes was using more memory than anticipated. Scalene’s copy volume reporting revealed that the problem was that concat copies all the data by default (https://pandas.pydata.org/pandas-docs/stable/reference/api/pandas.concat.html#pandas.concat), effectively doubling memory usage when managing large dataframes. Second, Scalene confirmed that excessive RAM usage in some groupby operations is due to copying of the groups; this bug has been reported to the Pandas developers (https://github.com/pandas-dev/pandas/issues/37139). Restructuring the groupby operation reduced memory consumption by a further 1.6GB. [Features: Fine-grained CPU and memory profiling, copy volume.]
NumPy vectorization:
A graduate student was using NumPy to implement classification with gradient descent and was seeing extremely low performance. Scalene showed that 99% of the time was being spent in Python (rather than native code), indicating that his code was not vectorized. In other words, the code was not expressed in a way that allowed NumPy to efficiently compute vector operations (using native code). Guided by Scalene’s feedback, the graduate student gradually improved the performance from 80 iterations per minute to 10,000 per minute, a improvement. [Feature: Fine-grained native vs. Python CPU profiling.]
Semantic Scholar:
Semantic Scholar reports that they have been using Scalene as part of their tool suite for operationalizing their machine learning models. Recently, they found that a model was cost-prohibitive and put an entire product direction in jeopardy. They generated a set of test data and ran their models with Scalene. Scalene’s output was able to pinpoint the issues and help them validate that their changes were having an impact. While iteratively using Scalene while applying optimizations, they were ultimately able to reduce costs by 92%. Additionally, Scalene allowed Semantic Scholar’s developers to quickly determine what fraction of their runtime would benefit from hardware acceleration and what CPU-bound code they needed to optimize in order to achieve their goals. [Features: Simultaneous, fine-grained CPU, memory, and GPU profiling.]
Summary:
In nearly all of the cases described above, Scalene was either invaluable or provided additional help that narrowed down performance issues, including several unique features of Scalene: separation of native from Python time, copy volume, GPU profiling, and its ability to simultaneously measure memory and CPU usage. Though other tools can separately identify high RAM usage or slow code, past tools would either misattribute the location of usage due to the use of resident set size as a metric (unlike Scalene’s accurate memory profiling approach) or not be able to simultaneously measure memory usage and CPU usage. The insights generated by Scalene were actionable, yielding substantial improvements in execution time and space, as well as cost reduction.
8 Related Work
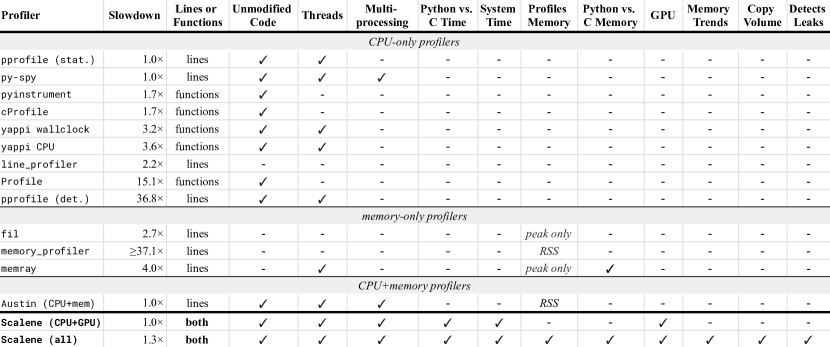
There is an extensive history of profilers; we focus our attention here on profilers that specifically support Python. The Python ecosystem has given rise to a proliferation of Python profilers, most of which have not been discussed in the academic literature. This section describes the most prominent profilers; Figure 1 provides a diagrammatic overview.
We first survey CPU-only profilers. We divide them into two categories: deterministic (tracing-based) (8.1) and sampling-based (8.2). We then discuss memory profilers (8.3), ML-specific profilers (8.4), other Python profilers (8.5), and general profilers with Python support (8.6), and touch on more distantly related profilers for other languages (8.7).
8.1 Deterministic CPU profilers
Python provides built-in tracing support (sys.settrace) that several profilers build upon. The tracing facility, when activated, triggers a callback in response to a variety of events, including function calls and execution of each line of code. This deterministic, instrumentation-based approach leads to significant inaccuracies due to its probe effect, as Section 6.2 shows. Because of the overhead of tracing, they are also the slowest profilers.
Function-granularity:
Python includes two built-in function-granularity profilers, profile [35] and cProfile [34]. The primary difference between these two profilers is that cProfile’s callback function is implemented in C, making it much faster ( slowdown vs. ) and somewhat more accurate than profile. Another profiler, yappi, operates in two modes, wall clock time (sample-based) and CPU time (deterministic); it is among the most inaccurate of CPU profilers, with slowdowns ranging from to .
Line-granularity:
pprofile [30] comes in two flavors: a deterministic and a “statistical” (sampling-based) profiler. Both flavors correctly work for multithreaded Python programs, unlike line_profiler [17]. All of these report information at a line granularity. pprofile_det imposes a median overhead of , while line_profiler’s median overhead is .
8.2 Sampling-based CPU profilers
Sampling-based profilers are both more efficient and often more accurate than the deterministic profilers. These include pprofile_stat, py-spy [10], and pyinstrument [33]. Their overhead is between and , comparable to Scalene. pprofile_stat incorrectly ascribes zero runtime to execution of native code or code in child threads (2).
Compared to past CPU-only profilers, Scalene is nearly as fast or faster, more accurate, and provides more detailed CPU-related information, breaking down time spent into Python, native, or system time.
8.3 Memory profilers
memory_profiler is a deterministic memory profiler that uses Python’s trace facility to trigger it after every line of execution [36]. By default, it measures the RSS after each line executes and records the change from the previous line. memory_profiler also does not support Python applications using threads or multiprocessing.
Fil measures the peak allocation of the profiled program by interposing on system allocator functions and forcing Python to use the system allocator (instead of Python’s Pymalloc) [46]. Fil records a full stack trace whenever the current memory footprint exceeds a previous maximum. On exit, it produces a flamegraph [13] of call stacks responsible for memory allocation at the point of maximum memory consumption. The Fil website reports that it supports threads (“In general, Fil will track allocations in threads correctly.” [47]). However, in our tests, Fil (version 2022.6.0) fails to ascribe any memory allocations to threads. Fil also does not currently support multiprocessing.
Memray is a recently released (April 2022), Linux-only memory profiler that deterministically tracks allocations and other profiler events [37]. Memray interposes upon the C allocation functions and optionally on the pymem functions, letting it distinguish native from Python allocations.
The only previous CPU+memory profiler we are aware of besides Scalene is Austin [44]. Austin samples the frames of all running threads at a specified time interval. Austin profiles from its own process outside of the program being profiled, reducing its performance overhead.
8.4 Profilers for Machine Learning Libraries
Two widely used machine learning libraries, TensorFlow and PyTorch [28], include their own profilers [11, 19]. Both profilers are targeted at identifying performance issues specific to deep learning training and inference. For example, the PyTorch profiler can attribute runtime to individual operators (running inside PyTorch’s native code).
NVIDIA’s Deep Learning profiler (DLprof) [23] provides similar functionality for either PyTorch or TensorFlow. Unlike Scalene, these profilers are specific to machine learning workloads and are not suitable for profiling arbitrary Python code. These profilers are complementary to Scalene, which aims to be a general-purpose profiler. They also lack many of Scalene’s features.
8.5 Other Python Profilers
PieProf aims to identify and surface specific types of inefficient interactions between Python and native code [40]. PieProf leverages data gathered from on-chip performance monitoring units and debug registers combined with data from libunwind and the Python interpreter to identify redundant loads and stores initiated by user-controlled code. It surfaces pairs of redundant loads and stores for the developer to potentially optimize. PieProf is not publicly available, so it was not possible to compare it to Scalene; we view its functionality it as orthogonal and complementary.
8.6 Profilers with Python Support
Several non-Python specific conventional profilers offer limited support for Python. Intel’s VTune profiler [50] can attribute its metrics to Python lines, with a number of caveats, including “if your application has very low stack depth, which includes called functions and imported modules, the VTune Profiler does not collect Python data.” [16]. VTune does not directly distinguish between time spent in Python code and time spent in native code and does not track Python memory allocations. Google Cloud Profiler [12] only profiles Python execution time, but neither distinguishes between Python and native time nor does it perform memory profiling for Python. Both lack most of Scalene’s other features.
Python 3.12, the current development version of Python, recently (November 2022) added support for use with the perf profiler on Linux platforms by reporting function names in traces [26]. Using perf in this mode only measures performance counters or execution time. Unlike Scalene, perf does not measure memory allocation, or attribute runtime (Python or native) to individual lines of Python code.
8.7 Non-Python Profilers
AsyncProfiler is a Java profiler that, like Scalene, profiles both CPU and memory [27]. AsyncProfiler is a sampling profiler that avoids the safepoint bias problem [21]. Since Python does not have safepoints (all garbage collection happens while the global interpreter lock is held), Python profilers cannot suffer from this bias. Instead, as we show, they can suffer from function bias (6.2). Similarly, pprof is a profiler for the Go language that can report both CPU and memory [7]. Both profilers use rate-based memory sampling (3.2).
9 Conclusion
This paper presents Scalene, a novel profiler for Python. Scalene both sidesteps and exploits characteristics of Python to deliver more actionable information than past profilers, all with high accuracy and low overhead. Its suite of novel algorithms enables Scalene’s holistic reporting of Python execution. Scalene has been released as open source at https://github.com/plasma-umass/scalene.
Acknowledgements
We thank Scalene’s users for their feature requests, questions, and bug reports, which have helped shape and guide this research. We are most grateful to users who contributed pull requests or worked with us to resolve compatibility issues, including Raphael Cohen, James Garity, Ryan Grout, Friday James, and Marguerite Leang. We thank the users who contributed their experiences, reported here as case studies: Will McGugan, Ian Oszvald, Donald Pinckney, Nicolas van Kempen, and Chris Wilhelm. Finally, we thank the reviewers of this paper, whose feedback helped improve not only the paper but also Scalene itself.
This material is based upon work supported by the National Science Foundation under Grant No. 1954830.
References
- [1] Improved JFR allocation profiling in JDK 16. https://withent.blogspot.com/2021/01/improved-jfr-allocation-profiling-in.html, Jan. 2021.
- [2] M. Abadi, A. Agarwal, P. Barham, E. Brevdo, Z. Chen, C. Citro, G. S. Corrado, A. Davis, J. Dean, M. Devin, S. Ghemawat, I. Goodfellow, A. Harp, G. Irving, M. Isard, Y. Jia, R. Jozefowicz, L. Kaiser, M. Kudlur, J. Levenberg, D. Mané, R. Monga, S. Moore, D. Murray, C. Olah, M. Schuster, J. Shlens, B. Steiner, I. Sutskever, K. Talwar, P. Tucker, V. Vanhoucke, V. Vasudevan, F. Viégas, O. Vinyals, P. Warden, M. Wattenberg, M. Wicke, Y. Yu, and X. Zheng. TensorFlow: Large-scale machine learning on heterogeneous systems, 2015. Software available from tensorflow.org.
- [3] M. Abadi, P. Barham, J. Chen, Z. Chen, A. Davis, J. Dean, M. Devin, S. Ghemawat, G. Irving, M. Isard, M. Kudlur, J. Levenberg, R. Monga, S. Moore, D. G. Murray, B. Steiner, P. Tucker, V. Vasudevan, P. Warden, M. Wicke, Y. Yu, and X. Zheng. TensorFlow: a system for Large-Scale machine learning. In 12th USENIX Symposium on Operating Systems Design and Implementation (OSDI 16), pages 265–283, 2016.
- [4] M. Belanger and D. Deville. How we rolled out one of the largest Python 3 migrations ever - Dropbox. https://dropbox.tech/application/how-we-rolled-out-one-of-the-largest-python-3-migrations-ever, Sept. 2018.
- [5] E. D. Berger, B. G. Zorn, and K. S. McKinley. Composing high-performance memory allocators. In M. Burke and M. L. Soffa, editors, Proceedings of the 2001 ACM SIGPLAN Conference on Programming Language Design and Implementation (PLDI), Snowbird, Utah, USA, June 20-22, 2001, pages 114–124. ACM, 2001.
- [6] S. Cass. Top programming languages 2022. https://spectrum.ieee.org/top-programming-languages-2022, Aug. 2022.
- [7] R. Cox and S. Ma. Profiling go programs. https://go.dev/blog/pprof, May 2013.
- [8] A. Danial. cloc: v1.94. https://github.com/AlDanial/cloc, July 2022.
- [9] D. H. Douglas and T. K. Peucker. Algorithms for the reduction of the number of points required to represent a digitized line or its caricature. Cartographica: the international journal for geographic information and geovisualization, 10(2):112–122, 1973.
- [10] B. Frederickson. py-spy: Sampling profiler for Python programs. https://github.com/benfred/py-spy.
- [11] Google Corporation. Optimize TensorFlow performance using the Profiler. https://www.tensorflow.org/guide/profiler.
- [12] Google LLC. Google Cloud: Profiling Python applications. https://cloud.google.com/profiler/docs/profiling-python, 2022.
- [13] B. Gregg. The flame graph. Commun. ACM, 59(6):48–57, June 2016.
- [14] M. Hertz and E. D. Berger. Quantifying the performance of garbage collection vs. explicit memory management. In OOPSLA ’05: Proceedings of the 20th Annual ACM SIGPLAN Conference on Object-Oriented programming, Systems, Languages, and Applications, pages 313–326, New York, NY, USA, 2005. ACM Press.
- [15] Instagram Engineering. Python - Instagram Engineering. https://instagram-engineering.com/tagged/python, 2019.
- [16] Intel Corporation. Intel VTune Profiler User Guide. https://www.intel.com/content/www/us/en/develop/documentation/vtune-help/top/analyze-performance/code-profiling-scenarios/python-code-analysis.html, 2022.
- [17] R. Kern. line_profiler: Line-by-line profiling for Python. https://github.com/pyutils/line_profiler.
- [18] R. Komorn. Python in production engineering. https://engineering.fb.com/production-engineering/python-in-production-engineering/, May 2016.
- [19] M. Lukiyanov, G. Hua, G. Chauhan, and G. Dankel. Introducing PyTorch Profiler - the new and improved performance tool. https://pytorch.org/blog/introducing-pytorch-profiler-the-new-and-improved-performance-tool/.
- [20] W. McGugan. Rich is a Python library for rich text and beautiful formatting in the terminal. https://github.com/Textualize/rich.
- [21] T. Mytkowicz, A. Diwan, M. Hauswirth, and P. F. Sweeney. Evaluating the accuracy of Java profilers. In B. G. Zorn and A. Aiken, editors, Proceedings of the 2010 ACM SIGPLAN Conference on Programming Language Design and Implementation, PLDI 2010, Toronto, Ontario, Canada, June 5-10, 2010, pages 187–197. ACM, 2010.
- [22] Netflix Technology Blog. Python at Netflix. https://netflixtechblog.com/python-at-netflix-bba45dae649e, Apr. 2019.
- [23] NVIDIA Corporation. NVIDIA Deep Learning Profiler. https://docs.nvidia.com/deeplearning/frameworks/dlprof-user-guide/.
- [24] S. O’Grady. The RedMonk Programming Language Rankings: June 2022. https://redmonk.com/sogrady/2022/10/20/language-rankings-6-22/, Oct. 2022.
- [25] T. E. Oliphant. Guide to NumPy. https://web.mit.edu/dvp/Public/numpybook.pdf, 2006.
- [26] Pablo Galindo. Python support for the Linux perf profiler. "https://docs.python.org/3.12/howto/perf_profiling.html, 2022.
- [27] A. Pangin. async-profiler. https://github.com/jvm-profiling-tools/async-profiler.
- [28] A. Paszke, S. Gross, F. Massa, A. Lerer, J. Bradbury, G. Chanan, T. Killeen, Z. Lin, N. Gimelshein, L. Antiga, A. Desmaison, A. Köpf, E. Yang, Z. DeVito, M. Raison, A. Tejani, S. Chilamkurthy, B. Steiner, L. Fang, J. Bai, and S. Chintala. PyTorch: An imperative style, high-performance deep learning library. Advances in Neural Information Processing Systems, 32, 2019.
- [29] F. Pedregosa, G. Varoquaux, A. Gramfort, V. Michel, B. Thirion, O. Grisel, M. Blondel, P. Prettenhofer, R. Weiss, V. Dubourg, J. Vanderplas, A. Passos, and D. Cournapeau. Scikit-learn: Machine learning in Python. Journal of Machine Learning Research, 12:2825–2830, 2011.
- [30] V. Pelletier. pprofile: Line-granularity, thread-aware deterministic and statistic pure-Python profiler. https://github.com/vpelletier/pprofile.
- [31] Python Software Foundation. Signals and threads. https://docs.python.org/3/library/signal.html#signals-and-threads.
- [32] U. Ramer. An iterative procedure for the polygonal approximation of plane curves. Computer graphics and image processing, 1(3):244–256, 1972.
- [33] J. Rickerby. pyinstrument: Call stack profiler for Python. https://github.com/joerick/pyinstrument.
- [34] B. Rosen and T. Czotter. The Python Profilers (cProfile). https://docs.python.org/3.8/library/profile.html.
- [35] J. Roskind. The Python Profilers (profile). https://docs.python.org/3.8/library/profile.html.
- [36] S. Saffron. memory_profiler. https://github.com/SamSaffron/memory_profiler.
- [37] P. G. Salgado. Memray. https://bloomberg.github.io/memray/.
- [38] A. Satyanarayan, D. Moritz, K. Wongsuphasawat, and J. Heer. Vega-lite: A grammar of interactive graphics. IEEE Transactions on Visualization & Computer Graphics (Proc. InfoVis), 2017.
- [39] Stack Overflow. Stack Overflow Developer Survey 2022. https://survey.stackoverflow.co/2022/#most-popular-technologies-language, May 2022.
- [40] J. Tan, Y. Chen, Z. Liu, B. Ren, S. L. Song, X. Shen, and X. Liu. Toward efficient interactions between Python and native libraries. In D. Spinellis, G. Gousios, M. Chechik, and M. D. Penta, editors, ESEC/FSE ’21: 29th ACM Joint European Software Engineering Conference and Symposium on the Foundations of Software Engineering, Athens, Greece, August 23-28, 2021, pages 1117–1128. ACM, 2021.
- [41] TCMalloc Team. How sampling in TCMalloc works. https://github.com/google/tcmalloc/blob/master/docs/sampling.md, 2022.
- [42] The Pandas development team. pandas-dev/pandas: Pandas. https://github.com/pandas-dev/pandas, July 2022. [Online; accessed 4-July-2022].
- [43] TIOBE Software BV. TIOBE Index for December 2022. https://www.tiobe.com/tiobe-index/, Dec. 2022.
- [44] G. N. Tornetta. austin: A frame stack sampler for cpython. https://github.com/P403n1x87/austin.
- [45] D. Trotter. Grumpy: Go running Python! https://opensource.googleblog.com/2017/01/grumpy-go-running-python.html, Jan. 2017.
- [46] I. Turner-Trauring. Fil profiler. https://pythonspeed.com/fil/.
- [47] I. Turner-Trauring. Threading in NumPy (BLAS), Zarr, numexpr. https://pythonspeed.com/fil/docs/threading.html.
- [48] G. van der Meer. How we use Python at Spotify. https://labs.spotify.com/2013/03/20/how-we-use-python-at-spotify/, Mar. 2013.
- [49] Wikipedia contributors. Cpython — Wikipedia, the free encyclopedia. https://en.wikipedia.org/w/index.php?title=CPython&oldid=1095361531, 2022. [Online; accessed 4-July-2022].
- [50] Wikipedia contributors. VTune — Wikipedia, The Free Encyclopedia. https://en.wikipedia.org/w/index.php?title=VTune&oldid=1107229725, 2022. [Online; accessed 13-December-2022].
- [51] S. L. Zabell. The rule of succession. Erkenntnis, 31(2):283–321, 1989.