Identifying and Explaining Safety-critical Scenarios for Autonomous Vehicles via Key Features
Abstract.
Ensuring the safety of autonomous vehicles (AVs) is of utmost importance, and testing them in simulated environments is a safer option than conducting in-field operational tests. However, generating an exhaustive test suite to identify critical test scenarios is computationally expensive as the representation of each test is complex and contains various dynamic and static features, such as the AV under test, road participants (vehicles, pedestrians, and static obstacles), environmental factors (weather and light), and the road’s structural features (lanes, turns, road speed, etc.). In this paper, we present a systematic technique that uses Instance Space Analysis (ISA) to identify the significant features of test scenarios that affect their ability to reveal the unsafe behaviour of AVs. ISA identifies the features that best differentiate safety-critical scenarios from normal driving and visualises the impact of these features on test scenario outcomes (safe/unsafe) in . This visualisation helps to identify untested regions of the instance space and provides an indicator of the quality of the test suite in terms of the percentage of feature space covered by testing. To test the predictive ability of the identified features, we train five Machine Learning classifiers to classify test scenarios as safe or unsafe. The high precision, recall, and F1 scores indicate that our proposed approach is effective in predicting the outcome of a test scenario without executing it and can be used for test generation, selection, and prioritisation.
1. Introduction
Autonomous vehicles (AVs) are expected to operate in an ever-changing environment with a large and complex space of scenarios. This requires extensive testing of these vehicles to ensure their safety and reliability before they are deployed in the real world. Assessing the reliability of AVs requires hundreds of millions of miles of test-driving (Kalra and Paddock, 2016). This level of testing is not possible using on-road driving alone. Furthermore, on-road testing cannot be performed for safety-critical driving scenarios. Therefore, the use of simulated environments for the testing of AVs is a norm (Kim et al., 2016; Zofka et al., 2016; Math et al., 2013). Just like on-road testing, testing in a simulated environment requires designing a huge number of driving scenarios, thus attracting developers and testers to devise automated testing techniques for AV-testing (Rajabli et al., 2020; Hauer et al., 2019a). To identify the safety violations of AVs, evolutionary algorithms are applied to generate safety-critical test scenarios (Abdessalem et al., 2018; Ben Abdessalem et al., 2016; Klück et al., 2019a; Li et al., 2020a; Lu et al., 2021; Onieva et al., 2015; Tian et al., 2022a). However, it is a challenging task, as the operating environment is dynamic, with an exceedingly large number of factors that impact driving. These factors include, but are not limited to: the kinematics of AV and other participants sharing the road (vehicles, humans and static obstacles), structural features of roads (lanes, speed limit, curve, pedestrian crossing) and environmental factors like weather (rain, fog) and light conditions. To test the system for reliability and safety, it is crucial to consider all of these factors for test generation. However, the number of features representing these factors is huge. For instance, the representation of an NPC in a simulated scenario requires defining its features like starting position, destination, speed, type of vehicle, action, the time of action etc., and a single scenario can have many of such vehicles. Similarly, pedestrians, weather and other factors have their own features. Defining the search space based on all these features would fuel the complexity of the search space, making it infeasible to explore completely. One way of curbing the complexity of the search space is by gaining deeper insights into the impact of the features on the effectiveness of the test scenarios (i.e., their ability to detect incorrect behaviour of the AV), and searching the space for these impactful features only.
Reducing the cost of AV testing is an active research area in the software testing community, and researchers have proposed frameworks and techniques to minimise the number of test scenarios using test selection and prioritisation strategies (Birchler et al., 2021, 2022b; Lu et al., 2021). However, the main goal of these studies is the selection of a subset of test-cases from a test suite. Unlike these studies, we propose to curb the complexity of the search space of testing by selecting a subset of features to define a simulated driving scenario, therefore, reducing the curse of dimensionality. The selected set of features can effectively be used for test generation, selection and prioritisation. In short, the test selection and prioritisation studies mentioned above decrease the size of a test suite in terms of its length (number of test cases), while we propose to shrink this size in width (number of features to define a test case). Furthermore, we propose to project the features and the test outcomes in space in such a way that the impact of each feature, along with its value range, can easily be mapped to the test outcome, making the feature selection more explainable and human-interpretable. This will facilitate the developers and testers to understand the structural and behavioural factors that impact the safety of the AV under test.
To gain the necessary insights into the impact of features on AV testing, we investigate the following research questions:
RQ1: How can we identify key features of effective test scenarios? Generating safety-critical test scenarios using search-based techniques is an active research area in the field of automated testing of AVs. In these techniques, the search is guided by a fitness function that evaluates the testing scenarios based on metrics such as time-to-collision (Minderhoud and Bovy, 2001), Out of Bound Episodes (OBEs) (Birchler et al., 2021), collision-probability (Lu et al., 2022) etc. We call these metrics test output, and test scenarios need to be executed in the simulator for their computation. However, it is still rarely investigated what features should be considered to design a test scenario. These features are known as test parameters or input features. In this research question, we find the key input features that impact the effectiveness of test scenarios. Effectiveness is defined as the ability of the scenarios to detect faults in the system. For this, we employ Instance Space Analysis (ISA) (Kang et al., 2017; Muñoz and Smith-Miles, 2017; Smith-Miles et al., 2014), a framework that constructs a two-dimensional instance space based on the input features of test scenarios and their outcome. The generated instance space provides visual insights into the impact of various features (test input) on the effectiveness of testing scenarios (test output).
RQ2: Can we predict test scenario outcomes using the key features? The simulators provide a safer substitute for in-field operational testing of AVs (Afzal et al., 2021; Timperley et al., 2018; Gambi et al., 2019a; Lou et al., 2022). However, the testing space is huge, and the tests are expensive to run even on a simulator. Using the key features investigated in RQ1, we train machine learning classifiers to predict the effectiveness of a test scenario without simulating or executing it. Obtaining such information in advance would make the testing process more effective and faster by prioritising the test scenarios for simulation which are more likely to lead to a collision.
RQ3: How can we measure the extent to which the scenario space has been explored? A crucial problem in testing is deciding when the system has been tested sufficiently. For the testing of traditional systems, code coverage is widely used as a measure of testing adequacy (Harman and McMinn, 2007; Ghani et al., 2009; Scalabrino et al., 2016; Panichella et al., 2017, 2018; Campos et al., 2017; Wu et al., 2018). However, this measure cannot be used as a quality metric for the simulation-based testing of AVs, as the system logic is not completely encoded in the source code but is largely shaped by the training data. Therefore, a testing criterion specific to this testing problem is needed. One way of making sure that testing has exercised diverse behaviours of the system-under-test is to explore the scenario space at large. As driving scenarios for AV-testing are defined in terms of input features, it is safe to use the terms feature space and scenario space interchangeably. Under this research question, we seek a metric to assess the effectiveness of AV testing by measuring how extensively the scenario space has been explored.
To answer these questions, we extract a set of features from three AV testing suites for which test outcomes are known. These features include the structural properties of the road, the properties of the AV, pedestrians, other vehicles on the road, traffic signals, and weather and light conditions. The features are then used to generate the instance space that reveals the impact of these features on scenario outcome. The scenario outcome is labelled as unsafe or safe depending on its execution result. The scenario is deemed unsafe if it drifts away from the centre of the lane, leads to a collision or in which AV comes very close to the other road participants and has a chance to collide with obstacles, safe otherwise.
We extract a subset of features that have maximum impact on the testing scenarios to generate the instance space that provides visual insights into how the features impact scenario outcome. Based on the minimum and maximum values of the features, we define an empirical boundary around the generated instance space and identify the regions where more test scenarios should be added. Finally, to evaluate the effectiveness of the features selected through our proposed technique, we train four machine learning classifiers using these features to predict test outcomes. The performance of the trained classifiers, measured in terms of precision, recall, and F1 score, is significantly higher than random feature selection.
The approach introduced in this paper can be used by the testers to generate effective test scenarios using a smaller number of features. This can help to reduce the testing effort in terms of time and computational resources without compromising the performance of the test suite. The identification of the percentage of missing scenarios provides an objective measure to assess the adequacy and sufficiency of testing, whereas, the prediction of the outcome of a test scenario without executing it on a simulator can be a valuable technique for test-case selection and prioritisation.
2. Instance Space Analysis
ISA is a methodology that generates a visualisation of the problem instances and shows the impact of the features of a problem on the performance. In the context of testing, we use this methodology to identify the impact of input features of test scenarios on their outcome (safe vs. unsafe), and project these scenarios in the space, called instance space, in such a way that this impact can be clearly visualised. The generated instance space facilitates insights into the distribution of existing instances, allowing the identification of sparse, unoccupied regions where new test instances should be generated for more comprehensive testing. The ISA methodology was initially proposed by Smith-Miles et al. (Smith-Miles et al., 2014) for combinatorial optimisation problems but has since been applied to a multitude of other areas, including automated software testing (Oliveira et al., 2018; Smith-Miles et al., 2022) and automated program repair (Aleti and Martinez, 2020). In general, ISA involves the following steps.
-
•
Collecting the metadata for test instances: features of test instances and their performance based on a performance metric.
-
•
Selecting a subset of features that best define the performance and capture differences and similarities in the problem instances.
-
•
Projecting test instances from n-dimensional feature space to a 2-dimensional instance space.
-
•
Quantitatively measuring the regions of good performance in the instance space (called footprint) and describing them in terms of instance features.
-
•
Defining an empirical boundary around the instance space that encloses all the test scenarios that are empirically possible to generate, however, may be missing from the current analysis.
-
•
Constructing an automated recommender that predicts scenario outcome without executing a test scenario in a simulator.
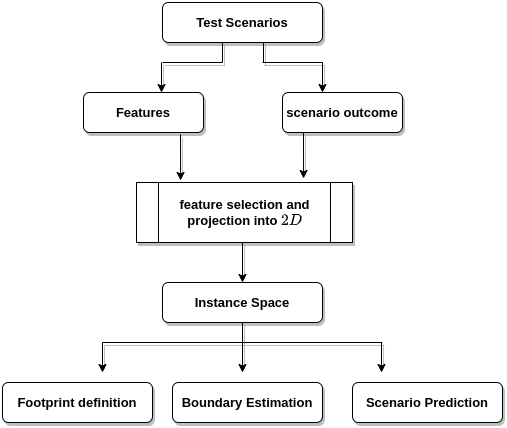
2.1. ISA for testing AVs
In the context of creating the instance space for testing AVs, ISA begins with the compilation of a wide variety of test scenarios. These scenarios must be diverse both in terms of feature values and their execution results (fail vs. pass). The test execution result is computed based on a performance metric. In the context of AV testing, some examples of performance metrics are: collision probability (Lu et al., 2022), collision event (collision or no collision) (Lu et al., 2021), Out of Bound Episodes (OOBs) (Birchler et al., 2021), and Time to Collision (TTC) (Klück et al., 2019a).
In the next step, meaningful features are extracted from the test scenarios such that they: (1) can describe the similarities and differences between instances; (2) are useful in explaining the effectiveness of the test scenarios; and (3) can be computed within a reasonable amount of time. Features are domain-specific, and feature extraction requires significant domain knowledge (Muñoz et al., 2018, [n. d.]). We list the features of the test scenarios we use in our study and their extraction process in Section 2.2.
Ultimately, we construct an instance space, representing test scenarios in a format, focusing on features with the greatest impact on scenario outcomes. The test scenarios are projected onto this space in a manner that reflects a gradual progression of feature distributions from one end of the instance space to the other. This projection allows for a clear mapping of scenario outcomes, which are also projected in a similar manner i.e., the safe scenarios occupy one end of the space, while unsafe scenarios reside at the opposite end.
Once the instance space is established, it becomes a valuable tool for assessing the quality of the test suite used to generate it. Additionally, the features identified by the instance space are utilised to train machine learning algorithms, which are subsequently employed to predict the outcomes of untested scenarios without the need for their execution in simulators.
2.2. Features of Driving Scenarios
To generate the instance space of AV testing, we utilise two different test suites having test scenarios designed for testing AVs from different perspectives. The first test suite is designed for the system-level testing of AVs and the test scenarios are defined by the combination of (1) static features to represent road and weather conditions; (2) dynamic features representing the state and behaviour of AV and other road users and defining their interaction.
Static road features determine the background of a scenario. They include features to characterise the road, e.g. the state of the traffic light, the presence of sidewalks, the number of AVs, pedestrians and other obstacles on the road etc. Additionally, within the static features’ category, we account for weather and lighting conditions as these factors can significantly influence sensor data quality. For instance, adverse weather conditions like heavy rain can lead to blurred sensor images, potentially resulting in challenges for AV’s performance.
The dynamic features capture the spatio-temporal data of AV and other road participants. Along with storing the absolute values of position, speed, velocity, acceleration, volume and operation of the road users, we include the relative values of these features. For instance, represents the volume of the fastest obstacle (vehicle or pedestrian) on the road and stores the speed of the obstacle that is in the closest vicinity of the AV.
We extract a diverse set of 61 static and dynamic features from this test suite, listed in Table LABEL:tab:feat_ds1. The feature set not only incorporates the features utilised in the prior studies but also encompasses a considerably larger number of additional features (Lu et al., 2021, 2022; Hauer et al., 2020; Abdessalem et al., 2018; Deng et al., 2022). A sample representation of the driving scenario from this test suite is provided in Appendix A.
The second test suite we use in our study is specifically designed to evaluate the lane-keeping capabilities of autonomous vehicles (AVs). Within this suite, the test scenarios incorporate various structural features, which serve as the basis for creating virtual roads within a simulation environment. The primary objective of this test suite is to create complex road conditions that challenge AVs, potentially causing them to deviate from the centre of their designated lanes, leading to unsafe situations. From these test scenarios, we derive 15 distinct features that encompass information such as the frequency of left and right turns, the curvature of the turns, the angularity of the turns, the number of straight road segments, the overall road length, and summarised statistics of these features, including minimum, maximum, standard deviation, mean, and median values. These features have already been used in previous studies related to the testing of AVs (Birchler et al., 2022a, b, 2021). They are listed in Table 1 and a sample test scenario from this test suite is provided as Appendix B.
3. Experimental Design
This section provides insights into the dataset utilised within this study and elucidates the procedures and methods we employ to apply the ISA generic methodology, as outlined in Section 2, to construct the instance space for testing AVs.
3.1. Datasets
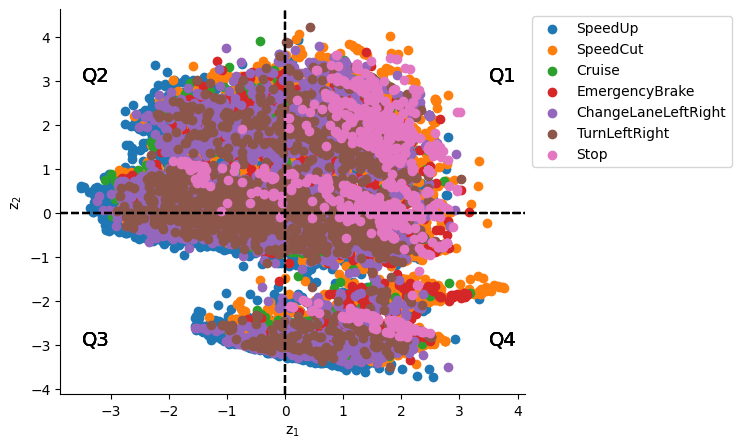
We use two case studies related to AV testing for our experiments. The first case study is the testing of Baidu Apollo Open Platform 5.0 as the ADS (apo, [n. d.]), using LGSVL simulator (Rong et al., 2020) and is taken from the replication package provided with (Lu et al., 2021). The test scenarios are generated using four different roads from San Francisco map. The test scenarios in this test suite are designed to mimic varied driving situations like taking turns, changing lanes, stopping on signals, approaching pedestrians/obstacles, overtaking, and parking etc. Figure 2 shows the distribution of these scenarios in the instance space according to each operational category. In total, 28,946 unique test scenarios are used in the current study, containing 12,930 unsafe and 16,016 safe scenarios. Failures in this dataset are defined as collisions or safety distance violations (Shalev-Shwartz et al., 2017).
The second case study is the testing of the BeamNG.AI lane-keeping system: the driving agent shipped with the BeamNG.tech simulator (Bea, [n. d.]). Unlike the first case study, the test scenarios in this dataset are the representation of challenging virtual roads that will force the AV to drive out of or very close to the road lane boundaries. For this case study, we generated test scenarios using two different testing strategies, i.e., AmbieGen (Humeniuk et al., 2022) and frenetic (Castellano et al., 2021), presented in the SBST tool competition (Panichella et al., 2021; Gambi et al., 2022). AmbieGen leverages NSGA-II as a multi-objective search algorithm to generate diverse virtual roads that will force the driving agent to go out of the road. The road is represented as a sequence of points, defining the road spine. Frenetic is also a genetic approach, however, unlike AmbieGen, it uses curvatures associated with smooth planar curves to represent roads. The test suite generated by Frantic contains 1294 scenarios, while the test suite generated by AmbieGen contains 514 test scenarios.
| road features | F1: min_angle | The minimum angle turned in road segment |
|---|---|---|
| F2: max_angle | The maximum angle turned in road segment | |
| F3: mean_angle | The average angle turned in road segment | |
| F4: median_angle | Median of angle turned in road segment | |
| F5: std_angle | Standard deviation of angle turned in road segment | |
| F6: total_angle | Total cumulated angle of all turns | |
| F7: min_pivot_off | The minimum radius of all turns of the road | |
| F8: max_pivot_off | The maximum radius of all turns of the road | |
| F9: mean_pivot_off | The average radius of all turns of the road | |
| F10: median_pivot_off | The median of the radius of all turns of the road | |
| F11: std_pivot_off | Standard deviation of the radius of all turns of the road | |
| F12: num_l_turns | Number of left turns | |
| F13: num_r_turns | Number of right turns | |
| F14: num_straights | Number of straight road segments | |
| F15: road_distance | Total length of the road |
3.2. Finding Effective Features of Test Scenarios (RQ1)
A critical step for the generation of an instance space is the selection of a subset of impactful features from the complete feature space. Feature selection is an iterative process that starts by extraction of meaningful features from test scenarios, followed by feature pre-processing, removing redundant features, and finally, feature learning – a process that uses machine learning methods to find significant features that clearly distinguish the safe from unsafe scenarios.
Different features of driving scenarios are measured in different scales and have different ranges. Therefore, we first normalise the features using normalisation. The normalisation scales the features to ensure a mean of zero and a standard deviation of one, and is a known method to re-scale the data and remove the outliers (Birchler et al., 2022b; Géron, 2022). The normalised feature set is further refined by correlation analysis. The strongly correlated features indicate nearly-redundant information and can cause PCA to overemphasise their contribution. Therefore, such features are removed from the feature set. We further remove the features showing a very weak correlation with the scenario outcome as these features provide little information on why a scenario passes/fails (Hinkle et al., 2003). For correlation analysis, we use Spearman Rank Correlation as it is a non-parametric method and does not require assumptions about data distribution or the shape of the relationships, except for the latter being monotonic (De Winter et al., 2016). The method has been widely used for correlation analysis in previous studies related to AV testing (Aghababaeyan et al., 2021; Arrieta et al., 2019; Chen et al., 2020; Lu et al., 2021).
Once the data is pre-processed, it is time to select a subset of features that have the highest impact on test outcomes. For this, we first identify the clusters of features exhibiting similar properties. To accomplish this, we utilise the k-means clustering algorithm with a dissimilarity measure of , where is the correlation between two features. K-means clustering facilitates a more straightforward interpretation of the clustering outcomes when contrasted with alternative methods (Hauer et al., 2020), and previous research has demonstrated that ISA performs well when employing this clustering technique (Smith-Miles et al., 2022; Muñoz and Smith-Miles, 2017; Muñoz et al., 2018, [n. d.]). To determine the optimal number of clusters for k-means, we employ silhouette analysis (Aranganayagi and Thangavel, 2007).
Once the clusters have been established, one feature is selected from each cluster to create a feature set. Assuming that the previous step generated clusters, each feature set will comprise features. Each n-dimensional feature set is then projected onto a temporary two-dimensional space using Principal Component Analysis (PCA) (Abdi and Williams, 2010). This process is repeated for all possible combinations of features from all clusters. The coordinates of these temporary two-dimensional spaces serve as input for a set of Random Forest (RF) models, which learn the feature combinations that yield the lowest predictive error when forecasting scenario outcomes. The selected subset of features is used for the generation of the instance space.
3.2.1. Generation of Instance Space
Now that the set of most effective features has been identified, we project feature space to a coordinate system in such a way that the relationship between the features of the test scenarios and their outcomes can easily be identified. An ideal projection is one that creates a linear trend when each feature value and scenario outcome is inspected, i.e., low values of features/scenarios’ outcomes at one end of a straight line and high values at the other. Furthermore, the instances that are neighbours in high dimensional feature space should remain as neighbours in the 2D instance space (topological preservation). For this, we use an optimisation method called Projecting Instances with Linearly Observable Trends (PILOT ) (Muñoz et al., 2018). The PILOT seeks to fit a linear model for each feature and test outcome, based on the instance location in the plane. Mathematically, this involves solving the following optimisation problem:
| (1) | |||||
| s.t. |
where is the matrix containing the features of a test scenario, is the column vector containing scenario outcome, is the matrix containing and coordinate values of scenarios in the space, is a matrix that takes the feature values and projects them in space, is a matrix that takes the coordinates and produces an estimation of the feature values, and is a matrix that takes the coordinates and makes an estimation of the technique’s performance. In short, Equation 1 finds the difference between the actual values of the features and performances in a higher dimension and the estimation of these values in . The lower the difference, the higher the topological preservation. Mathematical proofs and additional technical details of PILOT are available in (Muñoz et al., 2018).
3.3. Predicting Test Scenario Outcome (RQ2)
The features chosen to generate the instance space are selected based on (1) how well they explain the test outcome, and (2) how well they separate pass and fail test scenarios in the space. . To test the predictive ability of the selected features, we train five Machine Learning (ML) models using the features identified as impactful. The trained models are then used to predict the outcome of previously unobserved driving scenarios without running them in a simulator. The machine learning classifiers used in this study are Random Forest (RF) (Breiman, 2001), K-Nearest Neighbours (KNN)(Taunk et al., 2019), Decision Tree (DT) (Kotsiantis, 2013), Multilayer Perceptron (MLP) (Murtagh, 1991) and Naive Bayes (NB) (Rish et al., 2001), which have been previously used in similar research works in AV-testing (Kruber et al., 2019; Birchler et al., 2022a; Ali et al., 2019).
To assess the predictive capabilities of the trained models, it is essential to evaluate them on a fresh set of test instances that have not been encountered during the training phase. For the first case study, to the best of our knowledge, no other existing study has generated an AV testing suite represented in a time series format that allows for the extraction of a similar set of features as the ones utilised in our experiments. The closest available test suite we identified is referenced in (Lu et al., 2023). However, it’s worth noting that this dataset lacks certain features that our study has identified as having a significant impact, such as AV_brake, traffic_light, and volume of obstacles, among others. Consequently, for this dataset, we divided the test scenarios from the same test suite into two subsets: one for training the machine learning models and the other for testing their predictive performance. The models were trained on 80% of the data, while their predictive performance was assessed using the remaining 20% of the data, which had not been used during the training phase.
For the second case study for our experiments, we generated two different test suites using two test generation strategies, frenetic (Castellano et al., 2021) and AmbieGen (Humeniuk et al., 2022), presented in the SBST tool competition (Gambi et al., 2022). The details of these test generation techniques and the test suites generated by them are given in Section 3.1. We train the models on the Frenetic test suite using the features selected by ISA. However, to test the model’s generalisation ability on uncovered regions and to prove the effectiveness of the trained model using selected features, the models are evaluated using a test suite generated by AmbieGen.
We use Python’s scikit-learn (Kramer, 2016) library for the implementation of the machine learning models. The performance is measured in terms of precision, recall, and f1-score. For the comparison, we use random feature selection as a baseline to gauge the performance of our proposed technique.
3.4. Coverage of Scenario Space Using Boundary Analysis (RQ3)
The instance space represents the test scenarios as points in a space. The convex hull of these points represents the area in which test instances exist in the test suite under study. However, the test suite doesn’t necessarily include all the test instances required to explore the feature space completely. Using ISA, we devise a way to compute a mathematical boundary that encloses all the test scenarios which are empirically possible to generate, though, may be missing from the current instance space/test suite.
We compute the boundary as follows: Let be the correlation matrix of features, characterising a test scenario. We define two vectors and containing the upper and lower bounds of feature values. From these vectors, we define a vertex vector containing a combination of values from and such that only the upper or lower bound of a feature is included. For instance, represents a vertex vector containing the maximum value of feature 1 and minimum values of all the other features. We define a matrix containing all possible vertices created by the feature combinations. The vertices in metric , connected by edges, define a hyper-cube that encloses all the instances in the instance space.
Some of the vectors in represent feature combinations that are unlikely to coexist. For example, if features 1 and 2 are strongly positively correlated, it is unlikely to find instances that have a high value of feature 1 and a low value of feature 2. Therefore, a vertex vector would be unlikely to be near any true instance. Similarly, a vertex vector cannot simultaneously contain or if feature 1 and feature 2 are strongly negatively correlated. All such unlikely vertex vectors are eliminated from . The edges connecting the remaining vertex vectors are then projected into instance space using PILOT (Muñoz et al., 2018), whose convex hull now represents the mathematical boundary of the expanded instance space.
We propose a new coverage measure, called Instance Space Coverage (), that measures the percentage of the area of the possible scenario space () – defined by the mathematical boundary – that is covered by the generated instance space ().
| (2) |
For calculating the , we focus exclusively on the high-density regions within the instance space to ensure that the calculation remains unaffected by outliers. To achieve this, we employ the DBSCAN clustering algorithm (Schubert et al., 2017), which defines a cluster as a densely populated area of data points. DBSCAN requires two input parameters, denoted as , where signifies the minimum number of instances necessary to establish a dense region, and denotes the maximum radius within which an instance is considered a neighbour. The Euclidean distance metric is used for distance measurement. The values for and are determined automatically following the recommendations in (Daszykowski et al., 2001), employing Equations 3 and 4.
| (3) |
| (4) |
Where represents the number of scenarios, is the Gamma function, and are the coordinates within the two-dimensional instance space.
To delineate the footprint of each cluster, we employ an -shape, a concept in computational geometry that extends the notion of a convex hull (Edelsbrunner et al., 1983). It essentially defines a polygon that closely envelops all the data points within a cluster. An -shape is generated for each cluster, and these shapes are collectively bounded together as a MATLAB polygon structure (pol, [n. d.]). Finally, we compute the area of the polygon using MATLAB’s polyarea function (Pol, [n. d.]).
For , we compute the polygon using boundary instances as vertices and calculate the area occupied by the polygon.
4. Experimental Results
This section reports the insights we have gained through the visualisations of the distributions of features in the instance space generated by the test suites used in our study, and seek the answers to the research questions introduced in Section 1.
4.1. Key features of effective test scenarios (RQ1)
4.1.1. Dataset 1
ISA selected ten features that have an impact on the effectiveness of test scenarios. These are AV_brake and AV_speed, which represent the initial speed and brake applied by the AV; num_NPCs, num_obs and traffic_light, and Is_ped define the background of the scenario and are categorised under the static features. The remaining four features report the speed, distance, and volume of the obstacles and other road users which are part of the scenario. The selected features are then projected to an instance space (Figure 2), and the projection matrix defined by the linear transformation is shown in Equation 5. The projection matrix shows the contribution of each feature to the and axis. Is_ped has the highest contribution to axis, while num_NPCs contributed the most to axis.
The distribution of the selected features in the instance space is shown in figure 4 (a – j). The features show a gradual increasing/decreasing trend from one edge of the space to the other. For , the minimum value shows the absence of any traffic signal on the road, followed by green, orange, and red (maximum value).
| (5) |
The features AV_speed, traffic_light, min_obsDist and speed_minDistObs show a decreasing trend from left to right of the instance space, and these features except traffic_light divide the space horizontally with their low and high values. Contrary to these features, the values of AV_brake increase from left to right. The other four features show a gradual change in their values from top to bottom. For num_NPCs, num_obs and vol_minDistObs, the lowest values are at the bottom, whereas for is_ped the lowest values are at the top. The distribution trend of the feature dist_maxSpeedObs isn’t very well-defined and thus can not be used to deduce any interesting results.
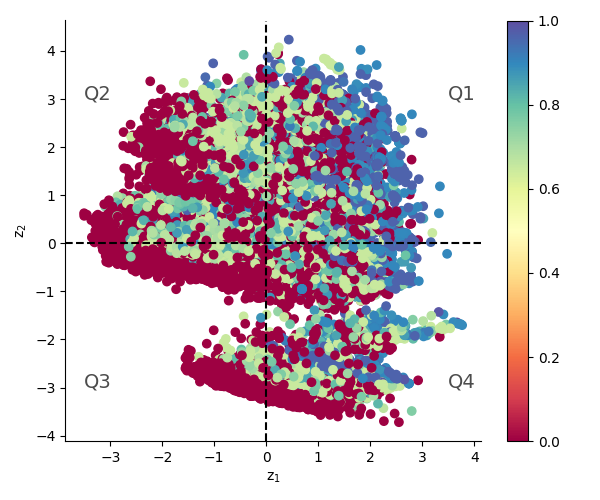
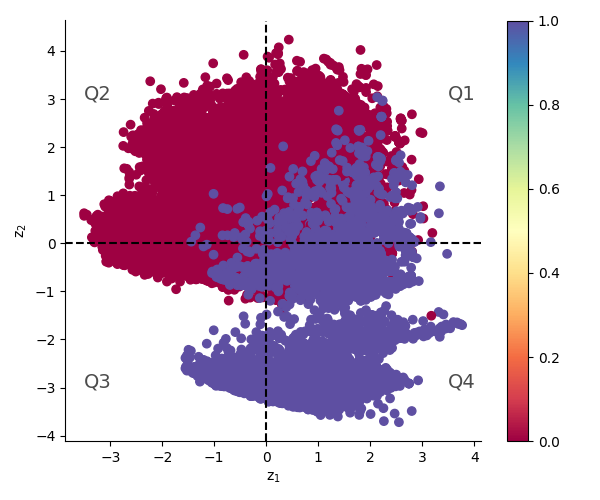
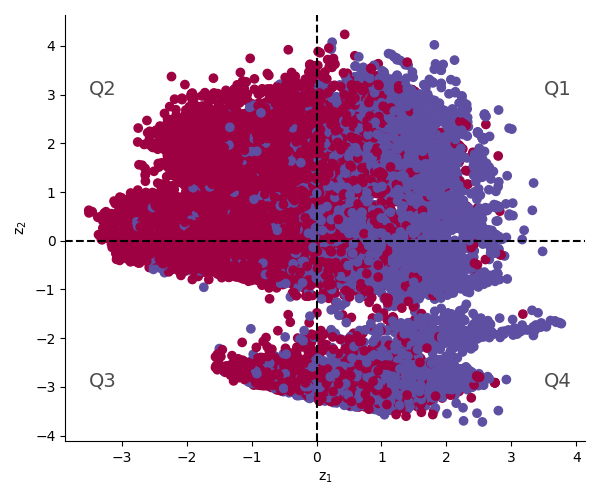
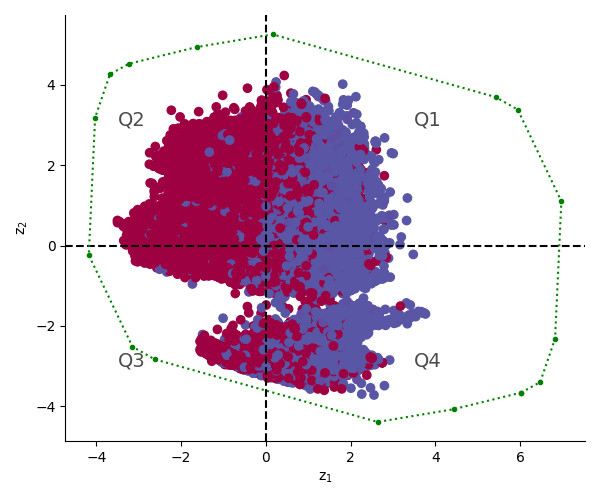
Figure 3k shows the distribution of test scenarios according to their outcome. The scenarios that lead to a collision or break the safety distance are represented by blue dots, while red dots represent safe scenarios, where the AV travelled from the source to the destination without colliding or breaking the minimum safety requirement. It can be seen that the critical scenarios are majorly located in Q1 and Q4, we, therefore, are interested in identifying the defining features of the scenarios located in these quadrants. By superimposing the feature distributions over scenario outcomes, we can identify the features that impact the effectiveness of these scenarios.
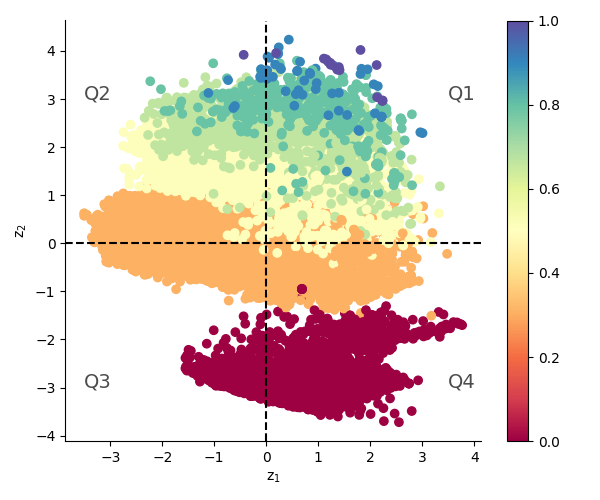
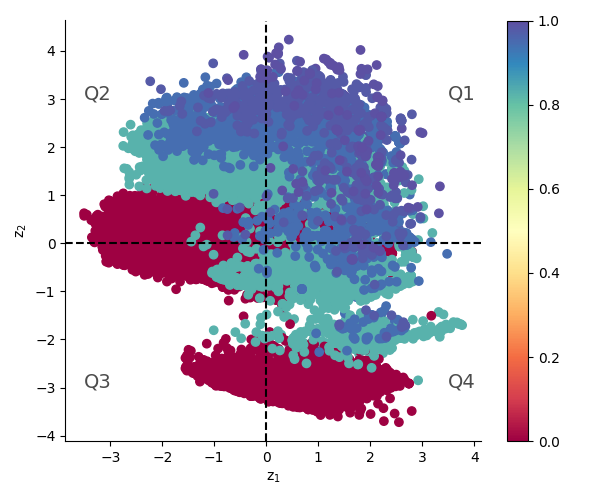
The distribution of features AV_brake, AV_speed, traffic_light, min_obsDist, and speed_minDistObs show a similar trend as the distribution of scenario outcome (increasing/decreasing trend from left to right), thus showing a strong impact on the outcome of test scenarios. In the critical region of the space, the value of the brake applied by the AV is high (green and blue dots), which means the AV exhibited sudden and hard braking. Although there are exceptions, high values are dominant (Figure 3a). Contrary to the brake, a lower initial speed of the AV leads to more safety-critical scenarios (Figure 3b). For the feature traffic_light, either it is green or there is no signal at all, whereas, Low to medium values of min_obsDist and speed_minDistObs are prominent in Q1 and Q4 (Figure 3h – 3i). Furthermore, it can be seen that the number of obstacles is high in the safety-critical region of the space (Figure 3e), showing that scenarios simulating busy roads are more effective. In summary, the most contributing features explaining test outcomes are AV_brake, AV_speed, num_obs, traffic_light, min_obsDist, and speed_minDistObs.
Figure 4 shows the impact of the features on the effectiveness of test scenarios individually. However, as AV operates in an environment having many of these features together, inspecting the combined impact of features on the scenario’s performance would explain the impact more meaningfully. We list some examples of the effective combinations of features that appear to contribute together to defining the safety-criticality of the scenarios:
-
•
The impact of hard braking seems to correlate with the traffic signal. When there is no signal on the road, or the traffic light is green, sudden braking leads to collision (Q1, Q4 of Figure 3k). On the other hand, in the scenarios where the traffic signal is red (blue clusters in Q2 of Figure 3f), hard braking scenarios appear safe (green clusters in Q2 of Figure 3a).
The scenario that explains this observation is that when the traffic signal is green or there is no road signal, other vehicles are driving at the road speed. The sudden brake applied by AV could lead to a rear-end collision with other vehicles. On the other hand, if the signal is red, other vehicles are already stopped or driving at a very low speed (preparing to stop), and thus the chances of a rear-end collision with an AV are low.
-
•
The initial speed with which AV starts its journey on the road (AV_speed) and traffic signal also seem to have a combined impact on the test scenario’s outcome. The regions of the instance space where the initial speed of AV is slow, and the traffic light is green (or no traffic light), show a higher number of safety-critical scenarios.
We observe this combined impact in the scenarios where AV is parked parallel on the side of the road. If other vehicles are driving at the road’s designated speed (no or green signal), it is important for AV to catch the speed of other vehicles as soon as it gets out of the parking bay to avoid collision with the vehicles coming from behind. However, in the presence of a red or orange signal, either other vehicles are already stopped or slowed down, thus reducing the chances of collision with the AV.
-
•
The feature speed_minDistObs shows the speed of an obstacle that is at the minimum distance from the AV. Intuitively, higher speed should be more accident-prone. However, the highest values of this feature belong to the instances in Q3 of Figure 3i, which contains the majority of safe instances. This behaviour can be explained by combining the impact of this feature with vol_minDistObs, which shows the volume of these high-speed obstacles. By comparing 3i and 3j, it can be seen that the high volume of these high-speed obstacles prevents them from colliding with AV. From Figure 2 it can be seen that most of the scenarios in this region come under Lane Change and Speed Cut operations of AV. Therefore, if the volume of the closest vehicles is high, the sensors easily detect the obstacles even in the blind spot while changing lanes, thus reducing the chances of collision.
From these results, we infer that although features impact the outcome of a test scenario individually, it is the combination of critical features that fully defines their safety-criticality.
4.1.2. Dataset 2
: This test suite has been specifically generated to evaluate the lane-keeping functionality of an autonomous vehicle (AV). It comprises a smaller set of 15 features in comparison to test suite 1. These 15 features are derived from five primary features, which include the angle of the turns, the radius of the turns, the number of turns, the number of straight segments, and the total length of the road. The remaining features are computed statistically from these five base features, encompassing calculations for the minimum value, maximum value, mean value, median value, and standard deviation.
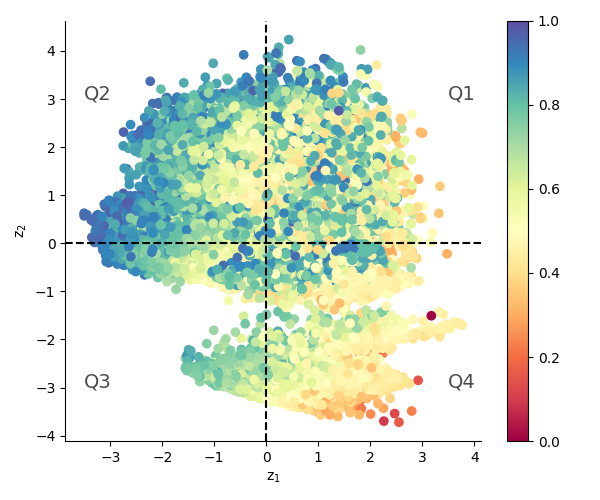
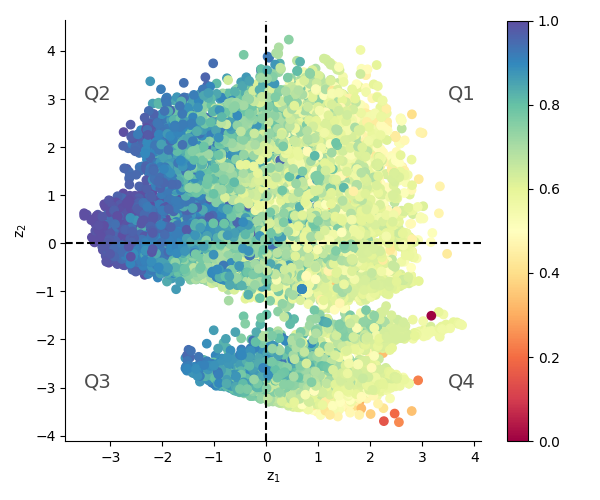
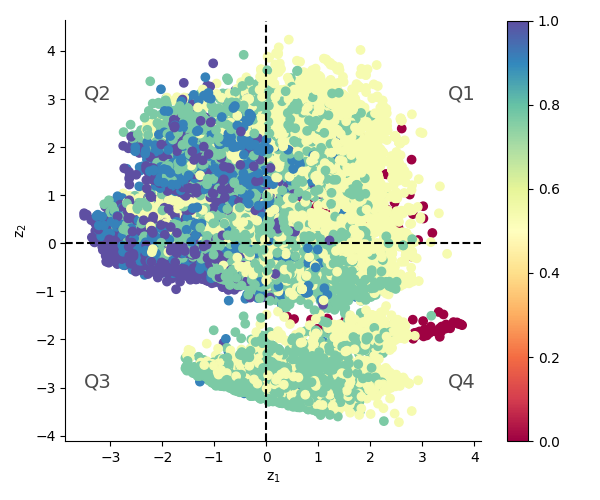
ISA identified three out of these features as having the most significant impact on scenario outcomes. These key features are median_angle, num_r_turns, and road_distance. These features have been projected into a space using the methodology described in Section 3.2.1. The projection matrix, as presented in Equation 6, illustrates the contribution of each feature to the and axes. Notably, road_distance plays a predominant role in the , while num_r_turns exerts the greatest influence on the axis.
| (6) |
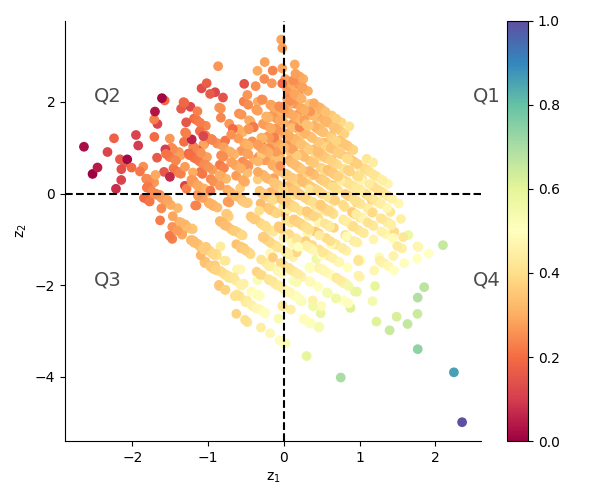
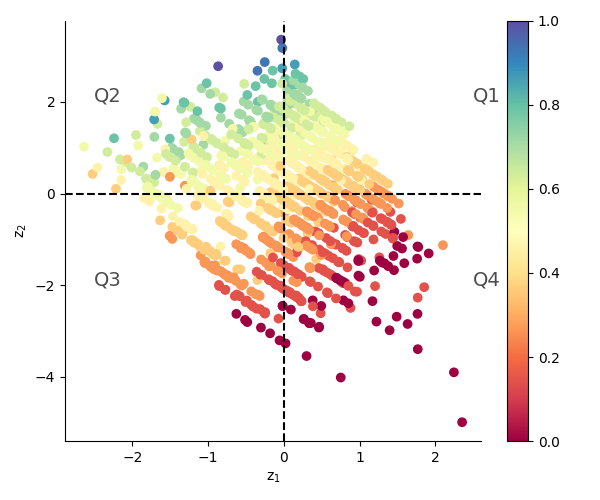
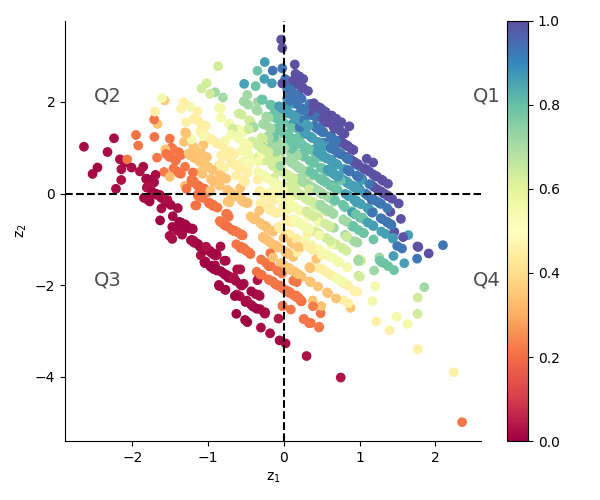
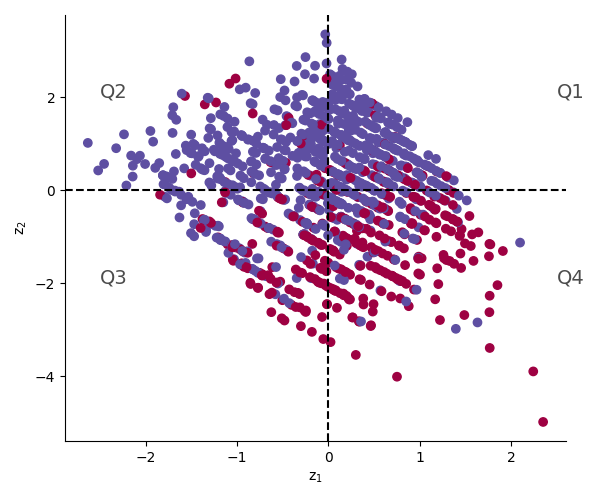
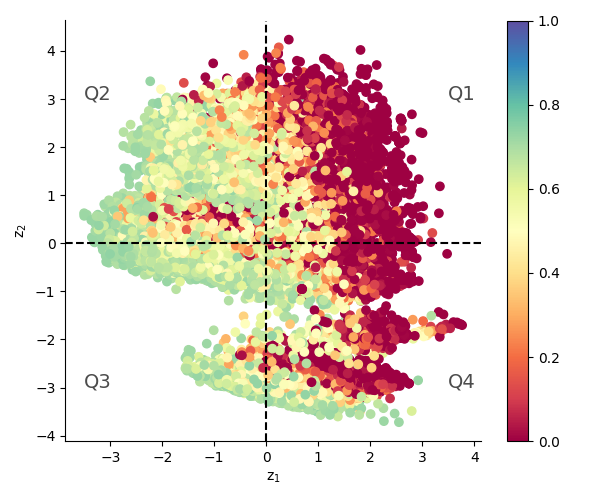
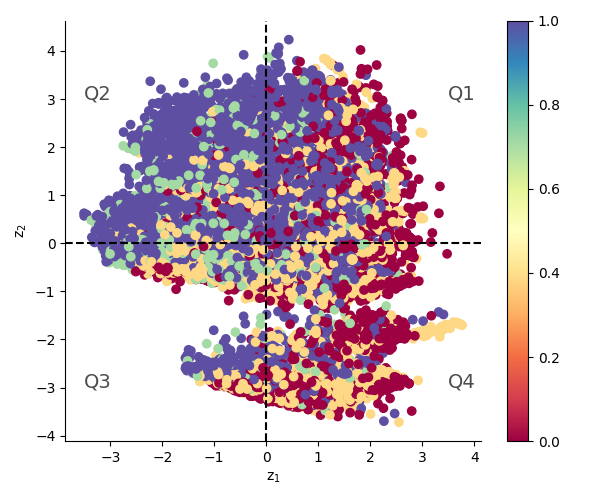
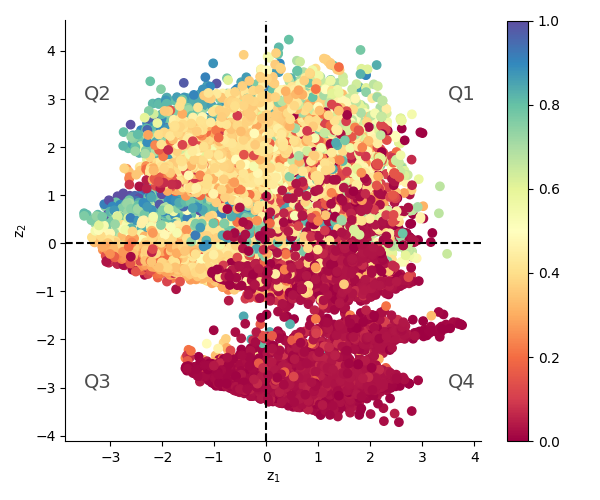
Figures 4a – 4c display the distribution trends of these features within the instance space. The gradual transition in colour, from red to blue, signifies the progressive change in feature values across the space. Additionally, Figure 4d illustrates the distribution of scenario outcomes. Instances where the AV deviates from the centre of the lane, denoting out of bound episodes, are represented by blue dots, while red dots signify safe driving scenarios.
To better understand the impact of each feature on the outcome, one can overlay the feature distribution with the scenario outcome distribution. Notably, the values of num_r_turns exhibit an ascending pattern from the bottom to the top diagonally, aligning with the scenario outcome distribution, which indicates a higher incidence of failure along the same diagonal. Consequently, roads featuring a higher number of right turns pose increased challenges for the AV in maintaining lane boundaries. Similarly, sharp turns, characterised by medium-to-low values of median_angle, are associated with failed test scenarios.
It’s essential to clarify that all features undergo normalisation between 0 and 1 before being projected into the instance space. Therefore, a value of 0 for median_angle does not indicate a 0-degree turn angle, but instead signifies the minimum value of the turn angle within the test suite.
The feature road_distance exhibits a bottom-to-top progression that corresponds to the scenario outcome distribution. However, unlike the first two features, this mapping is less distinct. The projection method, explained in Section 3.2.1, optimises based on two primary goals: (1) topological preservation; and (2) a clear separation of safe and unsafe instances. As a result, a feature that may not exhibit a clear one-to-one mapping with the test outcome can still be selected based on the optimisation criteria of PILOT.
4.2. Predicting test scenario outcomes (RQ2)
| Dataset1 | Dataset2 | ||||||
|---|---|---|---|---|---|---|---|
| ISA | Random | p-value | ISA | Random | p-value | ||
| RF | P | 0.876 | 0.787 | 0.002 | 0.796 | 0.692 | 0.002 |
| R | 0.868 | 0.780 | 0.002 | 0.757 | 0.695 | 0.084 | |
| F1 | 0.870 | 0.781 | 0.002 | 0.774 | 0.675 | 0.002 | |
| DT | P | 0.847 | 0.780 | 0.002 | 0.788 | 0.695 | 0.002 |
| R | 0.839 | 0.768 | 0.002 | 0.825 | 0.692 | 0.020 | |
| F1 | 0.841 | 0.769 | 0.002 | 0.804 | 0.671 | 0.002 | |
| KNN | P | 0.855 | 0.780 | 0.004 | 0.806 | 0.664 | 0.002 |
| R | 0.851 | 0.770 | 0.004 | 0.818 | 0.670 | 0.002 | |
| F1 | 0.852 | 0.772 | 0.004 | 0.812 | 0.655 | 0.002 | |
| MLP | P | 0.864 | 0.753 | 0.002 | 0.787 | 0.702 | 0.002 |
| R | 0.865 | 0.753 | 0.002 | 0.795 | 0.679 | 0.020 | |
| F1 | 0.865 | 0.751 | 0.002 | 0.791 | 0.675 | 0.002 | |
| NB | P | 0.806 | 0.730 | 0.002 | 0.807 | 0.624 | 0.002 |
| R | 0.796 | 0.683 | 0.002 | 0.832 | 0.646 | 0.002 | |
| F1 | 0.799 | 0.676 | 0.160 | 0.819 | 0.621 | 0.002 | |
To evaluate the adequacy of the features selected for the generation of the instance space, we test their performance in terms of predicting the scenario outcome without them being executed in the simulator. For this, we train five machine learning classifiers using these features and use the trained models to classify the unknown scenarios either as safe or unsafe. For comparison, we also train these classifiers with randomly selected features and present their predictive performance. Table 2 reports the performance in terms of precision, recall and F1 score. To find the statistical difference in the performance by using different sets of features, we use Wilcoxon Signed-Rank test p-values. The p-value indicates a significant difference between the quality of the solutions provided by the different methods, insignificant otherwise.
As discussed in Section 3.3, for Dataset 1, the model training is performed on 80% of the data, while the rest 20% is used for testing. However, for Dataset 2, training and testing are performed on two different datasets. Models are trained on the test scenarios generated using Frenetic test generation technique (Castellano et al., 2021), while tested on a test suite generated by AmbieGen test generator (Humeniuk et al., 2022). Evaluating the classification models on a different test suite, which is not part of the instance space, gives us an opportunity to test the generalizability of the proposed method.
It can be seen that for both of the datasets, the models trained with the features selected by our methodology perform statistically better than the features chosen randomly. These features, therefore, can be used in test case selection and prioritisation techniques, where critical scenarios can be identified based on impactful features, without executing the scenarios in a simulator. Furthermore, though the randomly selected features do not perform as well as the features selected by our proposed methodology, their performance is not very low. In the majority of cases, the precision, recall and F1 score of the classifiers trained with random features is higher than 70% for dataset1, and 60% for dataset 2. This gives us further confidence in the suitability and relevance of the set of features we extracted for our study.
4.3. Instance Space Coverage (RQ3)
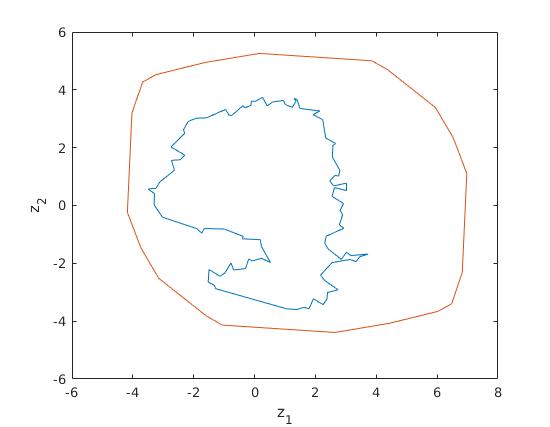

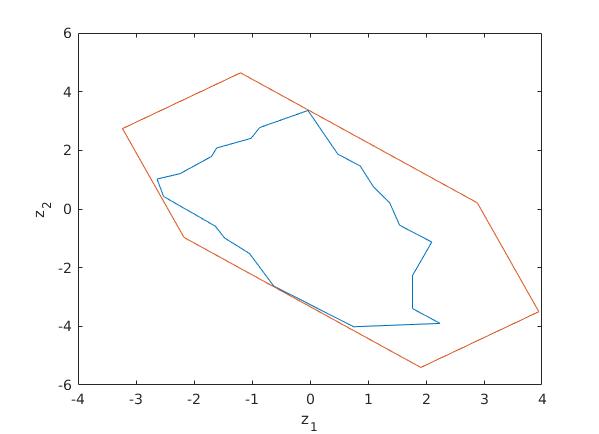
The coverage metric introduced in Section 3.4 provides an objective measure of how extensively the scenario space has been explored relative to the expanded boundary computed mathematically. Figures 5 and 6 show the boundary created based on the maximum and minimum values of the features deemed as impactful by ISA for dataset 1 and dataset 2 respectively. The empty regions enclosed by the boundary represent test scenarios that are empirically possible to generate, however, they are not part of the current test suite.
Figures 5b and 6b show the polygons generated by the expanded boundary (red) and the instance space (blue) for Dataset 1 and 2 respectively. For Dataset 1, the areas computed for these polygons are: and respectively. Using equation 2, the coverage of this test suite is computed as 32.69%, indicating that 67.33% of the possible feature space is still untested. For Dataset 2, and , resulting in test coverage of 50.01%.
Striving for 100% coverage by generating driving scenarios to test every possible driving situation is impractical, as simulating test scenarios is a resource and time-intensive activity. Therefore, more effort should be put into testing the error-prone regions of the testing space. As the instance space is created in such a way that safe scenarios lie at one end of the space and unsafe at the other, it is possible to find the regions of the feature space where the probability of failure is high. For Dataset 1, based on the distribution trend for scenario outcome, the probability of failure is higher in Q1 and Q4. For Dataset 2, as the distribution pattern of failure increases from bottom-right to top-left (diagonally), Q2 seems to have a high probability of failed scenarios. Adding new scenarios to these regions will improve the quality of testing by adding more challenging conditions for the system.
Generation of the test scenarios having feature values that will project to a particular point in the instance space is a challenging task. One possible way of doing this is by setting the target points in the instance space, and evolving existing instances, using Genetic Algorithms, to adapt their data so that they occupy the target locations in the instance space (Muñoz and Smith-Miles, 2020). However, our focus in this study is to assess how well the scenario space has been explored, which is computed using the coverage of the instance space. The generation of the missing test scenarios using controllable test properties is beyond the scope of the current study, and we intend to pursue this as future research.
5. Related Studies
In the realm of AV testing, the representation of scenarios poses a challenge due to the intricate nature of the search space and the presence of an infinitely large number of parameter combinations, as highlighted in the survey by Ding et al. (Ding et al., 2022). This section aims to explore the existing studies in this field, shedding light on prior research efforts. Furthermore, it elucidates how the proposed technique differs from the prior work, emphasising the novel contributions and advancements it brings to the domain.
5.1. Safety Critical Scenario Generation
A study conducted through surveys and semi-structured interviews with developers and testers working in the AV industry identifies that generating possible corner cases and unexpected driving scenarios is a crucial requirement in AV testing (Lou et al., 2022). Several techniques have been proposed to generate safety-critical test scenarios for AVs (Chandrasekaran et al., 2021; Gambi et al., 2019a; Han and Zhou, 2020; Klück et al., 2018; Li et al., 2020c; Tao et al., 2019; Tian et al., 2018; Zhang et al., 2018; Zhou et al., 2020; Tian et al., 2022b; Abdessalem et al., 2018; Ben Abdessalem et al., 2016; Calò et al., 2020). Chandrasekaran et al. propose a combinatorial testing approach to generate images to test DNN models used in AVs (Chandrasekaran et al., 2021). AC3R uses natural language processing and domain-specific ontology to extract car crash driving scenarios from police reports (Gambi et al., 2019a). Kluck et al. use domain ontologies providing the environmental models, and combinatorial testing for obtaining critical scenarios (Klück et al., 2018). In (Zhang et al., 2018; Tian et al., 2018; Han and Zhou, 2020), metamorphic relations are used to test the behaviour of an ADS. Zhou et al. generate safety-critical scenarios by adding adversarial perturbations on real-world billboards (Zhou et al., 2020). Tian et al. mine behaviour patterns that lead to collision from naturalistic driving datasets. Utilising these patterns, they first create abstract scenarios by combining various behavioural patterns and then generate concrete scenarios by calculating participant trajectories that align with the selected patterns (Tian et al., 2022b). Stocco et al. present an architecture in their papers to identify safety-critical misbehaviour, such as collisions and out of bound occurrences, in autonomous driving systems (Stocco et al., 2020; Stocco and Tonella, 2022). The proposed framework involves using a variational autoencoder (VAE) to reconstruct a sequence of prior input images of a current scene and to determine the corresponding reconstruction errors. The model is trained on normal data and learns a probability distribution of the observed reconstruction errors using maximum likelihood estimation. This distribution is then utilised to establish a threshold value for differentiating between anomalous and normal behaviour while regulating the detection’s false positive rate. An SDC, equipped with the trained model, raises a misbehaviour flag when it encounters a scenario that yields a high reconstruction error compared to the threshold computed during training.
Search-based techniques are well suited for system testing of complicated problems like AVs (Zeller, 2017). SAMOTA (Haq et al., 2022) combines surrogate-assisted optimisation and many-objective search to generate test scenarios effectively and efficiently. AsFault (Gambi et al., 2019b) uses a genetic algorithm to search for the most properties of a road that lead AV to move away from the centre of the lane. In (Abdessalem et al., 2018), Abdessalem et al. use a multi-objective evolutionary algorithm to find the system-level failures of AVs, caused by feature interaction. In another study (Ben Abdessalem et al., 2016), they use surrogate models with multi-objective search to test the pedestrian detection system of an ADS. AV-Fuzzer (Li et al., 2020b), MOSAT (Tian et al., 2022a) and ATLAS (Tang et al., 2021b) use Genetic algorithms to manipulate the manoeuvres of other vehicles on the road (Non-playable Characters – NPCs) to make the driving scenarios more challenging for AVs. AutoFuzz uses Neural Networks to guide an evolutionary search over inputs of autonomous vehicle API (Zhong et al., 2022). The technique involves training the network to forecast whether new seeds will lead to unique traffic violations, with the most promising seeds being mutated to generate new adversarial inputs.
Our proposed method enhances test generation techniques by pinpointing the characteristics that have a significant impact on the safety-criticality of autonomous vehicles (AVs). This approach reduces the search space’s complexity by narrowing down the features that require testing.
5.2. Test Selection and Prioritisation
To reduce the execution cost associated with AV testing, various test prioritisation and selection approaches are proposed. Arrieta et al. propose a search-based test-prioritisation method for cyber-physical systems product lines by incorporating five objectives in the fitness function i.e., fault detection capability, functional requirements covering time, non-functional requirements covering time, simulation time, and test case execution time (Arrieta et al., 2019). In another study, Arrieta et al. propose a test selection technique for simulation models, using Non-Dominated Sorting Genetic Algorithm-II (NSGA-II), as a multi-objective search algorithm (Arrieta et al., 2018). In (Ben Abdessalem et al., 2016), multi-objective search is used to find safety-critical scenarios in Pedestrian Detection Vision System for autonomous cars. The metric to guide the search is the distance between car and pedestrian, the distance between pedestrian and acute warning area, and time to collision (TTC) (Vogel, 2003). In (Lu et al., 2021), Birchler et al. propose to use static road features to prioritise the test cases for regression testing (Birchler et al., 2021). The search is guided by the fitness function that gives higher priority to the test cases having higher diversity and lower execution cost, which are estimated based on the previous runs of the test cases. Lu et al. (Lu et al., 2021) propose a test prioritisation technique for regression testing. Based on attributes of test cases e.g., speed, throttle, weather conditions etc., they compute four properties of test cases i.e., diversity, demand, collision probability and collision information, which are then used to guide the search to find the scenarios that lead to a collision. Deng et al. propose a test reduction and prioritisation approach for multi-module automated driving systems called STRaP (Scenario-based Test Reduction and Prioritisation) (Deng et al., 2022). Their approach encodes driving recordings into feature vectors using a driving scene schema and slices the recording into segments based on the similarity of consecutive vectors. They then truncate lengthy segments, remove redundant segments with the same vector, and prioritise the remaining segments based on both the coverage and rarity of driving scenes. It’s worth noting that the feature vector employed in their approach bears a striking resemblance to the feature set utilised in our study. However, there are notable distinctions between our work and STRaP. Specifically, STRaP employs these features to identify stagnant recording segments and subsequently pinpoint and prioritise test scenarios that are capable of revealing failures during regression testing. In contrast, our approach, ISA, focuses on identifying features that exert a comprehensive influence on test outcomes. We employ these influential features to project instances into a two-dimensional (2D) space, enabling us to gain visual insights into the overall quality of the test suite.
The goal of the test prioritisation and selection techniques mentioned above is to cut the cost of the testing process by decreasing the size of the test suite. These techniques are proposed for regression testing in particular, to confirm that the recent code has not adversely affected the older features. Unlike these techniques, we propose to decrease the complexity of the search process by identifying the most impactful features challenging the safety of AV. The selected set of features can be used in test generation, prioritisation and selection. As the test scenarios for AV are composed of features to represent the environment, roads, AV, NPCs etc., some of the test generation and prioritisation techniques available in literature indirectly uses these features to compute fitness metric to guide search(e.g. diversity in (Lu et al., 2021; Birchler et al., 2021)). However, these techniques do not aim at finding an optimal set of features, and the diversity is computed based on the full feature vector used to design the test cases. In (Birchler et al., 2021), although a subset of features is selected from the complete road features using PCA, the goal of feature selection is to remove the correlated features without considering the impact of these features on test outcome (safe/unsafe). Furthermore, all the above-mentioned studies use test outcomes, like, execution time, time to collision, diversity of the test cases etc. as heuristics to guide the search towards safety-critical scenarios. Unlike these studies, we are interested in finding the compositional properties or input features of the test cases that should be considered to generate effective scenarios.
5.3. Test Scenarios Input Features
Kluck et al. (Klück et al., 2021) study the minimum number of features required to generate a test case that would lead to a collision. They consider two types of driving scenarios in their study: car-to-car and car-to-pedestrian scenarios generated in their previous work (Klück et al., 2019b, a). Test cases are characterised by the properties of pedestrian members (start speed, offset, rate), AV (start speed, rate, target speed) and other participating vehicles (start speed, offset, target speed and rate). The number of vehicles ranges from 1 to 3 while the number of pedestrians ranges from 0 to 2. Decision trees are used to extract rules that lead to a crash either with pedestrians or other vehicles with high probability. It is shown that the combination of at least 4 parameters is required to generate a critical scenario with a high crash probability. Unlike (Klück et al., 2021), which finds the minimum number of features in a combination to make a scenario critical, we are interested in “which” features should be used and the range of their values (low or high), along with the possible combinations of these features that would increase the probability of a crash in a scenario.
Cara and de Gelder use machine learning classifiers to classify car-cyclist scenarios into oncoming, longitudinal, or crossing scenarios using the trajectory features of the car and the cyclist (Cara and de Gelder, 2015). Bircher et al. classify driving scenarios into safe and unsafe based on road static features (Birchler et al., 2022a). In (Kruber et al., 2018, 2019; Kerber et al., 2020; Hauer et al., 2020), clustering techniques have been used to cluster traffic scenarios based on various features and distance measures. All of these techniques use compositional features of test scenarios for classification/clustering, however, finding the impact of features on test criticality has not been a research focus in these studies. Furthermore, although we have reported the prediction performance of four machine learning classifiers that classify the test-scenarios as safe or unsafe based on the feature values selected by ISA, the goal of feature selection in our proposed technique is multifold. ISA selects a subset of features that best defines a test scenario and clearly distinguishes a safe from an unsafe scenario, both in feature space and instance space. The instance space is created by making the projections such that the low values of features/test outcomes lie at one end of a straight line and high values at the other, i.e, linear trends of distribution of features and test result. Therefore, the impact of each feature on the performance can be clearly visualised, promoting the explainable feature selection. Furthermore, the instance space provides valuable insights into the coverage of the feature space and the diversity of the failed scenarios.
5.4. Test Adequacy Criteria
To measure the sufficiency of system-level testing, various black-box coverage criteria and diversity metrics have been proposed (Aghababaeyan et al., 2021; Hauer et al., 2019b; Arcaini et al., 2021; Tang et al., 2021a; Majzik et al., 2019; Laurent et al., 2022). Aghababaeyan et al. perform a correlation analysis of three black-box diversity measures (Geometric Diversity (Kulesza et al., 2012), Normalised Compression Distance (Cohen and Vitányi, 2014), and Standard Deviation) with fault detection, and report that Geometric Diversity shows the highest and statistically significant correlation. They further found that white-box coverage metrics are not an adequate measure for the quality of Deep Neural Networks (DNNs) (Aghababaeyan et al., 2021). Hauer et al. propose to use “types of test scenarios” included in a test suite as a measure of coverage (Hauer et al., 2019b). Similarly, Arcaini et al. introduce some lower-level driving characteristics, such as “turning with high lateral acceleration”, and use them as a measure of coverage (Arcaini et al., 2021). Tang et al. classify the scenarios based on the topological structure of the map and reported the performance of their proposed technique based on coverage of these structures (Tang et al., 2021a). Majzik et al. provide a system-level situation coverage criteria with respect to the safety concepts captured by domain experts (Majzik et al., 2019). In (Laurent et al., 2022), a parameter coverage criterion for Autonomous Driving Systems(ADSs) is proposed. Unlike these coverage measures, the coverage metric proposed in this study measures how extensively the feature space has been tested. It also identifies the critical regions where the probability of generation of safety-critical scenarios is high and thus should be prioritised to be tested.
Riccio et al. propose a search-based tool, DeepJanus, to find the pair of closely related test scenarios which shows different test outcomes (safe vs. unsafe), thus defining the frontier of behaviours of the Deep Learning (DL) system (Riccio and Tonella, 2020). To assess the quality of the system, they introduce the notion of “radius”, which measures the distance between a nominal input (that the system is expected to handle correctly) and the input at the outer frontier. A high-quality system (HQ) shows a larger radius as compared to a low-quality (LQ), depicting that the system can tolerate larger changes to the input before exhibiting misbehaviour.
Jahangirova et al. extracted a set of 126 metrics that define the quality of human driving (Jahangirova et al., 2021). A subset of 26 metrics is selected by a user study that aim to find the correlation between these metrics and human perception of driving quality of AVs. They further used these metrics as an oracle to assess the behaviour of an AV.
A closely related work by Zohdinasab et al. (Zohdinasab et al., 2021) proposes a framework, known as DeepHyperion, which analyses the impact of features on the quality of the Deep Learning (DL) systems using illumination search (Mouret and Clune, 2015). The test instances are evaluated based on the fitness function, which measures the misbehaviour of the system-under-test, and the values for each test case are visualised in cells of a map whose coordinates are defined by the two features of interest. The combination of the features that map to the cell having a maximum number of misbehaving instances (based on fitness value), is considered to have an impact on the misbehaviour. The map also provides a measure of the diversity of the failure-inducing inputs for feature combinations. A limitation of DeepHyperion is that it uses open coding procedure to give a label to the input value of each feature, which is done manually. This procedure is done for every feature, which limits the scalability of the system and makes it infeasible to test instances having many features. Similar to DeepHyperion, ISA identifies the features having an impact on test outcomes and provides a quantitative measure of the coverage of the feature space. ISA, however, performs this process automatically and creates a footprint map of all features simultaneously, thus allowing the analysis of the relative importance of the different features.
6. Threats to Validity
Internal validity threats exist when the presented results are influenced by internal factors. One such factor is the choice of features used in the current study. In order to mitigate this threat, we selected a wide range of features providing a detailed representation of AV, surrounding vehicles, pedestrians, road, and weather conditions. The representation of AV testing scenarios using some/all of these features is a common practice in AV-testing (Lu et al., 2021; Ding et al., 2022; Li et al., 2020a; Ebadi et al., 2021).
Another factor could be using a different metric for the performance analysis of a testing scenario, such as collision probability (Lu et al., 2022). This may result in the selection of different features, and thus the axis of the instance space might change, and results may differ. However, this does not impact the findings of the current paper, and the identified features significantly impact the effectiveness of test cases under the context that we have described in the experimental design section.
Conclusion threats to validity pertain to issues that can affect the accuracy and reliability of the study’s conclusions. One such threat in our study revolves around the legitimacy of feature combinations utilised in the boundary estimation process for coverage calculation. These combinations are deduced from test scenarios through feature correlation analysis. However, if the test suite contains scenarios that are either invalid or unrealistic, it can lead to the acquisition of incorrect correlations, thereby invalidating the boundary.
To mitigate this particular threat, we have taken a proactive approach by leveraging test suites from three prior studies that have been reported to encompass valid and realistic driving scenarios (Lu et al., 2021; Castellano et al., 2021; Humeniuk et al., 2022).
External validity threats impact the generalizability of the results. To minimise these impacts, the data we used in our experiments is generated by testing Baidu Apollo – an industrial-grade level-4 platform for AVs, and SVL– an end-to-end autonomous vehicle simulation platform, and BeamNG.tech simulator. All of these tools are widely used in the literature of AV testing (Ebadi et al., 2021; Li et al., 2020a; Nguyen et al., 2021; Almanee et al., 2021; Lu et al., 2021; Birchler et al., 2022b, 2021).
7. Discussion
The coverage metric, denoted as , serves as a means to gauge the extent of coverage achieved by a test suite in relation to the extended instance space (boundary). This metric offers a visual representation of the coverage landscape, allowing testers to visually inspect areas that have been well covered and those that remain unexplored. This visualisation proves invaluable in identifying testing gaps and guiding efforts to enhance coverage by focusing on specific regions within the feature space.
The accuracy of hinges on the feasibility of boundary estimation, which entails defining the upper and lower limits of the features associated with driving scenarios. In our present study, the boundary calculation relies on the maximum and minimum feature values available within the test suite itself. Consequently, unoccupied regions in Figures 5 and 6 indicate scenarios absent relative to the test suite’s content.
However, it’s worth highlighting that ongoing research efforts, such as those related to Operational Design Domains (ODDs) (Ye and Wang, 2022), are actively exploring the establishment of absolute feature boundaries. These ODDs delineate the feasible driving conditions in which autonomous vehicles (AVs) can theoretically and practically operate. While initial progress has been made in defining these boundaries (Kaiser, 2021), coverage based on absolute boundaries would provide a measure of how comprehensively the entire feature space, as defined by potential driving conditions, is tested. This assessment would remain independent of the specific test suite used to generate the instance space.
8. Conclusion and Future Work
This work presents a technique for the identification of input features of test scenarios that impact their effectiveness in terms of safety-criticality using Instance Space Analysis. ISA identifies features that show a high impact on the test outcome and generates a instance space of test scenarios using these features. The distribution of feature values and test outcomes in the generated space helps to visually examine the impact of an individual feature and feature combinations on the test outcome. Furthermore, using the minimum and maximum values of feasible feature combinations, an area surrounding the instance space is identified where test scenarios can exist empirically, however, missing from the current instance space, giving an idea about the coverage of the current test suite.
ISA further trains five machine learning classifiers that classify the unlabelled test scenarios as safe or unsafe based on the selected features. The high performance of the classifiers, measured in terms of precision, recall, and f1-score, demonstrates that the selected features are predictive of the test scenario outcome and can be used to find the test result without simulating it, thus can help reduce the testing time.
In our future work, we plan to develop a technique to fill the empty regions of the instance space by generating test scenarios having controlled properties.
9. DATA AVAILABILITY
Test scenarios, metadata containing features and test outcome, and feature extraction code are publicly available at https://github.com/neelofarhassan/ISA-for-AVs/tree/master. The code for ISA is available at (Muñoz, 2021).
References
- (1)
- apo ([n. d.]) [n. d.]. Baidu Apollo team (2017), Apollo: Open Source Autonomous Driving. https://github.com/ApolloAuto/apollo.
- Bea ([n. d.]) [n. d.]. BeamNG.tech. https://beamng.tech/.
- Pol ([n. d.]) [n. d.]. Mathworks Polyarea. https://www.mathworks.com/help/matlab/ref/polyarea.html.
- pol ([n. d.]) [n. d.]. Mathworks Polygons. https://au.mathworks.com/help/map/create-and-display-polygons.html.
- Abdessalem et al. (2018) Raja Ben Abdessalem, Annibale Panichella, Shiva Nejati, Lionel C Briand, and Thomas Stifter. 2018. Testing autonomous cars for feature interaction failures using many-objective search. In 2018 33rd IEEE/ACM International Conference on Automated Software Engineering (ASE). IEEE, 143–154.
- Abdi and Williams (2010) Hervé Abdi and Lynne J Williams. 2010. Principal component analysis. Wiley interdisciplinary reviews: computational statistics 2, 4 (2010), 433–459.
- Afzal et al. (2021) Afsoon Afzal, Deborah S Katz, Claire Le Goues, and Christopher S Timperley. 2021. Simulation for robotics test automation: Developer perspectives. In 2021 14th IEEE Conference on Software Testing, Verification and Validation (ICST). IEEE, 263–274.
- Aghababaeyan et al. (2021) Zohreh Aghababaeyan, Manel Abdellatif, Lionel Briand, Mojtaba Bagherzadeh, et al. 2021. Black-Box Testing of Deep Neural Networks through Test Case Diversity. arXiv preprint arXiv:2112.12591 (2021).
- Aleti and Martinez (2020) Aldeida Aleti and Matias Martinez. 2020. E-apr: Mapping the effectiveness of automated program repair. arXiv preprint arXiv:2002.03968 (2020).
- Ali et al. (2019) Elhashemi M Ali, Mohamed M Ahmed, and Shaun S Wulff. 2019. Detection of critical safety events on freeways in clear and rainy weather using SHRP2 naturalistic driving data: Parametric and non-parametric techniques. Safety Science 119 (2019), 141–149.
- Almanee et al. (2021) Sumaya Almanee, Xiafa Wu, Yuqi Huai, Qi Alfred Chen, and Joshua Garcia. 2021. scenoRITA: Generating Less-Redundant, Safety-Critical and Motion Sickness-Inducing Scenarios for Autonomous Vehicles. arXiv preprint arXiv:2112.09725 (2021).
- Aranganayagi and Thangavel (2007) S Aranganayagi and Kuttiyannan Thangavel. 2007. Clustering categorical data using silhouette coefficient as a relocating measure. In International conference on computational intelligence and multimedia applications (ICCIMA 2007), Vol. 2. IEEE, 13–17.
- Arcaini et al. (2021) Paolo Arcaini, Xiao-Yi Zhang, and Fuyuki Ishikawa. 2021. Targeting patterns of driving characteristics in testing autonomous driving systems. In 2021 14th IEEE Conference on Software Testing, Verification and Validation (ICST). IEEE, 295–305.
- Arrieta et al. (2018) Aitor Arrieta, Shuai Wang, Ainhoa Arruabarrena, Urtzi Markiegi, Goiuria Sagardui, and Leire Etxeberria. 2018. Multi-objective black-box test case selection for cost-effectively testing simulation models. In Proceedings of the Genetic and Evolutionary Computation Conference. 1411–1418.
- Arrieta et al. (2019) Aitor Arrieta, Shuai Wang, Goiuria Sagardui, and Leire Etxeberria. 2019. Search-based test case prioritization for simulation-based testing of cyber-physical system product lines. Journal of Systems and Software 149 (2019), 1–34.
- Ben Abdessalem et al. (2016) Raja Ben Abdessalem, Shiva Nejati, Lionel C Briand, and Thomas Stifter. 2016. Testing advanced driver assistance systems using multi-objective search and neural networks. In Proceedings of the 31st IEEE/ACM international conference on automated software engineering. 63–74.
- Birchler et al. (2022a) Christian Birchler, Nicolas Ganz, Sajad Khatiri, Alessio Gambi, and Sebastiano Panichella. 2022a. Cost-effective simulation-based test selection in self-driving cars software with SDC-Scissor. In 29th IEEE International Conference on Software Analysis, Evolution, and Reengineering, Honolulu, USA (online), 15-18 March 2022. ZHAW Zürcher Hochschule für Angewandte Wissenschaften.
- Birchler et al. (2021) Christian Birchler, Sajad Khatiri, Pouria Derakhshanfar, Sebastiano Panichella, and Annibale Panichella. 2021. Automated test cases prioritization for self-driving cars in virtual environments. arXiv preprint arXiv:2107.09614 (2021).
- Birchler et al. (2022b) Christian Birchler, Sajad Khatiri, Pouria Derakhshanfar, Sebastiano Panichella, and Annibale Panichella. 2022b. Single and Multi-objective Test Cases Prioritization for Self-driving Cars in Virtual Environments. Proceedings of the ACM on Measurement and Analysis of Computing Systems (2022).
- Breiman (2001) Leo Breiman. 2001. Random forests. Machine learning 45, 1 (2001), 5–32.
- Calò et al. (2020) Alessandro Calò, Paolo Arcaini, Shaukat Ali, Florian Hauer, and Fuyuki Ishikawa. 2020. Generating avoidable collision scenarios for testing autonomous driving systems. In 2020 IEEE 13th International Conference on Software Testing, Validation and Verification (ICST). IEEE, 375–386.
- Campos et al. (2017) José Campos, Yan Ge, Gordon Fraser, Marcelo Eler, and Andrea Arcuri. 2017. An empirical evaluation of evolutionary algorithms for test suite generation. In International Symposium on Search Based Software Engineering. Springer, 33–48.
- Cara and de Gelder (2015) Irene Cara and Erwin de Gelder. 2015. Classification for safety-critical car-cyclist scenarios using machine learning. In 2015 IEEE 18th International Conference on Intelligent Transportation Systems. IEEE, 1995–2000.
- Castellano et al. (2021) Ezequiel Castellano, Ahmet Cetinkaya, Cédric Ho Thanh, Stefan Klikovits, Xiaoyi Zhang, and Paolo Arcaini. 2021. Frenetic at the SBST 2021 Tool Competition. In 2021 IEEE/ACM 14th International Workshop on Search-Based Software Testing (SBST). 36–37. https://doi.org/10.1109/SBST52555.2021.00016
- Chandrasekaran et al. (2021) Jaganmohan Chandrasekaran, Yu Lei, Raghu Kacker, and D Richard Kuhn. 2021. A combinatorial approach to testing deep neural network-based autonomous driving systems. In 2021 IEEE International Conference on Software Testing, Verification and Validation Workshops (ICSTW). IEEE, 57–66.
- Chen et al. (2020) Junjie Chen, Ming Yan, Zan Wang, Yuning Kang, and Zhuo Wu. 2020. Deep neural network test coverage: How far are we? arXiv preprint arXiv:2010.04946 (2020).
- Cohen and Vitányi (2014) Andrew R Cohen and Paul MB Vitányi. 2014. Normalized compression distance of multisets with applications. IEEE transactions on pattern analysis and machine intelligence 37, 8 (2014), 1602–1614.
- Daszykowski et al. (2001) Michal Daszykowski, Beata Walczak, and DL Massart. 2001. Looking for natural patterns in data: Part 1. Density-based approach. Chemometrics and Intelligent laboratory systems 56, 2 (2001), 83–92.
- De Winter et al. (2016) Joost CF De Winter, Samuel D Gosling, and Jeff Potter. 2016. Comparing the Pearson and Spearman correlation coefficients across distributions and sample sizes: A tutorial using simulations and empirical data. Psychological methods 21, 3 (2016), 273.
- Deng et al. (2022) Yao Deng, Xi Zheng, Mengshi Zhang, Guannan Lou, and Tianyi Zhang. 2022. Scenario-based test reduction and prioritization for multi-module autonomous driving systems. In Proceedings of the 30th ACM Joint European Software Engineering Conference and Symposium on the Foundations of Software Engineering. 82–93.
- Ding et al. (2022) Wenhao Ding, Chejian Xu, Haohong Lin, Bo Li, and Ding Zhao. 2022. A Survey on Safety-critical Scenario Generation from Methodological Perspective. arXiv preprint arXiv:2202.02215 (2022).
- Ebadi et al. (2021) Hamid Ebadi, Mahshid Helali Moghadam, Markus Borg, Gregory Gay, Afonso Fontes, and Kasper Socha. 2021. Efficient and Effective Generation of Test Cases for Pedestrian Detection-Search-based Software Testing of Baidu Apollo in SVL. In 2021 IEEE International Conference on Artificial Intelligence Testing (AITest). IEEE, 103–110.
- Edelsbrunner et al. (1983) Herbert Edelsbrunner, David Kirkpatrick, and Raimund Seidel. 1983. On the shape of a set of points in the plane. IEEE Transactions on information theory 29, 4 (1983), 551–559.
- Gambi et al. (2019a) Alessio Gambi, Tri Huynh, and Gordon Fraser. 2019a. Generating effective test cases for self-driving cars from police reports. In Proceedings of the 2019 27th ACM Joint Meeting on European Software Engineering Conference and Symposium on the Foundations of Software Engineering. 257–267.
- Gambi et al. (2022) Alessio Gambi, Gunel Jahangirova, Vincenzo Riccio, and Fiorella Zampetti. 2022. SBST tool competition 2022. In Proceedings of the 15th Workshop on Search-Based Software Testing. 25–32.
- Gambi et al. (2019b) Alessio Gambi, Marc Mueller, and Gordon Fraser. 2019b. Automatically testing self-driving cars with search-based procedural content generation. In Proceedings of the 28th ACM SIGSOFT International Symposium on Software Testing and Analysis. 318–328.
- Géron (2022) Aurélien Géron. 2022. Hands-on machine learning with Scikit-Learn, Keras, and TensorFlow. ” O’Reilly Media, Inc.”.
- Ghani et al. (2009) Kamran Ghani, John A Clark, and Yuan Zhan. 2009. Comparing algorithms for search-based test data generation of Matlab® Simulink® models. In 2009 IEEE Congress on Evolutionary Computation. IEEE, 2940–2947.
- Han and Zhou (2020) Jia Cheng Han and Zhi Quan Zhou. 2020. Metamorphic fuzz testing of autonomous vehicles. In Proceedings of the IEEE/ACM 42nd International Conference on Software Engineering Workshops. 380–385.
- Haq et al. (2022) Fitash Ul Haq, Donghwan Shin, and Lionel Briand. 2022. Efficient online testing for DNN-enabled systems using surrogate-assisted and many-objective optimization. In Proceedings of the 44th International Conference on Software Engineering. 811–822.
- Harman and McMinn (2007) Mark Harman and Phil McMinn. 2007. A theoretical & empirical analysis of evolutionary testing and hill climbing for structural test data generation. In Proceedings of the 2007 international symposium on Software testing and analysis. 73–83.
- Hauer et al. (2020) Florian Hauer, Ilias Gerostathopoulos, Tabea Schmidt, and Alexander Pretschner. 2020. Clustering traffic scenarios using mental models as little as possible. In 2020 IEEE Intelligent Vehicles Symposium (IV). IEEE, 1007–1012.
- Hauer et al. (2019a) Florian Hauer, Alexander Pretschner, and Bernd Holzmüller. 2019a. Fitness functions for testing automated and autonomous driving systems. In International Conference on Computer Safety, Reliability, and Security. Springer, 69–84.
- Hauer et al. (2019b) Florian Hauer, Tabea Schmidt, Bernd Holzmüller, and Alexander Pretschner. 2019b. Did we test all scenarios for automated and autonomous driving systems?. In 2019 IEEE Intelligent Transportation Systems Conference (ITSC). IEEE, 2950–2955.
- Hinkle et al. (2003) Dennis E Hinkle, William Wiersma, and Stephen G Jurs. 2003. Applied statistics for the behavioral sciences. (No Title) (2003).
- Humeniuk et al. (2022) Dmytro Humeniuk, Giuliano Antoniol, and Foutse Khomh. 2022. AmbieGen tool at the SBST 2022 Tool Competition. In Proceedings of the 15th Workshop on Search-Based Software Testing. 43–46.
- Jahangirova et al. (2021) Gunel Jahangirova, Andrea Stocco, and Paolo Tonella. 2021. Quality metrics and oracles for autonomous vehicles testing. In 2021 14th IEEE Conference on Software Testing, Verification and Validation (ICST). IEEE, 194–204.
- Kaiser (2021) Bernhard Kaiser. 2021. Application Story of ODD as part of Safety Assurance. https://www.asam.net/index.php?eID=dumpFile&t=f&f=4303&token=3135965e578e5bb92a01725cd37823c3979da158.
- Kalra and Paddock (2016) Nidhi Kalra and Susan M Paddock. 2016. How many miles of driving would it take to demonstrate autonomous vehicle reliability. RAND Corporation, Santa Monica, CA, Tech. Rep (2016), 1129–1134.
- Kang et al. (2017) Yanfei Kang, Rob J Hyndman, and Kate Smith-Miles. 2017. Visualising forecasting algorithm performance using time series instance spaces. International Journal of Forecasting 33, 2 (2017), 345–358.
- Kerber et al. (2020) Jonas Kerber, Sebastian Wagner, Korbinian Groh, Dominik Notz, Thomas Kühbeck, Daniel Watzenig, and Alois Knoll. 2020. Clustering of the scenario space for the assessment of automated driving. In 2020 IEEE Intelligent Vehicles Symposium (IV). IEEE, 578–583.
- Kim et al. (2016) Baekgyu Kim, Yusuke Kashiba, Siyuan Dai, and Shinichi Shiraishi. 2016. Testing autonomous vehicle software in the virtual prototyping environment. IEEE Embedded Systems Letters 9, 1 (2016), 5–8.
- Klück et al. (2018) Florian Klück, Yihao Li, Mihai Nica, Jianbo Tao, and Franz Wotawa. 2018. Using ontologies for test suites generation for automated and autonomous driving functions. In 2018 IEEE International symposium on software reliability engineering workshops (ISSREW). IEEE, 118–123.
- Klück et al. (2021) Florian Klück, Franz Wotawa, Gerhard Neubauer, Jianbo Tao, and Mihai Nica. 2021. Analysing Experimental Results Obtained when Applying Search-based Testing to Verify Automated Driving Functions. In 2021 8th International Conference on Dependable Systems and Their Applications (DSA). IEEE, 213–219.
- Klück et al. (2019a) Florian Klück, Martin Zimmermann, Franz Wotawa, and Mihai Nica. 2019a. Genetic algorithm-based test parameter optimization for ADAS system testing. In 2019 IEEE 19th International Conference on Software Quality, Reliability and Security (QRS). IEEE, 418–425.
- Klück et al. (2019b) Florian Klück, Martin Zimmermann, Franz Wotawa, and Mihai Nica. 2019b. Performance comparison of two search-based testing strategies for ADAS system validation. In IFIP International Conference on Testing Software and Systems. Springer, 140–156.
- Kotsiantis (2013) Sotiris B Kotsiantis. 2013. Decision trees: a recent overview. Artificial Intelligence Review 39, 4 (2013), 261–283.
- Kramer (2016) Oliver Kramer. 2016. Scikit-learn. In Machine learning for evolution strategies. Springer, 45–53.
- Kruber et al. (2018) Friedrich Kruber, Jonas Wurst, and Michael Botsch. 2018. An unsupervised random forest clustering technique for automatic traffic scenario categorization. In 2018 21st International Conference on Intelligent Transportation Systems (ITSC). IEEE, 2811–2818.
- Kruber et al. (2019) Friedrich Kruber, Jonas Wurst, Eduardo Sánchez Morales, Samarjit Chakraborty, and Michael Botsch. 2019. Unsupervised and supervised learning with the random forest algorithm for traffic scenario clustering and classification. In 2019 IEEE Intelligent Vehicles Symposium (IV). IEEE, 2463–2470.
- Kulesza et al. (2012) Alex Kulesza, Ben Taskar, et al. 2012. Determinantal point processes for machine learning. Foundations and Trends® in Machine Learning 5, 2–3 (2012), 123–286.
- Laurent et al. (2022) Thomas Laurent, Stefan Klikovits, Paolo Arcaini, Fuyuki Ishikawa, and Anthony Ventresque. 2022. Parameter Coverage for Testing of Autonomous Driving Systems Under Uncertainty. ACM Transactions on Software Engineering and Methodology (2022).
- Li et al. (2020a) Guanpeng Li, Yiran Li, Saurabh Jha, Timothy Tsai, Michael Sullivan, Siva Kumar Sastry Hari, Zbigniew Kalbarczyk, and Ravishankar Iyer. 2020a. AV-FUZZER: Finding safety violations in autonomous driving systems. In 2020 IEEE 31st International Symposium on Software Reliability Engineering (ISSRE). IEEE, 25–36.
- Li et al. (2020b) Guanpeng Li, Yiran Li, Saurabh Jha, Timothy Tsai, Michael Sullivan, Siva Kumar Sastry Hari, Zbigniew Kalbarczyk, and Ravishankar Iyer. 2020b. AV-FUZZER: Finding Safety Violations in Autonomous Driving Systems. In 2020 IEEE 31st International Symposium on Software Reliability Engineering (ISSRE). 25–36. https://doi.org/10.1109/ISSRE5003.2020.00012
- Li et al. (2020c) Yihao Li, Jianbo Tao, and Franz Wotawa. 2020c. Ontology-based test generation for automated and autonomous driving functions. Information and software technology 117 (2020), 106200.
- Lou et al. (2022) Guannan Lou, Yao Deng, Xi Zheng, Mengshi Zhang, and Tianyi Zhang. 2022. Testing of autonomous driving systems: where are we and where should we go?. In Proceedings of the 30th ACM Joint European Software Engineering Conference and Symposium on the Foundations of Software Engineering. 31–43.
- Lu et al. (2022) Chengjie Lu, Yize Shi, Huihui Zhang, Man Zhang, Tiexin Wang, Tao Yue, and Shaukat Ali. 2022. Learning Configurations of Operating Environment of Autonomous Vehicles to Maximize their Collisions. IEEE Transactions on Software Engineering (2022).
- Lu et al. (2023) Chengjie Lu, Tao Yue, and Shaukat Ali. 2023. DeepScenario: An Open Driving Scenario Dataset for Autonomous Driving System Testing.
- Lu et al. (2021) Chengjie Lu, Huihui Zhang, Tao Yue, and Shaukat Ali. 2021. Search-Based Selection and Prioritization of Test Scenarios for Autonomous Driving Systems. In International Symposium on Search Based Software Engineering. Springer, 41–55.
- Majzik et al. (2019) István Majzik, Oszkár Semeráth, Csaba Hajdu, Kristóf Marussy, Zoltán Szatmári, Zoltán Micskei, András Vörös, Aren A Babikian, and Dániel Varró. 2019. Towards system-level testing with coverage guarantees for autonomous vehicles. In 2019 ACM/IEEE 22nd International Conference on Model Driven Engineering Languages and Systems (MODELS). IEEE, 89–94.
- Math et al. (2013) Rafael Math, Angela Mahr, Mohammad M Moniri, and Christian Müller. 2013. OpenDS: A new open-source driving simulator for research. GMM-Fachbericht-AmE 2013 2 (2013).
- Minderhoud and Bovy (2001) Michiel M Minderhoud and Piet HL Bovy. 2001. Extended time-to-collision measures for road traffic safety assessment. Accident Analysis & Prevention 33, 1 (2001), 89–97.
- Mouret and Clune (2015) Jean-Baptiste Mouret and Jeff Clune. 2015. Illuminating search spaces by mapping elites. arXiv preprint arXiv:1504.04909 (2015).
- Muñoz (2021) Mario A Muñoz. 2021. InstanceSpace. https://github.com/andremun/InstanceSpace.
- Muñoz and Smith-Miles (2020) Mario A Muñoz and Kate Smith-Miles. 2020. Generating new space-filling test instances for continuous black-box optimization. Evolutionary computation 28, 3 (2020), 379–404.
- Muñoz and Smith-Miles (2017) Mario A Muñoz and Kate A Smith-Miles. 2017. Performance analysis of continuous black-box optimization algorithms via footprints in instance space. Evolutionary computation 25, 4 (2017), 529–554.
- Muñoz et al. (2018) Mario A Muñoz, Laura Villanova, Davaatseren Baatar, and Kate Smith-Miles. 2018. Instance spaces for machine learning classification. Machine Learning 107, 1 (2018), 109–147.
- Muñoz et al. ([n. d.]) Mario A Muñoz, Tao Yan, Matheus R Leal, Kate A Smith-Miles, Ana C Lorena, Gisele L Pappa, and Rodrigues Romulo M. [n. d.]. An Instance Space Analysis of Regression Problems. ACM Transactions on Knowledge Discovery from Data ([n. d.]).
- Murtagh (1991) Fionn Murtagh. 1991. Multilayer perceptrons for classification and regression. Neurocomputing 2, 5-6 (1991), 183–197.
- Nguyen et al. (2021) Vuong Nguyen, Stefan Huber, and Alessio Gambi. 2021. SALVO: Automated Generation of Diversified Tests for Self-driving Cars from Existing Maps. In 2021 IEEE International Conference on Artificial Intelligence Testing (AITest). IEEE, 128–135.
- Oliveira et al. (2018) Carlos Oliveira, Aldeida Aleti, Lars Grunske, and Kate Smith-Miles. 2018. Mapping the effectiveness of automated test suite generation techniques. IEEE Transactions on Reliability 67, 3 (2018), 771–785.
- Onieva et al. (2015) Enrique Onieva, Unai Hernández-Jayo, Eneko Osaba, Asier Perallos, and Xiao Zhang. 2015. A multi-objective evolutionary algorithm for the tuning of fuzzy rule bases for uncoordinated intersections in autonomous driving. Information Sciences 321 (2015), 14–30.
- Panichella et al. (2017) Annibale Panichella, Fitsum Meshesha Kifetew, and Paolo Tonella. 2017. Lips vs mosa: a replicated empirical study on automated test case generation. In International Symposium on Search Based Software Engineering. Springer, 83–98.
- Panichella et al. (2018) Annibale Panichella, Fitsum Meshesha Kifetew, and Paolo Tonella. 2018. A large scale empirical comparison of state-of-the-art search-based test case generators. Information and Software Technology 104 (2018), 236–256.
- Panichella et al. (2021) Sebastiano Panichella, Alessio Gambi, Fiorella Zampetti, and Vincenzo Riccio. 2021. Sbst tool competition 2021. In 2021 IEEE/ACM 14th International Workshop on Search-Based Software Testing (SBST). IEEE, 20–27.
- Rajabli et al. (2020) Nijat Rajabli, Francesco Flammini, Roberto Nardone, and Valeria Vittorini. 2020. Software verification and validation of safe autonomous cars: A systematic literature review. IEEE Access 9 (2020), 4797–4819.
- Riccio and Tonella (2020) Vincenzo Riccio and Paolo Tonella. 2020. Model-based exploration of the frontier of behaviours for deep learning system testing. In Proceedings of the 28th ACM Joint Meeting on European Software Engineering Conference and Symposium on the Foundations of Software Engineering. 876–888.
- Rish et al. (2001) Irina Rish et al. 2001. An empirical study of the naive Bayes classifier. In IJCAI 2001 workshop on empirical methods in artificial intelligence, Vol. 3. 41–46.
- Rong et al. (2020) Guodong Rong, Byung Hyun Shin, Hadi Tabatabaee, Qiang Lu, Steve Lemke, Mārtiņš Možeiko, Eric Boise, Geehoon Uhm, Mark Gerow, Shalin Mehta, et al. 2020. Lgsvl simulator: A high fidelity simulator for autonomous driving. In 2020 IEEE 23rd International conference on intelligent transportation systems (ITSC). IEEE, 1–6.
- Scalabrino et al. (2016) Simone Scalabrino, Giovanni Grano, Dario Di Nucci, Rocco Oliveto, and Andrea De Lucia. 2016. Search-based testing of procedural programs: Iterative single-target or multi-target approach?. In International Symposium on Search Based Software Engineering. Springer, 64–79.
- Schubert et al. (2017) Erich Schubert, Jörg Sander, Martin Ester, Hans Peter Kriegel, and Xiaowei Xu. 2017. DBSCAN revisited, revisited: why and how you should (still) use DBSCAN. ACM Transactions on Database Systems (TODS) 42, 3 (2017), 1–21.
- Shalev-Shwartz et al. (2017) Shai Shalev-Shwartz, Shaked Shammah, and Amnon Shashua. 2017. On a formal model of safe and scalable self-driving cars. arXiv preprint arXiv:1708.06374 (2017).
- Smith-Miles et al. (2014) Kate Smith-Miles, Davaatseren Baatar, Brendan Wreford, and Rhyd Lewis. 2014. Towards objective measures of algorithm performance across instance space. Computers & Operations Research 45 (2014), 12–24.
- Smith-Miles et al. (2022) Kate Smith-Miles, Mario Andrés Muñoz, Aldeida Aleti, et al. 2022. Instance Space Analysis of Search-Based Software Testing. IEEE Transactions on Software Engineering (2022).
- Stocco and Tonella (2022) Andrea Stocco and Paolo Tonella. 2022. Confidence-driven weighted retraining for predicting safety-critical failures in autonomous driving systems. Journal of Software: Evolution and Process 34, 10 (2022), e2386.
- Stocco et al. (2020) Andrea Stocco, Michael Weiss, Marco Calzana, and Paolo Tonella. 2020. Misbehaviour prediction for autonomous driving systems. In Proceedings of the ACM/IEEE 42nd international conference on software engineering. 359–371.
- Tang et al. (2021a) Yun Tang, Yuan Zhou, Yang Liu, Jun Sun, and Gang Wang. 2021a. Collision avoidance testing for autonomous driving systems on complete maps. In 2021 IEEE Intelligent Vehicles Symposium (IV). IEEE, 179–185.
- Tang et al. (2021b) Yun Tang, Yuan Zhou, Tianwei Zhang, Fenghua Wu, Yang Liu, and Gang Wang. 2021b. Systematic Testing of Autonomous Driving Systems Using Map Topology-Based Scenario Classification. In 2021 36th IEEE/ACM International Conference on Automated Software Engineering (ASE). 1342–1346. https://doi.org/10.1109/ASE51524.2021.9678735
- Tao et al. (2019) Jianbo Tao, Yihao Li, Franz Wotawa, Hermann Felbinger, and Mihai Nica. 2019. On the industrial application of combinatorial testing for autonomous driving functions. In 2019 IEEE International Conference on Software Testing, Verification and Validation Workshops (ICSTW). IEEE, 234–240.
- Taunk et al. (2019) Kashvi Taunk, Sanjukta De, Srishti Verma, and Aleena Swetapadma. 2019. A brief review of nearest neighbor algorithm for learning and classification. In 2019 International Conference on Intelligent Computing and Control Systems (ICCS). IEEE, 1255–1260.
- Tian et al. (2022a) Haoxiang Tian, Yan Jiang, Guoquan Wu, Jiren Yan, Jun Wei, Wei Chen, Shuo Li, and Dan Ye. 2022a. MOSAT: finding safety violations of autonomous driving systems using multi-objective genetic algorithm. In Proceedings of the 30th ACM Joint European Software Engineering Conference and Symposium on the Foundations of Software Engineering. 94–106.
- Tian et al. (2022b) Haoxiang Tian, Guoquan Wu, Jiren Yan, Yan Jiang, Jun Wei, Wei Chen, Shuo Li, and Dan Ye. 2022b. Generating Critical Test Scenarios for Autonomous Driving Systems via Influential Behavior Patterns. In 37th IEEE/ACM International Conference on Automated Software Engineering. 1–12.
- Tian et al. (2018) Yuchi Tian, Kexin Pei, Suman Jana, and Baishakhi Ray. 2018. Deeptest: Automated testing of deep-neural-network-driven autonomous cars. In Proceedings of the 40th international conference on software engineering. 303–314.
- Timperley et al. (2018) Christopher Steven Timperley, Afsoon Afzal, Deborah S Katz, Jam Marcos Hernandez, and Claire Le Goues. 2018. Crashing simulated planes is cheap: Can simulation detect robotics bugs early?. In 2018 IEEE 11th International Conference on Software Testing, Verification and Validation (ICST). IEEE, 331–342.
- Vogel (2003) Katja Vogel. 2003. A comparison of headway and time to collision as safety indicators. Accident analysis & prevention 35, 3 (2003), 427–433.
- Wu et al. (2018) Huayao Wu, Changhai Nie, Justyna Petke, Yue Jia, and Mark Harman. 2018. An empirical comparison of combinatorial testing, random testing and adaptive random testing. IEEE Transactions on Software Engineering 46, 3 (2018), 302–320.
- Ye and Wang (2022) Xinchen Ye and Xuesong Wang. 2022. Operational design domain of automated vehicles at freeway entrance terminals. Accident Analysis & Prevention 174 (2022), 106776.
- Zeller (2017) Andreas Zeller. 2017. Search-based testing and system testing: a marriage in heaven. In 2017 IEEE/ACM 10th International Workshop on Search-Based Software Testing (SBST). IEEE, 49–50.
- Zhang et al. (2018) Mengshi Zhang, Yuqun Zhang, Lingming Zhang, Cong Liu, and Sarfraz Khurshid. 2018. DeepRoad: GAN-based metamorphic testing and input validation framework for autonomous driving systems. In Proceedings of the 33rd ACM/IEEE International Conference on Automated Software Engineering. 132–142.
- Zhong et al. (2022) Ziyuan Zhong, Gail Kaiser, and Baishakhi Ray. 2022. Neural network guided evolutionary fuzzing for finding traffic violations of autonomous vehicles. IEEE Transactions on Software Engineering (2022).
- Zhou et al. (2020) Husheng Zhou, Wei Li, Zelun Kong, Junfeng Guo, Yuqun Zhang, Bei Yu, Lingming Zhang, and Cong Liu. 2020. Deepbillboard: Systematic physical-world testing of autonomous driving systems. In Proceedings of the ACM/IEEE 42nd International Conference on Software Engineering. 347–358.
- Zofka et al. (2016) Marc René Zofka, Sebastian Klemm, Florian Kuhnt, Thomas Schamm, and J Marius Zöllner. 2016. Testing and validating high level components for automated driving: simulation framework for traffic scenarios. In 2016 IEEE intelligent vehicles symposium (IV). IEEE, 144–150.
- Zohdinasab et al. (2021) Tahereh Zohdinasab, Vincenzo Riccio, Alessio Gambi, and Paolo Tonella. 2021. Deephyperion: exploring the feature space of deep learning-based systems through illumination search. In Proceedings of the 30th ACM SIGSOFT International Symposium on Software Testing and Analysis. 79–90.