Studying the workload of a fully decentralized Web3 system: IPFS
Abstract
Web3 aims at creating a decentralized platform that is competitive with modern cloud infrastructures that support today’s Internet. However, Web3 is still limited, supporting only applications in the domains of content creation and sharing, decentralized financing, and decentralized communication. This is mainly due to the technologies supporting Web3: blockchain, IPFS, and libp2p, that although provide a good collection of tools to develop Web3 applications, are still limited in terms of design and performance. This motivates the need to better understand these technologies as to enable novel optimizations that can push Web3 to its full potential. Unfortunately, understanding the current behavior of a fully decentralized large-scale distributed system is a difficult task, as there is no centralized authority that has full knowledge of the system operation.
To this end, in this paper we characterize the workload of IPFS, a key enabler of Web3. To achieve this, we have collected traces from accesses performed by users to one of the most popular IPFS gateways located in North America for a period of two weeks. Through the fine analysis of these traces, we gathered the amount of requests to the system, and found the providers of the requested content. With this data, we characterize both the popularity of requested and provided content, as well as their geo-location (by matching IP address with the MaxMind database). Our results show that most of the requests in IPFS are only to a few different content, that is provided by large portion of peers in the system. Furthermore, our analysis also shows that most requests are provided by the two largest portions of providers in the system, located in North America and Europe. With these insights, we conclude that the current IPFS architecture is sub-optimal and propose a research agenda for the future.
1 Introduction
Today’s Internet is supported by large cloud providers that include Google, Amazon, and Microsoft. These providers support a wide variety of web services that operate at a large scale serving huge numbers of users scattered throughout the World. Nevertheless, this paradigm forces application providers to fully rely and trust on centralized cloud infrastructure that are susceptible to attacks [10, 14] and dictate the terms of service with little to no competition. Moreover, in most application scenarios the control of user data is relinquished in some way to these operators, which is undesirable (and being targeted by legislation such as the European GDPR). To address this, and partially achieved by the increased popularity and use cases enabled by blockchain technologies [29, 21], the concept of Web3 [13] emerged. Web3 aims at decentralizing web technologies to improve user security and privacy as well as providing guaranteed ownership of content, through the use of existing novel peer-to-peer protocols [25, 16].
However, Web3 is still in its early stages and is yet to become competitive with modern cloud infrastructures, in terms of flexibility, application development, security and privacy, and performance. This is due to the current Web3 main technology enablers: blockchain, that maintains and replicates the system state; libp2p [24], that is used to develop decentralized applications (dApps) and their support; and IPFS [2, 27], that is used as an entry-point to most dApps, that are still restricted to the domains of content creation and sharing [8, 22], decentralized financing [28], decentralized communication [3, 6], among a few others. This is because, blockchain, although important for decentralization, also limits the amount of interactions applications can have, as these are mostly made through the blockchain. Furthermore, IPFS still has a large space for performance improvements, as recent studies show that searching for content in IPFS can take up to hours [4].
Most of these technologies rely on peer-to-peer protocols that have been the subject of a large body of research in the past. However, most Web3 technology either are unaware of this research (such is the case for most blockchains that resort to flood dissemination [7] instead of a more efficient gossip dissemination [17] to disseminate mined blocks) or leverage it using similar configurations as described in the research, and sometimes experience performance issues (such is the case of the DHT in IPFS). However, it a non-trivial task to understand the causes for performance issues and how to mitigate them on a decentralized large-scale distribute system, as there is no single node that holds the entire view over the state of the system. Hence, it is paramount to devise techniques and to analyze data obtained from such systems to understand the current environment, workload, and system distribution, to then guide research and optimization for Web3 support [20].
In this paper we present an in-depth analysis of the workload on IPFS. We have gathered two weeks worth of logs of one of the most popular IPFS gateways located in North America. These logs contained the (access) requests made from IPFS users across the World to large amounts of content stored in IPFS. We analyzed these logs and performed the same (valid) requests that were observed in the logs to fetch the information regarding the providers of the requested content. This allowed two things: first to correlate which and how many providers provided which and how many requested content. Second, and through the use of the MaxMind [18] database that matches IP addresses to geo-location information, to find the relation of the location of the origin of requests and location of providers of content to those requests. With this data, we analyzed the IPFS workload and found that most content is provided only by a few providers that are located on North America and Europe.
The remainder of the paper is structured as follows: In Section 2 we provide a brief description of the IPFS network and how it operates. In Section 3 we detail our methodology to gather and analyze the data. In Section 4 we describe our results, providing insights on the workload of the IPFS network. In Section 5 we discuss related work. Finally, Section 6 concludes the paper with final remarks and directions for future work.
2 IPFS
IPFS is large scale peer-to-peer distributed system that aims at connecting computing devices through a shared file system. To enable this, IPFS relies on libp2p [24] to handle networking aspects. To connect peers in the network, libp2p relies on a distributed hash table (DHT), implemented as a variant of the Kademlia protocol [19]. IPFS leverages this DHT to distribute and search content and peers in the system. Content in IPFS is immutable, having each content associated an identifier (cId) that is a multi-hash 111A multi-hash encodes not only the hash of the data, but also hashes of metadata about the hashing process and data type. of the content. Similarly, each peer in IPFS also has an identifier (peerId) that is a multi-hash of the peer’s public key. Peers organize themselves in the DHT according to a SHA-256 hash of their peerId and store content pointers according to the SHA-256 hash of the cId. Furthermore, each peer has associated to it a list of multiaddresses, that describe the internet addresses of the peer (this can be ipv4, ipv6, dns, or other kind of address).
Note that peers do not store the content itself but only a pointer to the peer providing the content. As such, for a peer to publish content on IPFS, the operation the peer effectively performs is to announce that it provides the content by publishing on IPFS a provider record. A provider record contains a mapping of a cId to peerIds – its providers. As per the Kademlia operation, this provider record will be stored in the closest peers to the hash of the cId on the DHT. In IPFS has a value of . Note that the same content can be provided by multiple peers.
To fetch content IPFS uses a protocol named Bitswap [5] that performs both discovery and data transfer. For Bitswap to discover content it begins to perform a local one-hop flood request for the cId. This will send a message to all neighboring peers asking if they have the cId locally. If the answer is positive, Bitswap begins transferring the content with a process akin to BitTorrent [9]. If the response is negative and the content cannot be found on a neighboring peer, it resorts to the DHT to find the provider records of the cId. Once Bitswap has obtain one provider record, it will start to try to transfer the content from providers on that record.
IPFS has two modes of operating: as a server or as a client node. Server nodes are (usually) publicly reachable in the Internet and kept in the DHT to enable routing among peers and serve content to the network. Client nodes connect to the DHT, but do not maintain the DHT, meaning that client nodes can only perform requests to the DHT and do not help in the routing process. Additionally, an IPFS peer can also act as a gateway, in which the IPFS node also runs a web server that grants access to IPFS via a browser interface to user. In more detail, a gateway node is able to transform an HTTP request into a valid IPFS request, that will either trigger a Bitswap and/or DHT operation.
Furthermore, not all IPFS nodes are publicly reachable. This is the case for nodes that are behind a NAT. In this case, an IPFS node can request a publicly reachable IPFS node to relay traffic for that node.
3 Methodology
In this section we provide a detailed description of our methodology to study and characterize the IPFS workload. In summary, we collected two weeks worth (from March 7th to March 21th of 2022) of logs from one of the most popular IPFS gateway – ipfs.io – that is located in North America. These logs were produced by an nginx HTTP server that logged every HTTP request made. As such, each entry in the log contains an HTTP request made by a user to the IPFS gateway.
To process these logs, we filtered all non-valid HTTP requests (e.g., POST operations, out of format entries), and extracted the cId in each valid HTTP request. From this, we fetch all the available provider records from IPFS for each cId. To obtain geo-location information from both the requests and providers, we matched the IP addresses we found against the MaxMind GeoLite2 Free Geolocation Database [18].
Finally, we matched both datasets on the requested and provided cId to produce a global view that shows where content is requested and where that content is served. In the following, we describe this process in more detail.
3.1 Processing the requests
The first step in analyzing the IPFS workload is to extract the requested cIds. To do this, we parse the gateway logs into a structured data format that can be easily processed. The gateway logs are generated by an nginx server, that effectively acts as a reverse proxy for an IPFS server node that acts as an IPFS gateway. Each log entry contains information about the received HTTP request by the IPFS gateway. In particular, we are interested in the following information of the HTTP requests: the IP address of the requester, to extract geo-location information; the HTTP operation and the HTTP status, to filter unwanted HTTP requests for our study (e.g., POST operations and GET operation status); and the HTTP target and the HTTP host, that effectively contain the requested cId.
We begin by filtering logs that are out of format. This amounts to of all requests and include requests that have unparsable HTTP targets which contained hexadecimal codes in this field. Next, we remove all requests that are not GET HTTP requests, as these are the only ones that actually make requests to IPFS. This filters about of all requests contained in the logs, leaving almost of log entries with only GET operations.
However, not all GET operations are of interest to process the workload. Such is the case for GET operations that did not succeed (i.e., where the reply had a HTTP status code of ) or that do not contain a cId in their request. We filter GET operations that did not succeed due to these having a high probability that the content is either invalid (i.e., it was never in IPFS) or the content was no longer available at the time of the request. As for the cIds in requests, these appear in the full url of the request that is obtained by concatenating the HTTP host field with the HTTP target field. Note that the HTTP host in this case can be ipfs.io (i.e., the gateway host), in which case the cId will appear on the HTTP target; or can be in the form of cId.ipfs.dweb.link, in which case the cId is in the HTTP host part. Note as well, these url contain a file system path to the requested content however, the cId might represent a folder in that path or the file. In the case a url contains multiple cIds, we only consider the root cId (i.e., the cId that is in the beginning of the file system path), as effectively, it is most likely that all cIds found under a root cId are also provided by the same provider peer. This also groups requests to cIds found under a root cId to the root cId, which does not alter the frequency of requests made to a cId, as the root cId always encompasses the remainder cIds.
With this filter, we filter out of all GET operations, where of these were GET operations that did not succeed and are requests that did not contain a cId. With this, of the total requests remained as valid GET operations, which were the ones consider for our study. Table 1 summarizes the requests we processed for our study.
| Number of entries | Percentage | |
|---|---|---|
| Total | ||
| Out of Format | ||
| Not GETs | ||
| All GETs | ||
| Valid GETs |
3.2 Locating the content providers
The second step in studying and characterizing the IPFS workload is to gather information on the providers of the requested content, as to understand where and by how many peers is the content served. To achieve this, we developed a simple libp2p program that connects to IPFS and requests all providers of a given cId. Our program leverages the fact that IPFS uses the same networking software stack and DHT provided by libp2p, which by default connects to the IPFS network, to perform FindProviders API calls to libp2p’s DHT to fetch the providers of cIds.
Out of the valid GET operations, a total of different cIds were requested. We requested the providers of all these cIds through our libp2p program. We found we were unable to locate the providers of of all cIds. This can be due to the fact that the content was no longer available on the network (note that this study was perform some months after the requests were recorded by the gateway). From the cIds with providers we discovered different providers however, of these did not have any addressing information associated to them. This means that the peers storing the provider record did not receive any update on the provider (from any kind of traffic) over a minute window, as such, the peers storing the provider record assumed the provider might have moved and has a different address, thus forgetting the provider’s multiaddress. To fetch the multiaddress in these cases, we queried again the DHT for the multiaddress of the provider, and managed to find the multiaddress of more providers ( more providers we found initially). Table 2 summarizes the numbers of processed cIds and found providers.
| Number of entries | Percentage | |
|---|---|---|
| Total cIds | ||
| cIds w/out provider | ||
| cIds w/ provider | ||
| Providers | ||
| Providers w/out address | ||
| Providers w/ address | ||
| Providers w/ address after find |
3.3 Analyzing the data
The final step to study and characterize the IPFS workload is to join both request and providers data, to map from where in the World are requests being performed and where in the World is the content provided/available. This required us to extract geo-locality data from the gathered data. To this end, we use the MaxMind GeoLite2 Free Geolocation Database [18], that provides the geo-location of a vast collection of public IP addresses. However, this database is not complete and may have IP addresses whose geo-location is unknown. Fortunately, for the request data all IP addresses had geo-locality information. On the other hand, only of providers with addresses had geo-locality information.
Note that a provider is identified by a peerId and has multiple multiaddresses. To get the geo-location information of a provided we had to extract the (public) IP address of multiaddresses. For multiaddresses that contained protocols ip4 and ip6 this procedure is straightforward. This amounts to all observed multiaddress (excluding local address, such as 127.0.0.1 and ::1); of multiaddresses were DNS addresses, that we resolved with local DNS resolvers; and the remainder of multiaddress were relay multiaddresses, and hence the provider did not have a public reachable IP address, which we ignored in this study. For providers that showed to have multiple locations (probably due to VPN services), we considered the last observed location. These were just a few cases that do not affect our study.
We have inserted both datasets into a PostgreSQL database for ease of analysis. This database has tables, one containing the requests and another containing the providers. The requests table stores a request identifier (reqId), the timestamp the request was originally made to the gateway, the cId requested, and the location information of the requester. The requests table has as key the reqId, that is an hash of the request log entry, to avoid processing duplicate request entries from the log. The providers table stores: the cId provided, the peerId of the provider, and the location information of the provider. The provider table has as key the cId and peerId. This uniquely identifies each provider entry, since each cId can have multiple providers, and a provider can provide multiple cIds. Note as well that the cId in the providers table is a foreign key of the cId in the requests table.
By performing a join over the requests and providers table we can compute a mapping from where requests are performed to where they are provided. Before presented the results in the next section, we follow by providing some implementation details to process and find the providers data.
3.4 Implementation details
The code and scripts that were used to process the data for this study can be found in https://github.com/pedroAkos/IPFS-location-requested-content. The processing of data required fine tuning of the parallelization of queries to IPFS to become timely. This was required because IPFS can take some time to retrieve the provider records from the DHT; from our study the average latency was about seconds, with the maximum latency reaching up to hours; we made parallel queries to IPFS to fetch provider records. However, libp2p can be extremely taxing on the network, as a libp2p node can maintain hundreds of connections and perform thousands of requests. To put this in perspective, a process executing queries in parallel to find providers would produce almost packets per minute. The process to resolve all distinct cIds took around hours.
4 Results
In this section we analyze the results from our study to characterize the IPFS workload. In particular we are interested in answering the following questions:
-
1.
How many requests are made to IPFS on average per day?
-
2.
How is the request frequency distributed over different cIds in the system?
-
3.
How are providers geo-distributed in the system?
-
4.
How is provided content distributed across providers in the system?
-
5.
How does the location of requested content correlate with the location of providers for requested content?
To answer these question, we analyze the data first from the point of view of requests by analyzing the requests data extracted from the gateway logs (Section. 4.1). We then analyze the data from the point of view of providers using the data we extracted directly from IPFS (Section 4.2). Finally, we analyze both requests and providers data to produce a correlation between the location of requests’ origins and content providers (Section 4.3).
4.1 Requests
In this section we analyze the results from the perspective of content fetchers. With this, we aim to answer the first two questions of our analysis. How many requests are made to IPFS on average per day? and How is the request frequency distributed over different cIds in the system? We begin by answering the first question.
Figure 1 represents the client requests processed by the gateway per hour. Notice that Figure 1(a) captures all requests made during the period of two weeks (x axis), Figure 1(b) captures the same requests but characterized by continent, and Figure 1(c) focuses on the requests characterized by continent for only the first days of the analysis period, with the night hours shaded on the gateway’s timezone (GMT-7).
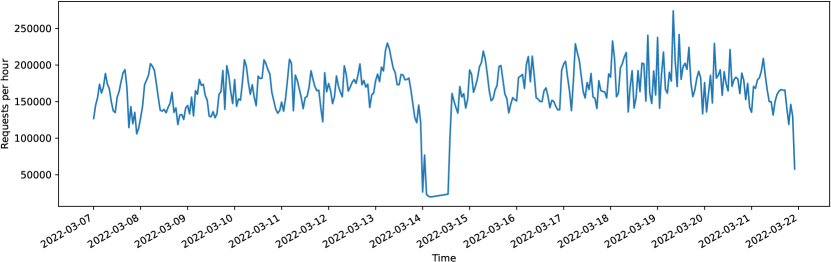
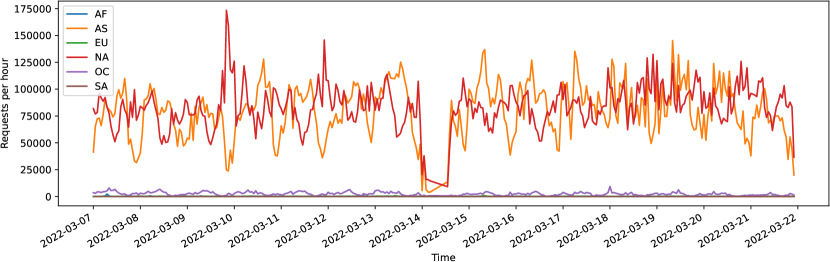
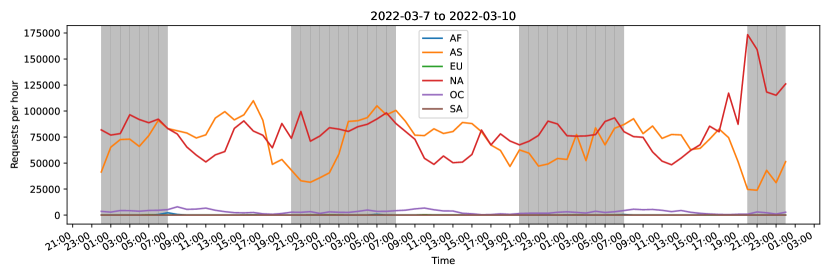
Figure 1(a) shows that, on average, more than requests per hour are made to the IPFS gateway, reaching a maximum of almost requests per hour. Notice that on day -- the requests suddenly drop. We verified this, and indeed the logs we have from that day abruptly stop after a few hours (just before the hour mark). Most likely, this was due to an issue with the gateway that day that made it unreachable for about hours, which after then resumed processing requests regularly.
From Figure 1(b) we can see that most of the gateway traffic is split from North America (NA) and Asia (AS) with more than an average of requests per hour with origin on each region. The third region with the most requests per hour is Oceania (OC) with an average of around requests per hour. This is followed by Europe (EU) with an average of around requests per hour, Africa (AF) with an average of around requests per hour, and South America (SA) with an average of only requests per hour. From these results we conclude that this IPFS gateway handles predominantly traffic from North America and Asia with a high volume of requests. Note that there are other public gateways located in other regions although, of the most popular ones, most are located in North America with some located in Europe222A full list of public IPFS gateways can be found in https://ipfs.github.io/public-gateway-checker/.
To understand if this high volume of traffic has a day/night pattern, on Figure 1(c) we plot the requests per day of the first days of our analysis, and shaded the areas of the plot that represent the night cycle. Note that the time on the x axis, represents the time at the gateway (on the North American GMT-7 timezone). From these results, it is not obvious that there exists a day/night pattern for the North American traffic. However, there is a slight tendency towards having more traffic during the night, although marginal. On the other hand, we also noticed that if we shifted the timezone, the Asian traffic would also not follow the day/night pattern clearly. What is clear, is that the Asian and North American traffic exhibit somewhat symmetric patterns over time, whose variations cancel each other maintaining a high and almost constant load of traffic on the gateway at all times. This effectively shows that the IPFS network is never idle.
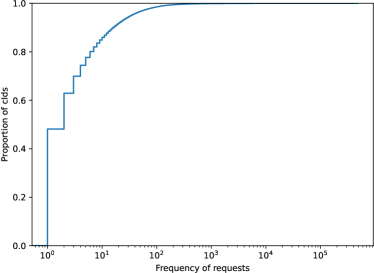
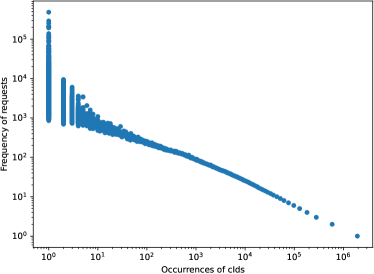
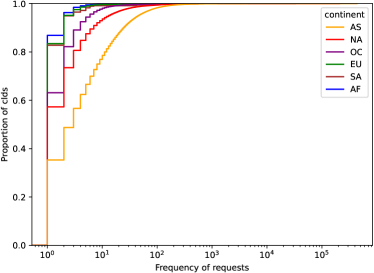
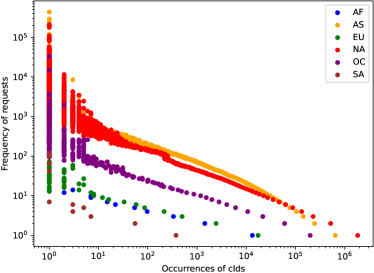
Figures 2 and 3 represent the frequency of requests performed for a cId (i.e., how many times was a cId requested from the gateway by a user). These results serve to answer question : How is the request frequency distributed over different cIds in the system?
Figure 2(a) shows an ECDF for all requested cIds. Notice that the x axis (representing the frequency of requests) is in logarithmic scale. The y axis captures the proportion of requested cIds with at most that amount of accesses. We notice that almost half of all cIds are only requested once. After that, the frequency increases with decreasing increments on the proportion of cIds, where we that about of all cIds are requested at most times and about of all cIds are requested at most times. Figure 2(b) complements the ECDF showing the distributions of frequency of requests (shown on the y axis) over the number of cIds (shown on the x axis). Each point in this distribution represents how many cIds where requested how many times. Note that both axis of this figure are in logarithmic scale. From this figure we can see the tendency on the frequency of requests over the number of cIds, which resembles a typical Zipf distribution. Table 3 summarizes the frequency of the top requested cIds. We can further add, that most of these top most requested cIds were Non-Fungible Tokens (NFT) related data, suggesting that this is a primary use case for IPFS.
Figure 3 shows the same information but characterized by the following regions: Africa (AF), Asia (AS), Europe (SA), North America (NA), Oceania (OC), and South America (SA). Figure 3(a) shows an ECDF for the frequency of requested cIds (on the x axis in logarithmic scale) over the proportion of requests (on the y axis), discriminated by region. We notice that almost of requests originating from Asia, request at most the same cId thrice, whereas of requests originating from North America request the same cId only once. This shows that content requested from Asia has a higher popularity (i.e., the same cIds are requested more often) than in the remainder of regions. Figure 3(b) complements the ECDF with the distributions of frequency of requests (shown on the y axis in logarithmic scale) over the number of cIds (shown on the x axis in logarithmic). However, it shows that all regions seem to present a similar Zipf distribution albeit, with different proportions, that is proportional to the request rate originating from each region.
| Requested cIds | Replicated cIds | cIds per Provider |
|---|---|---|
4.2 Providers
In this section we analyze the results from the perspective of providers. With this, we aim to answer questions and of our analysis. How are providers geo-distributed in the system? and How is provided content distributed across providers in the system?
The first question is answered by the results presented in Table 4. which shows the number of providers per continent. Notice that North America (NA) has almost as many providers as Europe (EU) and Asia (AS) together. This shows, that North America composes the largest portion of the content providers on the IPFS system (which is corroborated with previous studies [11, 1]). Furthermore, notice the last two columns in the table, that represent providers that only had a relay address (labeled as Rl), meaning they where behind a NAT without a public address; and providers whose location information was unknown (labeled as Un), meaning there was no entry on the MaxMind database for those providers public IP address. As the location of Rl nodes is also unknown, from this point on all Rl nodes are considered as belonging to the Un category.
| AF | AS | EU | NA | OC | SA | AN | Rl | Un | |
|---|---|---|---|---|---|---|---|---|---|
| Providers |
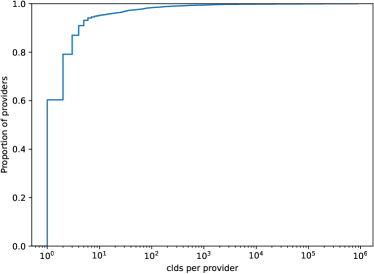
To answer question : How is provided content distributed across providers in the system? we analyze both the amount of content replication in the system (Figure 4) and the amount of (different) content provided by each individual provider node in the system (Figure 5).
Figure 4 analyzes the amount of replicated content over different providers. Figure 4(a) shows an ECDF that captures the amount of replicas (on the x axis in logarithmic scale) that were found for the proportion of cIds in the system (on the y axis). We note that almost of all cIds in the system are replicated at most twice (i.e., provided by at most two different provider nodes in the system). Only a very small proportion of cIds are replicated by a large number of providers. Table 3 summarizes the amount of replicas of the top replicated cIds, where, after looking into these cIds, we found that most of them are IPFS manual pages. We verified if theses highly replicated cIds where also the most requested cIds and found that this was not the case. In fact, the top requested cIds are not very replicated in the system, having only a few providers (only of these cIds have more than providers, with the most provided being by and peers). Figure 4(b) breaks down the cId replicas by region. Here we notice that Africa has the most replicas of cIds although, this does not represent a large number as there are only a few providers in that region. Although it is not visible in the plot, there is a small percentage of cIds that is highly replicated in North America. This is not surprising, as North America has the largest number of content providers. Nevertheless, these results suggest that there is a very limited high availability of provided content through replication in the system. This can be mostly explained by the way content is replicated, where there needs to be an explicit (re)provide action by the user after fetching a copy of the content from other provider(s).
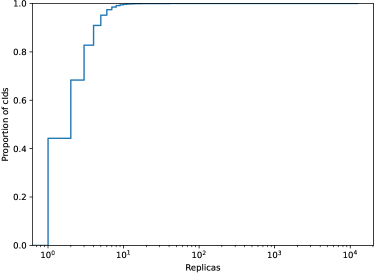
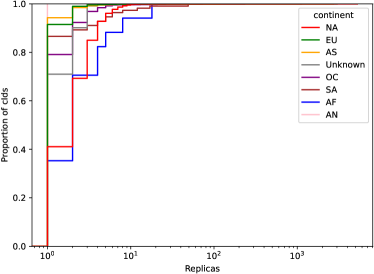
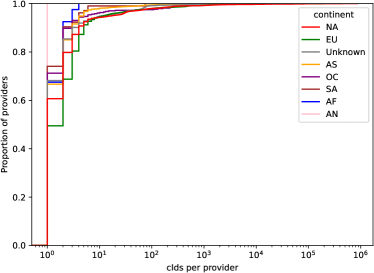
Figure 5 shows the amount of different cIds each provider provides. Figure 5(a) presents an ECDF of the proportion of providers (on the y axis) that provide different amounts of cIds (on the x axis in logarithmic scale), here we can see that of providers only provide a single cId. We also note that less than of providers provide at least cIds, with a very small proportion of providers providing at least cIds. The providers that provide more cIds amount to the largest part of provided cIds, meaning that most cIds are provided by the same small set of providers. This is not surprising, as there are pinning services for IPFS content (services that hosts content for users on IPFS in servers controlled by the pinning service provider for a fee). Table 3 summarizes the top providers with the most cIds. Some of these providers had DNS multiaddress, which we verified pointed to DNS records suggesting these providers belonged to nft.storage, which is a popular storage service for NFT content in IPFS. Figure 5(b) analyzes the proportion of providers (on the y axis) that provide different amounts of cIds (on the x axis in logarithmic scale) categorized by continent, which shows that the large providers are mostly located in North America (NA), Europe (EU), and Oceania (OC). The fact that the biggest portion of cIds is provided only by a small set of providers suggests that although IPFS is a decentralized content network system, the content stored in IPFS presents a hight degree of centralization in this small set of provider peers.
4.3 Requested content vs. provided content
Finally, in this section we combine gathered data from the requests and the providers to obtain a global view of the workload, and to answer the last question: How does the location of requested content correlate with the location of providers for requested content?
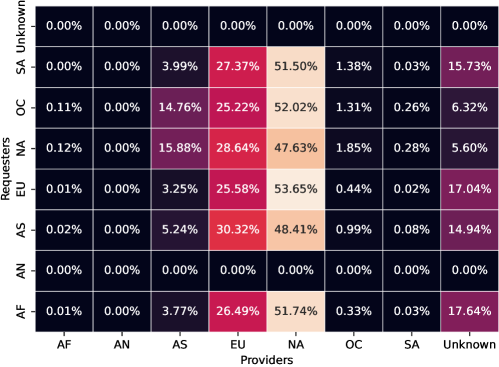
To this end, we matched the request’s origin location to the providers location, generating a heatmap (presented in Figure 6) that matches the location from where each request was made to the location of provider(s) that had the requested content. On Figure 6 the rows represent the location of the origin of requests while the columns present the location of providers. Note that a single request can be served by multiple locations, as per the cId replication factor we discussed previously. We normalized the requests per region to eliminate the disparity in quantity of requests, showing on the heatmap the percentage of all requests made from one region to any other region (including itself).
By analyzing the heatmap, we notice that vast majority of all requests from all regions are either provided by providers in North America or in Europe. This is not surprising as the vast majority of content is located in these regions. Furthermore, from this heatmap we can conclude that the North American region contains the most popular cIds, which from the previous observation that requests follow a Zipf distribution, we may also conclude that the Zipf is not independent per region. Finally, one important observation that can be extracted from this, is that IPFS is indeed a planetary-scale distributed service, used by users to share content that is not mostly local, otherwise we should observe a large majority of content being accessed by users to be served by providers in the same region (i.e., the heat would be concentrated mostly on the diagonal of the heatmap)
5 Related Work
Measuring and understanding the behavior of large scale and decentralized systems has always been an important task, with a vast amount of studies being made for peer-to-peer systems in the early ’s. In particular we highlight two studies over peer-to-peer systems, one that also analyzes the traffic of large scale systems, and a second that characterizes the workload of BitTorrent. The first [26] analyzes the peer-to-peer traffic across large networks such as FastTrack, Gnutella, and DirectConnect, from the point of view of a single ISP. Their findings are similar to ours in the sense that they also observe most of the traffic being generated by a very small amount of hosts. The second study [23] analyzes the popular BitTorrent peer-to-peer file-sharing system. In this study, the authors perform active measurements in the systems to obtain data related to upload and download speeds. On the other hand, our study focuses on other aspects of the system such as the distribution and popularity of content being published and accessed through the system and access patterns to that content.
More recent studies on peer-to-peer systems include blockchain systems such as Bitcoin and Ethereum. Here we highlight two studies [12, 15], that focus on the transactions made within Bitcoin and Ethereum blockchains. These studies characterize the performance of blockchain systems but fail to provide insights over system network properties, such as the number of peers per region or workload distribution over peers. Our study complements these by focussing on IPFS, an increasingly relevant solution of the Web3 ecosystem.
Finally, we highlight two more studies [26, 23] over IPFS that are complementary to our own study. The first study [26] aims at mapping IPFS, to understand the distribution of peers over regions. Our own study confirms the findings from this work and complements it with a characterization on the popularity of content made available by providers. The second study [23] focuses on the characterization of Bitswap traffic inside the system and how does it affect privacy. Our study focuses on traffic generated outside the system through the main public IPFS gateway. However, complementing our study with observations extracted from Bitswap traffic is a goal for future work.
6 Conclusion
In this paper we presented a study over the traffic processed by one of the most popular IPFS gateways to help guide the design of optimizations for future Web3 systems. The traffic showed the amount of requests to IPFS content from various locations in the World, although mainly from North America and Asia. We collected the requests and performed searches on the IPFS system to find the providers, and their location, for each requested content. We analyzed both datasets and found requests follow a Zipf distribution, where the most popularly requested content is only provided by a few providers. This means that IPFS is not well balanced, which may lead to these popular provider nodes to become overly saturated with requests. From our observations, we propose a research agenda to improve IPFS with the following points:
-
•
IPFS needs to remove the load on highly popular providers. To achieve this, new incentive mechanism are required to incentivize peers that fetch content to also replicate the content.
-
•
Because IPFS publishes provider records on the DHT, the load on the DHT will not be balanced by an increased number of providers replicating content. This is because the records will still be stored in the same peers of the DHT, which suggests that a DHT presents a sub-optimal design for load balancing IPFS workload.
-
•
Monitoring large scale systems is an important task that needs to be done continuously, as user and application patterns might shift. It is essential to complement these types of studies with more observations from systems operating in the wild. However, to achieve this, robust telemetry protocols are required to be integrated in these Web3 systems.
References
- [1] Leonhard Balduf, Sebastian Henningsen, Martin Florian, Sebastian Rust, and Björn Scheuermann. Monitoring data requests in decentralized data storage systems: A case study of ipfs. In 2022 IEEE 42nd ICDCS. IEEE, 2022.
- [2] Juan Benet. IPFS - Content Addressed, Versioned, P2P File System. Technical Report Draft 3, 2014.
- [3] Berty. Berty: The privacy-first messaging app. https://berty.tech/, 2022. Accessed October 2022.
- [4] ConsenSys. Consensys: Ipfs look up measurement. https://github.com/ConsenSys/ipfs-lookup-measurement/, 2022. Accessed February 2022.
- [5] Alfonso de la Rocha, David Dias, and Psaras Yiannis. Accelerating content routing with bitswap: A multi-path file transfer protocol in ipfs and filecoin. Technical report, 2021.
- [6] Discussify. Discussify. https://github.com/ipfs-shipyard/pm-discussify, 2022. Accessed October 2022.
- [7] Maya Dotan, Yvonne-Anne Pignolet, Stefan Schmid, Saar Tochner, and Aviv Zohar. Survey on blockchain networking: Context, state-of-the-art, challenges. ACM Comput. Surv., 54(5), may 2021.
- [8] Fleek. Fleek: Build on the new internet. https://fleek.co/, 2022. Accessed October 2022.
- [9] BitTorrent Foundation. Bittorrent (btt) white paper. https://www.bittorrent.com/btt/btt-docs/BitTorrent_(BTT)_White_Paper_v0.8.7_Feb_2019.pdf, 2019.
- [10] Bernd Grobauer, Tobias Walloschek, and Elmar Stocker. Understanding cloud computing vulnerabilities. IEEE Security & Privacy, 9(2), 2011.
- [11] Sebastian Henningsen, Martin Florian, Sebastian Rust, and Björn Scheuermann. Mapping the interplanetary filesystem. In 2020 IFIP Networking Conference (Networking), 2020.
- [12] Hwanjo Heo and Seungwon Shin. Behind block explorers: Public blockchain measurement and security implication. In 2021 IEEE 41st ICDCS, 2021.
- [13] Gaurish Korpal and Drew Scott. Decentralization and web3 technologies. Technical report, 5 2022.
- [14] Sarvesh Kumar, Himanshu Gautam, Shivendra Singh, and Mohammad Shafeeq. Top vulnerabilities in cloud computing. ECS Transactions, 107(1), apr 2022.
- [15] Xi Tong Lee, Arijit Khan, Sourav Sen Gupta, Yu Hann Ong, and Xuan Liu. Measurements, analyses, and insights on the entire ethereum blockchain network. In Proceedings of The Web Conference 2020, WWW ’20, 2020.
- [16] J. Leitão. Gossip-based broadcast protocols. Master’s thesis, Faculdade de Ciências da Universidade de Lisboa, 2007.
- [17] Joao Leitao, José Pereira, and Luis Rodrigues. Epidemic broadcast trees. In Proc. of SRDS’07. IEEE, 2007.
- [18] MaxMind. Maxmind - geolite2 free geolocation data. https://dev.maxmind.com/geoip/geolite2-free-geolocation-data?lang=en, 2022. Accessed October 2022.
- [19] Petar Maymounkov and David Mazieres. Kademlia: A peer-to-peer information system based on the xor metric. In International Workshop on Peer-to-Peer Systems. Springer, 2002.
- [20] J. Monteiro, P. A. Costa, J Leitão, A. de la Rocha, and Y. Psaras. Enriching kademlia by partitioning. In Proceedings of the 1st Workshop on Decentralized Internet, Networks, Protocols, and Systems (DINPS’22) colocated with ICDCS, 2022.
- [21] Satoshi Nakamoto. Bitcoin: A peer-to-peer electronic cash system. Decentralized Business Review, 2008.
- [22] NFT.STORAGE. Nft storage: Free storage for nfts. https://nft.storage/, 2022. Accessed October 2022.
- [23] Johan Pouwelse, Paweł Garbacki, Dick Epema, and Henk Sips. The bittorrent p2p file-sharing system: Measurements and analysis. In International workshop on peer-to-peer systems, pages 205–216. Springer, 2005.
- [24] Protocol Labs. libp2p: A modular network stack. https://libp2p.io, 2022. Accessed February 2022.
- [25] Rodrigo Rodrigues and Peter Druschel. Peer-to-peer systems. Commun. ACM, 53(10), October 2010.
- [26] Subhabrata Sen and Jia Wang. Analyzing peer-to-peer traffic across large networks. In Proceedings of the 2nd ACM SIGCOMM Workshop on Internet Measurment, IMW ’02, 2002.
- [27] Dennis Trautwein, Aravindh Raman, Gareth Tyson, Ignacio Castro, Will Scott, Moritz Schubotz, Bela Gipp, and Yiannis Psaras. Design and evaluation of ipfs: A storage layer for the decentralized web. In Proceedings of the ACM SIGCOMM 2022 Conference, SIGCOMM ’22, 2022.
- [28] Uniswap. Uniswap protocol: swap, earn, and build on the leading decentralized crypto trading protocol. https://uniswap.org/, 2022. Accessed October 2022.
- [29] Gavin Wood. Ethereum: a secure decentralised generalised transaction ledger. Technical report, 2014.