COOL-LAMPS. IV. A Sample of Bright Strongly Lensed Galaxies at
Abstract
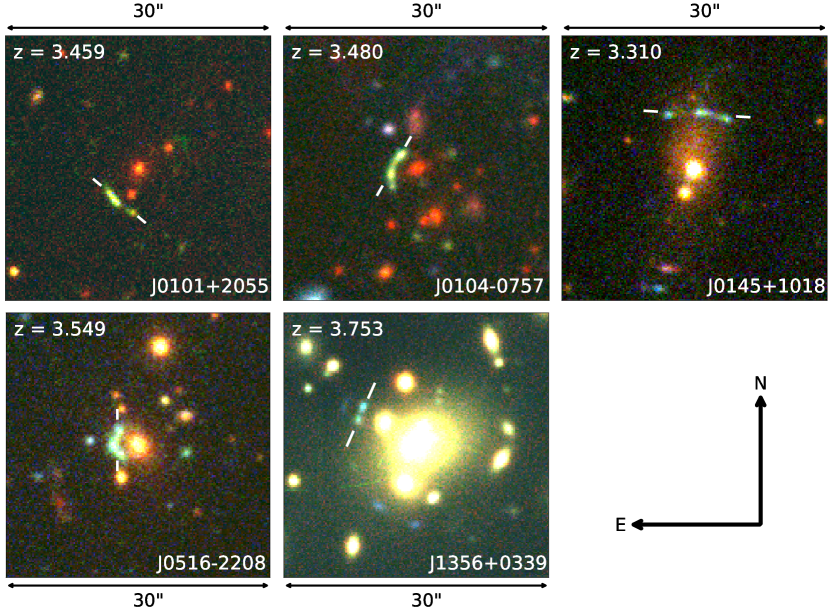
We report the discovery of five bright strong gravitationally lensed galaxies at : COOL J01012055 (), COOL J01040757 (), COOL J01451018 (), COOL J05162208 (), and COOL J13560339 (). These galaxies have magnitudes of mag and are lensed by galaxy clusters at . This sample nearly doubles the number of known bright lensed galaxies with extended arcs at . We characterize the lensed galaxies using ground-based grz/giy imaging and optical spectroscopy. We report model-based magnitudes and derive stellar masses, dust content, and star-formation rates via stellar population synthesis modeling. Building lens models based on ground-based imaging, we estimate source magnifications in the range 29 to 180. Combining these analyses, we derive demagnified stellar masses in the range and star formation rates in the youngest age bin ranging from , placing the sample galaxies on the massive end of the star-forming main sequence in this redshift interval. In addition, three of the five galaxies have strong Ly emissions, offering unique opportunities to study Ly emitters at high redshift in future work.
1 Introduction
Strongly lensed star-forming galaxies at high redshift provide unique opportunities to understand star formation processes in the early universe. Using the spectral energy distribution (SED; see Conroy, 2013, for a review of this method) we can infer important physical properties of the galaxies such as the stellar mass (), star-formation rate (SFR), and dust extinction (e.g., Kennicutt, 1998; Calzetti et al., 2000; Giavalisco, 2002; Salim et al., 2007a; Maraston et al., 2010; Walcher et al., 2011; Wilkins et al., 2012). Strong lensing allows us to probe much smaller subgalactic spatial scales that would normally be inaccessible without the extra magnification that lensing provides.
Selecting strongly lensed galaxies consists, to first order, of two methods: deeply detailed studies of large lensing cross-section lenses, or mining large areas of sky across a wide range of foreground lens cross-sections to find the brightest examples. The former allows one to detect galaxies well below the detection limits reached in deep-field images and significantly improves the signal-to-noise ratio (S/N) of observations compared to their unlensed counterparts. Pointed (i.e., pencil-beam) strong lensing surveys such as the Hubble Frontier Fields (Lotz et al., 2017) have enabled studies (e.g., Santini et al., 2017; Rinaldi et al., 2022) to include fainter galaxies to probe the low stellar mass regime () (e.g., Alavi et al., 2016). The latter approach has yielded exquisitely bright lensed sources where the magnification of strong lensing provides extreme spatial resolutions of only tens of parsecs in the source plane (e.g., Johnson et al., 2017). A particularly cogent example of the benefits of such an object is the Sunburst Arc (Dahle et al., 2016) where lensing allows identification of a single star-forming region that is leaking Lyman continuum (LyC) radiation, enabling unique opportunities to study the detailed physics of LyC escape (e.g., Rivera-Thorsen et al., 2017; Furtak et al., 2022).
In the redshift range , only six bright lensed star-forming galaxies with extended arcs have been published to date (Smail et al., 2007; Gilbank et al., 2008; Oguri et al., 2012; Rigby et al., 2018; Dessauges-Zavadsky et al., 2017; Christensen et al., 2012). This small sample has enabled a wide range of detailed observations and attendant analyses that would be difficult or impossible absent strong lensing. These include long-wavelength observations of molecular lines (Coppin et al., 2007), resolved internal dynamics (Jones et al., 2010), high-S/N moderate resolution spectra at rest-UV wavelengths (Quider et al., 2010; Bayliss et al., 2014; Rigby et al., 2018), and comparisons of said spectra to detailed models (Byler et al., 2020). In this work, we present the discovery and primary analysis of five additional UV-bright strongly lensed galaxies in the range , nearly doubling the number of known objects in the same category. This redshift range is well before the peak of the cosmic SFR density at (Madau & Dickinson, 2014) and the corresponding peak of the redshift distribution of prior bright lensed galaxy samples (Bayliss et al., 2011a; Bayliss, 2012; Stark et al., 2013; Tran et al., 2022); z=3.5 is approximately the half-time between the plausible beginning of star formation at and that later peak.
The goal of this paper is to determine the physical and evolutionary properties of these lensed galaxies by means of their photometric and UV spectral features. The structure of this paper is as follows. In Section 2, we introduce the discovery of objects in this sample. Section 3 describes the photometric and spectroscopic data acquisition following the discoveries. In Section 4, we present the results from photometric modeling, lens modeling, and stellar population synthesis with photometric information from rest-frame UV bands. Section 5 discusses the limitation of our analysis and compares the initial results with other objects in the same regime.
| RA (deg) | DEC (deg) | |
|---|---|---|
| COOL J01012055 | 15.437643 | 20.928818 |
| COOL J01040757 | 16.220170 | -7.952055 |
| COOL J01451018 | 26.276362 | 10.310288 |
| COOL J05162208 | 79.013054 | -22.146431 |
| COOL J13560339 | 209.094447 | 3.652319 |
In the entire analysis, we assume the cosmological parameters derived in Planck Collaboration et al. (2020). All magnitudes are given in the AB system. For inferred parameters with uncertainties, we report 16th, 50th, and 84th percentile values, unless otherwise specified.
2 Discovery
2.1 Lens candidate selection
The ChicagO Optically selected strong Lenses - Located At the Margins of Public Surveys (COOL-LAMPS) project began as a collaboration in an undergraduate research class and is an effort to find strong gravitational lenses in recent public imaging data. The lensing search is designed to find a wide variety of lenses and lensed sources (Khullar et al., 2021; Sukay et al., 2022; Martinez et al., 2022) but the targeted follow-up is primarily focused on lensed sources that are photometrically at the margins of the distributions of source color and brightness. The details and results of this search will be presented in an upcoming publication (COOL-LAMPS Collaboration in prep.). We select luminous red galaxies – the most massive galaxies at a given epoch – as potential sites of lensing by making cuts in color-magnitude diagrams of objects morphologically tagged as galaxies. For each selected line of sight, we construct a custom color image, tuned to emphasize faint extended sources, with the cutout size scaled by an estimate of the galaxy richness at the potential lens redshift, estimated from a red-sequence early-type galaxy model. Each such image is scored from 0 (no lensing) to 3 (obvious unambiguous lensing) by multiple visual examiners, and a second pass is made through the resulting candidate list to cull objects for further consideration. The bulk of the lens selection work completed by the COOL-LAMPS collaboration so far has used the Dark Energy Camera Legacy Survey (DECaLS; Dey et al., 2019) datasets and all five lensing systems discussed here are taken from those data. The names and locations of our sample galaxies are given in Table 1. The lensed sources listed here were selected as candidates for further follow-up due to high overall initial ranking from the lens search coupled with blue colors and redder colors suggestive of galaxies.
2.2 Spectroscopic confirmation
CJ0101 and CJ0104 were observed spectroscopically using the 2.5m Nordic Optical Telescope and ALFOSC spectrograph on 2020 October 14. The total exposure time was 3000 s for CJ0101 and 2400 s for CJ0104. In both cases, we used grism 4 and a slit width of 1.”3, producing a spectral resolution of R300 and covering the wavelength range 3200-9600Å. Those data measured initial source redshifts for both systems. On 2021 July 20, CJ0145 and CJ1356 were first observed spectroscopically for 1200 s each using the 1”.0 slit in echelle mode of the FIRE near-IR spectrograph (Simcoe et al., 2013) on the Magellan I 6.5m Baade telescope; those data provided source redshifts from multiple emission lines in both instances. On the same night and telescope, CJ0516 was observed using the IMACS optical spectrograph (Dressler et al., 2011) for 2000 s in total using the f/4 camera, the 150 grating, and a 1”.0 slit; those data also provided a source redshift from multiple emission and absorption features.
3 Follow-up observations and redshifts
3.1 Imaging
We obtained broadband optical imaging, deeper and sharper than the discovery DECaLS data, in the grz filters using the Magellan Clay telescope with the LDSS3C imaging spectrograph for four of the five lensed systems. The exception, CJ1356, is present in the Hyper Suprime-Cam Subaru Strategic Program (HSC-SSP) DR3 data release, and we use the available giy in lieu of additional Magellan data. The Magellan imaging data were acquired in clear conditions on 2020 August 13 and 2021 October 10 in seeing of 0.”6 - 0.”8, with total exposure times per filter ranging from 360 to 840 s selected by the source brightness and sky brightness at the time of observation. Data were processed using standard techniques in IRAF (Tody, 1986, 1993) and PHOTPIPE (Rest et al., 2005; Garg et al., 2006; Miknaitis et al., 2007), producing a stacked coadded image for each object and filter pair. An initial astrometric solution was defined using astrometry.net (Lang et al., 2010); this was further refined using custom code to precisely match the astrometric solution for each image to the DECaLS catalogs. Photometric zero-points were derived by direct comparison to DECaLS and have, in most cases, uncertainties of less than 0.02 mag. The quoted uncertainty in the HSC-SSP DR3 data is 0.015 mag (Aihara et al., 2021).
Figure 1 shows color images, derived from the above data, for all five strong lensing systems.
3.2 Spectroscopy
After these initial discovery observations, four of the five systems (excluding CJ0516) were reobserved spectroscopically using either the Magellan I 6.5m Baade telescope and IMACS or the Magellan II 6.5m Clay telescope and LDSS3C. The goal was to gather rest-frame UV spectra to characterize the Ly line and, in most instances, place candidate secondary images or foreground lens galaxies on the same long slit to acquire further redshifts. Observations occurred on 2021 October 13-14 and 26 and 2022 July 22.
The follow-up spectroscopy was processed with custom scripts using standard techniques to flatten, extract to 1D, and wavelength and flux calibrate the data, all implemented in IRAF. All objects with apparent spectra were extracted, calibrated, and analyzed, not always successfully, for redshift information.
3.3 Redshifts
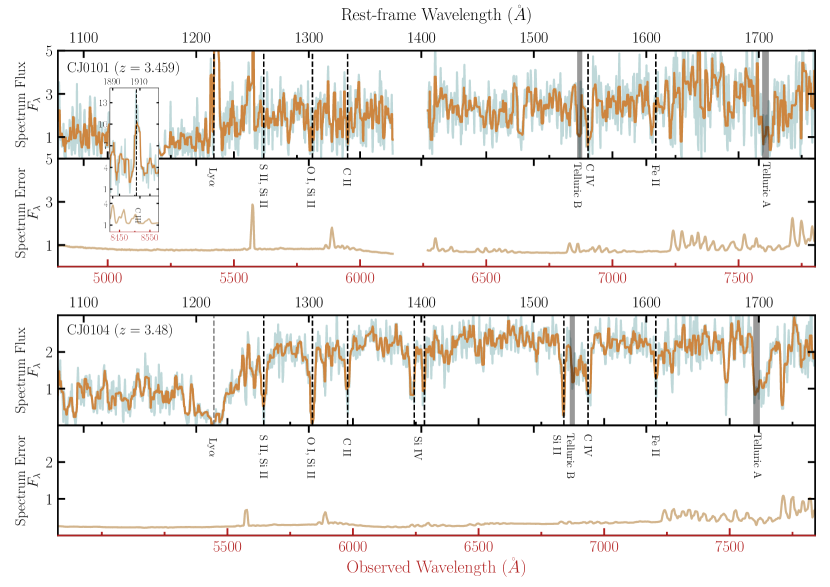
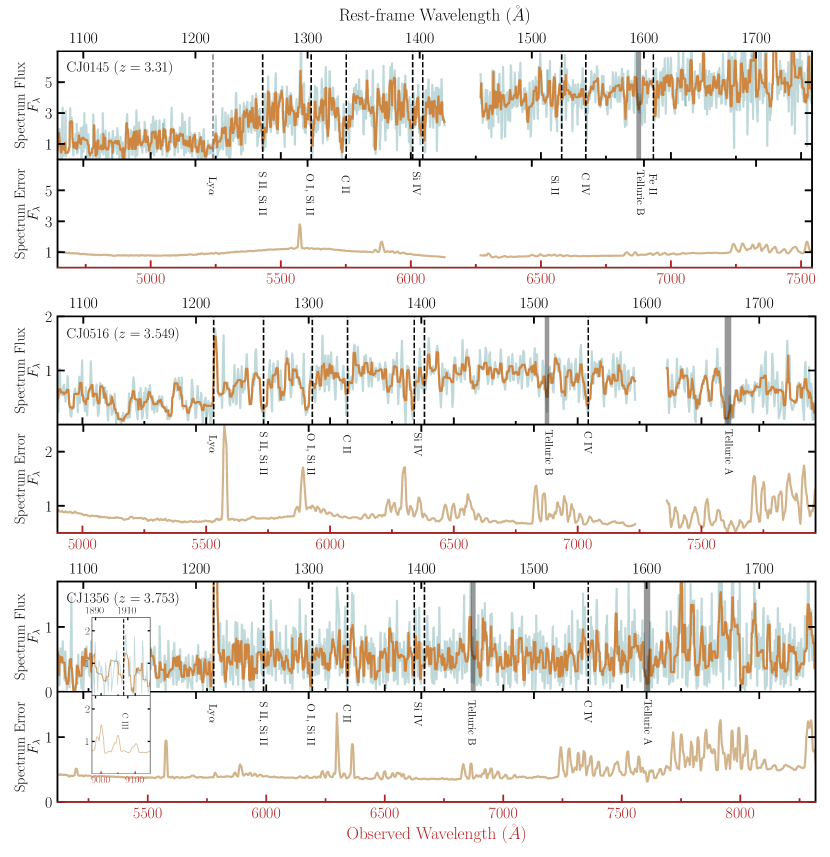
The redshifts of sources and foreground lenses, as well as their uncertainties are tabulated in Table 2. For lensed sources, we used a set of interstellar absorption features (S II 1260 + Si II 1260, O I 1302 + Si II 1304, C II 1335, Si IV 1394, 1403, and C IV 1548, 1551) to obtain a set of redshifts for each object. In addition, emission line C III] 1907, 1909 and absorption lines Si II 1527 and Fe II 1608 are present in the spectra of some objects. See Figure 2 and 3 for details. We report the final redshift values by taking the set average and the uncertainties by taking the standard deviation. Note that for CJ1356, the reported redshift refers to the doubly imaged green arcs in the northeast of the field, as marked by white bars in Figure 1 and a second family of lensed images at is also present.
The redshifts of the lenses were obtained as follows. For CJ0104 and CJ0516, we extracted LDSS3/IMACS spectra of the brightest central galaxies (BCGs) in these systems. The BCG redshifts and related uncertainties, which were computed based on the spectral features, were taken as lens redshifts for these two systems. For CJ0101 and CJ1356, we used the BCG redshifts and uncertainties reported in eBOSS (Dawson et al., 2016), which is part of the Sloan Digital Sky Survey (SDSS) DR16 (Ahumada et al., 2020). For CJ0145, we obtained spectroscopic redshifts for two cluster members from our spectra and two other members from SDSS DR16. We computed the final redshift by taking the mean value of the cluster member redshifts and the uncertainties by taking the standard deviation.
| Magnification | |||
|---|---|---|---|
| CJ0101 | |||
| CJ0104 | & | ||
| CJ0145 | |||
| CJ0516 | |||
| CJ1356 |
4 Analysis
4.1 Photometric Modeling with GALFIT
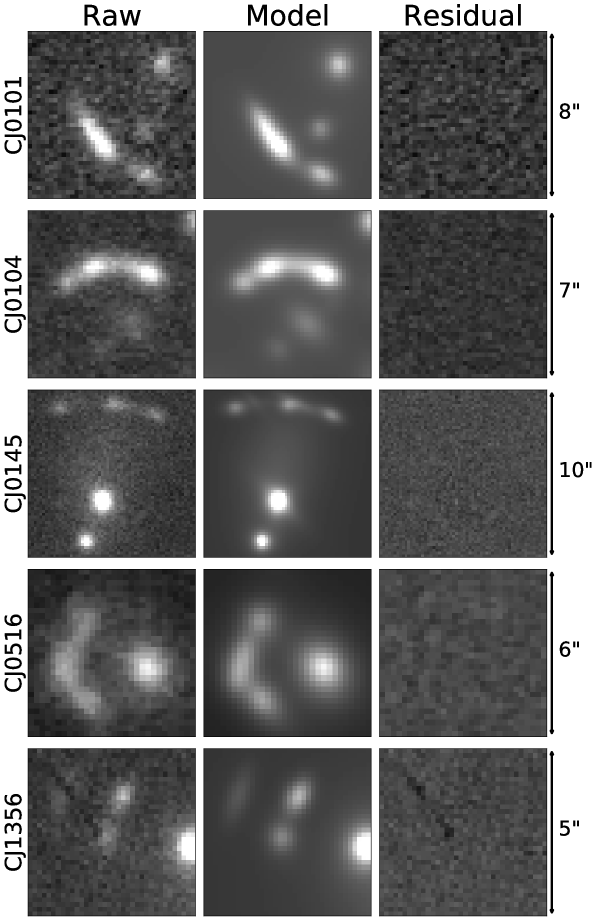
To extract the photometry of the arc and relevant potential counterimages, we used the parametric model fitting code GALFIT (Peng et al., 2010). We measured the point-spread functions (PSFs) directly from the images by choosing bright, unsaturated, isolated point sources near the region of interest. We used multiple 2D Sérsic (Sérsic, 1963) profiles to model each image. The model construction proceeded iteratively with single 2D Sérsic components being placed down on each source in the image and additional components added until the residuals were consistent with the background noise. We constructed the initial GALFIT models in the band where the lensed arc is the most prominent and then propagated that model with appropriate constraints to other bands.
To estimate the statistical photometric uncertainties, we refitted the model multiple times by adding the final fitted GALFIT models to simulated instances of sky flux generated by bootstrapping the sky pixel distribution of the image. We obtained the sky pixels by iteratively clipping at 3 the pixel distribution around the image. The measured magnitude of the object in each of these refits gave us the uncertainty for each object. To compute the total magnitude uncertainty for each object, we combined the zero-point calibration uncertainty and above statistical uncertainties in quadrature. Reported object magnitudes were corrected for Galactic extinction. The LDSS3 imaging grz-band magnitudes were corrected by values provided in the DECaLS database (Dey et al., 2019) while the HSC imaging giy-band magnitudes were corrected by values reported in Schlafly & Finkbeiner (2011) as implemented by the NASA/IPAC Extragalactic Database’s extinction calculator111 The NASA/IPAC Extragalactic Database (NED) is funded by the National Aeronautics and Space Administration and operated by the California Institute of Technology..
| g | r | z | HSC g | HSC i | HSC y | |
| CJ0101 | - | - | - | |||
| CJ0104 | - | - | - | |||
| CJ0145 | - | - | - | |||
| CJ0516 | - | - | - | |||
| CJ1356 | - | - | - |
Table 3 tabulates the GALFIT-measured photometric magnitudes and corresponding uncertainties for each arc. The -band image (HSC -band image for CJ1356), GALFIT model, and residuals of each object field are shown in Figure 4.
| Parameter | Description | Priors |
|---|---|---|
| Total stellar mass formed | Log10 Uniform: [109, 1013] | |
| Stellar metallicity | Uniform: [-2.0, 0.2] | |
| Diffuse dust optical depth | Tophat: [0.01, 3.00] | |
| Gas-phase metallicity | Tophat: [-2, 0.2] | |
| Gas Ionization Parameter | Tophat: [-4.0, -1.5] | |
| Ratio of the SFRs in adjacent age bins: | Student-T: mean=0.0,scale=0.3, | |
| non-parametric SFH | Age bins: [0,50], [50,100], [100,500] and [500, age of Universe at zobs] |
Note. — These magnitudes are in the AB system with imaging from the Magellan LDSS3 imager and -band imaging from Hyper Suprime-Camera (HSC). Magnitudes are for the bright arc images only (denoted by white bars in Figure 1) and magnitudes have been accounted for Galactic extinction.
Note. — Considered as nuisance parameters.
4.2 SED Fitting with Prospector
Using the model photometry in different filters (discussed in Section 4.1), we performed Bayesian SED fitting for the lensed arc images. We used Prospector (Conroy et al., 2009; Conroy & Gunn, 2010; Johnson et al., 2021), a stellar population synthesis and parameter inference framework based on Markov Chain Monte Carlo (MCMC). Note that the arc spectra only provide a spectroscopic redshift constraint and were not utilized in the SED fitting process; in this low-S/N regime, the spectra mostly sample saturated absorption lines from the interstellar medium, which are not constrained by the FSPS libraries (Conroy et al., 2009; Conroy & Gunn, 2010). Other than the slope of the rest-UV continuum, our spectral dataset does not provide additional information regarding the stellar population, which is already more reliably and robustly sampled by the photometry.
We chose to conduct SED fitting on the observed photometry rather than magnification-corrected photometry. We assumed that the magnification-dependent parameters in SED fitting (such as stellar mass and SFR) are not correlated with those that are not magnification-dependent (such as metallicity and dust extinction). This assumption has been tested and validated in previous COOL-LAMPS publications (Khullar et al., 2021).
We assumed a nonparametric star formation history (with age bins of and Myr in look-back time). It is represented by a set of SFRratio values, which give the ratio of the SFRs in adjacent bins, and is the age of the universe in megayears at the redshift of the source (see Leja et al. 2017 and Khullar et al. 2021 for examples of implementation.) For example, for CJ0101, we have Myr at assuming a Planck Collaboration et al. (2020) cosmology. Throughout our entire analysis, we assume a Kroupa initial mass function (Kroupa, 2001). In the fiducial model, we fitted for free parameters such as total stellar mass formed in the galaxy , dust attenuation (diffuse dust optical depth), stellar metallicity , gas ionization parameter and gas-phase metallicity. Refer to Table 4 for a list of these parameters and related priors.
For the five primary bright arcs photometered above, the -band (or HSC -band) photometry samples the Ly line and/or Lyman forest. Since the emission and absorption of Ly is complex and highly dependent on the gas geometry in the galaxies, the correlation between such processes and star-forming activity is not established in our sample galaxies (e.g., Calzetti et al., 1994; Giavalisco et al., 1996; Atek et al., 2008; Sobral & Matthee, 2019). Hence, we chose to only use photometry for the fiducial SED models. The dust extinction and metallicities have flat and liberal priors, roughly covering the range allowed by the spectral model libraries. Gas ionization parameters and gas-phase metallicity have top-hat priors of and . We also included nebular continuum and line emission in our modeling process, while the line emission was turned off in the model spectrum.
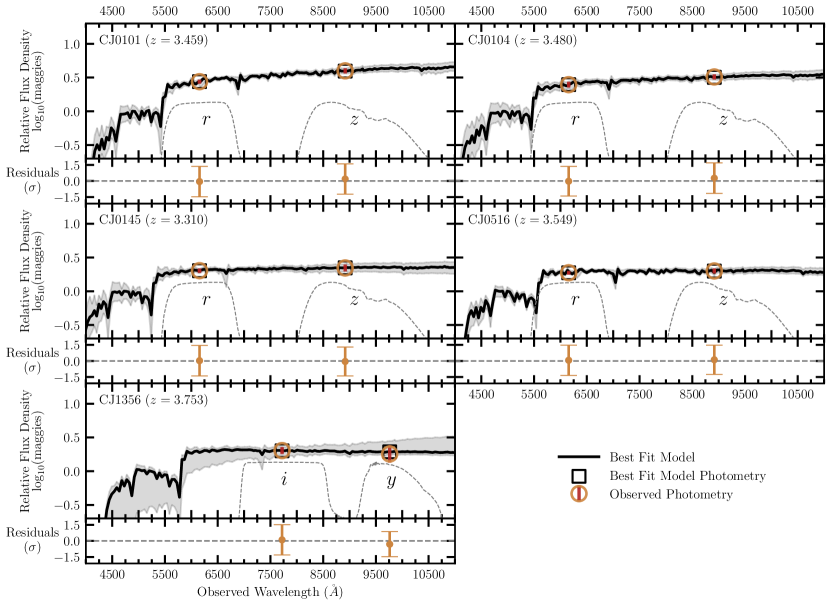
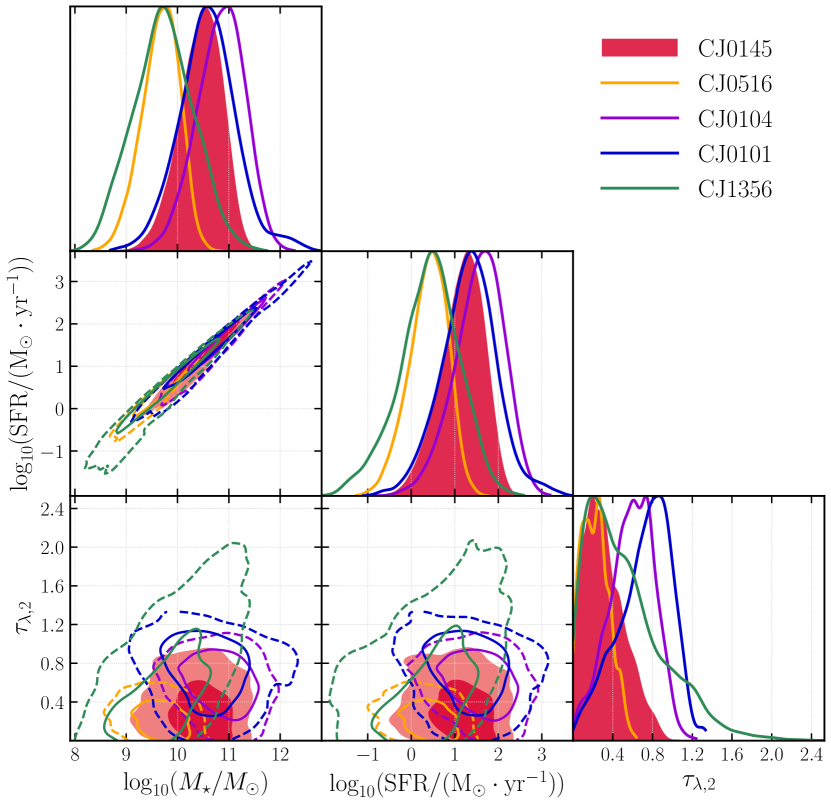
The best-fit fiducial SED models are shown in Figure 5. The residuals are shown in the lower panels for each fit to visually demonstrate the quality of the best-fit SEDs. In Figure 6, we present the posterior distributions of the best-fit parameters both as histograms and as pair-wise comparison via a corner plot. Refer to Table 5 for the best-fit values of the parameters.
Since we are only fitting for -band photometry in the fiducial model, our model explicitly captures the rest-frame UV properties of the galaxy spectrum, which is closely related to the emission from the hot and massive stellar populations and the dust extinction in the galaxy (e.g., see Salim et al. 2007b; Shivaei et al. 2015, and references therein). Meanwhile, due to a lack of information input regarding the cooler and less massive stellar populations, properties such as stellar and gas-phase metallicity are not constrained in the model. Hence, in Figure 6, we only show the free parameters that are constrained by the rest-frame UV observations, which are the total stellar mass , instantaneous and dust-unobscured SFR (defined as the average SFR in the age bin closest to the epoch of observation, SFRlast-bin) and dust attenuation . Note that the stellar mass and SFR shown in the figure are demagnified and the uncertainties from lens modeling have been included in the aforementioned results.
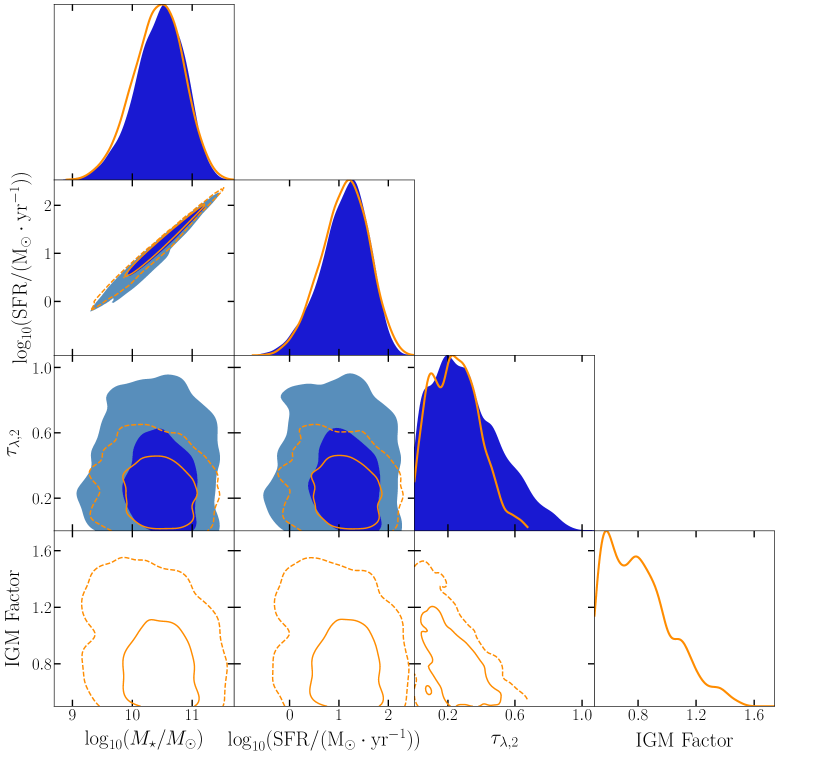
In addition, we experimented with a variant model with all photometry, with an additional free parameter that tunes the intergalactic medium (IGM) absorption between the arc emission and the observer (based on the IGM absorption prescription by Madau 1995); we chose a top-hat prior of for IGM absorption factor. All of our variant models favor a Landau attenuation factor that is less than expected. As shown in a selected example of CJ0145 in Figure 7, the IGM absorption factor distribution has a 50th percentile value less than . However, such a favoring of less attenuation does not impact the derived total stellar mass significantly. If we assume the posterior distributions of to be Gaussian, the derived from the variant models always falls in the range of the fiducial model values.
| CJ0101 | |||
|---|---|---|---|
| CJ0104 | |||
| CJ0145 | |||
| CJ0516 | |||
| CJ1356 |
4.3 Lens Modeling and Magnification
To model the cluster-scale mass distribution that is responsible for the observed strong gravitational lensing, we used a parametric approach using LENSTOOL. In LENSTOOL (Jullo et al. 2007), the mass distribution was modeled by dual pseudoisothermal ellipsoids (dPIEs; Elíasdóttir et al. 2007) whose parameters and uncertainties were inferred through an MCMC approach. We closely followed the strong lens modeling process and model optimization strategy described in Sharon et al. (2020) and used the statistical uncertainties of our model following a statistic as in Mahler et al. (2020). We selected the astrometric constraints for our modeling as multiple images of lensed features, identified from the color images. The best-fit model is defined as the one that minimizes the scatter between these observed image locations and their model-predicted counterparts in the image plane. In addition to the cluster-scale mass potentials, we fitted for galaxy-scale potentials whose normalization and radius parameters were determined by observed luminosity scaling relations (Limousin et al., 2005); cluster galaxies were selected from the DECaLS DR9 catalog as objects with extended morphologies whose colors are consistent with the expected red sequence at each lens redshift. The morphological parameters used for setting up galaxy-scale potentials, namely, position, ellipticity, and position angle were also taken from the DECALS DR9 catalog.
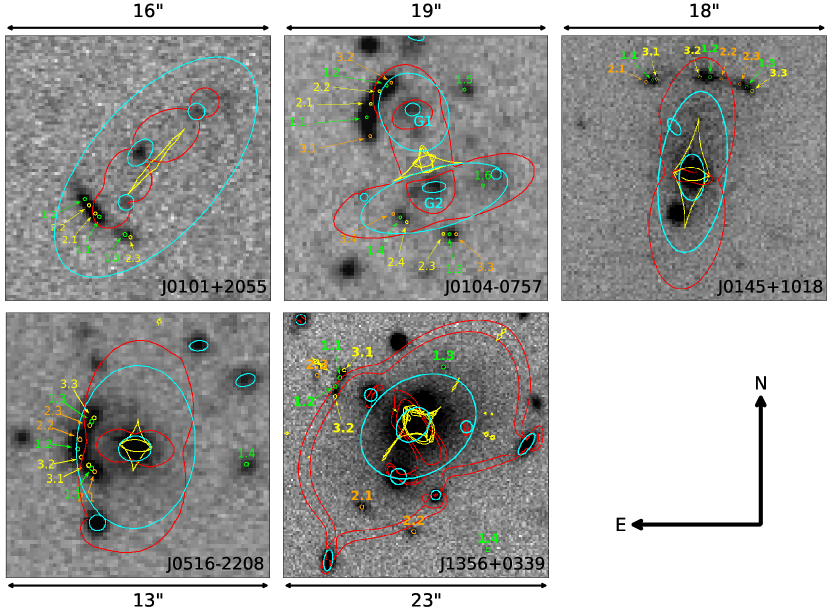
In Figure 8, we overplot the positional constraints, individual fitted halos in the lens model, and critical curves on top of the imaging in the filter band in which the arc is the brightest. Each constraint family is labeled with the same color and first digit. The redshifts of the sources and lens are provided in Table 2.
The lens models of CJ0101, CJ0145, and CJ0516 are the classic three-image arc configuration in which the image plane critical curve goes through the arc twice and a counterimage is potentially present. Note that although we do not have spectroscopic confirmations of the counterimages in the above three lensing systems, the best-fit model of CJ0516 requires the placement of a fourth constraint on the counterimage candidate. The lens models of CJ1356 and CJ0104 are more complicated and less obvious, and we provide a more detailed description of these systems below.
4.3.1 CJ1356
In the lensing system of CJ1356, we find two lensed image families at two spectroscopically confirmed redshifts. The two images located in the northeast of the BCG (marked by constraint indices ) are spectroscopically confirmed to have a redshift at . In addition, two objects in the northwest (constraint ) and one object in the southwest (constraint ) are likely to be candidate lensed images from the same source as the images, given their similar colors.
We spectroscopically confirmed a second lensed image family at , which is composed of the images in the northeast (constraint ) and the image in the southeast (constraint ). There is a third image in the southeast (constraint ) for which we do not yet have spectroscopic confirmation. But given its color and geometrical location, we are confident that it belongs to the image family at .
In the modeling process, we experimented with several astrometric constraint configurations with and without considering the candidate lensed images. The optimized lens model of this system requires the astrometric constraint placement shown in Figure 8. The model further suggests that only one of the two candidate sources in the northwest is likely from the green source family ().
4.3.2 CJ0104
In the lensing system of CJ0104, our best lens model suggests that the images are primarily lensed by a galaxy-scale or low-mass cluster-scale halo (shown as the north ellipse “G1” in cyan in Figure 8) and a cluster-scale halo (shown as the south ellipse “G2” in cyan in Figure 8). The galaxy hosted in the north galaxy-scale halo is spectroscopically confirmed at . The BCG of the cluster-scale halo is spectroscopically confirmed at .
The arc image (constraint and ) in the northeast and the image (constraint ) in the south are spectroscopically confirmed as belonging to the same source at . Given the similar color and location of the image (constraint ) in the southwest, it is likely to be part of the same image family. Our initial modeling suggests the placement of constraints and . In the case of constraint , we do find a candidate counterimage of similar color. In the case of constraint , we suspect a counterimage hidden behind the foreground red cluster member, given the hint of green color in the RGB image. The model further suggests a candidate image located between the galaxy at and the BCG at .
The precise modeling of the mass distribution in this system requires multiplane lens modeling, which is not yet implemented in LENSTOOL. Nevertheless, the purpose of lensing analysis in this study is to provide an estimation of the magnification factor for the lensed galaxy and assess the implication of projecting all the mass onto a single plane. We experimented with three instances in which all the mass potentials were uniformly placed at the lower, upper, and mean redshift (). Apart from the lens redshifts, we used the same initial inputs and priors for free parameters in the three models. At , the model returned a median magnification of for the bright arc (constraint ). At , the model returned a median magnification of . At , the model returned a median magnification of (see Section 4.3.3 for the process of magnification estimation). The ranges of magnification factors estimated from the three model instances are statistically consistent with each other. We conclude that in the model of CJ0104, the single lens plane approximation does not affect the magnification estimate within the statistical uncertainties. We used the magnification estimated from the model at for the analysis in this study. We show the lens model at in Figure 8.
4.3.3 Magnification
To estimate the mean magnification, we calculated the ratio of the area in the image and source plane. For each confirmed arc image in each lensing system, we estimated the arc area in the image plane by taking the polygons that best describe the non-PSF-convolved GALFIT modeling image of the arc. We ray-traced its source plane counterpart using the deflection maps generated from the lens model, which describe the projection of the image plane positions onto the source plane. The source plane image size was estimated by taking the convex hull of pixel points deflected from the image plane. We obtained a mean total magnification for each of the lensed galaxies by summing the magnification of each image in the system. To estimate the uncertainties, we repeated the above procedures with 100 realizations of deflection maps that sample the lens model posterior probability distribution. The resulting magnifications and related uncertainties are shown in Table 2. We applied this as a division factor to the results of the arc imaging analysis in the image plane, converting the derived physical parameter values from SED fitting to those in the source plane.
The magnification depends on the choice of the image plane polygon. With the limitations of imaging data from ground-based telescopes, we could not further refine the constraints in the lens model or the choice of polygons for magnification estimation. The reported magnifications and uncertainties are the best results obtained with the limited data available. For all but CJ1356 which is better constrained, the typical fractional uncertainties are and .
5 Discussion and Future Work
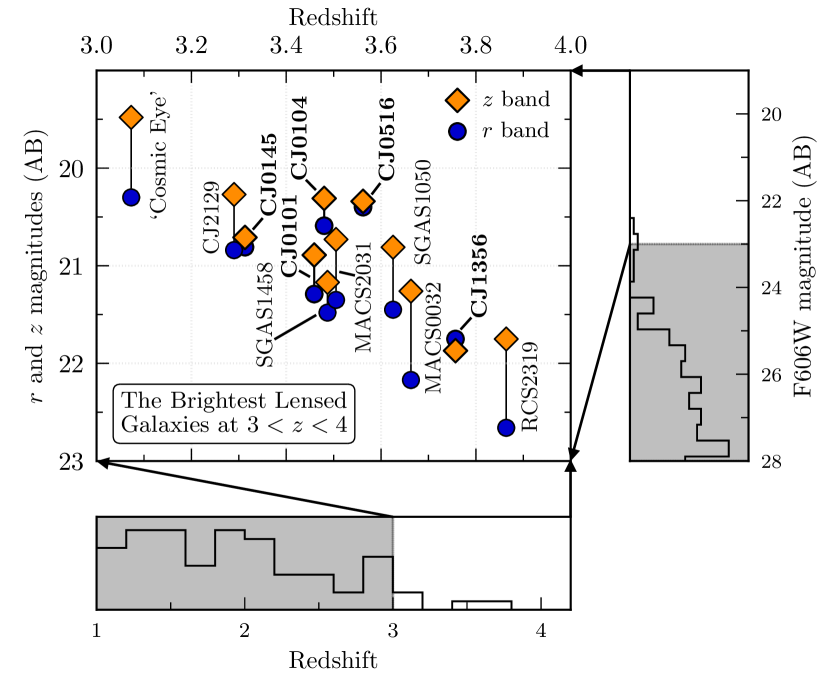
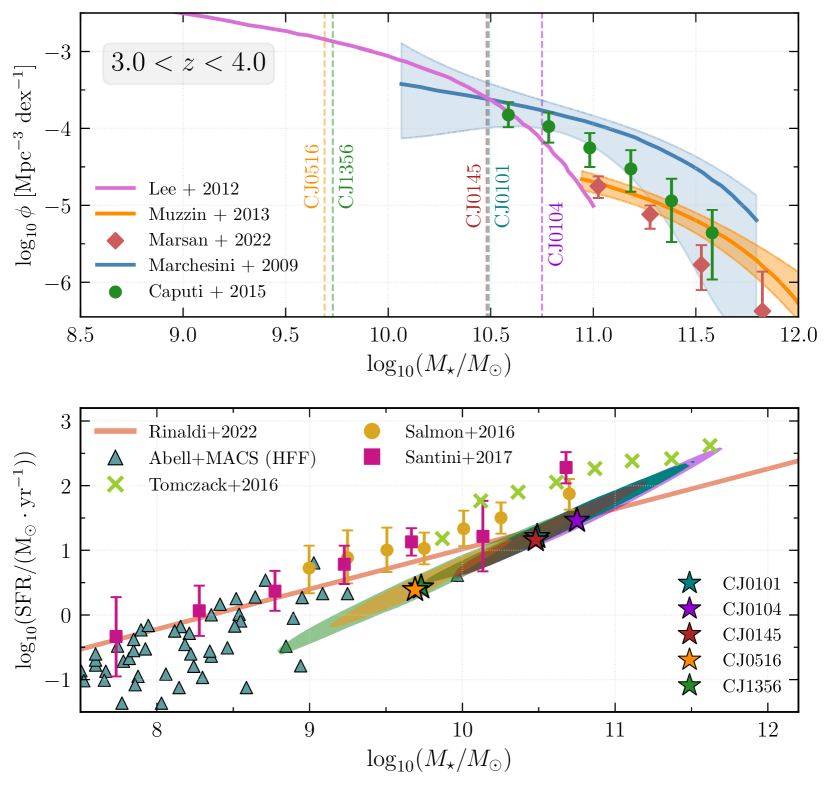
Figure 9 shows the - and -band magnitudes of the brightest published lensed galaxies found in the redshift interval . The galaxies in bold denote those introduced in this paper. To emphasize the lack of known bright lensed galaxies in this redshift interval, we show the distribution of redshifts and brightnesses of lensed galaxies in existing samples along the horizontal and vertical axes, respectively. The distribution along the horizontal axes shows the redshift distribution of lensed galaxies from the CASSOWARY (Stark et al., 2013), MEGASAURA (Rigby et al., 2018) and Bayliss et al. (2011b) samples. Furthermore, the distribution along the vertical axes shows the distribution of the F606W magnitudes for lensed galaxies in the redshift range from the MUSE spectroscopic sample of lensed sources (Richard et al., 2021). Note that the F606W band and -band comparison is not precise but sufficient for illustration.
Another interesting feature in this lensed galaxy sample is the presence of Ly, or the lack thereof, as seen in the spectra (Figure 2 and 3). The Ly emission is important for studying the physics of LyC escape in these galaxies. As the scattering of these photons is influenced by the neutral hydrogen reservoir in and around the galaxy, the shape of the Ly emission line is altered and, in return, contains information on the neutral hydrogen. Hence, the Ly emission line profile serves as an indirect indicator of the , that is, the fraction of H I-ionizing LyC photons that escape from a galaxy (e.g., Izotov et al., 2021; Gazagnes et al., 2020). At redshifts of , due to a large number of neutral hydrogen clumps, most LyC photons are absorbed (e.g., Haardt & Madau, 1996; Cowie & Hu, 1998; Vanzella et al., 2018). However, by studying galaxies at , we are able to observe some of the ionizing photons. As a result, we can use these relatively lower-redshift galaxies as analogs of their epoch of reionization predecessors to study the escape of ionizing photons (e.g., Rivera-Thorsen et al., 2017, 2019). Understanding the cause of the variation in the presence of Ly, or the lack thereof, will require higher spatial resolution data, which will be enabled by space-based telescopes like the Hubble Space Telescope (HST) and JWST.
The relation between the stellar mass and its instantaneous SFR has been proposed to be a fundamental relation of galaxies containing information on the evolutionary state of the galaxy and variations in the star formation histories (e.g., Matthee & Schaye, 2019). This relationship has been observed over high orders of magnitude in stellar mass (Santini et al., 2009) and from redshifts to (e.g., Tasca et al., 2015).
The bottom panel of Figure 10 shows the stellar mass - SFR relation for main-sequence galaxies in the redshift interval . The figure shows a compilation of results from numerous works and this lensed galaxy sample for comparison. Galaxies in this sample appear to be fairly typical, as they lie along the main-sequence star-forming relation. Furthermore, to contextualize these galaxies within the stellar mass function (SMF) of star-forming galaxies in this redshift interval, the top panel of Figure 10 shows various estimates of the SMF and the stellar masses of our galaxy sample as vertical dashed lines. The deduced stellar masses are comparable to the characteristic galaxy mass at these redshifts (e.g., Lee et al., 2012). With more detailed photometry in future work, we will have better constraints on the star formation history of these galaxies and thus reduce the uncertainty in our stellar mass and SFR estimates.
These strongly lensed galaxies are some of the brightest galaxies found in the redshift interval (see Figure 9). Due to their high surface brightness (and hence high S/Ns), even with limited ground-based photometry, we are able to estimate some basic properties of these galaxies and their foreground lensing systems. Note that galaxy properties like SFR, stellar mass, and physical size scale directly with the lensing magnification. Thus, having a robust lens model is important. Space-based telescopes HST and JWST have high spatial resolution and thus enable the construction of robust lens models. Recent studies of strong lensing systems using HST and JWST (e.g., Rivera-Thorsen et al., 2019; Wu et al., 2022; Mahler et al., 2022; Claeyssens et al., 2022) were able to discern morphology and star formation at the smallest scales. Furthermore, in this redshift interval, all the rest-frame optical nebular emission lines fall in the JWST NIRSpec bandpass. Also, the UV emission and absorption lines, which probe the massive stellar populations and outflowing winds, are in the bandpass of ground-based optical integral field units like MUSE (Very Large Telescope) and KCWI (W. M. Keck Observatory). Thus, the lensed galaxies in this sample are excellent future targets for such follow-up observations.
6 Summary
We report the discoveries of five bright, strongly-lensed galaxies at : COOL J0101+2055 (; ), COOL J0104-0757 (; ; ), COOL J0145+1018 (; ), COOL J0516-2208 (; ), and COOL J1356+0339 (; ). These galaxies have r- and z-band AB magnitudes brighter than , doubling the number of bright lensed galaxies currently known in this redshift interval. We characterized the lensed galaxies using ground-based grz/giy imaging and optical spectroscopy. Using Prospector, we performed stellar population synthesis modeling with model-based photometry magnitudes and derived stellar masses, dust content, and SFRs. Using LENSTOOL, we performed dPIE halo-based lens mass modeling with ground-based imaging, which implies median source magnifications in our sample of . Combining these analyses, we derived the sample galaxies’ stellar masses in the range and SFRs in the youngest age bin in the range , placing the sample galaxies on the massive end of the star-forming main sequence. In summary, the five galaxies presented in this sample are rare in terms of their brightness and common in terms of their stellar mass in the redshift interval . In addition, three galaxies in our sample have strong Ly emission, enabling unique opportunities to study Ly emitters at high redshifts.
Acknowledgements
We thank Jason J. Lin, Elisabeth Medina and Daniel J. Kavin Stein for their contribution to the initial lens searches.
This research has made use of the NASA/IPAC Extragalactic Database, which is funded by the National Aeronautics and Space Administration and operated by the California Institute of Technology.
This paper is based on data gathered with the 6.5 m Magellan Telescopes located at Las Campanas Observatory, Chile. Magellan observing time for this program was granted by the time allocation committees of the University of Chicago and the University of Michigan.
Based on observations made with the Nordic Optical Telescope, owned in collaboration by the University of Turku and Aarhus University, and operated jointly by Aarhus University, the University of Turku and the University of Oslo, representing Denmark, Finland and Norway, the University of Iceland and Stockholm University at the Observatorio del Roque de los Muchachos, La Palma, Spain, of the Instituto de Astrofisica de Canarias. The data presented here were obtained in part with ALFOSC, which is provided by the Instituto de Astrofisica de Andalucia (IAA) under a joint agreement with the University of Copenhagen and NOT.
This work is supported by The College Undergraduate program at the University of Chicago, and the Department of Astronomy and Astrophysics at the University of Chicago.
The Legacy Surveys consist of three individual and complementary projects: the Dark Energy Camera Legacy Survey (DECaLS; Proposal ID 2014B-0404; PIs: David Schlegel and Arjun Dey), the Beijing-Arizona Sky Survey (BASS; NOAO Prop. ID 2015A-0801; PIs: Zhou Xu and Xiaohui Fan), and the Mayall z-band Legacy Survey (MzLS; Prop. ID 2016A-0453; PI: Arjun Dey). DECaLS, BASS and MzLS together include data obtained, respectively, at the Blanco telescope, Cerro Tololo Inter-American Observatory, NSF’s NOIRLab; the Bok telescope, Steward Observatory, University of Arizona; and the Mayall telescope, Kitt Peak National Observatory, NOIRLab. The Legacy Surveys project is honored to be permitted to conduct astronomical research on Iolkam Du’ag (Kitt Peak), a mountain with particular significance to the Tohono O’odham Nation.
NOIRLab is operated by the Association of Universities for Research in Astronomy (AURA) under a cooperative agreement with the National Science Foundation.
This project used data obtained with the Dark Energy Camera (DECam), which was constructed by the Dark Energy Survey (DES) collaboration. Funding for the DES Projects has been provided by the U.S. Department of Energy, the U.S. National Science Foundation, the Ministry of Science and Education of Spain, the Science and Technology Facilities Council of the United Kingdom, the Higher Education Funding Council for England, the National Center for Supercomputing Applications at the University of Illinois at Urbana-Champaign, the Kavli Institute of Cosmological Physics at the University of Chicago, Center for Cosmology and Astro-Particle Physics at the Ohio State University, the Mitchell Institute for Fundamental Physics and Astronomy at Texas A&M University, Financiadora de Estudos e Projetos, Fundacao Carlos Chagas Filho de Amparo, Financiadora de Estudos e Projetos, Fundacao Carlos Chagas Filho de Amparo a Pesquisa do Estado do Rio de Janeiro, Conselho Nacional de Desenvolvimento Cientifico e Tecnologico and the Ministerio da Ciencia, Tecnologia e Inovacao, the Deutsche Forschungsgemeinschaft and the Collaborating Institutions in the Dark Energy Survey. The Collaborating Institutions are Argonne National Laboratory, the University of California at Santa Cruz, the University of Cambridge, Centro de Investigaciones Energeticas, Medioambientales y Tecnologicas-Madrid, the University of Chicago, University College London, the DES-Brazil Consortium, the University of Edinburgh, the Eidgenossische Technische Hochschule (ETH) Zurich, Fermi National Accelerator Laboratory, the University of Illinois at Urbana-Champaign, the Institut de Ciencies de l’Espai (IEEC/CSIC), the Institut de Fisica d’Altes Energies, Lawrence Berkeley National Laboratory, the Ludwig Maximilians Universitat Munchen and the associated Excellence Cluster Universe, the University of Michigan, NSF’s NOIRLab, the University of Nottingham, the Ohio State University, the University of Pennsylvania, the University of Portsmouth, SLAC National Accelerator Laboratory, Stanford University, the University of Sussex, and Texas A&M University.
The Legacy Surveys imaging of the DESI footprint is supported by the Director, Office of Science, Office of High Energy Physics of the U.S. Department of Energy under Contract No. DE-AC02- 05CH1123, by the National Energy Research Scientific Computing Center, a DOE Office of Science User Facility under the same contract; and by the U.S. National Science Foundation, Division of Astronomical Sciences under Contract No. AST-0950945 to NOIRLab.
References
- Ahumada et al. (2020) Ahumada, R., Prieto, C. A., Almeida, A., et al. 2020, ApJS, 249, 3, doi: 10.3847/1538-4365/ab929e
- Aihara et al. (2021) Aihara, H., AlSayyad, Y., Ando, M., et al. 2021, arXiv e-prints, arXiv:2108.13045. https://arxiv.org/abs/2108.13045
- Alavi et al. (2016) Alavi, A., Siana, B., Richard, J., et al. 2016, ApJ, 832, 56, doi: 10.3847/0004-637X/832/1/56
- Astropy Collaboration et al. (2022) Astropy Collaboration, Price-Whelan, A. M., Lim, P. L., et al. 2022, ApJ, 935, 167, doi: 10.3847/1538-4357/ac7c74
- Atek et al. (2008) Atek, H., Kunth, D., Hayes, M., Östlin, G., & Mas-Hesse, J. M. 2008, A&A, 488, 491, doi: 10.1051/0004-6361:200809527
- Bayliss (2012) Bayliss, M. B. 2012, ApJ, 744, 156, doi: 10.1088/0004-637X/744/2/156
- Bayliss et al. (2011a) Bayliss, M. B., Gladders, M. D., Oguri, M., et al. 2011a, ApJ, 727, L26, doi: 10.1088/2041-8205/727/1/L26
- Bayliss et al. (2011b) Bayliss, M. B., Hennawi, J. F., Gladders, M. D., et al. 2011b, ApJS, 193, 8, doi: 10.1088/0067-0049/193/1/8
- Bayliss et al. (2014) Bayliss, M. B., Rigby, J. R., Sharon, K., et al. 2014, ApJ, 790, 144, doi: 10.1088/0004-637X/790/2/144
- Bertin & Arnouts (1996) Bertin, E., & Arnouts, S. 1996, A&AS, 117, 393, doi: 10.1051/aas:1996164
- Byler et al. (2020) Byler, N., Kewley, L. J., Rigby, J. R., et al. 2020, ApJ, 893, 1, doi: 10.3847/1538-4357/ab7ea9
- Calzetti et al. (2000) Calzetti, D., Armus, L., Bohlin, R. C., et al. 2000, ApJ, 533, 682, doi: 10.1086/308692
- Calzetti et al. (1994) Calzetti, D., Kinney, A. L., & Storchi-Bergmann, T. 1994, ApJ, 429, 582, doi: 10.1086/174346
- Caputi et al. (2015) Caputi, K. I., Ilbert, O., Laigle, C., et al. 2015, ApJ, 810, 73, doi: 10.1088/0004-637X/810/1/73
- Christensen et al. (2012) Christensen, L., Richard, J., Hjorth, J., et al. 2012, MNRAS, 427, 1953, doi: 10.1111/j.1365-2966.2012.22006.x
- Claeyssens et al. (2022) Claeyssens, A., Adamo, A., Richard, J., et al. 2022, arXiv e-prints, arXiv:2208.10450. https://arxiv.org/abs/2208.10450
- Conroy (2013) Conroy, C. 2013, ARA&A, 51, 393, doi: 10.1146/annurev-astro-082812-141017
- Conroy & Gunn (2010) Conroy, C., & Gunn, J. E. 2010, ApJ, 712, 833, doi: 10.1088/0004-637X/712/2/833
- Conroy et al. (2009) Conroy, C., Gunn, J. E., & White, M. 2009, ApJ, 699, 486, doi: 10.1088/0004-637X/699/1/486
- Coppin et al. (2007) Coppin, K. E. K., Swinbank, A. M., Neri, R., et al. 2007, ApJ, 665, 936, doi: 10.1086/519789
- Cowie & Hu (1998) Cowie, L. L., & Hu, E. M. 1998, AJ, 115, 1319, doi: 10.1086/300309
- Dahle et al. (2016) Dahle, H., Aghanim, N., Guennou, L., et al. 2016, A&A, 590, L4, doi: 10.1051/0004-6361/201628297
- Dawson et al. (2016) Dawson, K. S., Kneib, J.-P., Percival, W. J., et al. 2016, AJ, 151, 44, doi: 10.3847/0004-6256/151/2/44
- Dessauges-Zavadsky et al. (2017) Dessauges-Zavadsky, M., Zamojski, M., Rujopakarn, W., et al. 2017, A&A, 605, A81, doi: 10.1051/0004-6361/201628513
- Dey et al. (2019) Dey, A., Schlegel, D. J., Lang, D., et al. 2019, AJ, 157, 168, doi: 10.3847/1538-3881/ab089d
- Dressler et al. (2011) Dressler, A., Bigelow, B., Hare, T., et al. 2011, PASP, 123, 288, doi: 10.1086/658908
- Elíasdóttir et al. (2007) Elíasdóttir, Á., Limousin, M., Richard, J., et al. 2007, arXiv e-prints, arXiv:0710.5636. https://arxiv.org/abs/0710.5636
- Furtak et al. (2022) Furtak, L. J., Plat, A., Zitrin, A., et al. 2022, arXiv e-prints, arXiv:2204.09668. https://arxiv.org/abs/2204.09668
- Garg et al. (2006) Garg, A., Stubbs, C. W., Challis, P., et al. 2006, The Astronomical Journal, 133, 403, doi: 10.1086/510118
- Gazagnes et al. (2020) Gazagnes, S., Chisholm, J., Schaerer, D., Verhamme, A., & Izotov, Y. 2020, A&A, 639, A85, doi: 10.1051/0004-6361/202038096
- Giavalisco (2002) Giavalisco, M. 2002, ARA&A, 40, 579, doi: 10.1146/annurev.astro.40.121301.111837
- Giavalisco et al. (1996) Giavalisco, M., Koratkar, A., & Calzetti, D. 1996, ApJ, 466, 831, doi: 10.1086/177557
- Gilbank et al. (2008) Gilbank, D. G., Yee, H. K. C., Ellingson, E., et al. 2008, ApJ, 677, L89, doi: 10.1086/588138
- Haardt & Madau (1996) Haardt, F., & Madau, P. 1996, ApJ, 461, 20, doi: 10.1086/177035
- Harris et al. (2020) Harris, C. R., Millman, K. J., van der Walt, S. J., et al. 2020, Nature, 585, 357, doi: 10.1038/s41586-020-2649-2
- Hunter (2007) Hunter, J. D. 2007, Computing in Science Engineering, 9, 90, doi: 10.1109/MCSE.2007.55
- Izotov et al. (2021) Izotov, Y. I., Worseck, G., Schaerer, D., et al. 2021, MNRAS, 503, 1734, doi: 10.1093/mnras/stab612
- Johnson (2019) Johnson, B. D. 2019, SEDPY: Modules for storing and operating on astronomical source spectral energy distribution, Astrophysics Source Code Library, record ascl:1905.026. http://ascl.net/1905.026
- Johnson et al. (2021) Johnson, B. D., Leja, J., Conroy, C., & Speagle, J. S. 2021, ApJS, 254, 22, doi: 10.3847/1538-4365/abef67
- Johnson et al. (2017) Johnson, T. L., Rigby, J. R., Sharon, K., et al. 2017, ApJ, 843, L21, doi: 10.3847/2041-8213/aa7516
- Jones et al. (2010) Jones, T. A., Swinbank, A. M., Ellis, R. S., Richard, J., & Stark, D. P. 2010, MNRAS, 404, 1247, doi: 10.1111/j.1365-2966.2010.16378.x
- Jullo et al. (2007) Jullo, E., Kneib, J. P., Limousin, M., et al. 2007, New Journal of Physics, 9, 447, doi: 10.1088/1367-2630/9/12/447
- Kennicutt (1998) Kennicutt, Robert C., J. 1998, ARA&A, 36, 189, doi: 10.1146/annurev.astro.36.1.189
- Khullar et al. (2021) Khullar, G., Gozman, K., Lin, J. J., et al. 2021, ApJ, 906, 107, doi: 10.3847/1538-4357/abcb86
- Kroupa (2001) Kroupa, P. 2001, MNRAS, 322, 231, doi: 10.1046/j.1365-8711.2001.04022.x
- Lang et al. (2010) Lang, D., Hogg, D. W., Mierle, K., Blanton, M., & Roweis, S. 2010, AJ, 139, 1782, doi: 10.1088/0004-6256/139/5/1782
- Lee et al. (2012) Lee, K.-S., Ferguson, H. C., Wiklind, T., et al. 2012, ApJ, 752, 66, doi: 10.1088/0004-637X/752/1/66
- Leja et al. (2017) Leja, J., Johnson, B. D., Conroy, C., van Dokkum, P. G., & Byler, N. 2017, ApJ, 837, 170, doi: 10.3847/1538-4357/aa5ffe
- Limousin et al. (2005) Limousin, M., Kneib, J.-P., & Natarajan, P. 2005, MNRAS, 356, 309, doi: 10.1111/j.1365-2966.2004.08449.x
- Lotz et al. (2017) Lotz, J. M., Koekemoer, A., Coe, D., et al. 2017, ApJ, 837, 97, doi: 10.3847/1538-4357/837/1/97
- Madau (1995) Madau, P. 1995, ApJ, 441, 18, doi: 10.1086/175332
- Madau & Dickinson (2014) Madau, P., & Dickinson, M. 2014, ARA&A, 52, 415, doi: 10.1146/annurev-astro-081811-125615
- Mahler et al. (2020) Mahler, G., Sharon, K., Gladders, M. D., et al. 2020, ApJ, 894, 150, doi: 10.3847/1538-4357/ab886b
- Mahler et al. (2022) Mahler, G., Jauzac, M., Richard, J., et al. 2022, arXiv e-prints, arXiv:2207.07101. https://arxiv.org/abs/2207.07101
- Maraston et al. (2010) Maraston, C., Pforr, J., Renzini, A., et al. 2010, MNRAS, 407, 830, doi: 10.1111/j.1365-2966.2010.16973.x
- Marchesini et al. (2009) Marchesini, D., van Dokkum, P. G., Förster Schreiber, N. M., et al. 2009, ApJ, 701, 1765, doi: 10.1088/0004-637X/701/2/1765
- Marsan et al. (2022) Marsan, Z. C., Muzzin, A., Marchesini, D., et al. 2022, ApJ, 924, 25, doi: 10.3847/1538-4357/ac312a
- Martinez et al. (2022) Martinez, M. N., Napier, K. A., Cloonan, A. P., et al. 2022, arXiv e-prints, arXiv:2209.03972. https://arxiv.org/abs/2209.03972
- Matthee & Schaye (2019) Matthee, J., & Schaye, J. 2019, MNRAS, 484, 915, doi: 10.1093/mnras/stz030
- Miknaitis et al. (2007) Miknaitis, G., Pignata, G., Rest, A., et al. 2007, The Astrophysical Journal, 666, 674, doi: 10.1086/519986
- Muzzin et al. (2013) Muzzin, A., Marchesini, D., Stefanon, M., et al. 2013, ApJ, 777, 18, doi: 10.1088/0004-637X/777/1/18
- Oguri et al. (2012) Oguri, M., Bayliss, M. B., Dahle, H., et al. 2012, MNRAS, 420, 3213, doi: 10.1111/j.1365-2966.2011.20248.x
- Peng et al. (2010) Peng, C. Y., Ho, L. C., Impey, C. D., & Rix, H.-W. 2010, AJ, 139, 2097, doi: 10.1088/0004-6256/139/6/2097
- Planck Collaboration et al. (2020) Planck Collaboration, Aghanim, N., Akrami, Y., et al. 2020, A&A, 641, A6, doi: 10.1051/0004-6361/201833910
- Quider et al. (2010) Quider, A. M., Shapley, A. E., Pettini, M., Steidel, C. C., & Stark, D. P. 2010, MNRAS, 402, 1467, doi: 10.1111/j.1365-2966.2009.16005.x
- Rest et al. (2005) Rest, A., Stubbs, C., Becker, A. C., et al. 2005, The Astrophysical Journal, 634, 1103, doi: 10.1086/497060
- Richard et al. (2021) Richard, J., Claeyssens, A., Lagattuta, D., et al. 2021, A&A, 646, A83, doi: 10.1051/0004-6361/202039462
- Rigby et al. (2018) Rigby, J. R., Bayliss, M. B., Sharon, K., et al. 2018, AJ, 155, 104, doi: 10.3847/1538-3881/aaa2ff
- Rinaldi et al. (2022) Rinaldi, P., Caputi, K. I., van Mierlo, S. E., et al. 2022, ApJ, 930, 128, doi: 10.3847/1538-4357/ac5d39
- Rivera-Thorsen et al. (2017) Rivera-Thorsen, T. E., Dahle, H., Gronke, M., et al. 2017, A&A, 608, L4, doi: 10.1051/0004-6361/201732173
- Rivera-Thorsen et al. (2019) Rivera-Thorsen, T. E., Dahle, H., Chisholm, J., et al. 2019, Science, 366, 738, doi: 10.1126/science.aaw0978
- Salim et al. (2007a) Salim, S., Rich, R. M., Charlot, S., et al. 2007a, ApJS, 173, 267, doi: 10.1086/519218
- Salim et al. (2007b) —. 2007b, ApJS, 173, 267, doi: 10.1086/519218
- Salmon et al. (2015) Salmon, B., Papovich, C., Finkelstein, S. L., et al. 2015, ApJ, 799, 183, doi: 10.1088/0004-637X/799/2/183
- Santini et al. (2009) Santini, P., Fontana, A., Grazian, A., et al. 2009, A&A, 504, 751, doi: 10.1051/0004-6361/200811434
- Santini et al. (2017) Santini, P., Fontana, A., Castellano, M., et al. 2017, ApJ, 847, 76, doi: 10.3847/1538-4357/aa8874
- Schlafly & Finkbeiner (2011) Schlafly, E. F., & Finkbeiner, D. P. 2011, ApJ, 737, 103, doi: 10.1088/0004-637X/737/2/103
- Sérsic (1963) Sérsic, J. L. 1963, Boletin de la Asociación Argentina de Astronomía La Plata Argentina, 6, 41
- Sharon et al. (2020) Sharon, K., Bayliss, M. B., Dahle, H., et al. 2020, ApJS, 247, 12, doi: 10.3847/1538-4365/ab5f13
- Shivaei et al. (2015) Shivaei, I., Reddy, N. A., Steidel, C. C., & Shapley, A. E. 2015, ApJ, 804, 149, doi: 10.1088/0004-637X/804/2/149
- Simcoe et al. (2013) Simcoe, R. A., Burgasser, A. J., Schechter, P. L., et al. 2013, PASP, 125, 270, doi: 10.1086/670241
- Smail et al. (2007) Smail, I., Swinbank, A. M., Richard, J., et al. 2007, ApJ, 654, L33, doi: 10.1086/510902
- Sobral & Matthee (2019) Sobral, D., & Matthee, J. 2019, A&A, 623, A157, doi: 10.1051/0004-6361/201833075
- Stark et al. (2013) Stark, D. P., Auger, M., Belokurov, V., et al. 2013, MNRAS, 436, 1040, doi: 10.1093/mnras/stt1624
- Sukay et al. (2022) Sukay, E., Khullar, G., Gladders, M. D., et al. 2022, arXiv e-prints, arXiv:2203.11957. https://arxiv.org/abs/2203.11957
- Tasca et al. (2015) Tasca, L. A. M., Le Fèvre, O., Hathi, N. P., et al. 2015, A&A, 581, A54, doi: 10.1051/0004-6361/201425379
- Tody (1986) Tody, D. 1986, in Instrumentation in Astronomy VI, ed. D. L. Crawford, Vol. 0627, International Society for Optics and Photonics (SPIE), 733 – 748, doi: 10.1117/12.968154
- Tody (1993) Tody, D. 1993, in Astronomical Society of the Pacific Conference Series, Vol. 52, Astronomical Data Analysis Software and Systems II, ed. R. J. Hanisch, R. J. V. Brissenden, & J. Barnes, 173
- Tomczak et al. (2016) Tomczak, A. R., Quadri, R. F., Tran, K.-V. H., et al. 2016, ApJ, 817, 118, doi: 10.3847/0004-637X/817/2/118
- Tran et al. (2022) Tran, K.-V. H., Harshan, A., Glazebrook, K., et al. 2022, AJ, 164, 148, doi: 10.3847/1538-3881/ac7da2
- Vanzella et al. (2018) Vanzella, E., Nonino, M., Cupani, G., et al. 2018, MNRAS, 476, L15, doi: 10.1093/mnrasl/sly023
- Virtanen et al. (2020) Virtanen, P., Gommers, R., Oliphant, T. E., et al. 2020, Nature Methods, 17, 261, doi: 10.1038/s41592-019-0686-2
- Walcher et al. (2011) Walcher, J., Groves, B., Budavári, T., & Dale, D. 2011, Ap&SS, 331, 1, doi: 10.1007/s10509-010-0458-z
- Wilkins et al. (2012) Wilkins, S. M., Gonzalez-Perez, V., Lacey, C. G., & Baugh, C. M. 2012, MNRAS, 427, 1490, doi: 10.1111/j.1365-2966.2012.22092.x
- Wu et al. (2022) Wu, Y., Cai, Z., Sun, F., et al. 2022, arXiv e-prints, arXiv:2208.08473. https://arxiv.org/abs/2208.08473