Isotopic ratios for C, N, Si, Al, and Ti in C-rich presolar grains from massive stars
Abstract
Certain types of silicon carbide (SiC) grains, e.g., SiC-X grains, and low density (LD) graphites are C-rich presolar grains that are thought to have condensed in the ejecta of core-collapse supernovae (CCSNe). In this work we compare C, N, Al, Si, and Ti isotopic abundances measured in presolar grains with the predictions of 21 CCSN models. The impact of a range of SN explosion energies is considered, with the high energy models favouring the formation of a C/Si zone enriched in 12C, 28Si, and 44Ti. Eighteen of the 21 models have H ingested into the He-shell and different abundances of H remaining from such H-ingestion. CCSN models with intermediate to low energy (that do not develop a C/Si zone) cannot reproduce the 28Si and 44Ti isotopic abundances in grains without assuming mixing with O-rich CCSN ejecta. The most 28Si-rich grains are reproduced by energetic models when material from the C/Si zone is mixed with surrounding C-rich material, and the observed trends of the 44Ti/48Ti and 49Ti/48Ti ratios are consistent with the C-rich C/Si zone. For the models with H-ingestion, high and intermediate explosion energies allow the production of enough 26Al to reproduce the 26Al/27Al measurements of most SiC-X and LD graphites. In both cases, the highest 26Al/27Al ratio is obtained with H still present at in He-shell material when the SN shock is passing. The existence of H in the former convective He-shell points to late H-ingestion events in the last days before massive stars explode as a supernova.
keywords:
nuclear reactions, nucleosynthesis, abundances – stars: abundances – stars: evolution – stars: massive – supernovae: general1 Introduction
Presolar grains were produced by different types of stars nearby the Sun before its formation about 5 Gyr ago. These grains were important ingredients for the first aggregates of solid materials from which the parent bodies of primitive meteorites formed inside the protoplanetary disk around the young Sun. These meteorites have been recovered on Earth and can therefore be analysed in laboratories. The C-rich grains can be isolated from solar material by dissolving the parent meteorite in acids to leave the resilient grains behind (e.g. Amari et al., 1994). The isotopic ratios and abundances of presolar grains can be measured in laboratories providing a powerful diagnostic for theoretical stellar simulations.
Few isotopic ratios are observable in stellar spectra, and they suffer from much larger uncertainties compared to data obtained from presolar grains. We refer to e.g., Carretta et al. (2000); Spite et al. (2006) for C isotopic ratios, to Hedrosa et al. (2013) for N, to Yong et al. (2003); Carlos et al. (2018) for Mg and to Chavez & Lambert (2009) for Ti.
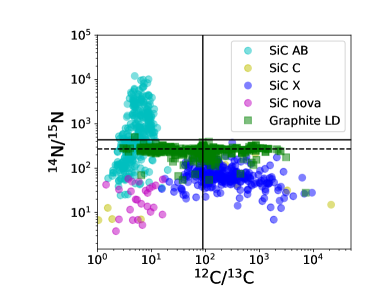
Certain types of C-rich grains, e.g., SiC-X grains and low density (LD) graphites, formed in the ejecta of core collapse supernovae (CCSNe; the collapse of a massive star with initial mass 9 M⊙, e.g. Woosley et al., 2002; Nomoto et al., 2013; Sukhbold et al., 2016; Limongi & Chieffi, 2018; Curtis et al., 2019), identified because their isotopic abundances match the signatures of these events. Such signatures of CCSNe include 15N-excesses relative to solar111Unless otherwise stated to be absolute, all excesses and deficiencies of isotope abundances are discussed relative to solar ratios., strong Si isotope anomalies, and evidence for the presence of the radioactive isotope 44Ti at the time of grain formation. Discovered by Bernatowicz et al. (1987), SiC grains are a C-rich type of presolar grain that are typically observed at concentrations of ppm (but up to ppm) and diameters of m and up to m (Davis, 2011; Zinner, 2014; Nittler & Ciesla, 2016, and references therein). SiC and graphite grains are believed to only form in C-rich environments, i.e. where C/O (by number fraction). The strength of the CO molecular bond is such that no other C-rich molecules could efficiently form (Ebel & Grossman, 2001). There are several sub-types of presolar SiC grains (Mainstream, AB, C, X, Y, Z, and putative nova; which are shown in Figure 1 with the exception of mainstream, Y, and Z grains) which are characterised by specific isotopic ratios. Among other ratios, the most used to distinguish between different presolar grain types are 12C/13C, 14N/15N, the 222(ratio) = (grain ratio/solar ratio - 1) delta ratio 29,30Si and 26Al/27Al (Zinner, 2014).
SiC-X grains (about of all SiC grains, e.g. Zinner, 2014) have a relative excess of 28Si to 29,30Si compared to solar ratios. Most have a 12C, 15N excess, while some have a 13C, 15N excess compared to solar. The 26Mg and 44Ca excesses are due to the condensation of unstable 26Al and 44Ti respectively in the grains (e.g. Besmehn & Hoppe, 2003). The majority of SiC-X grains also show an excess of 49,50Ti relative to 48Ti and 10-20 show a large excess of 44Ca (Nittler et al., 1996; Besmehn & Hoppe, 2003; Lin et al., 2010). SiC-X are known to have originated from CCSNe, primarily due to their excesses of 28Si and extinct 44Ti (e.g. Nittler et al., 1996). Evidence for initial 44Ti within at least one of the few SiC grains classified as nova grains led to the conclusion that they had formed by CCSNe as 44Ti production is a notable signature of CCSN nucleosynthesis (Nittler & Hoppe, 2005). SiC type-AB grains ( of all SiC grains; Amari et al., 2001b) are believed to have multiple sources including CCSNe (Liu et al., 2017a; Hoppe et al., 2019). Putative nova grains, and 15N-rich and possibly also 15N-depleted AB grains are consistent with the H-ingestion models discussed in this work, in Pignatari et al. (2015) and in Liu et al. (2016).
Low density graphites (Amari et al., 1995) are another type of C-rich grain, showing a large 12C/13C ratio range. Excesses and deficits of 28Si relative to 29,30Si are both observed, as are excesses in 26Mg and 44Ca. With few exceptions, the 14N/15N ratio of LD graphites is mostly consistent at about 300, suggesting heavy contamination from terrestrial nitrogen (e.g. Amari et al., 1993; Hoppe et al., 1995). Most LD graphites are believed to originate in CCSNe due to their large range of C isotopic ratios and excesses in signature isotopes such as 15N, 18O, 26Mg, 28Si, 44Ca, and 49,50Ti (Travaglio et al., 1999).
Isotopic signatures such as those found in presolar grains are formed in very specific regions of CCSNe. Classically, the main C-rich region is the He/C zone (the He-shell of the ejecta) above the O-rich O/C zone (Meyer et al., 1995). However, Pignatari et al. (2013a) introduced a new set of models showing a new C-rich zone which was able to explain most observed abundances of C-rich grains. As the shockwave of the CCSN reaches the bottom of the He/C zone, its density and temperature increase dramatically. These conditions efficiently activate explosive He-burning. However, at T > K the 12C(,)16O reaction is up to orders of magnitudes weaker relative to the subsequent reactions in the -capture chain, starting from the reaction 16O(,)20Ne. This leads to a 12C- and 28Si-rich, 16O-deficient region in the deepest He/C shell material, defined by Pignatari et al. (2013a) as the C/Si zone. Additionally, non-homogeneous H-ingestion into the He/C zone prior to the explosions results in the variable production of 13C, 15N, and 26Al by explosive H-burning deep in the C-rich He-shell, nearby the C/Si zone. H-ingestion combined with the extreme conditions of the SN shockwave triggers the production of 15N via the hot CNO cycle. This allows the isotopic ratios of CCSN grains such as low 12C/13C and 15N-excesses to be reproduced by local mixing of material (Pignatari et al., 2015; Liu et al., 2016, 2018b; Hoppe et al., 2018).
Classically, the explosive -capture at the bottom of the former convective He-shell activates a neutron burst peaking up to neutrons cm-3, produced by the 22NeMg reaction. This nucleosynthesis process was called the n-process (Blake & Schramm, 1976; Thielemann et al., 1979). Much later, its signature was identified in heavy elemental abundances measured in presolar SiC-X grains such as large excesses of 58Fe, 88Sr, 96Zr, 95,97Mo, and 138Ba (e.g. Meyer et al., 2000; Pellin et al., 2006; Pignatari et al., 2018) and in the production of the radioactive isotope 32Si (Pignatari et al., 2015). However, this scenario has been discounted as a way to explain the r-process because it could not reproduce the r-process abundance pattern in the Solar System (Blake et al., 1981). The presence of H in the He-shell during the SN explosion may lead to a suppression of the n process, where it becomes more probable to destroy 22Ne by proton capture than by the 22NeMg reaction (Pignatari et al., 2015). The production of 44Ti and 40Ca in the C/Si zone along with the possible strong depletion of 40Ca by neutron capture predicts abundances consistent with the observation of large 44Ca/40Ca in the C-rich grains discussed (Pignatari et al., 2013a). It is still matter of debate if in presolar grains the abundance signatures of H-ingestion coexist with the neutron-capture signature of the n-process. Indeed, the n-process activation would be compatible with the 30Si- and 32S-enhancements measured in in some putative nova grains (Liu et al., 2016; Hoppe et al., 2018), and with the 32Si- and 50Ti-enhancements found in a sample of SiC-AB grains (Liu et al., 2017a). On the other hand, measurements of the Sr, Mo and Ba isotopic abundances in SiC-AB grains seem to be compatible with the pre-explosive s-process abundances in the He shell, and not with the n-process (Liu et al., 2018b). In the first case, major asymmetries triggered by the H ingestion in the pre-explosive He shell structure would be required in order to explain for the same single grain the signatures of both the n-process and of a late H-ingestion event leaving H behind in the former He shell material. While this may be a natural expectation from multi-dimensional simulations, it cannot be captured by one-dimensional stellar simulations. Additionally, those abundance signatures of high neutron-density exposures could also be the effect of a local activation of the intermediate neutron-capture process (i-process Cowan & Rose, 1977), following the H ingestion event. The i-process has been proposed as a nucleosynthesis source active in massive stars at low metallicities (e.g., Roederer et al., 2016; Clarkson et al., 2018; Banerjee et al., 2018), but it also has been proposed as a source of anomalous signatures in presolar grains for Ti isotopes (HD graphites, Jadhav et al., 2013), Ba isotopes (in some mainstream SiC grains, Liu et al., 2014) and 32Si-enrichments (in SiC AB grains, Fujiya et al., 2013). In order to verify all of these different scenarios, new abundance observations are required for more presolar grains of different types.
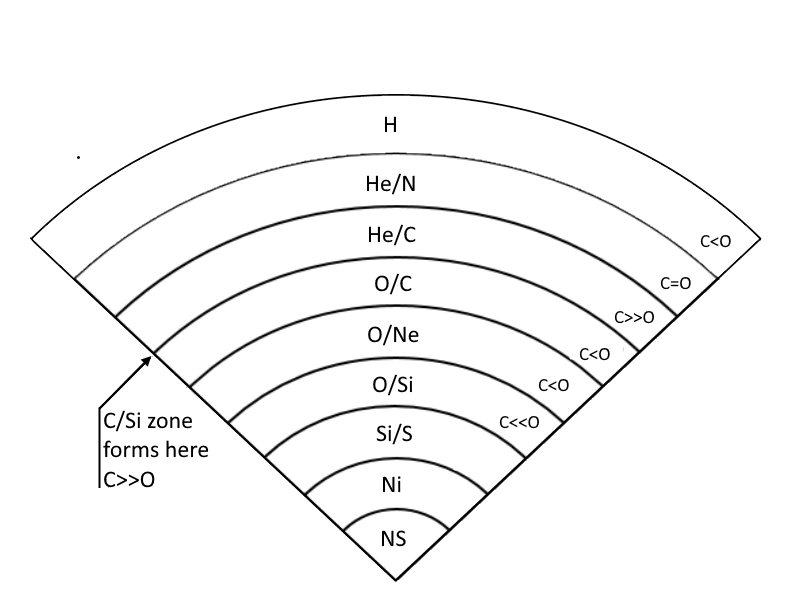
An alternative scenario for the formation of SiC-X grains is that 28Si and 44Ti originate from the Si/S zone, which is the region of the ejecta dominated by explosive O-burning (Meyer et al., 1995). Figure 2 shows a schematic of the layered ‘shell‘ structure of a CCSN ejecta as described by Meyer et al. (1995) with the stellar zones. The Si/S zone is mostly made of 28Si and 32S by O fusion, and 44Ti is efficiently produced by -capture (Woosley & Weaver, 1995). The high 12C/13C ratios are signatures of He-burning and high 26Al/27Al ratios can be produced in the He/N zone by H-burning. However, these isotopic ratios are produced in different, non-neighbouring layers undergoing different phases of burning prior to the SN explosion (e.g. Woosley & Weaver, 1995; Rauscher et al., 2002). This requires deep, inhomogeneous mixing of these layers in the CCSN ejecta while maintaining C>O. For instance, Si and Ti signatures may need contributions from the Ni, O/Si, and Si/S zones where complete or partial Si-burning and O-burning occur (e.g., Travaglio et al., 1999; Xu et al., 2015). The He/N and He/C zones where H- and incomplete He-burning occurs are also required. This is where the C>O condition is met for SiC condensation (Lodders & Fegley, 1997). This C>O condition necessitates extremely limited addition of material from the intermediate O-rich layers (Travaglio et al., 1999). Three-dimensional hydrodynamic models predict mixing in the ejecta carried out by Rayleigh-Taylor instabilities (Hammer et al., 2010). It remains to be seen if these instabilities allow the inner regions to penetrate (while minimising the addition of material from) the O-rich regions and mix with those rich in C. Astronomical observations of supernovae remnants have shown extensive mixing within the ejected material (Hughes et al., 2000; Kifonidis et al., 2003).
CCSNe also show a large range of explosion energies, from very faint CCSNe with few erg to hypernovae, up to erg (e.g., Nomoto et al., 2013). Travaglio et al. (1999) demonstrated that it was possible to reproduce most isotopic abundances with these models but also highlighted their shortcomings such as the lack of 15N and the need for the C-rich condition. To overcome this need for mixing between non-neighbouring layers, Clayton et al. (1999) and following works suggested the possibility of condensing C-rich grains in O-rich material. However, this remains controversial as Ebel & Grossman (2001) concluded that only nanometre-sized grains such as nano-diamonds may form in this turbulent O>C environment and is therefore unrealistic for SiC formation. It was also shown by Lin et al. (2010) that the isotopic ratios of SiC grains of SN origin are inconsistent with the predictions for O-rich material. On the other hand, the advantage of the formation of the C/Si zone is to have isotopes such as 28Si and 44Ti made in a C-rich environment, in the vicinity of C-rich He shell layers.
In this work, we compare the abundance predictions of 21 CCSN models with the observed isotopic ratios of C, N, Al, Si and Ti of different types of C-rich presolar grains with established or possible CCSN origin. The structure of the paper is as follows. Section 2 describes the stellar models. In Section 3, the theoretic predictions are compared with observed grain abundances. Section 4 summarises the results.
2 Theoretical Stellar Models
In this study, 4 sets of CCSN models are used: two progenitor masses, of 15 and 25 M⊙, both with and without the ingestion of H into the He/C zone in the pre-SN phase. All of the models have a metallicity scaled to Z = 0.02 from the solar abundances by Grevesse & Noels (1993). A summary of their main features and specifications can be found in Tables 1 and 2. Detailed information for the models are published in Pignatari et al. (2015) and Pignatari et al. (2016).
The stellar progenitors were all calculated using the code GENEC (Eggenberger et al., 2008). Rotation and magnetic fields were not included. Mass-loss rates during the Main Sequence phase (log Teff 3.9, where Teff is the effective temperature) were taken from Vink et al. (2001). For 3.7 log Teff 3.9, De Jager et al. (1988) prescriptions were used, and for more advanced stages and log Teff 3.7, a scaling law with the stellar luminosity was adopted (Pignatari et al., 2016). Consistently with typical GENEC stellar simulations, the nuclear network to follow energy generation is made of isotopes included explicitly (1H, 3He, 4He, 12C, 13C, 14N, 15N, 16O, 17O, 18O, 20Ne, 22Ne, 24Mg, 25Mg, 26Mg, 28Si, 32S, 36Ar, 40Ca, 44Ti, 48Cr, 52Fe, 56Ni) and implicitly in chain reactions to correctly follow the energy generation up to Si burning (e.g., Hirschi, 2007).
For the CCSN explosion, the mass cut above which the material is ejected (i.e., the mass of the final compact remnant) is given by the analytical formula of Fryer et al. (2012), depending on the initial mass and metallicity of the progenitor. The amount of matter that falls back after the launch of the explosion is also taken into account. For the stellar layers ejected, the main information for the CCSN nucleosynthesis are given by a semi-analytic description for the shock heating and following temperature and density evolution in the different layers. The shock velocity through the stellar structure is defined by the Sedov blastwave solution (Sedov, 1946). The peak post-shock temperature and density calculated for each zone of the CCSN ejecta are followed by an adiabatic exponential decay for few seconds, when only -decay nuclear reactions remain active from radioactive unstable isotopes (Pignatari et al., 2016).
The thermodynamic and structural information from the stellar models and from the CCSN explosions are used as input for the post-processing nucleosynthesis calculations which generates complete stellar yields. For these models, we used the parallel multi-zone code mppnp from the NuGrid post-processing simulation tool framework. The nuclear network is dynamic, increasing up to more than 5200 isotopes and 74000 reactions depending on the needs from the nucleosynthesis conditions found. The detailed description of the post-processing code, the simulation setup and the nuclear reaction network is given in Pignatari et al. (2016).
Explosive He burning conditions are particularly relevant for our study. The triple- and 12C(,)16O reaction rates are from Fynbo et al. (2005) and Kunz et al. (2002), respectively. The 22Ne(,n)25Mg reaction rate is from Jaeger et al. (2001). More recent rates are becoming available for this reaction (e.g., Talwar et al., 2016; Ota et al., 2021; Adsley et al., 2021), which is the dominant source of neutrons in explosive He burning (Thielemann et al., 1979; Meyer et al., 2000; Pignatari et al., 2018). However, nuclear uncertainties should have a limited impact at the relevant temperatures for this study, of the order of Kelvin or higher. Neutron capture rates are from the KADoNIS 0.3 compilation where available (Dillmann et al., 2006), otherwise for unstable isotopes the theoretical rates adopted were from the JINA REACLIB version 1.1 (e.g., Cyburt et al., 2010). Available stellar -decay rates are from Fuller et al. (1985) and Oda et al. (1994) for light isotopes, and for the iron group isotopes and beyond we used Langanke & Martínez-Pinedo (2000) and Goriely (1999).
For this work, we use three 15M⊙ models by Pignatari et al. (2013a) and Pignatari et al. (2016). The explosion simulations include the fallback prescription by Fryer et al. (2012) and use the recommended initial shock velocity for one case, while two further cases with the shock velocity divided by two and four have also been calculated (models 15d, 15r2 and 15r4, respectively). For model 15d, the shock velocity of material that does not fall back is cm s-1, corresponding to an explosion energy of 3-erg. Models 15r2 and 15r4 correspond to SN explosion energies of 1-erg and less than erg, respectively (Pignatari et al., 2013a, 2016). Note that with the semi-analytic approach used for our models, the SN shock is driven off the proto-neutron star based on the mass cut derived from Fryer et al. (2012). With this approach, the initial shock velocity becomes a crucial parameter, directly related to the temperature and density peaks in different stellar layers during the CCSN explosion (e.g., Pignatari et al., 2016; Ritter et al., 2018). However, shock velocities cannot be mapped directly to CCSN explosion energies. Therefore, for each model we provide an indicative range of CCSN energies corresponding to the given initial shock velocities, instead of a single explosion energy.
Our approach for the CCSN models is different from other studies in the literature, where several methods were adopted to produce large scale one-dimensional nucleosynthesis and abundance yield calculations. Different engines have been used to artificially drive the explosion, among others a piston (Woosley & Weaver, 1995; Rauscher et al., 2002; Sieverding et al., 2018), a thermal bomb (e.g., Thielemann et al., 1996; Nomoto et al., 2013), the injection of thermal energy (e.g., Limongi & Chieffi, 2003), or more recently effective neutrino-driven models (Perego et al., 2015; Sukhbold et al., 2016; Curtis et al., 2019). While the greatest impact of the methods used to simulate the CCSN explosion are expected to be seen in the most internal layers of the CCSN ejecta where the iron group elements are made, the more external regions of the CCSN ejecta relevant for this work (the former C-rich He shell) are not much affected by the adopted approach to simulate the explosion. A much greater impact is instead due to the evolution of the stellar progenitor and to the uncertainties in the progenitor structure (e.g., Pignatari et al., 2015).
In the present simulation framework, for the most energetic CCSN models described above (15d and 15r2), the temperature rises from K in the pre-SN stage to a peak of up to about K in the forming C/Si zone (Pignatari et al., 2013a). Note that for these models in the former O/C zone and at the bottom of the C/Si zone there is still a small region where O is destroyed but there is not enough 4He to make 28Si. Here the temperature rises up to about K (see Table 1). In the region of the former He shell relevant for explosive nucleosynthesis, the SN peak temperature in model 15r4 is about 30-40% lower than in 15d, while 15r2 and 15d are the same.
The 25d model is calculated for a 25M⊙ progenitor star. Since no substantial 56Ni is ejected by the explosion, we may classify 25d as a faint SN model (Pignatari et al., 2016). After core C-burning ends in the progenitor star, the convective He-shell becomes unstable and ingests H into it from above the He-rich region. The beginning of core O-burning deactivates the convective zone completely until the SN explosion, leaving the He-rich shell with a H abundance of about . With 25d, Pignatari et al. (2015) introduced 25d-H5, 25d-H10, 25d-H20, 25d-H50, and 25d-H500 (25d model set). These models are the same as 25d in all respects except the H abundance in the He-shell is reduced by a factor of 5, 10, 20, 50, and 500 respectively.
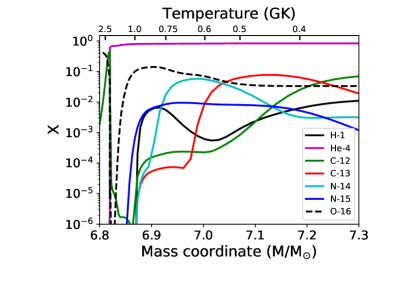
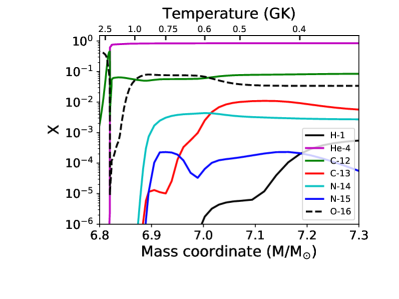
Pignatari et al. (2015) also introduced the 25T model set where the temperature and density of 25d are artificially increased to reproduce the explosive conditions of a 15M⊙ star in the He shell layers (15d model, included in this study). The bottom of the C/Si zone in the 15d model reaches a peak temperature 3.3 times higher than in the 25d model (K rather than K), with the 25T model reaching K. The peak density is also 100 times higher. The same range of pre-explosion He-shell concentrations of H are examined here; 25T-H, 25T-H5, 25T-H10, 25T-H20, 25T-H50, and 25T-H500. As an example, the abundance profiles in the He-shell ejecta of 25T-H and 25T-H20 are shown in Figure 3. Relevant differences are the stronger 12C depletion in 25T-H compared to 25T-H20, partially compensated by the production of 13C. The pre-SN 14N and 15N abundances are both increased by the SN explosion in model 25T-H, by up to an order of magnitude and two orders of magnitudes respectively in some of the He shell zones shown in the figure. On the other hand, in the 25T-H20 model the N ejecta will be more representative of the pre-SN abundances, defined by the specific H ingestion event (Pignatari et al., 2015). In Figure 3, for both the two models we can see the formation of the so-called O/Nova zone in the ejected CCSN abundances just above the bottom of the He shell (Pignatari et al., 2015), where oxygen is more abundant than carbon. Indeed, the combined 12C depletion and 16O production allows an O-rich region to form from the C-rich pre-explosive He shell. In these conditions, the explosive “Nova-like” H-burning nucleosynthesis on the previous H-ingestion products provides a nucleosynthesis characterized by high enrichments of e.g., 15N, 25Mg and 26Al. Such anomalous signatures have been studied by several presolar grains studies recently, supporting the existence of the conditions discussed here based on isotopic measurements of both presolar SiC grains (Liu et al., 2017a, 2018a; Hoppe et al., 2019) and presolar silicates (Hoppe et al., 2021). For each model, the mass coordinates of the O/Nova zones formed during the CCSN explosions are given in Table 2.
In this work we also present a new set of six CCSN models, aiming at refining the study of the impact of different explosion energies in models with H-ingestion. The 25av model set was designed to be an intermediate to the 25d and 25T sets by having its shock peak temperature and peak density at the midpoint of the two. Again, the 25av set has a range of H concentrations as described above. These are labelled as: 25av-H, 25av-H5, 25av-H10, 25av-H20, 25av-H50, and 25av-H500. Note that the temperature at the bottom of the C-rich region of models 25av is similar to the temperatures found in model 15r4 (see Table 2).
| Models without H-ingestion | |||
|---|---|---|---|
| Model set 15d | 15d | 15r2 | 15r4 |
| Shock Peak Temperature [K] | |||
| C/Si zone [M⊙] | |||
| He-shell [M⊙] | |||
| Explosion Energy [erg] | |||
| Models with H-ingestion | ||||||
|---|---|---|---|---|---|---|
| XH in He-shell | ||||||
| before SN shock | ||||||
| Model set 25T | 25T-H | 25T-H5 | 25T-H10 | 25T-H20 | 25T-H50 | 25T-H500 |
| Shock Peak Temperature [K] | ||||||
| C/Si zone [M⊙] | ||||||
| O/nova zone [M⊙] | … | … | ||||
| He-shell [M⊙] | ||||||
| Model set 25av | 25av-H | 25av-H5 | 25av-H10 | 25av-H20 | 25av-H50 | 25av-H500 |
| Shock Peak Temperature [K] | ||||||
| C/Si zone [M⊙] | … | |||||
| O/nova zone [M⊙] | … | … | ||||
| He-shell [M⊙] | ||||||
| Model set 25d | 25d-H | 25d-H5 | 25d-H10 | 25d-H20 | 25d-H50 | 25d-H500 |
| Shock Peak Temperature [K] | ||||||
| C/Si zone [M⊙] | … | |||||
| O/nova zone [M⊙] | … | |||||
| He-shell [M⊙] | ||||||
3 Comparison with presolar grains
In this section, we compare the stellar models to the grain data. We will only consider the abundance profiles in C-rich regions of the SN ejecta for the comparison, i.e., the He/C zone and the C/Si zone (if the SN conditions allow its formation). For the models affected by H ingestion, we will also consider the O/nova zone as discussed by Pignatari et al. (2015). Indeed, although it is O-rich, its position between the C/Si and the He/C zones makes it reasonable to expect that local mixing of stellar material would still result in C-rich mixtures.
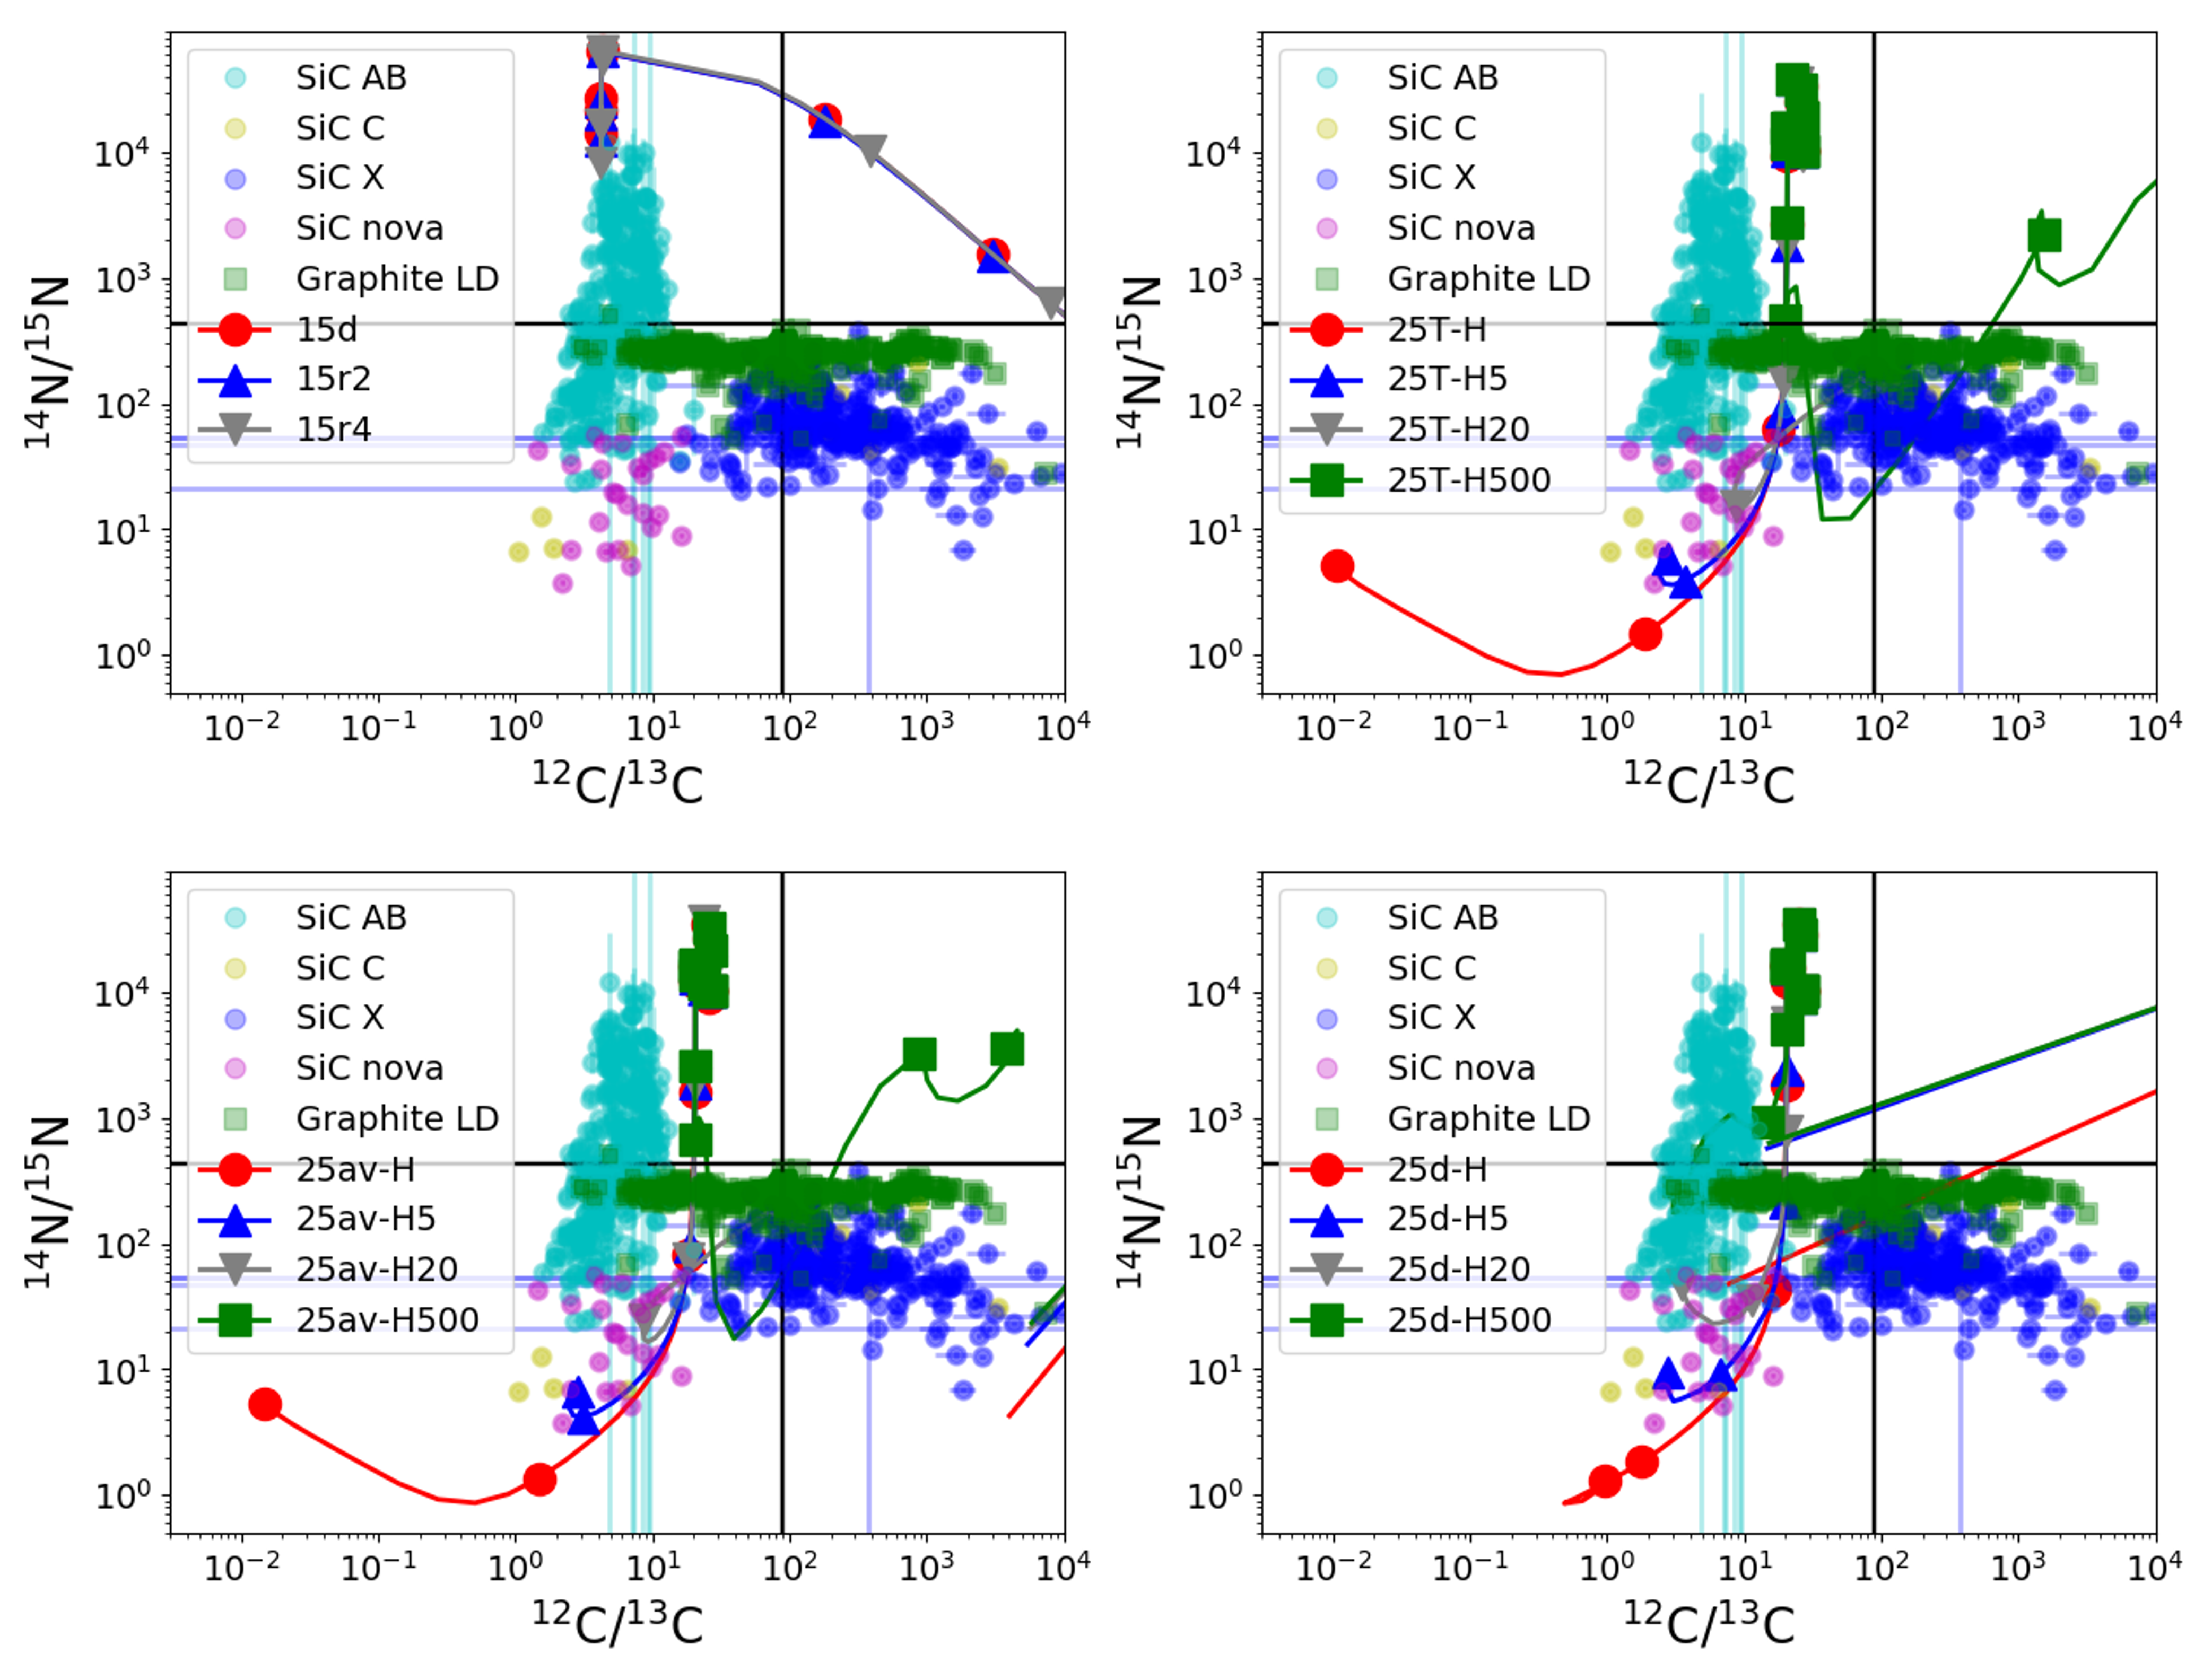
In Figure 4, the C and N isotopic ratios of individual SiC grains and LD graphites are compared to the CCSN abundances predicted from across the He/C zone of the models. The 15d, 15r2, and 15r4 models in the top left Panel have the same stellar progenitor but have different explosion energies and no H-ingestion. The 25T models in the top right Panel have the same explosion energy (extremely similar to that of 15d, see § 2) but have different initial conditions. They allow us to explore the impact of different amounts of H remaining from ingestion, ranging from 25T-H (about 1.2% of H left at the SN shock passage from the previous H-ingestion event) down to 25T-H500 (about 0.0024%). In the 25T-H500 case, there is no significant explosive H-burning nucleosynthesis taking place, but still has the signatures of H-ingestion such as the production of 13C and 14,15N via the CNO-cycle.
The 25av and 25d model sets are shown in the bottom left and right Panels respectively, covering the same parameter space for H as the 25T set. However, these model sets have different explosion energies (see § 2). Note that the -H10 and -H50 models are not shown in these figures, since they appear to follow a linear behaviour with the initial H concentration in between models -H5 and -H500. As discussed in Pignatari et al. (2013a), in the 15d model a C/Si zone is developed by CCSN nucleosynthesis with large 12C/13C ratios (-, off the right of the plot). The outer region of the He/C zones and the He/N zone in the 15M⊙ models are affected by H-burning, with a subsolar C ratio of about 4. Assuming different combinations of local mixing between the C/Si zone, the He/C zone and other external CCSN layers, these models would be potentially suited to explain the C and N ratios for the SiC-X grains and LD graphites with C ratios larger than solar (Pignatari et al., 2013a). For the 25M⊙, H-ingestion models, most of the He/C zone contains CCSN abundances that skirt along the edge of the presolar SiC-AB grains at a 12C/13C ratio of around 20, covering 14N/15N values in the range - . In these regions of the ejecta, the 12C/13C ratio is defined by the main properties of the H-ingestion event and it is not affected by the CCSN explosion. Since these models share the same stellar progenitor, they all show the same ratio. On the other hand, we should expect that different H ingestions in different real progenitors could naturally produce a large variation of sub-solar 12C/13C ratios in He-shell layers, possibly even within the same star. Indeed, depending on the timescale and strength of the ingestion the C ratio may change significantly. In order to explore the realistic range of C ratios to be expected from H ingestion in massive stars, multi-dimensional hydrodynamics simulations are needed (e.g. Herwig et al., 2014a; Woodward et al., 2015a; Clarkson & Herwig, 2021). In general, from our models we find that the C-rich He shell in models with H-ingestion carries a much lower C ratio compared to the models without H-ingestion, reaching values much lower than solar. Therefore, these models appeared to be more suited to explain presolar C-rich grains from CCSNe with low C ratios (Pignatari et al., 2015).
The deepest layers of the He/C zone are strongly affected by explosive H burning, and produce low 12C/13C and 14N/15N ratios that are consistent even with the most extreme abundance signatures measured in putative SiC nova grains (Pignatari et al., 2015; Liu et al., 2016; Hoppe et al., 2018), and with some degree of local mixing with SiC-AB grains (Liu et al., 2017a; Hoppe et al., 2019). The differences in the models compared to the upper He/C zone is due to the partial activation of the hot CNO cycle (e.g., Wiescher et al., 2010). Models with more remaining H in the deep He/C zone achieve lower 12C/13C and 14N/15N ratios in the CCSN ejecta due to radiogenic contributions to 13C and 15N. For example, 25T-H has the most H remaining from ingestion and develops the lowest 12C/13C and 14N/15N ratios of all the models, while 25T-H500 has no H deep in the He/C zone, so develops high 12C/13C and 14N/15N ratios. The CCSN abundances in the C/Si zone develop 12C/13C and 14N/15N ratios of about - and 0.01 - respectively, so with local mixing between the C/Si zone and the deep He/C zone, the 25T-H, 25T-H5, and 25T-H20 models could potentially reproduce all SiC-X grains, including those with 12C/13C ratios higher than solar (e.g. Hoppe et al., 2018).
In the bottom left Panel, despite the much lower SN energy, the 25av models show a similar evolution of the C and N ratios in the CCSN ejecta compared to the 25T set. The high 12C/13C region to the right of the plot represents the C-rich region at the top of the O/C zone extending from 6.73 to 6.82M⊙. Mixing this region with material in the He/C zone and the intermediate O-rich O/nova zone may explain the large scatter of anomalous ratios measured in presolar grains, still satisfying the constraint of a C-rich mixture. Since the 25av explosions are less energetic than 25T, both less 14N and 15N are made at the bottom of the He/C zone, but still showing similar N isotopic ratios overall.
In the bottom right Panel, at the bottom of the He/C zone (6.82M⊙), the models 25d-H5 and 25d-H20 show trends similar to their analogous models at higher energies. However, the lowest C ratio reached by model 25d-H is 0.5, which is not as extreme as the 25T-H and 25av-H models. The SN explosive conditions combined with the lower H concentration allow 25d-H500 and 25d-H20 to provide 12C/13C and 14N/15N ratios consistent with 14N-rich SiC-AB grains in the deep He/C zone around 6.82M⊙. Alternatively, Hoppe et al. (2019) suggested adjustments of C and Al isotopic ratios in the 25T models in order to simultaneously match C, N, and Al isotopic ratios of AB grains (both 15N-rich and 15N-poor).
In Figure 5, the Si isotopic ratios for SiC grains (sub-types AB, nova, X, and C) and LD graphites are shown with the CCSN abundances predicted from the four model sets. In the top left Panel, the 15d and 15r2 models show a large 28Si-excess in the C/Si zone as shown by low delta values for 29Si/28Si and 30Si/28Si. By assuming some mixing with more external stellar material carrying a 28Si-deficit or a close-to-solar Si isotopic composition, these models can qualitatively reproduce grains which show 28Si-excess such as SiC-X, a relevant number of LD graphites, and a few nova grains (Pignatari et al., 2013a). On the other hand, in the same region of the ejecta 15r4 does not develop a C/Si zone and the 28Si-rich signature obtained in 15d and 15r2. In the intermediate He/C zone of 15d, 15r2, and 15r4, there are strong 28Si-deficits due to the production of both 29Si and 30Si by neutron capture (this is the neutron-burst signature due to the strong activation of the n-process, see e.g. Meyer et al., 2000; Pignatari et al., 2013b; Pignatari et al., 2018), resulting in higher Si -values (up to 18000 and 25000 for 30/28Si and 29/28Si respectively) than in the deeper He/C zone. In particular, the more energetic models show a more efficient production of 30Si compared to 29Si. This material may be consistent with the 28Si-deficit seen in SiC-C grains that continue off the right of the plotted area, since mixing with material with ratios close-to-solar will result in much less extreme ratios. In the CCSN ejecta, Si isotopic ratios become less extreme in the outer He/C zone, with solar ratios or mild 28Si-deficit due to the pre-explosive s-process production in the He shell (e.g., Rauscher et al., 2002; Pignatari et al., 2016; Sukhbold et al., 2016).
In the top right Panel of Figure 5, the 25T models also develop a 28Si-rich C/Si zone. However, with the exception of 25T-H500, the 25T models predict less extreme Si ratios in the He/C zone. Indeed, during the SN explosion proton capture on 22Ne is in competition with -capture, reducing the activity of the 22Ne(,n)25Mg reaction and the strength of the n-process (Pignatari et al., 2015; Liu et al., 2018b). Therefore, a lower remaining abundance of H from ingestion (e.g. 25T-H500) allows the production of larger 28Si-deficit. By comparing with the models in the top left Panel, a novel CCSN nucleosynthesis signature in 25T-H and 25T-H5 is observed at the bottom of the He/C zone. Combined mild positive (30Si/28Si) and negative (29Si/28Si) are obtained, to a degree that is directly compatible with measurements in putative nova grains. This is simply due to the explosive H-burning active in that region, favouring the production of 30Si with respect to 29Si. The same feature is obtained in simulations for ONe novae (e.g., Amari et al., 2001a; José et al., 2001; José & Hernanz, 2007a; Denissenkov et al., 2014). In model 25T-H, just at the boundary between the He/C zone and the O/Nova zone, a positive (30Si/28Si) starts also to be developed. The same signature in nova models can be reached for the most massive ONe novae (see e.g., Amari et al., 2001a; José & Hernanz, 2007b). However, due to the higher temperatures involved in the O/Nova zone together with the high concentration of H, a much larger 28Si-deficit is achieved. We defer a discussion of the details of O/nova zone nucleosynthesis to a future work. Here we are instead interested in the specific differences obtained in models 25T-H and 25T-H5. These models have the same explosion energy, but different H concentration in the stellar progenitor. In Figure 6, we show a more zoomed version of the top right Panel from Figure 5, showing also the evolution of the ejected CCSN abundances in the O/Nova zone. In this region, 25T-H is evolving toward high positive (29Si/28Si) and (30Si/28Si) up to 35000 and 60000 per mil respectively (outside the plot boundary), while in the C/Si zone the ratios are returning to be consistent with 15d, shown in the top left Panel of Figure 5. Model 25T-H5 shows instead a completely different trend. The negative (29Si/28Si) is maintained, while with the higher energies the negative (30Si/28Si) is eventually obtained, consistent with the SiC-X observed slope. The SN explosion is clearly not the cause of the difference, since the two models share the same SN prescription. The different trends between 25T-H and 25T-H5 is only due to the different combination of explosive H-burning and explosive He-burning nucleosynthesis in the O/Nova zone, due to the different H concentration. This result is interesting and deserves further study, since it might provide future constraints for stellar models with H ingestion.
In the bottom left Panel of Figure 5, no C/Si zone is formed by explosive nucleosynthesis due to their lower explosion energy. On the other hand, the nucleosynthesis of Si isotopes in the He/C zone shows several similarities compared to the 25T models with analogous H fuel. Also at these explosion energies the different Si production triggered in 25av-H with respect to 25av-H5 is visible, confirming that the result mostly depend on the H concentration.
In the bottom right Panel, the 25d models predict similar high Si -values in the He/C zone, with close to solar ratios in the intermediate and upper mass region. Only 25d-H shows a negative (29Si/28Si) combined with the positive (30Si/28Si) in the deepest part of the He/C zone, as discussed in models 25T and 25av.
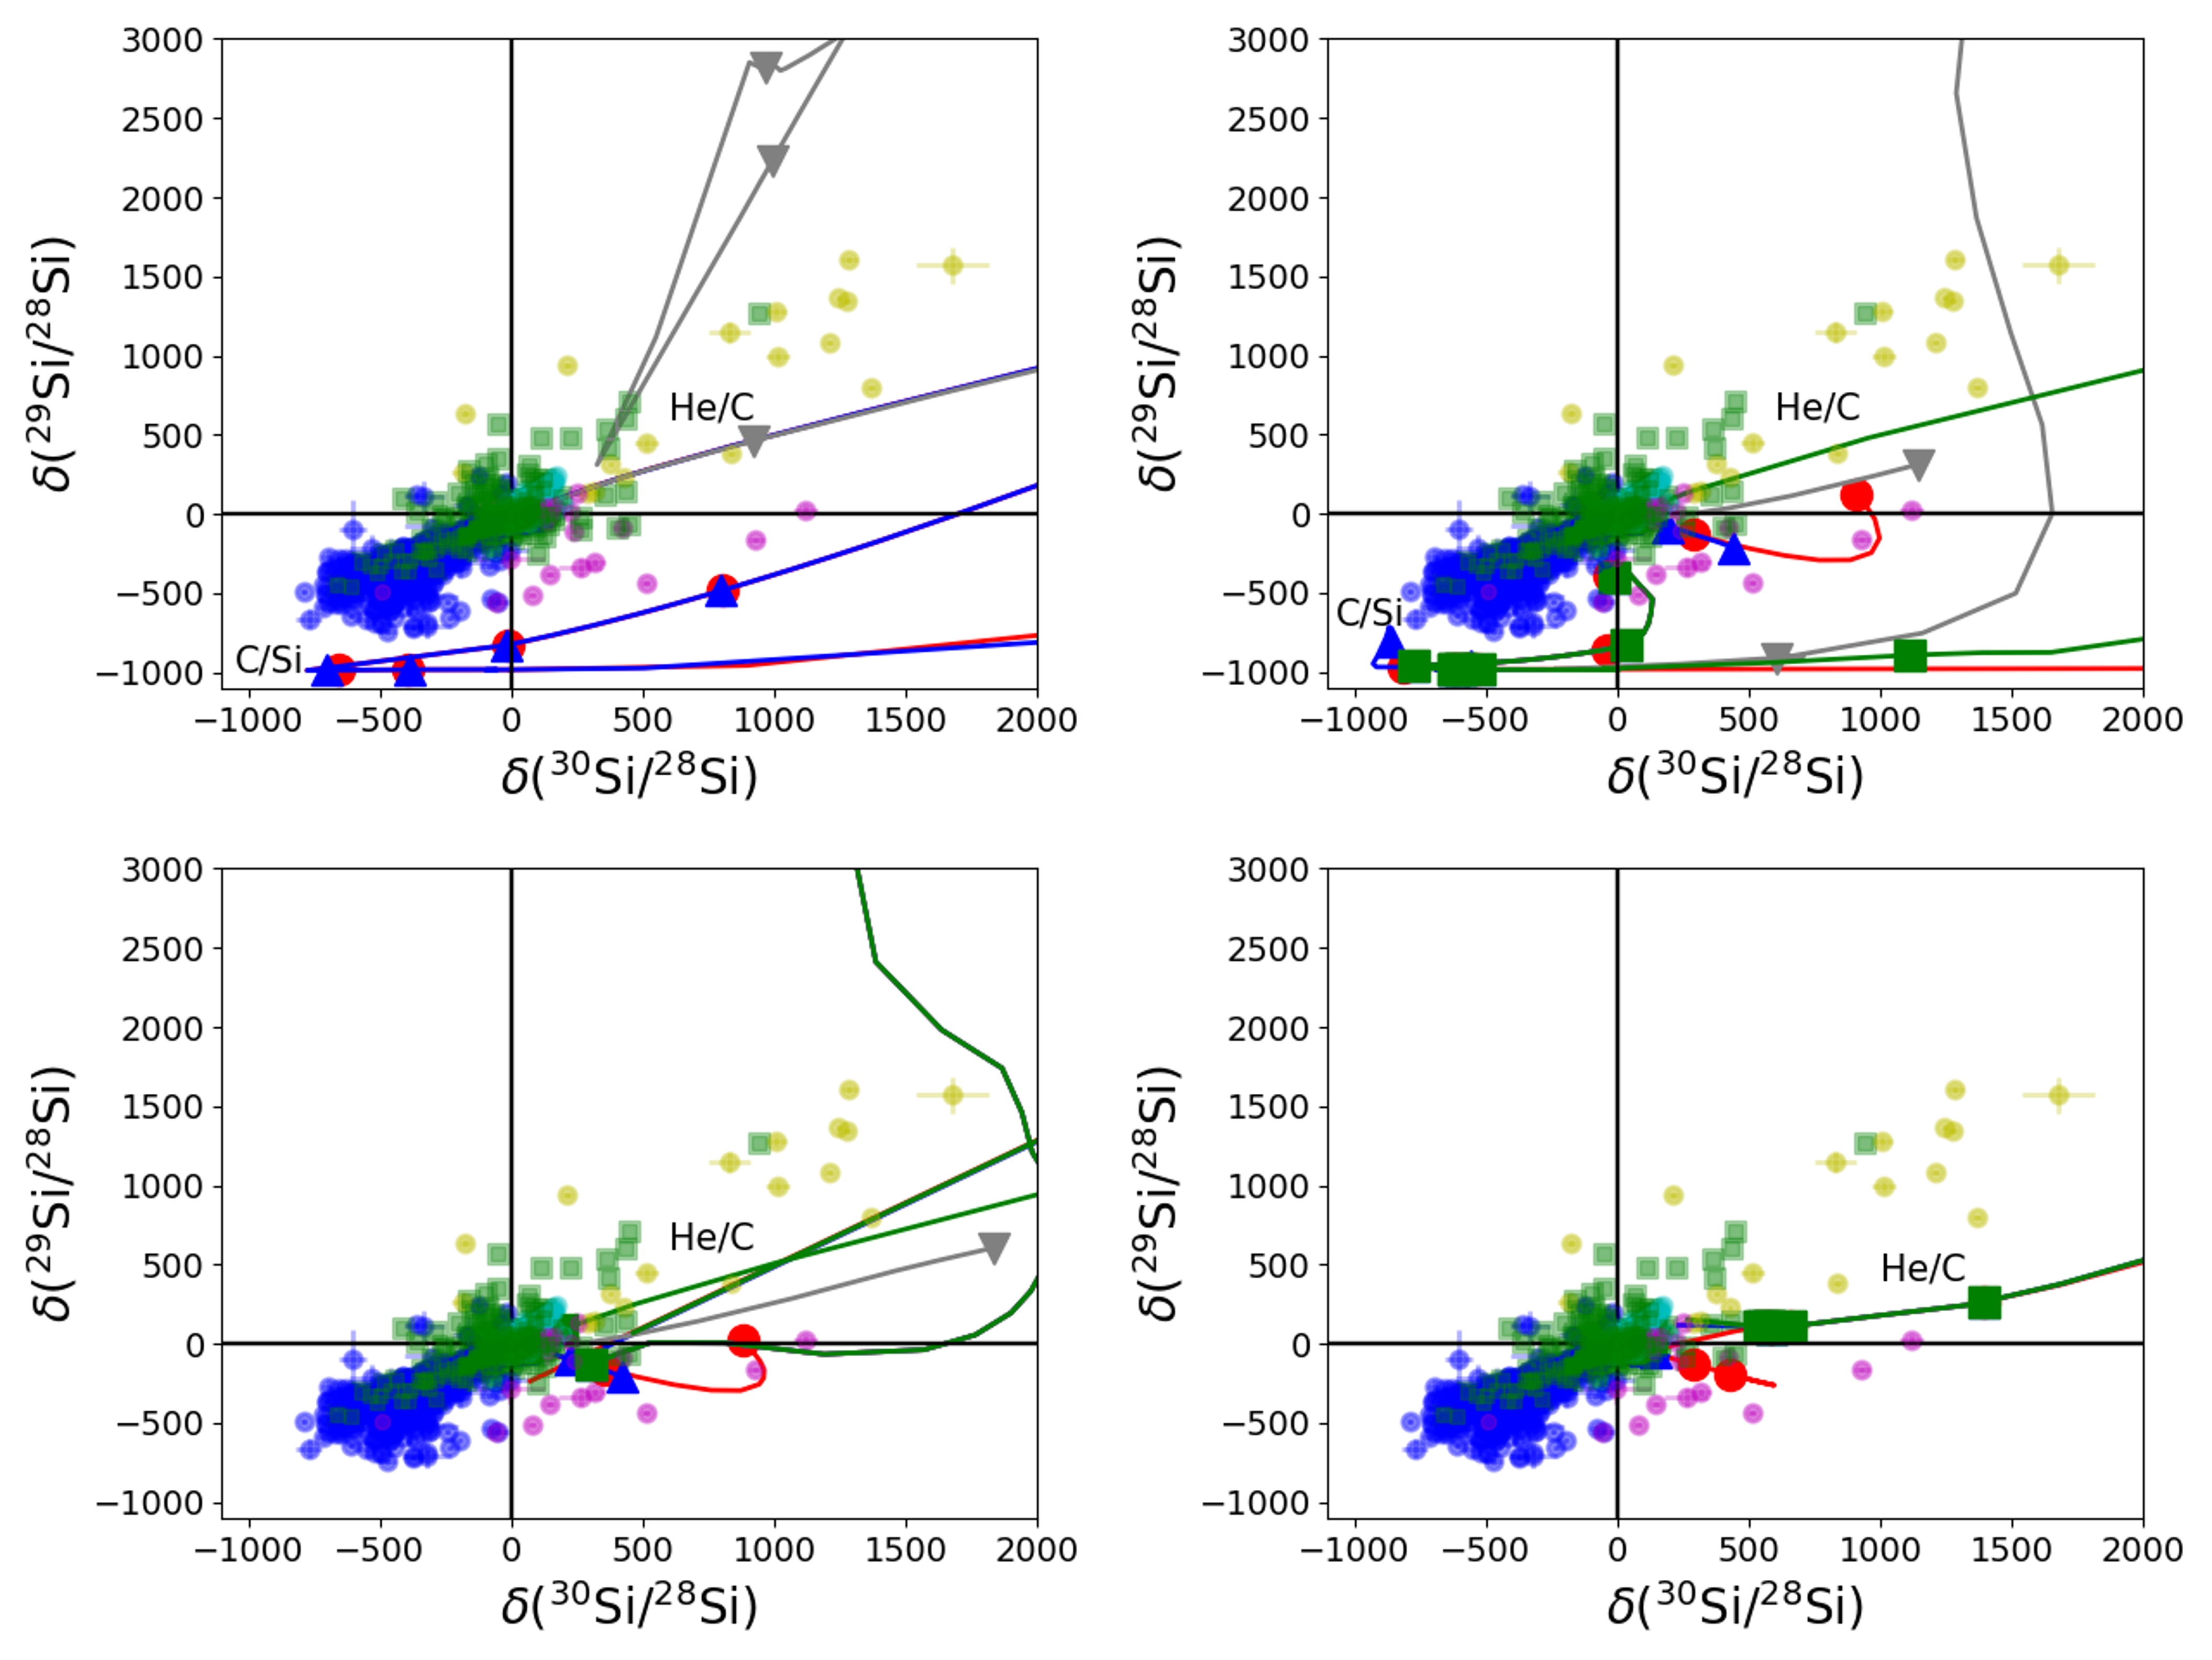
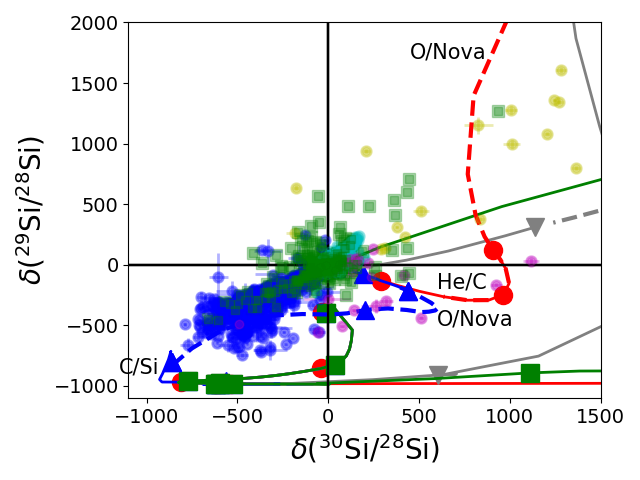
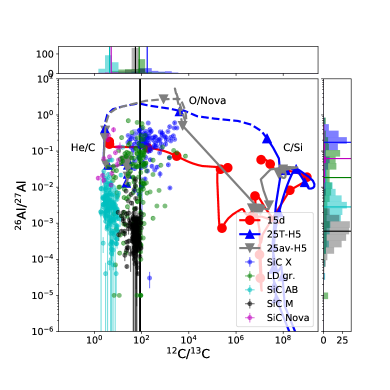
Figure 7 presents the 12C/13C and 26Al/27Al isotopic ratios for CCSN abundance simulations and grains. Compared to Figure 4, the full range of 12C/13C ratio obtained in the CCSN ejecta is shown. In the top left Panel, models with different explosion energies but no H ingestion do not reach the 26Al enrichment needed to reproduce the full range of grains observations, as already discussed in Pignatari et al. (2013a) and Pignatari et al. (2015). The comparison shown in the top right Panel has been already discussed by Pignatari et al. (2015) and we report them here for completeness. In particular, 12C/13C shows a variation up to 11 orders of magnitude, with the highest ratios obtained in the C/Si zone on the right of the plot, to the lowest sub-solar ratios obtained at the intersection between the O/Nova zone and the He/C zone. The C-rich regions are plotted as solid lines whereas the O/nova zone is plotted as dashed lines. Based on preliminary calculations, we can anticipate that it is possible to reproduce the grains with highest 26Al/27Al ratios through mixing of the He/C, O/nova, and C/Si zones of models 25T-H and 25T-H5. This is obtained even with the model 25T-H10 (not shown in the figure), considering mixtures of matter predominantly from the O/Nova zone with small contributions of matter from the C-rich zones below and above (Hoppe et al., 2022, submitted).
The bottom left Panel shows that the same high 26Al production during the CCSN explosion noted in the top right Panel can also be obtained in models at lower energy (25av), keeping the same H-ingestion parameterisation. In this case, the H left at the CCSN shock passage is controlling the 26Al production. As with 25T-H5 compared to the other 25T models, 25av-H5 is the model showing the largest 26Al/27Al ratio in the O/Nova zone, over the full range of measured C ratios. This is an interesting result. First, we would naively expect the 26Al enrichment due to explosive H-burning to increase with the amount of H left in the He shell. This is not the case for the 25T and the 25av stellar sets. Both 26Al and 27Al are made during the explosion in the O/Nova zone. Above a certain H abundance, 27Al is produced more efficiently than 26Al and the relative ratio decreases. In Pignatari et al. (2015), we have seen that model 25T-H10 (see Table 2) shows similar 26Al/27Al ratios in the O/Nova zone compared to 25T-H. A maximum value of 26Al/27Al is reached with H left between about 1% and 1 per mill. More models would be needed to identify what is the amount of H yielding the largest 26Al/27Al ratio, that could be higher than the abundances of 25T-H5. With the present models, the same conclusions can be derived for the 25av set at lower SN energies. By taking into account the measured scatter for C, N, Al and Si abundances in presolar grains (see also Figures 4, 5 and 6), models 25T-H5 and 25av-H5 seem to provide the required conditions to match the typical H-burning signatures identified, and higher H concentrations do not help or make even worse the comparison with observations.
Finally, in the bottom right Panel the CCSN abundances ejected from model 25d cannot explain the highest 26Al/27Al ratios observed. The temperatures reached in the He shell in these models during the SN shock passage are not high enough to efficiently make 26Al. The pre-SN 26Al abundance made during the H ingestion in our models is more than an order of magnitude too low compared to the presolar grains measurements of 26Al-rich SiC-X and graphites. Beyond the scope of this paper, it would be useful to produce in the future one or two additional sets of CCSN simulations where the impact of the SN explosion energy is explored between 25d and 25av settings (see § 2).
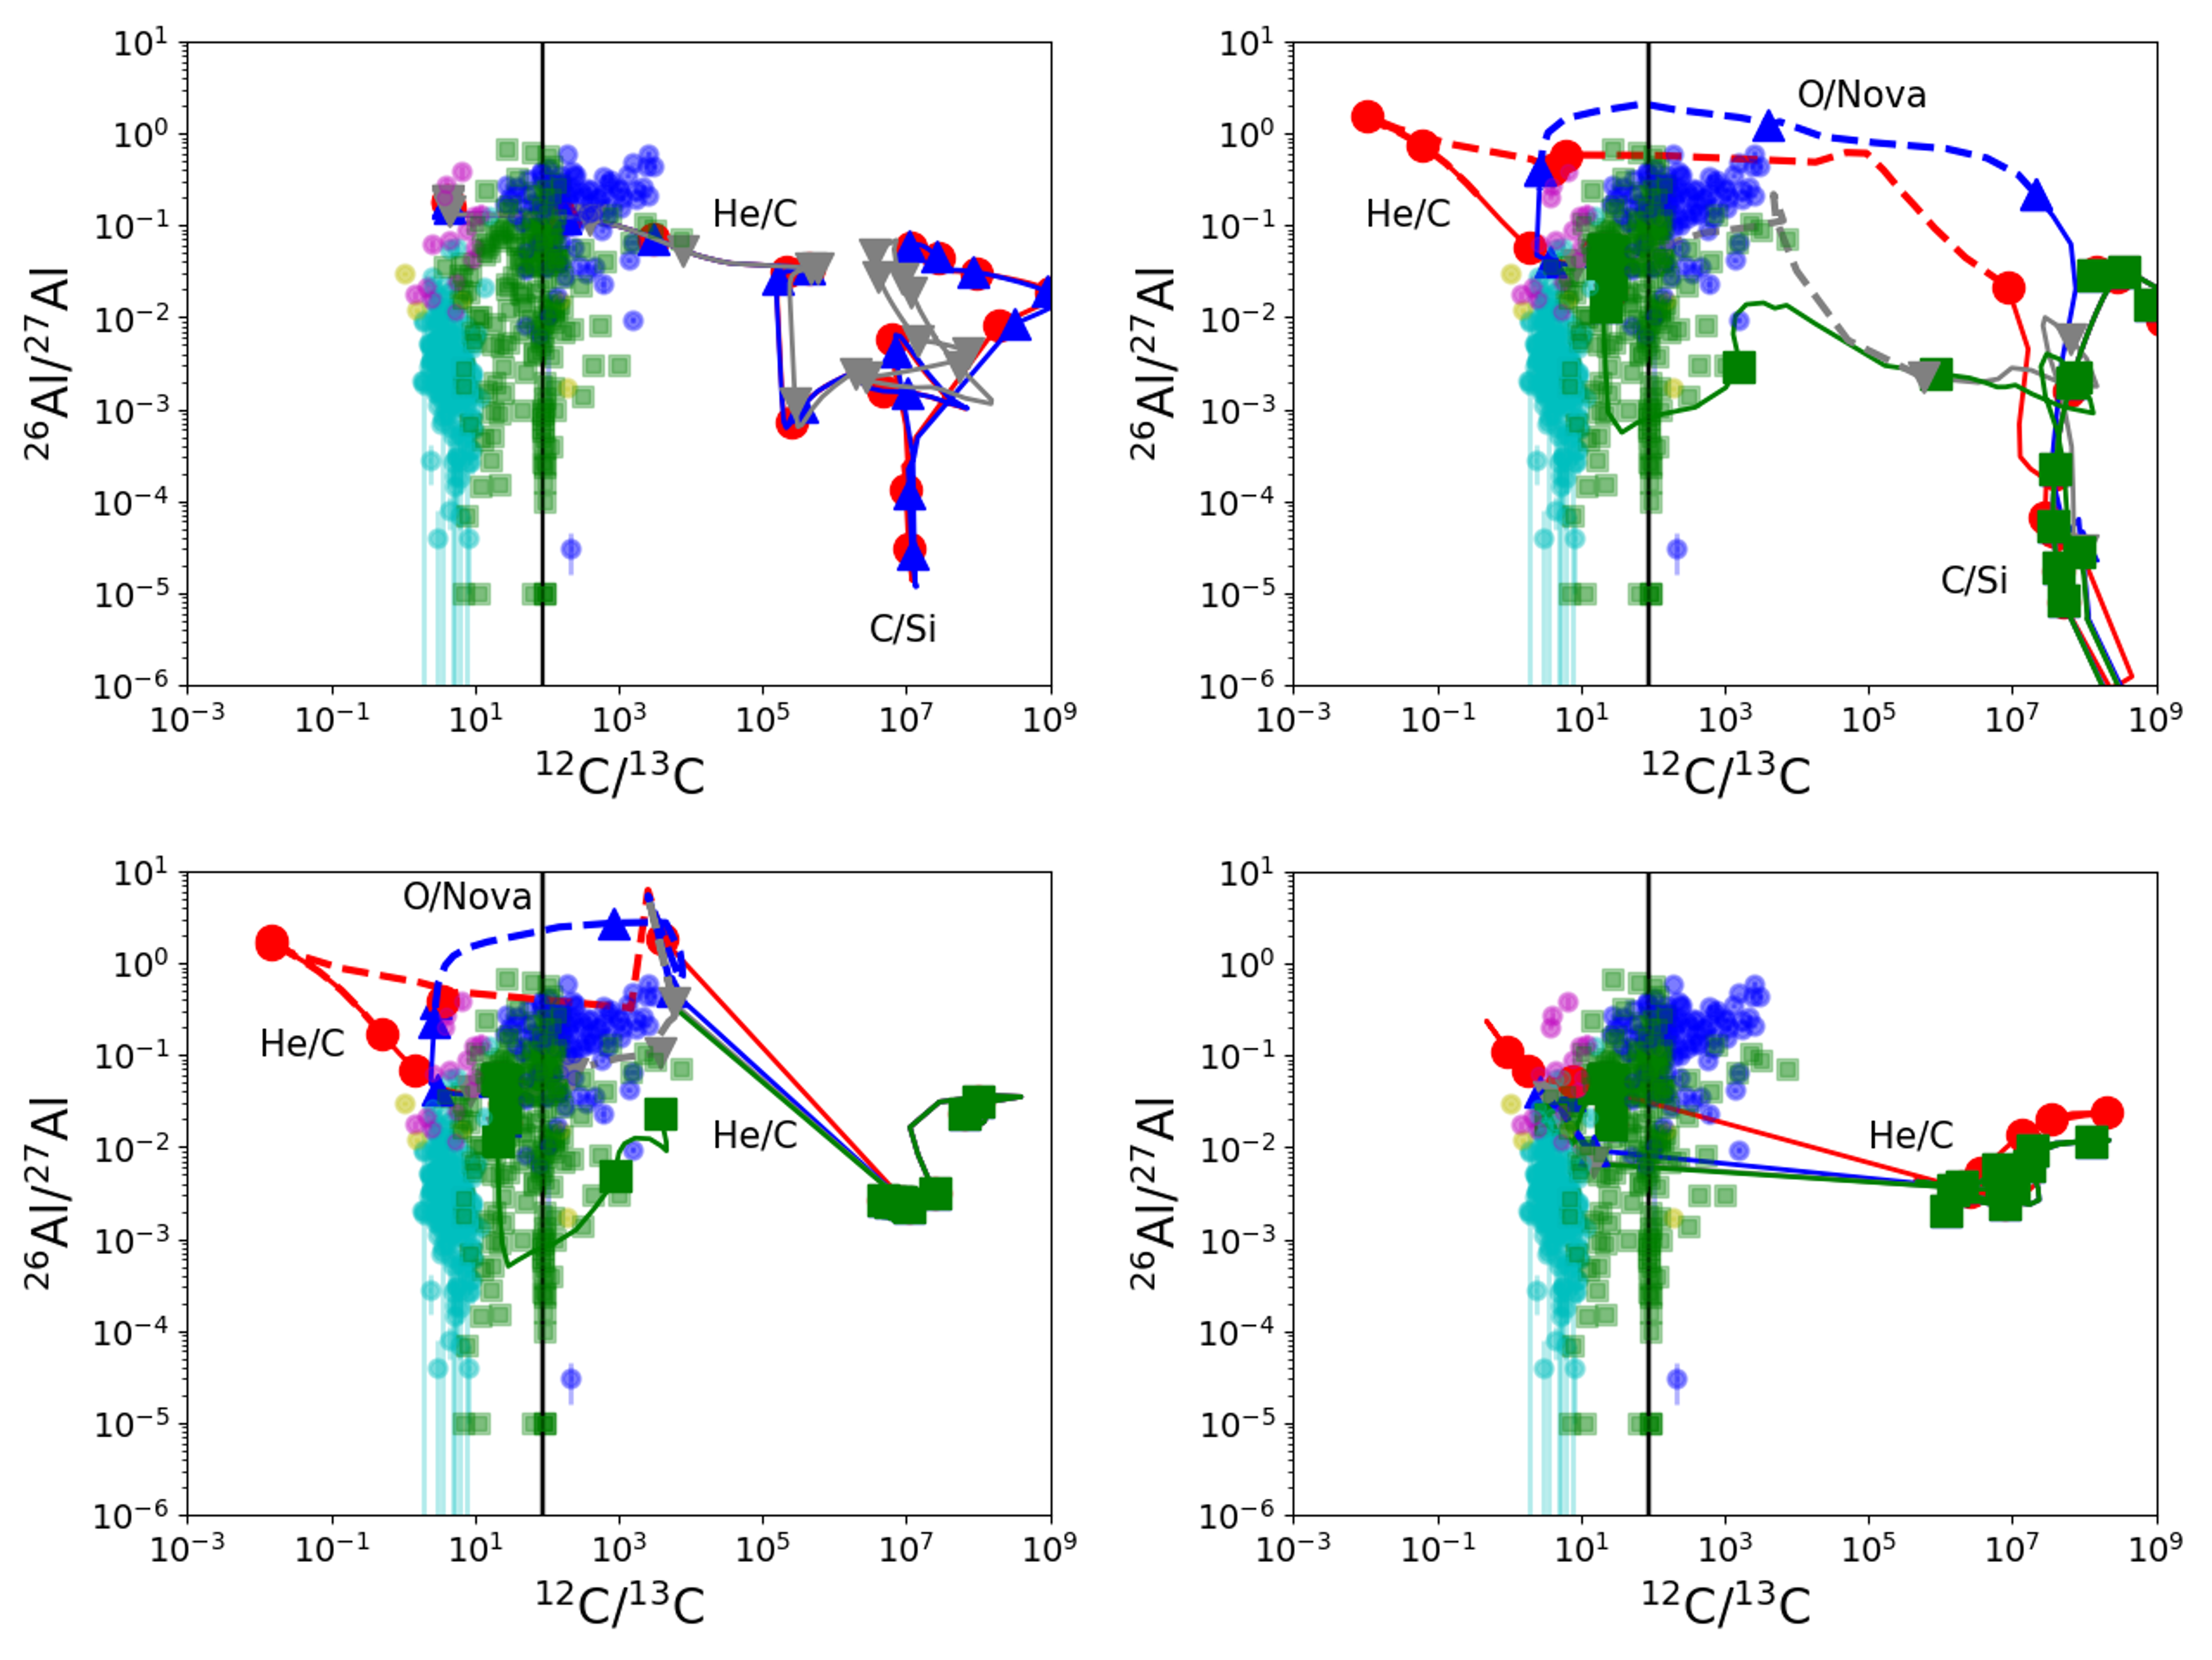
Figure 8 shows the 44Ti/48Ti and (30Si/28Si) isotopic ratios for presolar grains and the four model sets. It is worth taking into consideration here that 48Ti and 48Ca are indistinguishable when measuring isotopic abundances in grains. However, 48Ca condenses much less efficiently into SiC than 48Ti (Lodders & Fegley, 1995). The fractionation used for 48Ca/48Ti is 0.0001, i.e. only 1 Ca atom condenses for every 10000 Ti atoms. In the Figure, therefore, the abundance of 48Ti also takes into account the contribution of 48Ca after fractionation. The same fractionation is applied for 44Ca and the radioactive isotope 44Ti. As shown for 15d, 15r2, and 25T models in the top Panels, 28Si-rich material coincides with high 44Ti in the C/Si zone as they are both products of the explosive -capture chain (Pignatari et al., 2013a). In the central layers of the C/Si zone these models achieve high values of 44Ti/48Ti, above the plotted area: the maximum ratios obtained are 3.78 and 2.97 for 15d and 15r2 respectively, and 29.9, 26.2, 26.1, and 26.1 for 25T-H, 25T-H5, 25T-H20, and 25T-H500 respectively (beyond the plot range). In particular for the 25T models, a large range of 44Ti/48Ti is obtained in the C/Si zone, from no 44Ti to the high values mentioned above. As discussed in Pignatari et al. (2013a), this variation of 44Ti production is a natural outcome of the -capture chain of reactions triggered by the explosive He-burning, where 44Ti is at the end of the production chain and requires high temperatures and -capture efficiency to be made. The milder 44Ti/48Ti ratios observed in some 28Si-deficient graphites grains and SiC-C grains can be also reproduced in the top left Panel, but not in the top right. Instead, 15r4 (top left Panel), 25av (bottom left Panel), and 25d models (bottom right Panel) are not energetic enough to form the C/Si zone with 28Si and 44Ti during the CCSN explosion. All of the models shown develop extremely high (30Si/28Si) in the He/C as the curve continues far past the right edge of the plot.
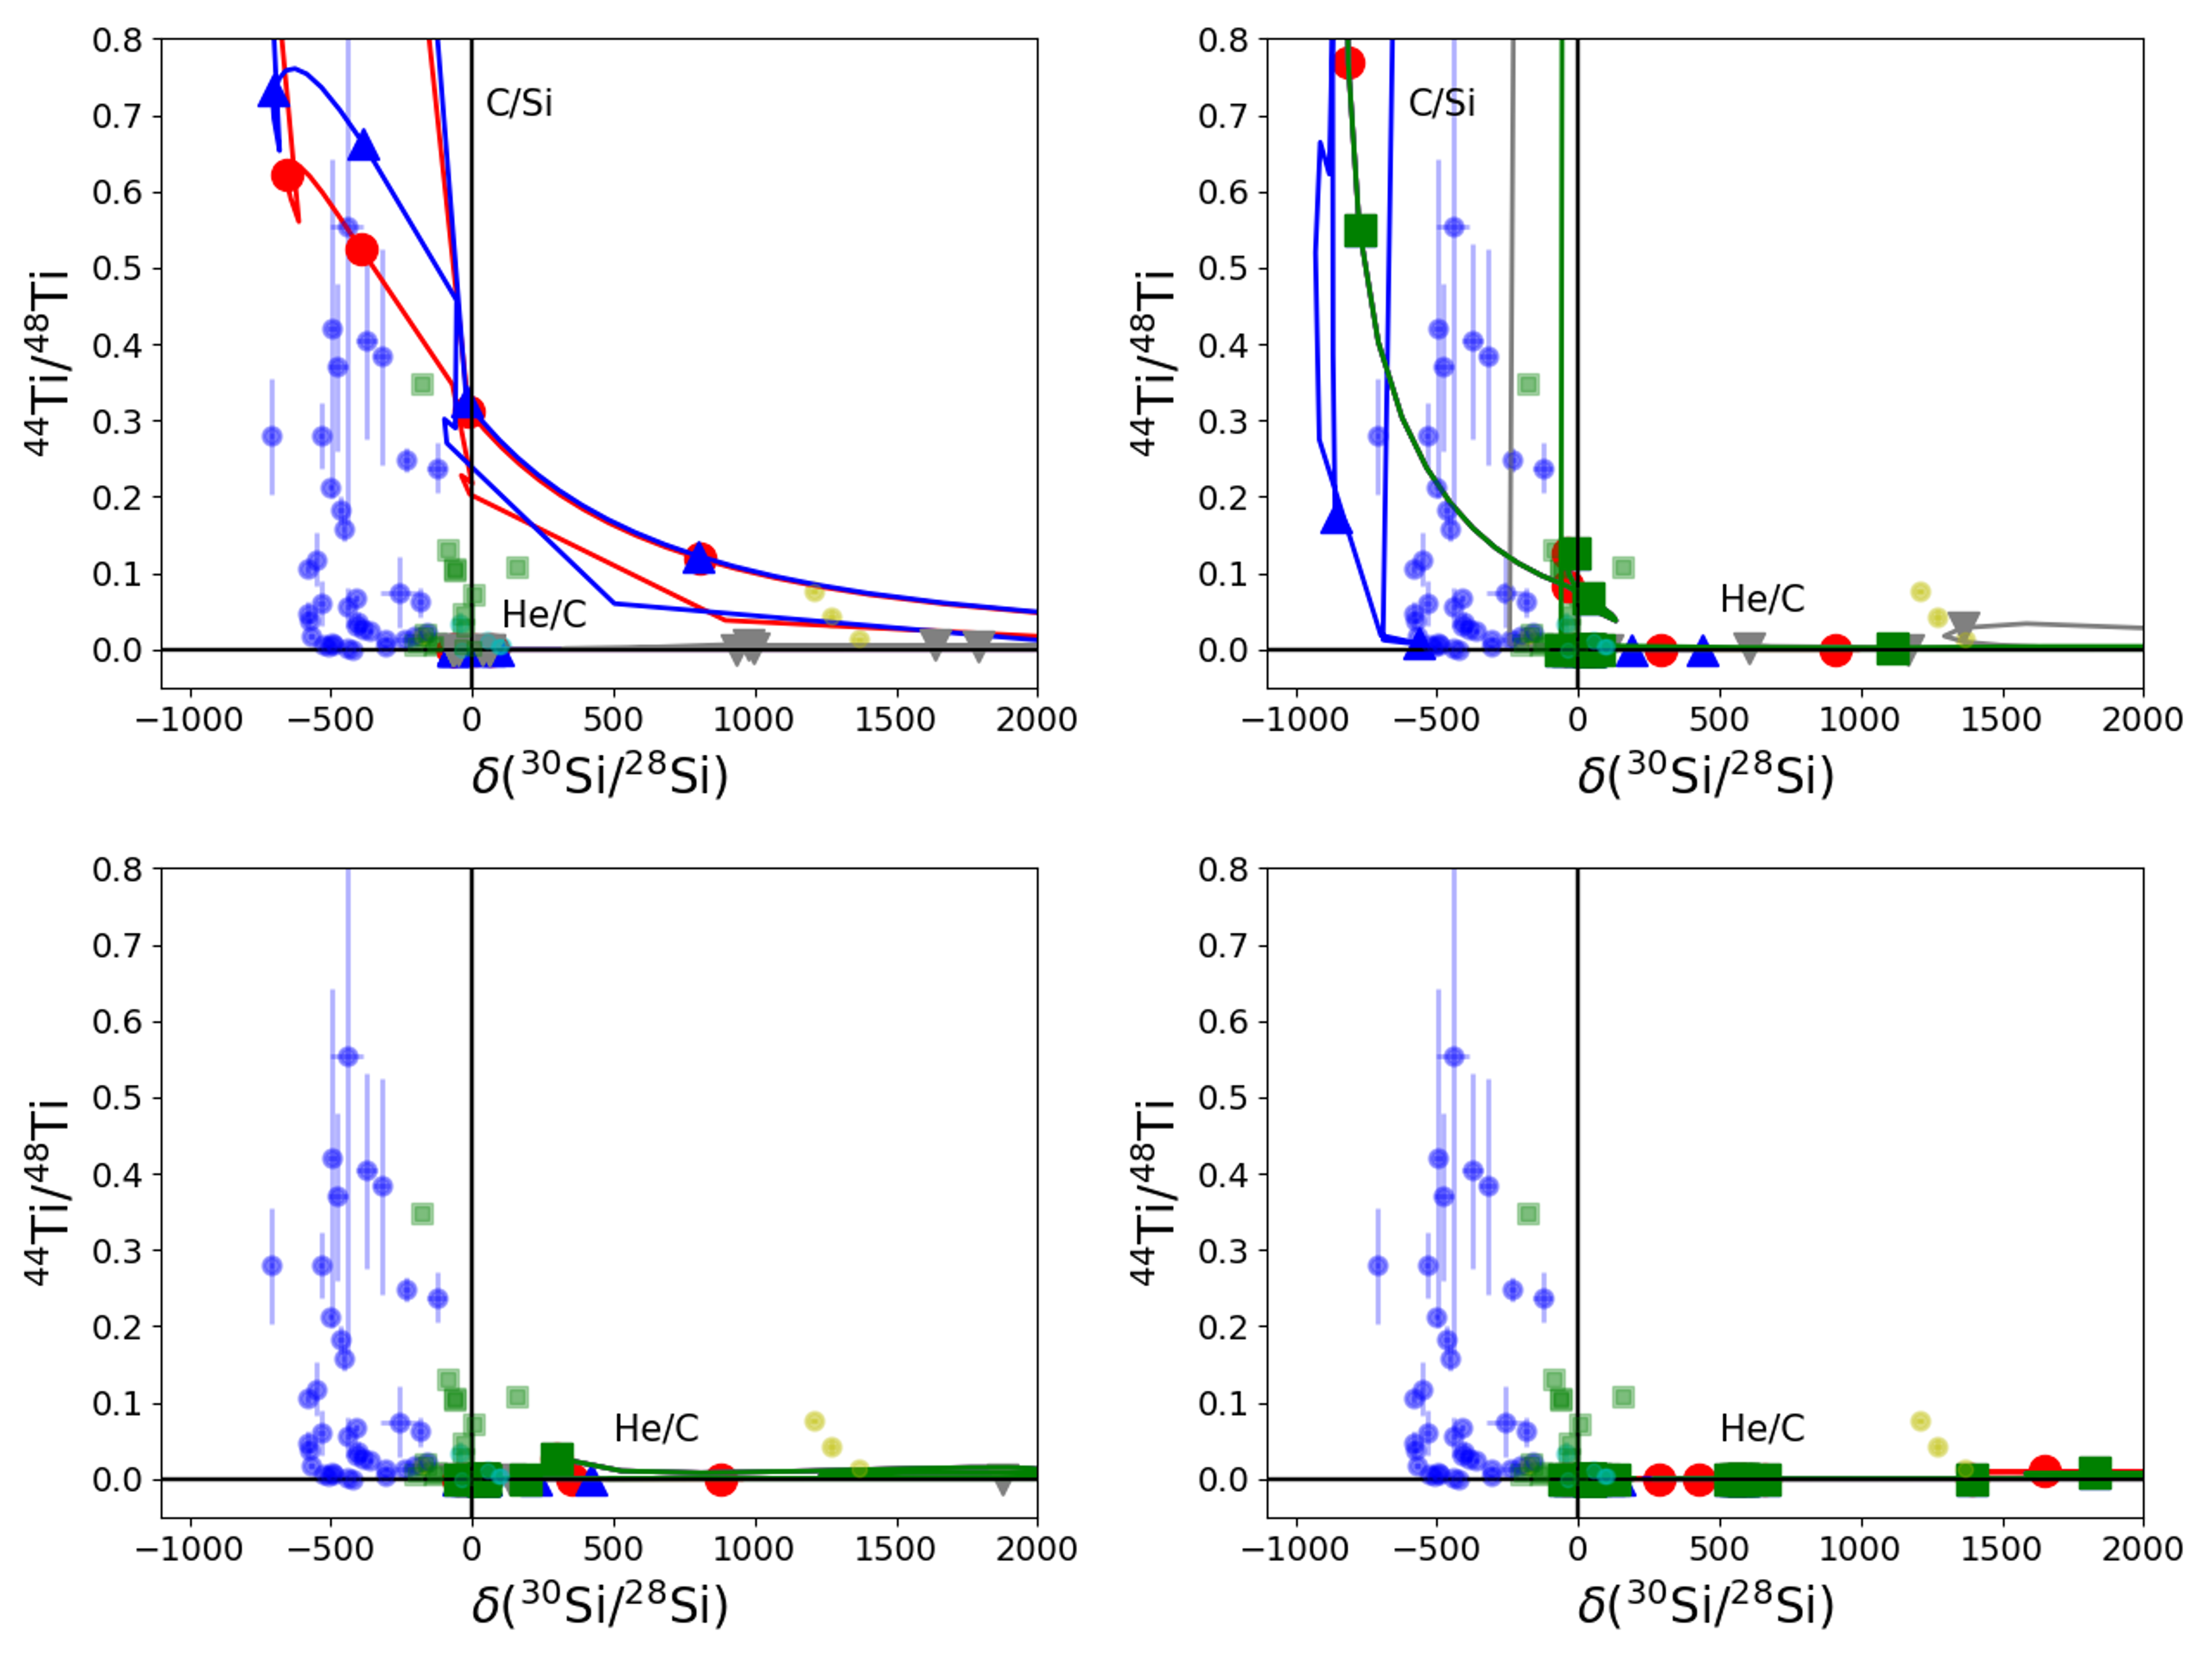
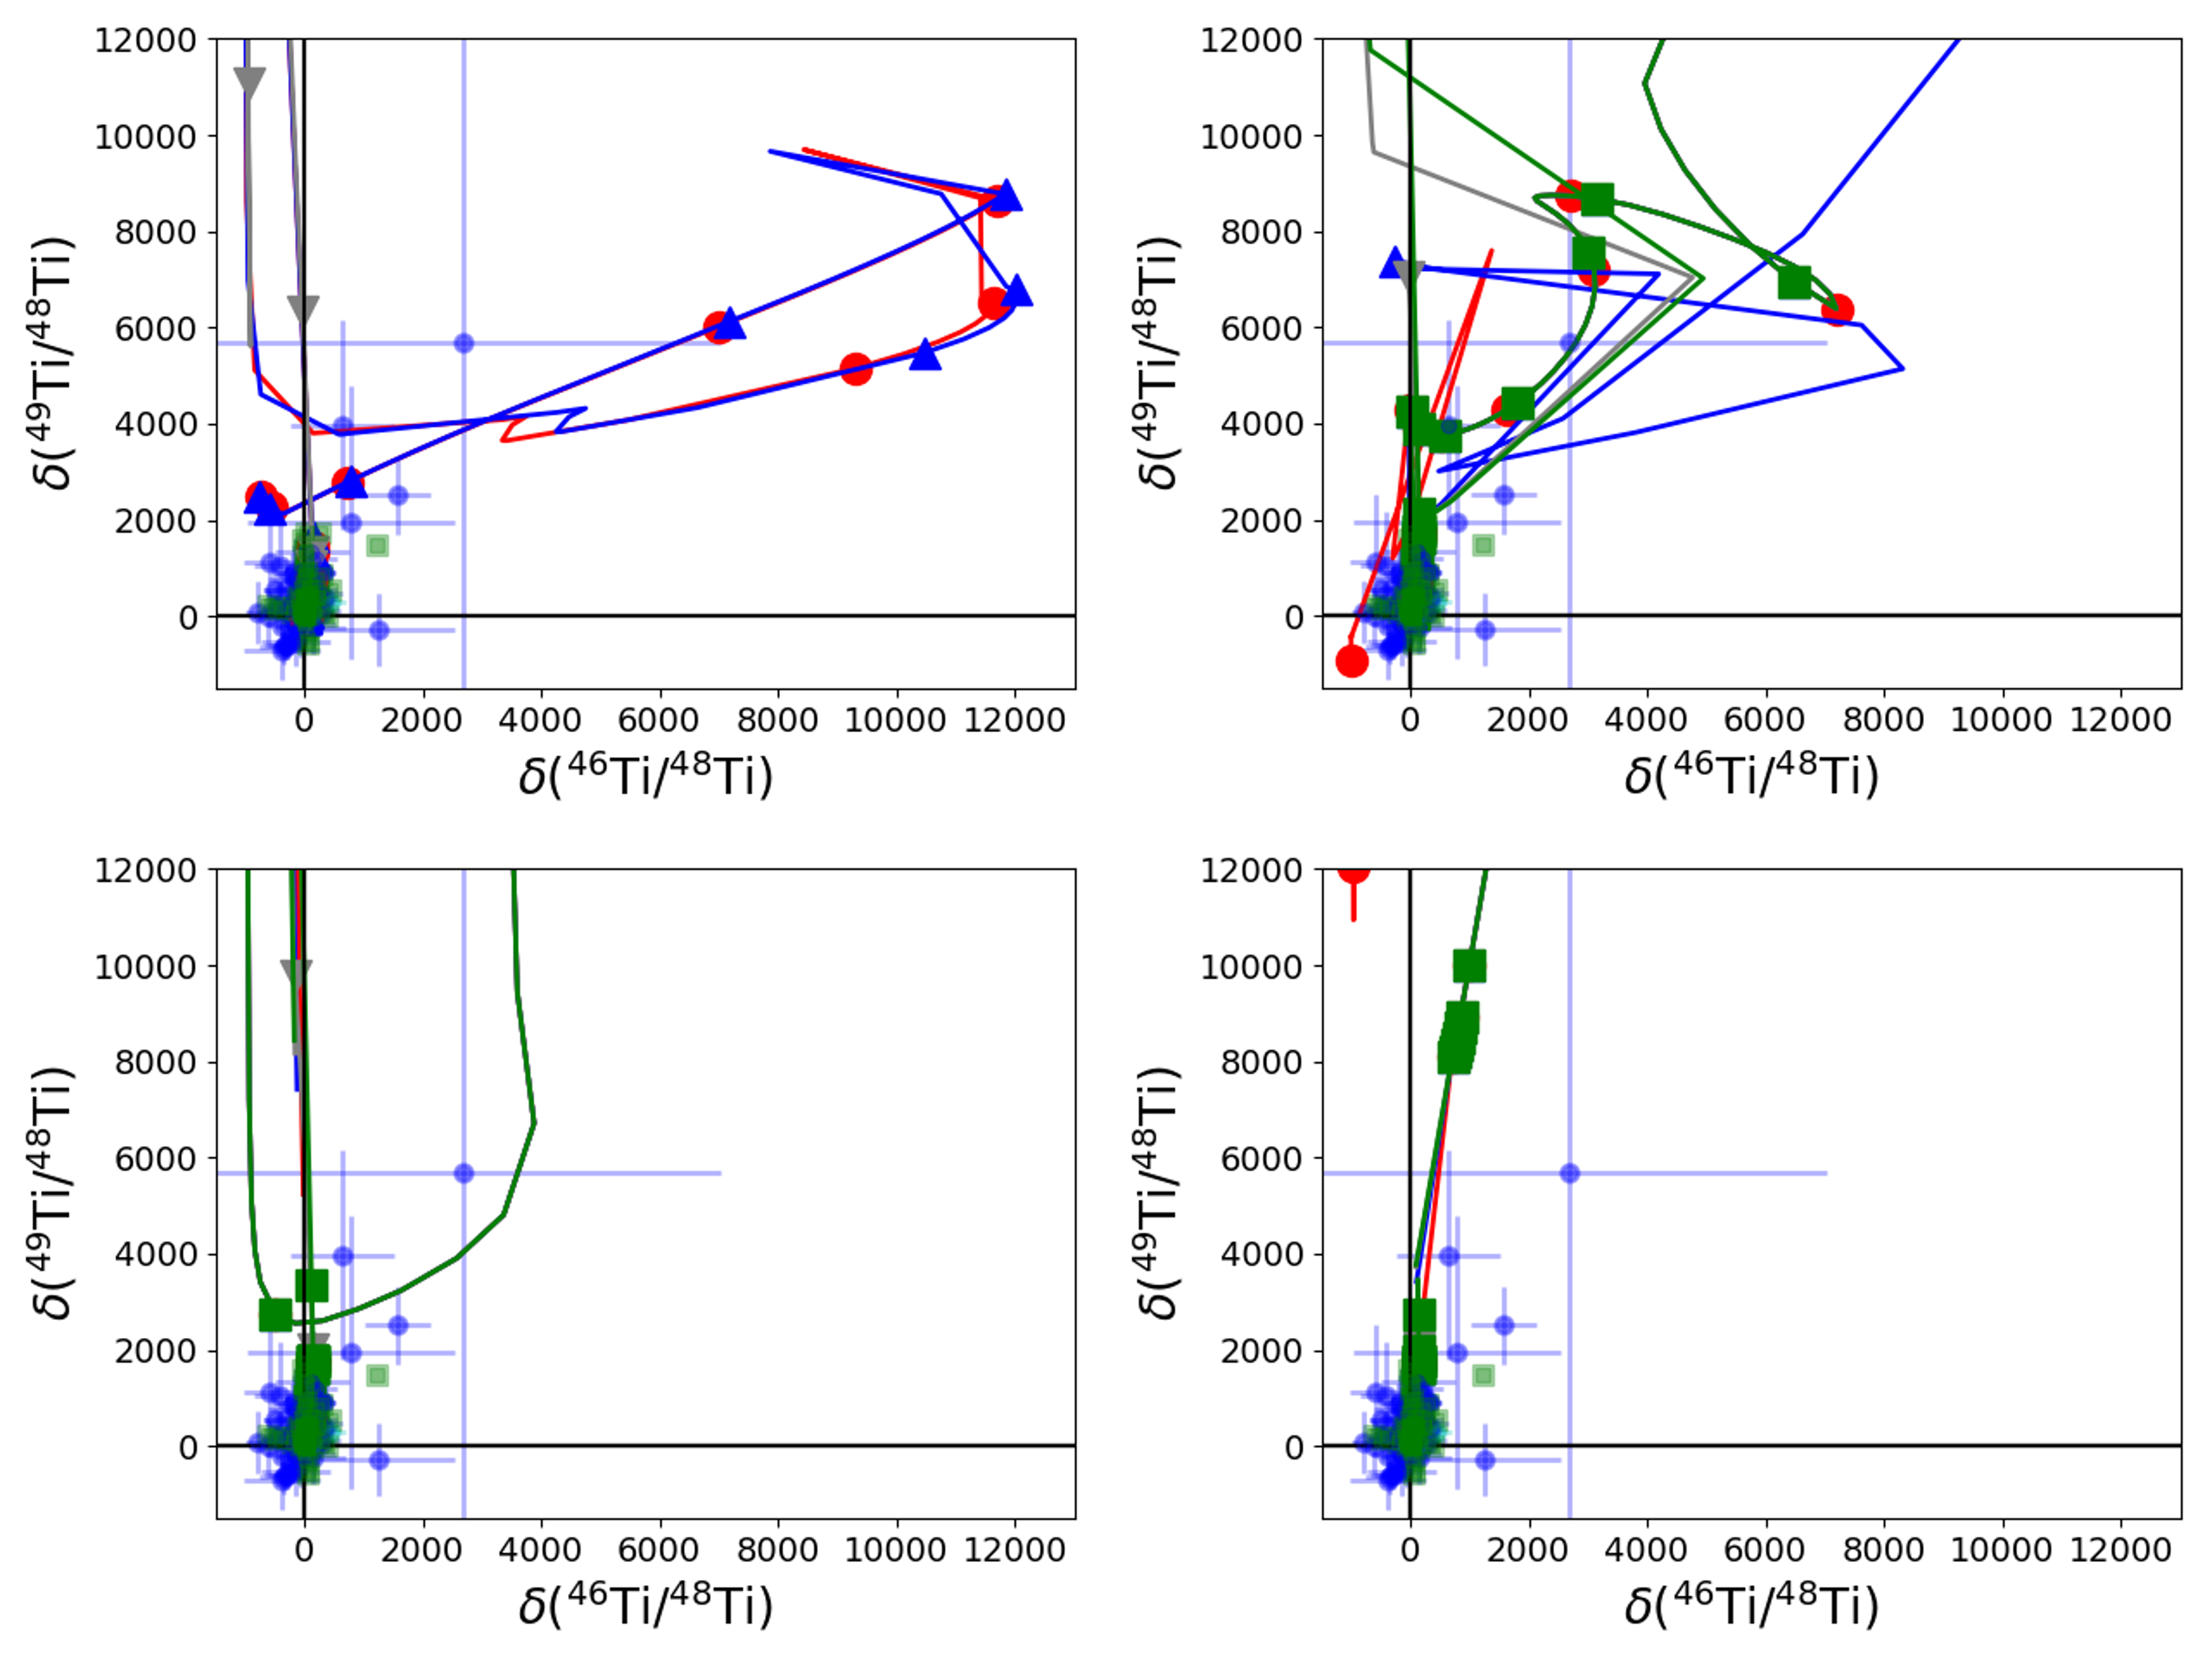
Figure 9 shows the 49Ti/48Ti and 46Ti/48Ti ratios for our models compared to presolar grains. The isotope 49V is a radioactive parent of 49Ti, with a half-life of 330 days. This means that some 49V remains when the grains are condensing. Vanadium (in the form of VC0.88) and Ti (as TiC) are incorporated in ideal solid solution into SiC at the same 50% condensation temperature (Lodders & Fegley, 1995). Therefore, 49V can be expected to condense at a similar rate to 49Ti in SiC grains and graphites, and we do not apply any fractionation between V and Ti in Figure 9. Instead, the contributions from the stable isobars 46Ca and 48Ca to 46Ti and 48Ti respectively, are taken into account as in Figure 8. All of the CCSN stellar sets presented in Figure 9 show the capability to produce high 49Ti/48Ti ratios in the C-rich ejecta. In the top left Panel, for the C/Si zone 15d and 15r2 make 49Ti mostly as 49V. An additional 49Ti component is made in the He/C zone by neutron captures, directly as 49Ti or as radiogenic contribution from the neutron-rich radioactives 49Ca and 49Sc. Models in the top right Panel still have the 49V-rich component in the C/Si zone, but neutron captures in the He/C zone are suppressed in the models with most H left. However, in 25T-H and 25T-H5 the abundant pristine 48Ti is partially converted by direct proton captures to 49V in the O/Nova zone and at the bottom of the He/C zone during the CCSN explosion, generating also in these conditions a super-solar 49Ti/48Ti ratio (48Ti and 49Ti are respectively 73.72% and 5.41% of the solar Ti). The 25av models (bottom left Panel) and 25d models (bottom right Panel) also reproduce the observed scatter measured in presolar grains. Therefore, depending on the SN explosion energy and on the occurrence of H-ingestion, we can identify three components yielding super-solar 49Ti/48Ti ratio: a 49V-rich one in the C/Si zone due to explosive He burning, a (possibly) 49V-rich one in the O/Nova zone (and in the deepest He/C zone layers) due to proton-captures and, if no significant amount of H is present at the onset of the SN explosion, the 49Ti-rich neutron-capture component in the He/C zone. The neutron-burst in the He/C zone is suppressed in one-dimensional CCSNe models developing the O/Nova zone (Pignatari et al., 2015). Therefore, if we do not consider the mild pre-SN s-process signature in the He shell, the proton-capture and the neutron-capture components discussed above could be alternative results of local explosive nucleosynthesis. However, the multi-dimensional dynamic nature of H ingestion could easily lead to asymmetries and local differences in the He shell which could make the two components complementary products of the same CCSN explosion. While there are several studies of H ingestion with multi-dimensional hydrodynamics simulations for low-mass stars (Stancliffe et al., 2011; Herwig et al., 2014b; Woodward et al., 2015b), at present the same extensive studies are not available for massive stars to better constrain the stellar progenitors (see e.g., Clarkson & Herwig, 2021). The present limitations of one-dimensional models used in this work need to be taken into account, and therefore we cannot derive strong constraints about the relative relevance of these difference components at the moment. Based on the same generation of models, Liu et al. (2018a) used the 49Ti signature to distinguish between the contribution of the C/Si and the Si/S zones to condense SiC-X grains. They argued that by invoking the Si/C zone as the main source of 28Si, the 49Ti from the He/C zone would be the dominant contributor to the 49Ti measured in grains, at odds with the data. Their analysis was based on considering the Ti/Si ratio of the Si/C zone, which is orders of magnitude lower than that of the He/C zone in CCSN models. Given what we have said above and taking into account the uncertainties involved, we do not think these conclusions can be driven yet just based on the Ti/Si ratio. In particular, while the abundance of C in the Si/S region is negligible, the abundances of both C and Si are higher by at least an order of magnitude in the C/Si zone compared to the He/C zone. In the stellar progenitor the He/C zone is only a partial He-burning region (the former convective He shell), and at the onset of the collapse still a lot of He fuel is left: 4He is the most abundant isotope in the He/C zone. The C/Si zone is located instead at the bottom of the former He shell, where hydrostatic He-burning was almost complete. This is the reason why C can be even an order of magnitude higher than in the He/C zone. Additionally, in this region explosive He-burning is destroying the pre-SN O to make Si and other elements, while C is not depleted because the 12C(,)16O rate is orders of magnitudes weaker than the 16O(,)20Ne reaction rate (Pignatari et al., 2013a). Therefore, independently from the Ti/Si ratio, the high enrichment in both C and Si is generating a qualitative expectation that ejecta from the C/Si zone will have a much higher formation efficiency of SiC grains compared to the He/C zone. Ti should then condense in these grains from consistent mixtures of C-rich and Si-rich stellar material. More detailed predictions for Ti chemistry in environments with different degrees of C and Si enrichment would require complete network calculations with chemical reactions, that are beyond the scope of this paper.
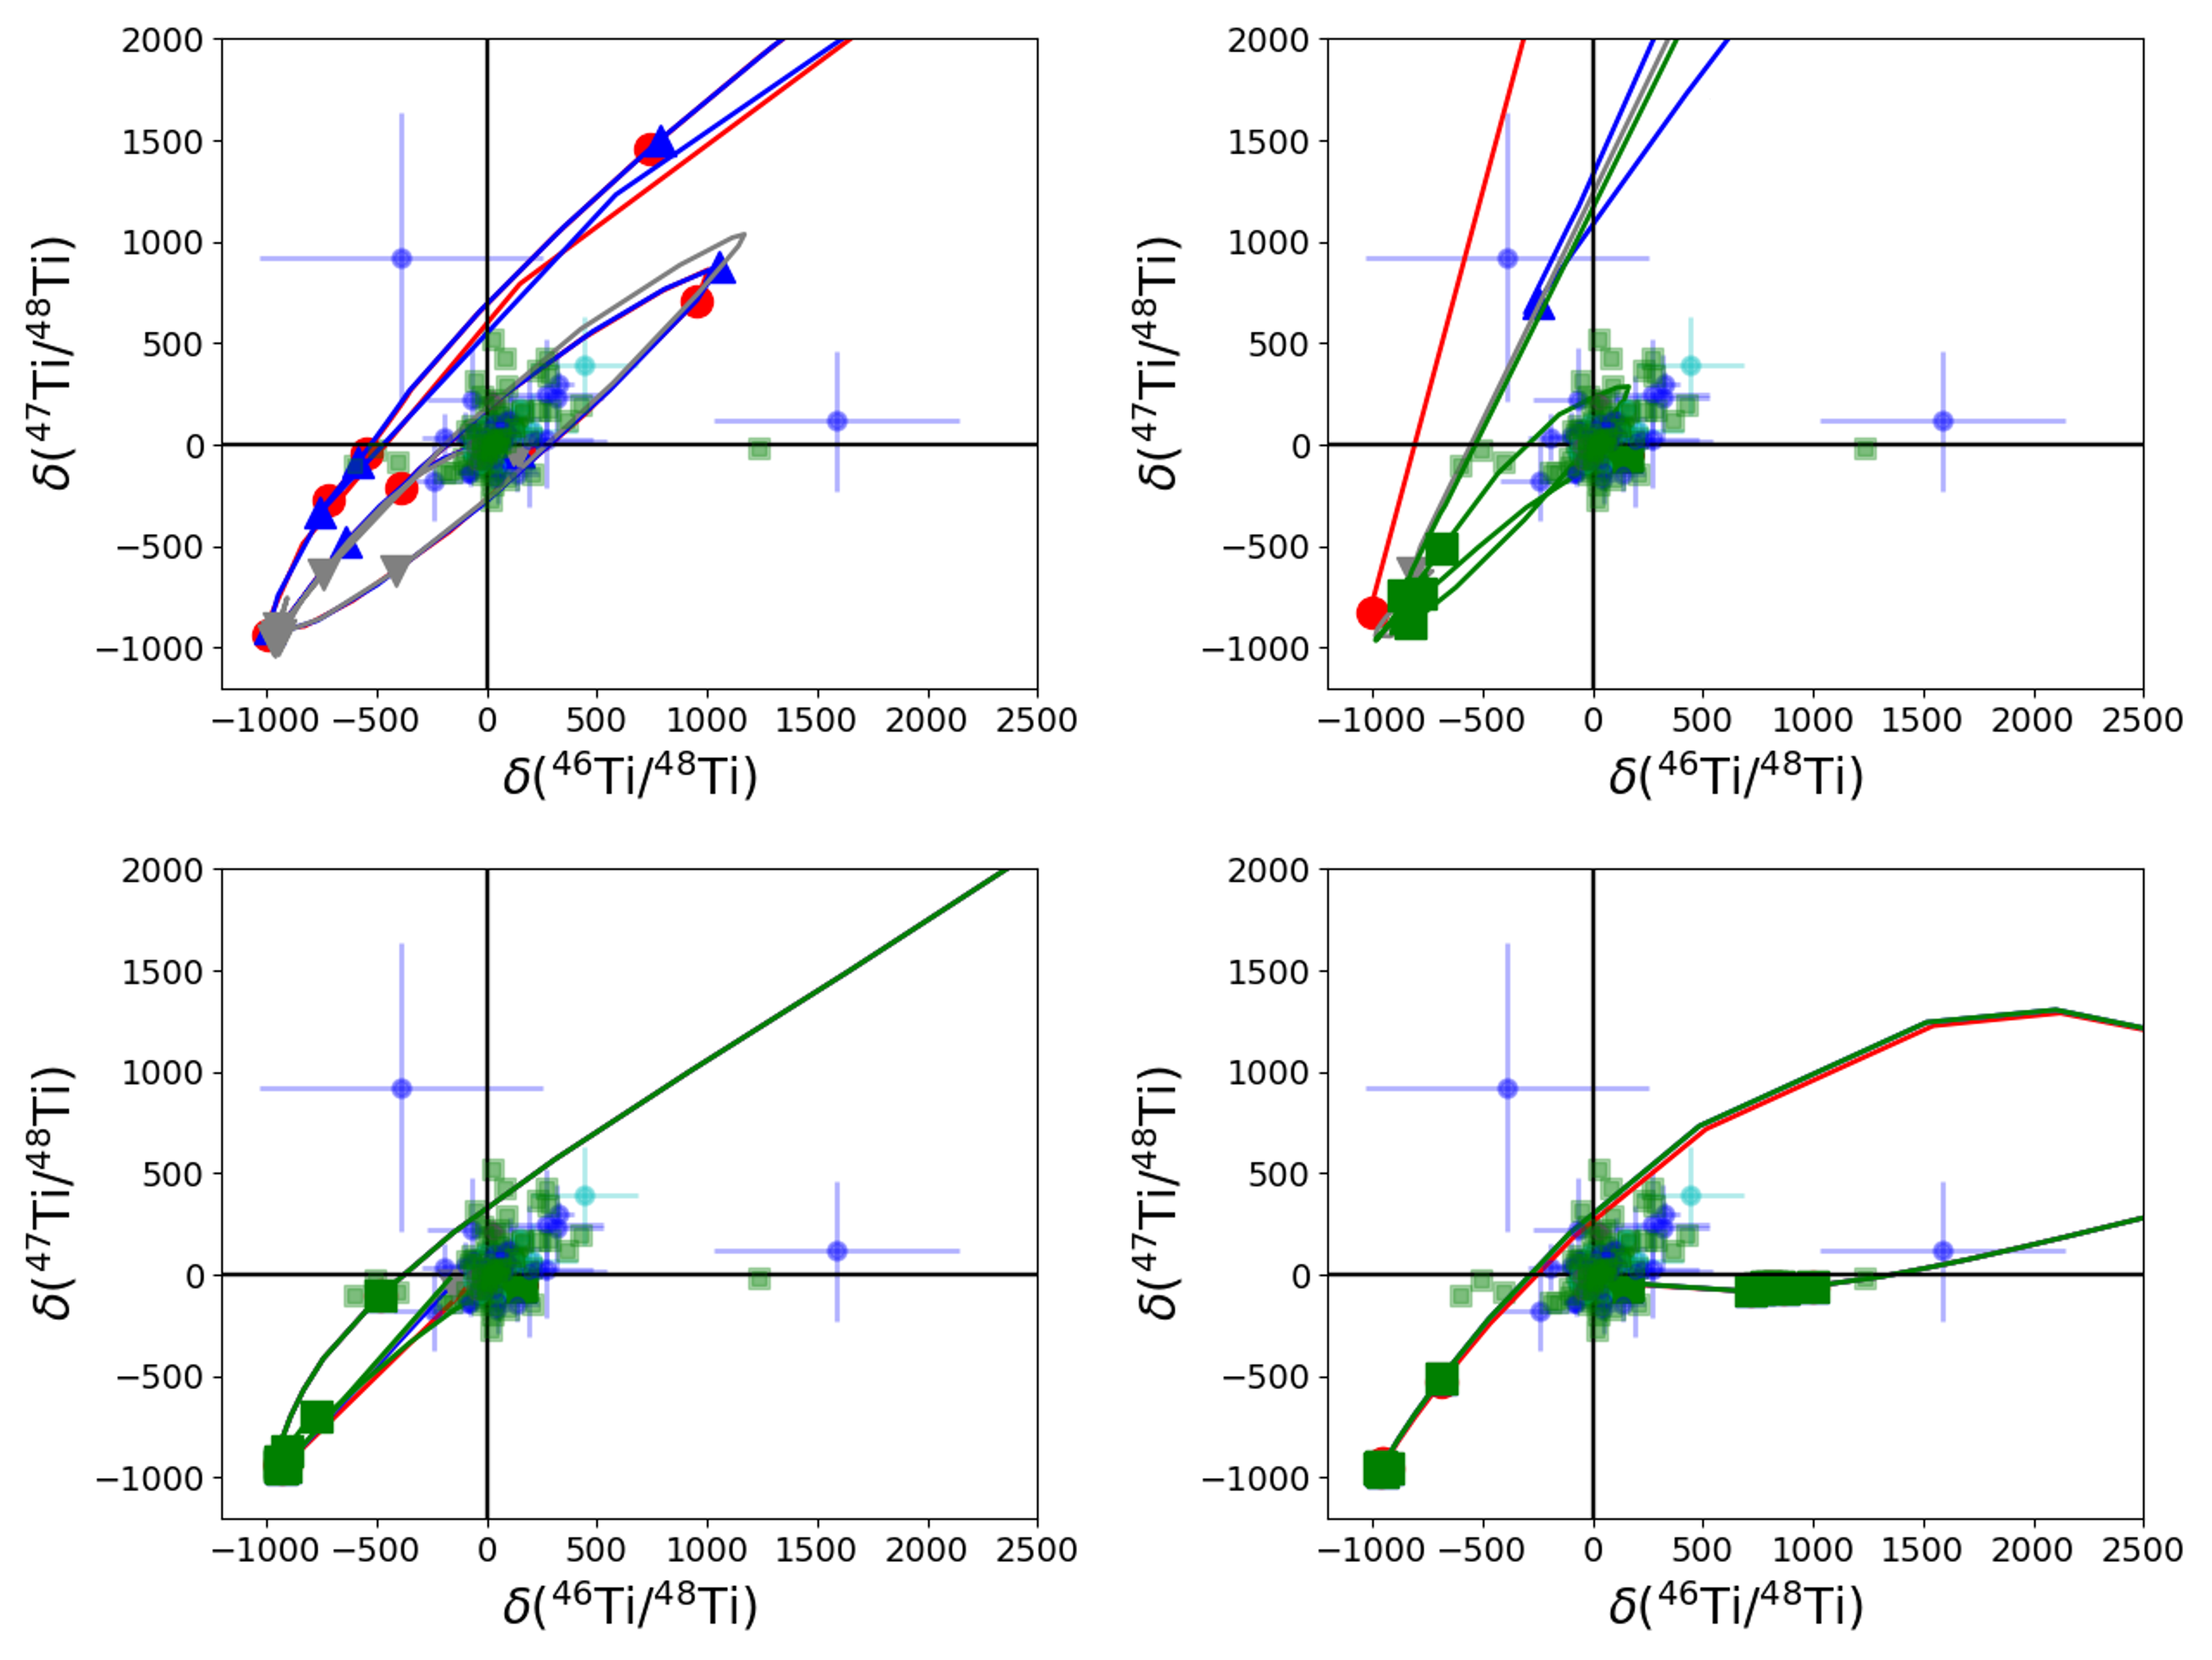
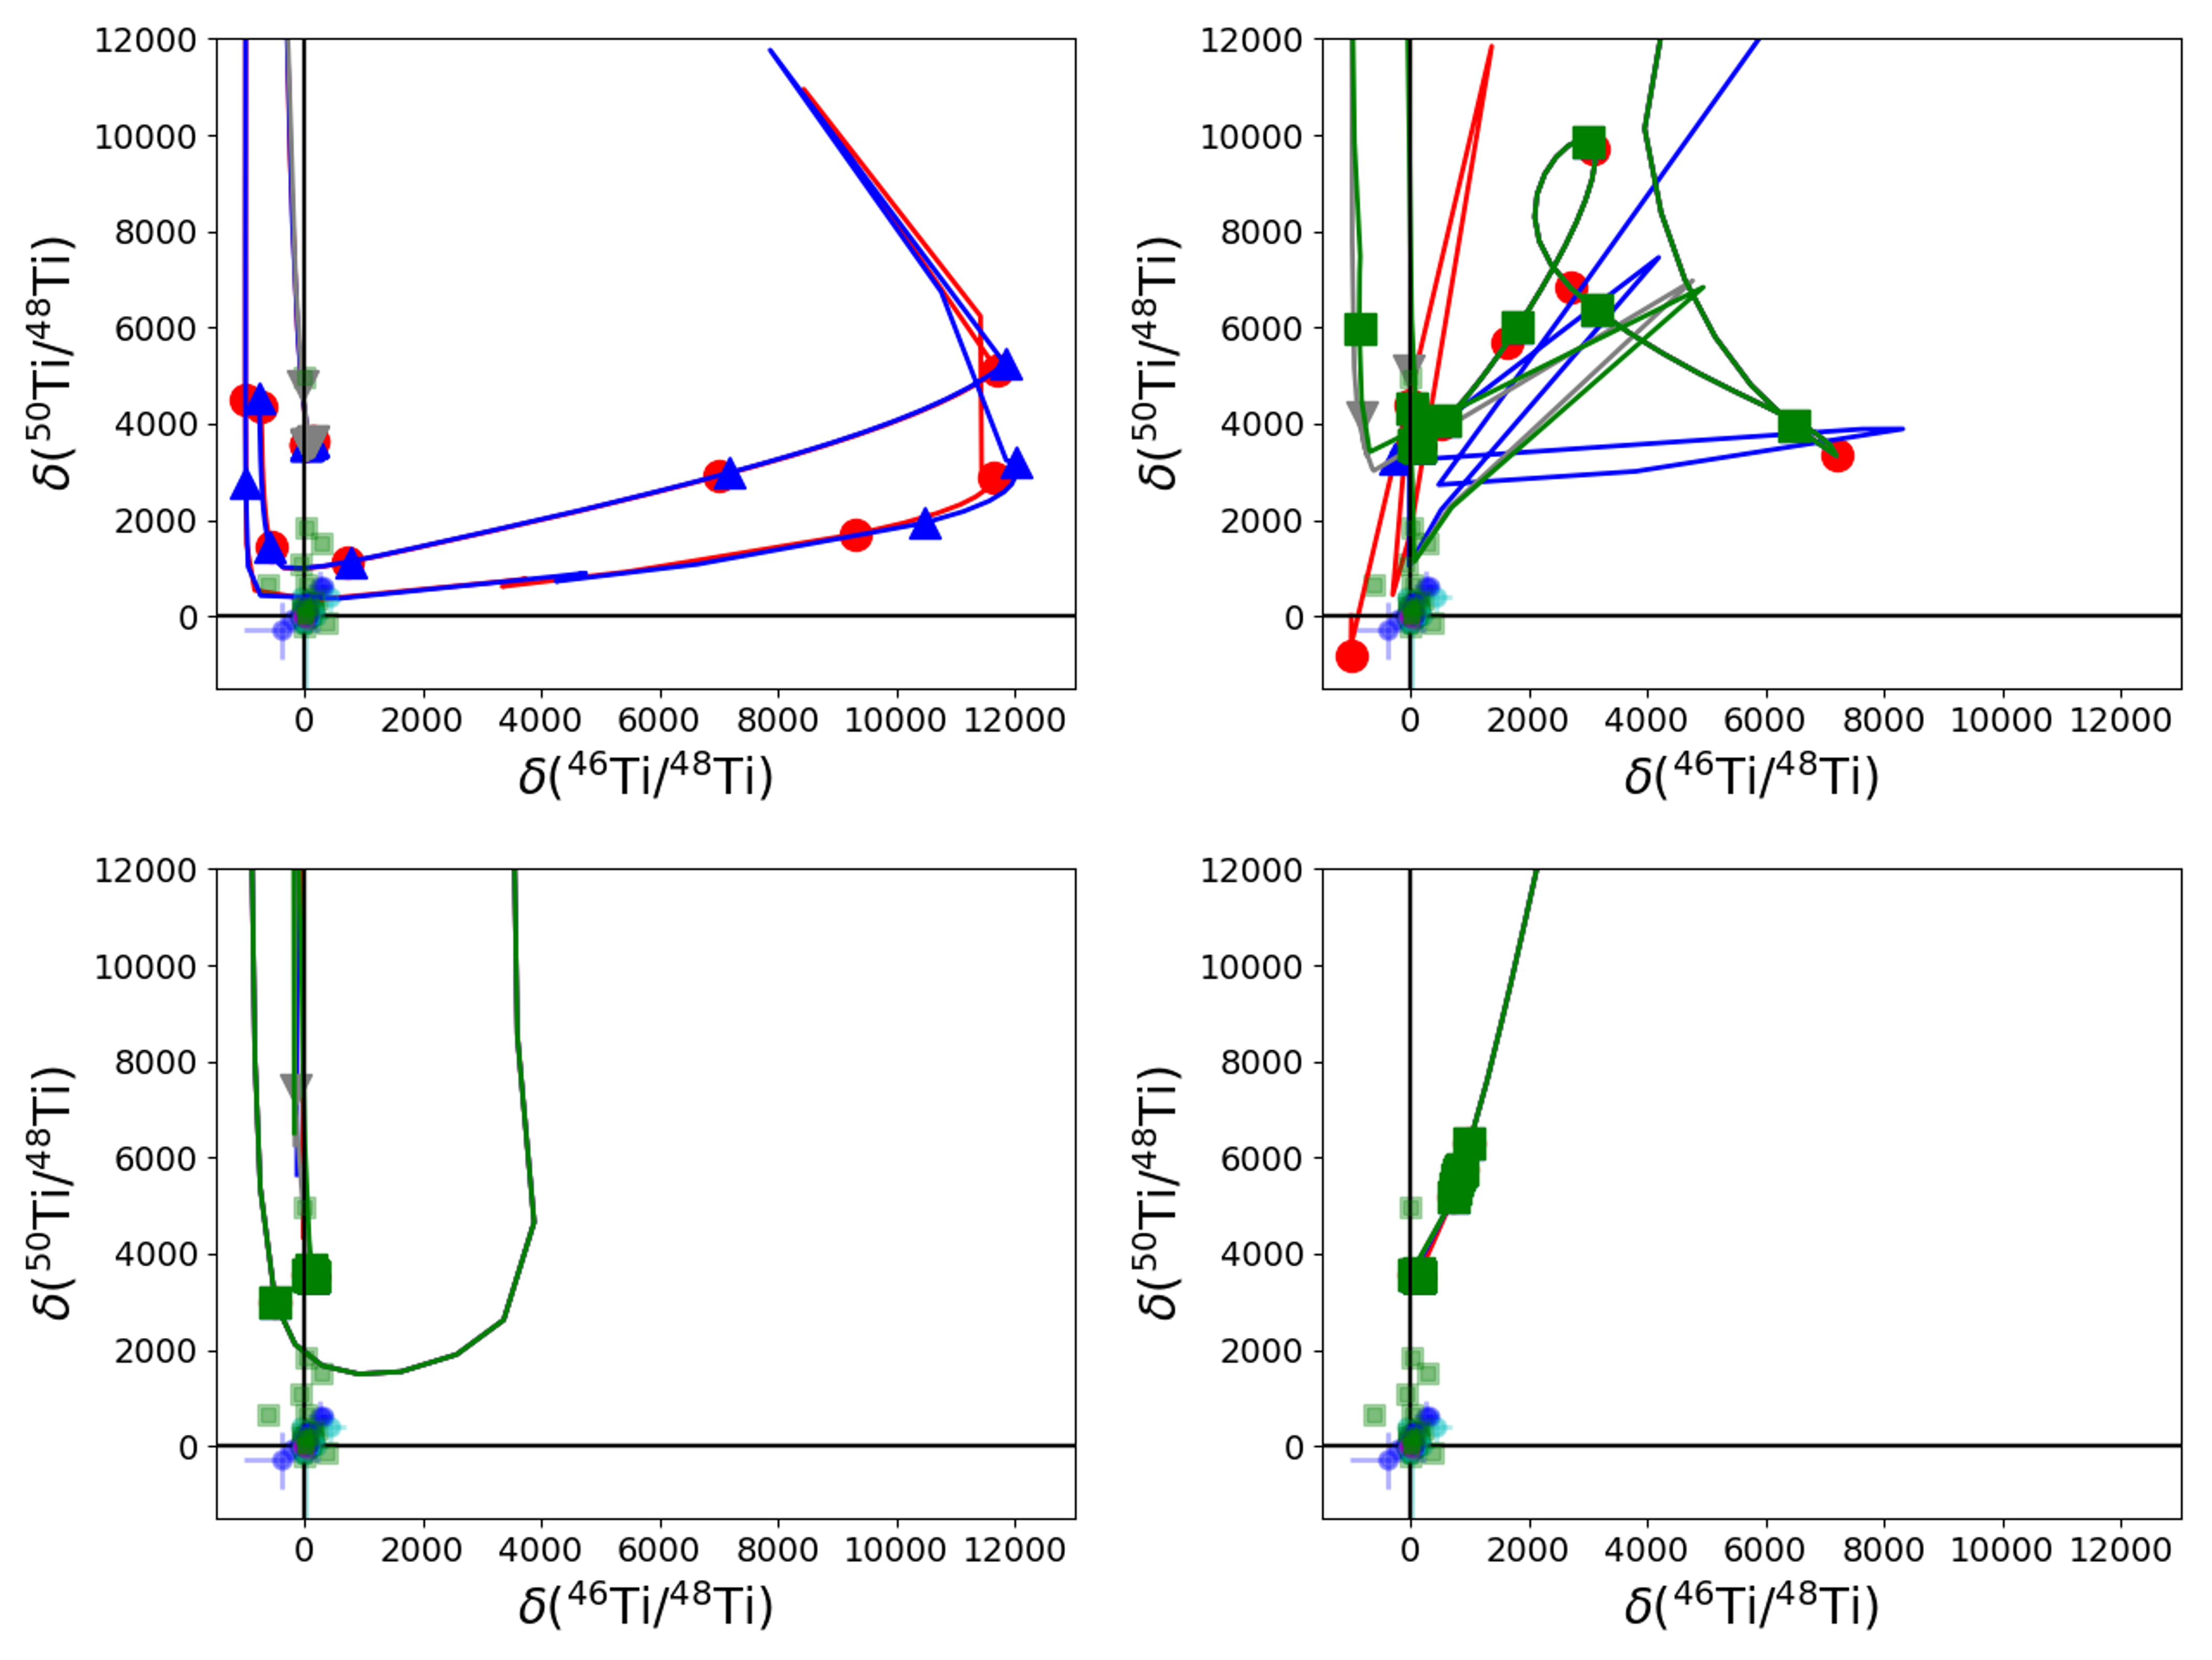
For the sake of completeness, in the Appendix Figures 12 and 13 provide the isotopic ratios 47Ti/48Ti with respect to 46Ti/48Ti, and 50Ti/48Ti with respect to 46Ti/48Ti for our models in comparison to presolar grains. No additional constraints can be derived from these figures compared to what we have already discussed. Nevertheless, as for Si isotopes and other Ti isotopes discussed so far, a novel nucleosynthesis in the O/Nova zone compared to massive star models without H ingestion can be also identified. We defer to a future paper for the detailed analysis of the nucleosynthesis in the O/Nova zone.
4 The abundance signatures of radioactive isotopes 26Al and 44Ti in presolar grains
In this section we look further at the implications of the models predictions, and for each grain type we consider the distributions of isotopic abundance ratios for the radioactive isotopes 26Al and 44Ti.
Figure 10, top Panel, shows the 26Al/27Al and 12C/13C isotopic ratios predicted by a selection of our CCSN models 15d, 25T-H5 and 25av-H5 and compared with presolar grains. The distribution of isotopic ratios for each grain type is shown and the respective median values are reported. Based on the considerations made in the previous section, we used here for the analysis 25T-H5 and 25av-H5, and not the analogous CCSN models with the highest initial H concentration. Note however that the results that we derive from the discussion would not be much different. As we have seen in Figure 7, the ejected abundance products from 25T-H5 and 25av-H5 have a sub-solar 12C/13C ratio in the He/C zone above the O/Nova zone. In both of the two models, the ratio is becoming super-solar moving inward within the O/Nova zone, and with a depletion of both C isotopes by proton captures. At the bottom of the O/Nova zone, both the C/Si zone in 25T-H5 and residual C-rich layers in 25av-H5 are 12C-rich. In the 15d model, both the C/Si zone and the He/C zone have a 12C/13C ratio higher than solar, while the upper part of the He/C zone and the He/N zone are sub-solar (Pignatari et al., 2013a).
If now we check more carefully the abundance distributions in single presolar grains, SiC-X grains appear to show two 26Al enrichment peaks, one distinct at around 26Al/27Al 0.2 and potentially a second peak (less clear with fewer data points) at 26Al/27Al 0.05. More data points would be required to clarify whether these are indeed two distinct peaks or simply a single distribution with a long tail toward low 26Al abundances. Based on Pignatari et al. (2015) and results presented in § 3, the first peak may be the signature of late H-ingestion and SN explosions at higher energy (25T or 25av). The potential second peak could be explained from mixing of the He/C and He/N zones (15d reaches these values), or H-ingestion in low-energy CCSNe (e.g. 25d, see Figure 7). This should be confirmed by future works, where mixing models are applied to reproduce the composition of single presolar grains. The first peak is much stronger, which would be consistent with the scenario where most of SiC-X are forming in high-energy explosions (Pignatari et al., 2013a). We cannot derive a direct constraint on the frequency of H-ingestion in CCSNe. This is because most of the observed CCSN dust could have originated from a single CCSN immediately before the formation of the Solar System, with late H-ingestion and asymmetric ejecta. The distribution of 26Al/27Al measured in LD graphites is quite different to that of SiC-X grains, despite the overall similar range of ratios found. This may appear to be quite surprising, considering that the two types of grains are formed in the same parts of the CCSN ejecta. There is a higher peak at 26Al/27Al 0.06 and a shallow broad peak at 0.01. Like for SiC-X grains, it is still unclear if this second peak really exists. However, the distribution of 26Al/27Al ratios appear to be shifted toward higher values for SiC-X compared to LD graphites. This could be explained assuming that LD graphites condensed efficiently in CCSN ejecta exposed to a broader range of nucleosynthesis conditions compared to SiC-X grains, including less extreme temperature and density peaks during the SN explosion (e.g., Pignatari et al., 2018). On the other hand, as Travaglio et al. (1999) pointed out we cannot exclude that the 26Al/27Al measured today in graphites was affected by loss of radiogenic 26Mg, which would also explain these lower ratios. SiC-AB grains show a broad distribution with a peak at 0.003. Since different types of stellar sources are contributing to these grains (Amari et al., 2001b; Liu et al., 2017a, b; Hoppe et al., 2019), we cannot derive clear constraints applying specifically to CCSNe from the overall distribution shown. Possibly because of the low number of data, the 26Al/27Al in putative Nova grains is scattered over two orders of magnitudes, partially overlapping with the SiC AB grains, and with a median value of 0.062 that is consistent with the LD graphites higher peak.
In the top Panel, we also report the abundance distribution with the position of the median line for the measured 12C/13C ratios. Interestingly, as we have seen for Al isotopes, we find again that the C distribution for SiC-X and LD graphites is different, with the median at 172 (higher than solar) and 79 (lower than solar) respectively. This is an intrinsic difference of the two populations of grains, and it is clearly not due to a different solar contamination or loss of radiogenic material as it could be for 26Mg. In the figure, we report 106 SiC-X grains with 22% of 12C/13C ratios less than solar and 78% 12C/13C greater than solar, and 173 LD graphites with 52% of 12C/13C ratios less than solar and 48% 12C/13C greater than solar. In the classic scenario where 28Si is formed in the Si/S zone, there is no explanation of these differences, since the Si/S zone is C-poor (and Al-poor) and would not affect the C-ratio. Additionally, if we assume that both 13C and 26Al found in grains are a product of explosive H-burning or of the He/N zone, because the 12C/13C median of LD graphites is lower than in SiC-X data we would also expect the 26Al/27Al median to be higher. This is not the case. On the other hand, this appears to be further confirmation of the C/Si zone as the origin of 28Si in these grains. Compared to LD graphites, a larger fraction of SiC-X are 28Si-rich and 12C-rich like the C/Si zone. This could qualitatively explain why a larger fraction of SiC-X grains have 12C/13C larger than solar, independently from the nucleosynthesis source of 13C and 26Al. The SiC-X grains preferentially form in high-energy CCSNe or in high energy components of asymmetric CCSNe ejecta where the C/Si zone is created during the explosion. On the other hand, LD graphites are formed in a larger range of conditions, in ejecta with and without the 28Si-rich and 12C-rich C/Si zone. Finally, SiC nova grains and SiC-AB grains show consistent 12C/13C distributions, with medians equal to 5.1 and 4.4, respectively.
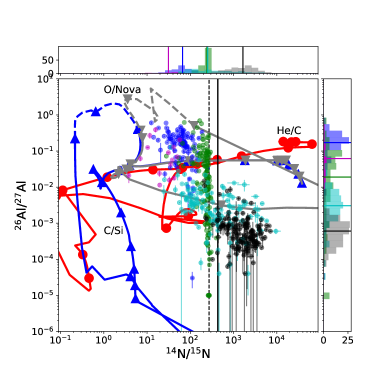
In figure 10, bottom Panel, we show the 26Al/27Al and 14N/15N isotopic ratios from the CCSN abundances predicted in 15d, 25T-H5 and 25av-H5 and we compare them with SiC grains. Models 25T-H5 and 25av-H5 show the same abundances in the external part of the He/C zone, with an 26Al/27Al of the order of 0.05, generated from the H-ingestion event, and a 14N/15N ratio higher than solar, but quickly decreasing with moving deeper in the He/C zone. At the bottom of the He/C zone a sudden rise of the 26Al/27Al up to about a value of 0.3 is also seen for both the two models. We can clearly see that in these regions nucleosynthesis patterns are shaped by nuclear reactions, which are the same in the two models. The 26Al/27Al ratio rises up to 2-3 in the O/Nova zones of both 25T-H5 and 25av-H5. However, the N isotopic ratio decreases in 25T-H5 and increases in 25av-H5. For the presolar grains analysis of the N abundances the bottom of the O/Nova zone and the C/Si zones are not relevant, since they are both N-poor. The model 15d shows higher ratios in the external He/C zone compared to the two models with H-ingestion, reaching a maximum 26Al/27Al value of 0.2 but with much lower N abundances (Pignatari et al., 2015). In the He/C zone and in the C/Si zone 26Al is not made efficiently by explosive nucleosynthesis. The explosive production of 15N allows the reduction of the N isotopic ratio, but its production is too weak compared to observations (Bojazi & Meyer, 2014), and the whole N abundances in the deepest C-rich ejecta shown in the figure would not be relevant once some small degree of mixing is allowed for ejected stellar material.
We have already discussed in the top Panel the 26Al/27Al distribution in presolar grains. The 14N/15N for LD graphites is not indicative of the original composition because of terrestrial contamination. Where contamination from terrestrial material did not completely erase the N signature, the LD graphites carry a low N ratio, particularly for high 26Al/27Al ratios. The original 15N-rich signature was likely very high in these grains. Concerning the different types of SiC grains shown in the figure, there is a general trend (due to nuclear astrophysical reasons) of correlated 15N and 26Al abundances across the whole grain population, but within a large grain-to-grain scatter. Putative nova grains again behave like a 15N-rich tail of the SiC-AB grain spread (14N/15N medians of SiC Nova and SiC-AB grains are 31 and 252, respectively). The population of SiC-X grains carry a higher 26Al compared to other grains with the same N ratio. The sub-solar 14N/15N ratios show a scatter of a factor of 20, with a median of 66 that is in between SiC Nova and SiC-AB grains.
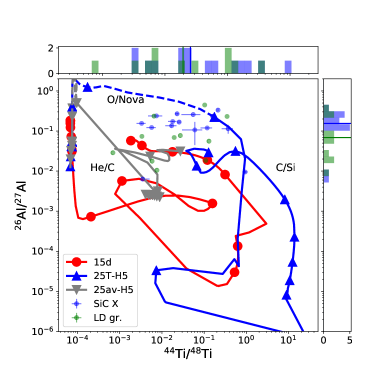
Figure 11 shows the 26Al/27Al and 44Ti/48Ti isotopic ratios from the final CCSN abundances in 15d, 25T-H5 and 25av-H5 and compared with SiC-X and LD graphites. Only a limited number of grains have been measured for both 26Mg (26Al) and 44Ca (44Ti): 15 SiC-X and 11 LD graphites. A particular problem for Ca isotope measurements is contamination of the grains with terrestrial Ca, such that existing 44Ca excesses may remain hidden (Besmehn & Hoppe, 2003). This may explain that from the 138 X grains measured for Ca, only 38 showed resolvable excesses in 44Ca, although it should be noted that Ca contamination has no effect on inferred 44Ti/48Ti ratios. Because of the low statistics available, we cannot derive any significant conclusions from the abundance distribution in the histogram aspect of this figure. It is interesting to note that for SiC-X grains the 26Al/27Al medians between this sample and the extended sample from Figure 10 are consistent within 12%. For LD graphites, the 11 grains here have a median that is a factor of 3.7 higher compared to the extended sample in Figure 10. However, we cannot yet conclude that 44Ti-rich LD graphites tend to be also 26Al-rich based on 11 grains only. More grains with both 44Ti and 26Al measurements would be needed.
Concerning the abundance curves from CCSN models shown in Figure 11, the C/Si zone in 15d and 25T-H5 provides the 44Ti, with 44Ti/48Ti ratios larger than 0.001 (see e.g., Pignatari et al., 2013a). The C/Si zone does not make 26Al. Instead, in the figure this radioactive isotope is provided by the O/nova zone (in 25T-H5 and 25av-H5) and at the bottom of the He/C zone (the region around 44Ti/48Ti 0.0001). We may anticipate here that a local mixing of these regions would result in a large degree of 26Al and 44Ti enrichment. In the future, extensive comparisons between mixing models from CCSN models with H ingestion and single presolar grains carrying both 44Ti- and 26Al-enrichment are needed. Previously, Xu et al. (2015) used the models 15r (really similar to the model 15d presented here) and 15r4 (presented in this work) to reproduce a sample of single SiC X grains including both 26Al and 44Ti. However, both these models are without H ingestion. In Hoppe et al. (2018), for the first time 44Ti was explored for two SiC-X grains and a SiC-C grain in the context of the 25T H-ingestion SN models presented here. From that study, it was shown that predictions for 44Ti are too high when C-, N-, and Si-isotopic compositions and 26Al/27Al ratios are well fitted. The possible sources of such a discrepancy were considered, among others the extension and detailed abundance profiles of the C/Si zone. Interestingly, in the high energy CCSN model 25T-H5 we also see a 44Ti production in the O/nova region, with 44Ti/48Ti increasing up to about 0.2 with decreasing mass coordinate. The absolute abundance of 44Ti in this region is about three orders of magnitudes lower than in the C/Si zone, reaching a maximum abundance in the order of 10-6 in mass fraction. The nucleosynthesis in the deepest layers of the O/Nova zone is given by the combination of proton captures and -captures, that start to become relevant at these conditions. Some 44Ti is made and at the same time the initial 48Ti is depleted by a factor of 2-3, which explains the rise of the 44Ti/48Ti ratio.
5 Conclusions
This work has compared the isotopic abundances of presolar SiC grains and graphites from CCSNe with the predictions of four sets of one-dimensional CCSN models with a range of energies, both with and without H-ingestion: 15d, 25T, 25av and 25d. Compared to previous works, we are including in our analysis six additional CCSN models with H ingestion (set 25av), and intermediate explosion energies between the 25T and 25d stellar sets (Pignatari et al., 2015). The primary aim of this work is to study the impact of differing energies and remaining H () in H-ingestion models as well as comparing the predictions of models with and without H-ingestion but with the same range of explosion energies. The isotopic ratios focused on were C, N, Al, Si, and Ti of LD graphites and SiC grains of Type X, AB, C and nova, which have potentially condensed from CCSN ejecta. In particular, we discuss the production of the radioactive isotopes 26Al and 44Ti.
The 15d, 15r2, and 25T models develop a C/Si zone, ranging in explosion energy between 1-erg and with a temperature at the bottom of the C-rich region between K (15r2) and K (25T; Pignatari et al., 2015). These models are able to reproduce the 28Si- and 44Ti-excesses of SiC-X grains and LD graphites, consistently with the nucleosynthesis signatures of Si and Ti isotopes measured. The most H-rich 25av models still develop an O/Nova zone, but the C-rich layers ejected at the bottom of the region are not forming a fully built C/Si zone: the peak temperature of K was not high enough to efficiently convert 16O into 28Si. However, we do see the destruction of 16O here as well as a small signatures for 20Ne and 24Mg production. The nucleosynthesis signatures calculated in the O/Nova zone shows remarkable similarities in the 25T and 25av sets, showing that in principle it is possible to disentangle the impact of the amount of H present in the He shell at the CCSN onset from the impact of the CCSN explosion energy. The main reason is that by increasing the explosion energy the O/Nova zone is extending more outward in the former convective He shell, mitigating the effect of the higher temperatures generated. For both the two CCSN sets 25T and 25av, we find that the models with initial (25T-H5 and 25av-H5) are producing the highest 26Al/27Al ratios, reproducing the most extreme 26Al enrichment measured in grains. In particular, the 26Al/27Al ratio is not increasing linearly with the increasing of the initial H, independently from the explosion energy. We show that both the two sets of models develop Si isotopic ratios at the bottom of the He/C zone that are consistent with SiC-Nova grains, together with the C and N ratios (models 25T-H, 25T-H5 and 25T-H10, 25av-H, 25av-H5 and 25av-H10). On the other hand, the nucleosynthesis of Si isotopes in the O/Nova zone is quite different between 25T-H (25av-H) and 25T-H5 (25av-H5), with the highest H abundances driving an efficient production of both 29Si and 30Si. We discuss some of the relevant similarities between the nucleosynthesis obtained in the O/Nova environment compared to ONe Novae (e.g., Amari et al., 2001a).
Finally, we discussed the abundance distribution in presolar grains, looking in particular at C and N isotopic ratios, 26Al and 44Ti. Two distinct populations can be possibly identified for both SiC-X grains and LD graphites, an 26Al-rich one and an 26Al-poor. However, the 26Al-poor component is less clearly defined, and more statistics is needed. in order to draw meaningful conclusions. The C abundance distribution instead show relevant differences between SiC-X grains and LD graphites. Combined with the Al signature, we discuss and found these distributions consistent with the scenario where the 28Si-rich contribution would come from the 12C-rich C/Si zone. On the other hand, the same explanation would not apply if the 28Si-rich contribution would come from the 12C-poor Si/S zone. Unfortunately, there is only a limited number of grains with both 26Al and 44Ti measured. More data would be required to derive trends between 26Al and 44Ti enrichments.
In future works, we plan to study in detail the nucleosynthesis in the O/Nova zone for the models discussed here. We identify significant differences in the production of Si and Ti isotopes by reducing from initial H concentrations in the order of 1% (models 25T-H and 25av-H) to few per mill (models 25T-H5 and 25av-H5). While the production path of the radioactive isotope 26Al is similar, the resulting 26Al/27Al ratio does not behave linearly with the initial abundance of H explored. Additionally, these models need to be further tested by comparing their predictions with elements and isotopic ratios on a grain by grain basis, where the qualitative consistency of the abundance signatures described in this work need to be quantitatively compared within mixtures of CCSN layers to match the measured data (e.g., Travaglio et al., 1999; Xu et al., 2015; Liu et al., 2016, 2017a, 2018b; Hoppe et al., 2018, 2019, 2021). This would act as further diagnosis of these models and allow the continued improvement upon them where grain signatures are not reproduced. The network of nuclear reactions used for our stellar calculations is becoming more reliable at the temperatures range relevant for explosive He-burning (see however, e.g., Bojazi & Meyer, 2014; Pignatari et al., 2013c). The CCSN explosion energy as a single parameter to explore from the different nucleosynthesis patterns is relatively easy to handle by specific nuclear astrophysics studies. However, as we stressed in Pignatari et al. (2015) and other more recent works the outcome of H ingestion events in one-dimensional models should be taken only as a qualitative guidance in specific comparisons with single presolar grains. While proton-capture rates are typically well known at temperatures in the order of 2-3108 K, multi-dimensional hydrodynamics models are needed to define the evolution of the structure of He-burning layers, the local nucleosynthesis driven during the H ingestion and eventually the amount of H left in the He-burning ashes. To this end, presolar grains represent the most powerful observational diagnostic available to study these events in massive star progenitors of past CCSNe.
6 Acknowledgements
We acknowledge significant support to NuGrid from STFC (through the University of Hull’s Consolidated Grant ST/R000840/1), and access to viper, the University of Hull High Performance Computing Facility. Thanks from JS go to the support provided by the University of Hull Internal Internship Programme. MP thanks the following for their support: the National Science Foundation (NSF, USA) under grant No. PHY-1430152 (JINA Center for the Evolution of the Elements), the "Lendulet-2014" Program of the Hungarian Academy of Sciences (Hungary), the ERC Consolidator Grant (Hungary) funding scheme (Project RADIOSTAR, G.A. n. 724560), the ChETEC COST Action (CA16117), supported by the European Cooperation in Science and Technology, the US IReNA Accelnet network (Grant No. OISE-1927130), and the European Union’s Horizon 2020 research and innovation programme (ChETEC-INFRA – Project no. 101008324).
7 Data Availability
The stellar data used for this article will be shared on reasonable request to the corresponding author. Stellar data files are in hdf5 format, and tools to load and use the data are available on the public NuGrid github repository (https://github.com/NuGrid/NuGridPy). Presolar grains data are publicly available at the open source Presolar Grain Database (https://presolar.physics.wustl.edu/presolar-grain-database/).
References
- Adsley et al. (2021) Adsley P., et al., 2021, Phys. Rev. C, 103, 015805
- Amari et al. (1993) Amari S., Hoppe P., Zinner E., Lewis R. S., 1993, Nature, 365, 806
- Amari et al. (1994) Amari S., Lewis R. S., Anders E., 1994, Geochimica Cosmochimica Acta, 58, 459
- Amari et al. (1995) Amari S., Lewis R. S., Anders E., 1995, Geochimica Cosmochimica Acta, 59, 1411
- Amari et al. (2001a) Amari S., Gao X., Nittler L. R., Zinner E., José J., Hernanz M., Lewis R. S., 2001a, ApJ, 551, 1065
- Amari et al. (2001b) Amari S., Nittler L. R., Zinner E., Lodders K., Lewis R. S., 2001b, ApJ, 559, 463
- Banerjee et al. (2018) Banerjee P., Qian Y.-Z., Heger A., 2018, ApJ, 865, 120
- Bernatowicz et al. (1987) Bernatowicz T., Fraundorf G., Ming T., Anders E., Wopenka B., Zinner E., Fraundorf P., 1987, Nature, 330, 728
- Besmehn & Hoppe (2003) Besmehn A., Hoppe P., 2003, Geochimica Cosmochimica Acta, 67, 4693
- Blake & Schramm (1976) Blake J. B., Schramm D. N., 1976, ApJ, 209, 846
- Blake et al. (1981) Blake J. B., Woosley S. E., Weaver T. A., Schramm D. N., 1981, ApJ, 248, 315
- Bojazi & Meyer (2014) Bojazi M. J., Meyer B. S., 2014, Phys. Rev. C, 89, 025807
- Carlos et al. (2018) Carlos M., Karakas A. I., Cohen J. G., Kobayashi C., Meléndez J., 2018, ApJ, 856, 161
- Carretta et al. (2000) Carretta E., Gratton R. G., Sneden C., 2000, A&A, 356, 238
- Chavez & Lambert (2009) Chavez J., Lambert D. L., 2009, ApJ, 699, 1906
- Clarkson & Herwig (2021) Clarkson O., Herwig F., 2021, MNRAS, 500, 2685
- Clarkson et al. (2018) Clarkson O., Herwig F., Pignatari M., 2018, MNRAS, 474, L37
- Clayton et al. (1999) Clayton D. D., Liu W., Dalgarno A., 1999, Science, 283, 1290
- Cowan & Rose (1977) Cowan J. J., Rose W. K., 1977, ApJ, 212, 149
- Curtis et al. (2019) Curtis S., Ebinger K., Fröhlich C., Hempel M., Perego A., Liebendörfer M., Thielemann F.-K., 2019, ApJ, 870, 2
- Cyburt et al. (2010) Cyburt R. H., et al., 2010, ApJS, 189, 240
- Davis (2011) Davis A. M., 2011, Proceedings of the National Academy of Science, 108, 19142
- De Jager et al. (1988) De Jager C., Nieuwenhuijzen H., van der Hucht K. A., 1988, A&AS, 72, 259
- Denissenkov et al. (2014) Denissenkov P. A., et al., 2014, MNRAS, 442, 2058
- Dillmann et al. (2006) Dillmann I., Heil M., Käppeler F., Plag R., Rauscher T., Thielemann F. K., 2006, in Woehr A., Aprahamian A., eds, American Institute of Physics Conference Series Vol. 819, Capture Gamma-Ray Spectroscopy and Related Topics. pp 123–127, doi:10.1063/1.2187846
- Ebel & Grossman (2001) Ebel D. S., Grossman L., 2001, Geochimica Cosmochimica Acta, 65, 469
- Eggenberger et al. (2008) Eggenberger P., Meynet G., Maeder A., Hirschi R., Charbonnel C., Talon S., Ekström S., 2008, Ap&SS, 316, 43
- Fryer et al. (2012) Fryer C. L., Belczynski K., Wiktorowicz G., Dominik M., Kalogera V., Holz D. E., 2012, ApJ, 749, 91
- Fujiya et al. (2013) Fujiya W., Hoppe P., Zinner E., Pignatari M., Herwig F., 2013, ApJ, 776, L29
- Fuller et al. (1985) Fuller G. M., Fowler W. A., Newman M. J., 1985, ApJ, 293, 1
- Fynbo et al. (2005) Fynbo H. O. U., et al., 2005, Nature, 433, 136
- Goriely (1999) Goriely S., 1999, A&A, 342, 881
- Grevesse & Noels (1993) Grevesse N., Noels A., 1993, in Prantzos N., Vangioni-Flam E., Casse M., eds, Origin and Evolution of the Elements. pp 15–25
- Hammer et al. (2010) Hammer N. J., Janka H. T., Müller E., 2010, ApJ, 714, 1371
- Hedrosa et al. (2013) Hedrosa R. P., Abia C., Busso M., Cristallo S., Domínguez I., Palmerini S., Plez B., Straniero O., 2013, ApJ, 768, L11
- Herwig et al. (2014a) Herwig F., Woodward P. R., Lin P.-H., Knox M., Fryer C., 2014a, ApJ, 792, L3
- Herwig et al. (2014b) Herwig F., Woodward P. R., Lin P.-H., Knox M., Fryer C., 2014b, ApJ, 792, L3
- Hirschi (2007) Hirschi R., 2007, A&A, 461, 571
- Hoppe et al. (1995) Hoppe P., Amari S., Zinner E., Lewis R. S., 1995, Geochimica Cosmochimica Acta, 59, 4029
- Hoppe et al. (2018) Hoppe P., Pignatari M., Kodolányi J., Gröner E., Amari S., 2018, Geochimica Cosmochimica Acta, 221, 182
- Hoppe et al. (2019) Hoppe P., Stancliffe R. J., Pignatari M., Amari S., 2019, ApJ, 887, 8
- Hoppe et al. (2021) Hoppe P., Leitner J., Kodolányi J., Vollmer C., 2021, ApJ, 913, 10
- Hoppe et al. (2022) Hoppe P., Pignatari M., Amari S., 2022, in 85th Annual Meeting of the Meteoritical Society. Lunar and Planetary Institute, Houston. p. 6036
- Hughes et al. (2000) Hughes J. P., Rakowski C. E., Burrows D. N., Slane P. O., 2000, ApJ, 528, L109
- Hynes & Gyngard (2009) Hynes K. M., Gyngard F., 2009, in Lunar and Planetary Science Conference. Lunar and Planetary Science Conference. p. 1198
- Jadhav et al. (2013) Jadhav M., Pignatari M., Herwig F., Zinner E., Gallino R., Huss G. R., 2013, ApJ, 777, L27
- Jaeger et al. (2001) Jaeger M., Kunz R., Mayer A., Hammer J. W., Staudt G., Kratz K. L., Pfeiffer B., 2001, Phys. Rev. Lett., 87, 202501
- José & Hernanz (2007a) José J., Hernanz M., 2007a, Journal of Physics G Nuclear Physics, 34, R431
- José & Hernanz (2007b) José J., Hernanz M., 2007b, Meteoritics and Planetary Science, 42, 1135
- José et al. (2001) José J., Coc A., Hernanz M., 2001, ApJ, 560, 897
- Kifonidis et al. (2003) Kifonidis K., Plewa T., Janka H. T., Müller E., 2003, A&A, 408, 621
- Kunz et al. (2002) Kunz R., Fey M., Jaeger M., Mayer A., Hammer J. W., Staudt G., Harissopulos S., Paradellis T., 2002, ApJ, 567, 643
- Langanke & Martínez-Pinedo (2000) Langanke K., Martínez-Pinedo G., 2000, Nuclear Phys. A, 673, 481
- Limongi & Chieffi (2003) Limongi M., Chieffi A., 2003, ApJ, 592, 404
- Limongi & Chieffi (2018) Limongi M., Chieffi A., 2018, ApJS, 237, 13
- Lin et al. (2010) Lin Y., Gyngard F., Zinner E., 2010, ApJ, 709, 1157
- Liu et al. (2014) Liu N., et al., 2014, ApJ, 786, 66
- Liu et al. (2016) Liu N., Nittler L. R., O’D. Alexander C. M., Wang J., Pignatari M., José J., Nguyen A., 2016, ApJ, 820, 140
- Liu et al. (2017a) Liu N., Nittler L. R., Pignatari M., O’D. Alexand er C. M., Wang J., 2017a, ApJ, 842, L1
- Liu et al. (2017b) Liu N., et al., 2017b, ApJ, 844, L12
- Liu et al. (2018a) Liu N., Nittler L. R., Alexander C. M. O. D., Wang J., 2018a, Science Advances, 4, eaao1054
- Liu et al. (2018b) Liu N., et al., 2018b, ApJ, 855, 144
- Lodders & Fegley (1995) Lodders K., Fegley B. J., 1995, Meteoritics, 30, 661
- Lodders & Fegley (1997) Lodders K., Fegley B., 1997, in Bernatowicz T. J., Zinner E., eds, American Institute of Physics Conference Series Vol. 402, American Institute of Physics Conference Series. pp 391–423, doi:10.1063/1.53317
- Marty et al. (2011) Marty B., Chaussidon M., Wiens R. C., Jurewicz A. J. G., Burnett D. S., 2011, Science, 332, 1533
- Meyer et al. (1995) Meyer B. S., Weaver T. A., Woosley S. E., 1995, Meteoritics, 30, 325
- Meyer et al. (2000) Meyer B. S., Clayton D. D., The L. S., 2000, ApJ, 540, L49
- Nittler & Ciesla (2016) Nittler L. R., Ciesla F., 2016, ARA&A, 54, 53
- Nittler & Hoppe (2005) Nittler L. R., Hoppe P., 2005, ApJ, 631, L89
- Nittler et al. (1996) Nittler L. R., Amari S., Zinner E., Woosley S. E., Lewis R. S., 1996, ApJ, 462, L31
- Nomoto et al. (2013) Nomoto K., Kobayashi C., Tominaga N., 2013, ARA&A, 51, 457
- Oda et al. (1994) Oda T., Hino M., Muto K., Takahara M., Sato K., 1994, Atomic Data and Nuclear Data Tables, 56, 231
- Ota et al. (2021) Ota S., et al., 2021, Phys. Rev. C, 104, 055806
- Pellin et al. (2006) Pellin M., et al., 2006, LPI, p. 2041
- Perego et al. (2015) Perego A., Hempel M., Fröhlich C., Ebinger K., Eichler M., Casanova J., Liebendörfer M., Thielemann F. K., 2015, ApJ, 806, 275
- Pignatari et al. (2013a) Pignatari M., et al., 2013a, ApJ, 767, L22
- Pignatari et al. (2013b) Pignatari M., et al., 2013b, ApJ, 771, L7
- Pignatari et al. (2013c) Pignatari M., et al., 2013c, ApJ, 771, L7
- Pignatari et al. (2015) Pignatari M., et al., 2015, ApJ, 808, L43
- Pignatari et al. (2016) Pignatari M., et al., 2016, ApJS, 225, 24
- Pignatari et al. (2018) Pignatari M., Hoppe P., Trappitsch R., Fryer C., Timmes F. X., Herwig F., Hirschi R., 2018, Geochimica Cosmochimica Acta, 221, 37
- Rauscher et al. (2002) Rauscher T., Heger A., Hoffman R. D., Woosley S. E., 2002, ApJ, 576, 323
- Ritter et al. (2018) Ritter C., Herwig F., Jones S., Pignatari M., Fryer C., Hirschi R., 2018, MNRAS, 480, 538
- Roederer et al. (2016) Roederer I. U., Karakas A. I., Pignatari M., Herwig F., 2016, ApJ, 821, 37
- Sedov (1946) Sedov L. I., 1946, Journal of Applied Mathematics and Mechanics, 10, 241
- Sieverding et al. (2018) Sieverding A., Martínez-Pinedo G., Huther L., Langanke K., Heger A., 2018, ApJ, 865, 143
- Spite et al. (2006) Spite M., et al., 2006, A&A, 455, 291
- Stancliffe et al. (2011) Stancliffe R. J., Dearborn D. S. P., Lattanzio J. C., Heap S. A., Campbell S. W., 2011, ApJ, 742, 121
- Stephan et al. (2020) Stephan T., et al., 2020, in Lunar and Planetary Science Conference. Lunar and Planetary Science Conference. p. 2140
- Sukhbold et al. (2016) Sukhbold T., Ertl T., Woosley S. E., Brown J. M., Janka H. T., 2016, ApJ, 821, 38
- Talwar et al. (2016) Talwar R., et al., 2016, Phys. Rev. C, 93, 055803
- Thielemann et al. (1979) Thielemann F. K., Arnould M., Hillebrandt W., 1979, A&A, 74, 175
- Thielemann et al. (1996) Thielemann F.-K., Nomoto K., Hashimoto M.-A., 1996, ApJ, 460, 408
- Travaglio et al. (1999) Travaglio C., Gallino R., Amari S., Zinner E., Woosley S., Lewis R. S., 1999, ApJ, 510, 325
- Vink et al. (2001) Vink J. S., de Koter A., Lamers H. J. G. L. M., 2001, A&A, 369, 574
- Wiescher et al. (2010) Wiescher M., Görres J., Uberseder E., Imbriani G., Pignatari M., 2010, Annual Review of Nuclear and Particle Science, 60, 381
- Woodward et al. (2015a) Woodward P. R., Herwig F., Lin P.-H., 2015a, ApJ, 798, 49
- Woodward et al. (2015b) Woodward P. R., Herwig F., Lin P.-H., 2015b, ApJ, 798, 49
- Woosley & Weaver (1995) Woosley S. E., Weaver T. A., 1995, ApJS, 101, 181
- Woosley et al. (2002) Woosley S. E., Heger A., Weaver T. A., 2002, Reviews of Modern Physics, 74, 1015
- Xu et al. (2015) Xu Y., Zinner E., Gallino R., Heger A., Pignatari M., Lin Y., 2015, ApJ, 799, 156
- Yong et al. (2003) Yong D., Lambert D. L., Ivans I. I., 2003, ApJ, 599, 1357
- Zinner (2014) Zinner E., 2014, in Davis A. M., ed., Vol. 1, Meteorites and Cosmochemical Processes. Elsevier, pp 181–213
Appendix A Additional Figures: (47Ti/48Ti) and (50Ti/48Ti)