Collapse of Metallicity and High- Superconductivity
in the High-Pressure phase of FeSe0.89S0.11
Abstract
We investigate the high-pressure phase of the iron-based superconductor FeSe0.89S0.11 using transport and tunnel diode oscillator studies. We construct detailed pressure-temperature phase diagrams that indicate that outside of the nematic phase, the superconducting critical temperature reaches a minimum before it is quickly enhanced towards 40 K above 4 GPa. The resistivity data reveal signatures of a fan-like structure of non-Fermi liquid behaviour which could indicate the existence of a putative quantum critical point buried underneath the superconducting dome around 4.3 GPa. Further increasing the pressure, the zero-field electrical resistivity develops a non-metallic temperature dependence and the superconducting transition broadens significantly. Eventually, the system fails to reach a fully zero-resistance state despite a continuous finite superconducting transition temperature, and any remaining resistance at low temperatures becomes strongly current-dependent. Our results suggest that the high-pressure, high- phase of iron chalcogenides is very fragile and sensitive to uniaxial effects of the pressure medium, cell design and sample thickness which can trigger a first-order transition. These high-pressure regions could be understood assuming a real-space phase separation caused by concomitant electronic and structural instabilities.
In the quest of seeking higher and higher superconducting transition temperatures, the application of large hydrostatic pressures is an important tool. While the highest transition temperatures close to room temperatures were observed in conventional hydride superconductors under enormous pressures in the mega-pascal range [1, 2, 3], much lower pressures in the giga-pascal range are sufficient to boost superconductivity in unconventional superconductors, most notably in the copper-based [4] and in the iron-based [5] systems.
The family of the iron-chalcogenide FeSe has emerged as an enormously versatile system in which superconductivity can be tuned not only by hydrostatic pressure, but also by uniaxial strain, isovalent and charge doping, surface dosing, and chemical intercalation [6, 7, 8, 9, 10, 11, 12, 13, 14]. The richness of this system partially stems from its instability towards an electronic nematic phase at ambient conditions, and its proximity to a magnetic phase which is stabilized under high pressures [8]. Remarkably, it is possible to disentangle the electronic nematic and magnetic phases through a careful combination of iso-electronic doping of FeSe1-xSx with hydrostatic pressures [15], which allows one to study the contributions of their corresponding order parameter fluctuations to the superconducting pairing independently.
In particular, applied pressure studies of FeSe0.89S0.11 have provided unique access to an isolated nematic quantum critical point [16, 17]. Towards higher pressures, multiple studies identified a strongly enhanced superconducting phase with the transition temperature approaching values of K. However, the nature of this high-pressure phase and of the underlying electronic structure remains unclear, and previous studies produced partially contradictory results. In particular, a resistivity study reported enhanced superconductivity up to 8 GPa, and the emergence of a seemingly competing spin-density magnetic phase in the pressure range GPa [15]. In contrast, a subsequent susceptibility study did not find signatures of any magnetic order but observed a complete loss of the superconducting shielding at GPa [18]. Another recent transport and NMR study detected weak signatures for magnetism above GPa, and a gradual suppression of superconductivity beyond GPa [19]. In CuxFe1-xSe only magnetism was suppressed under pressure but superconductivity remained strong [20], whereas in thin flakes of FeSe, an unsual suppression of the magnetic and superconducting phases under pressure with decreasing flake thickness was observed [21]. Similarly, the sample thickness and the choice of pressure medium were found to strongly affect the boundaries of the superconducting phase in bulk FeSe above GPa, likely due to additional uniaxial stress along the direction [22].
In order to assess the nature of this enigmatic high-pressure phase in detail, we investigate the high-pressure regime of FeSe0.89S0.11 using transport and tunnel-diode oscillator (TDO) probes inside opposing Diamond Anvil Cells (DACs) up to GPa. We find that the superconducting transition temperature shows a minimum around GPa, before it increases towards K (onset) above GPa. Above GPa, we observe significant changes in the samples properties as the room-temperature normal state resistivity displays a sudden increase with pressure, whereas the low-temperature resistivity develops a marked fan of non-Fermi liquid behavior centered at . The superconducting transition broadens significantly above until it becomes incomplete as it fails to induce a zero-resistance state even at the lowest temperatures, where we detect an unusually small critical current density. Our study suggests that the high-pressure phase of single-crystalline FeSe0.89S0.11 suffers a structural instability above , likely to an orthorhombic symmetry, as reported on FeSe [8, 23]. As a result of the first-order nature of the structural transition, the system shows a pressure-induced cross-over from a metallic-like to a insulating-like behaviour which harbours a phase coexistence between superconducting/metallic and non-superconducting/semi-metallic domains. Within this picture, the observation of a quantum critical fan as a typical signature of a second-order electronic instability is unusual and it is interrupted by the first-order transition.
I Methods
Single crystals of FeSe1-xSx with sulfur substitution were grown using the KCl/AlCl3 chemical vapor transport method as described elsewhere [24]. High-pressure measurements were carried out using an opposing Diamond Anvil Cell (DAC) with a design similar to Refs. 25 and 26, using m bevelled culets. BeCu gaskets with an initial thickness between - m were pre-indented to m, and were subsequently drilled to produce a pressure chamber with a diameter of m. A thin layer of Stycast 1266:Alumina mixture was applied as gasket insulation, and the gasket was drilled again with a diameter of m. A total of five single crystals, all roughly , in dimensions were subjected to high-pressure transport measurements inside the DAC using Glycerol as pressure medium. Samples A and B were measured using a standard 4 contact configuration with the voltage contacts placed onto one of the longest sample edges to determine the longitudinal resistivity. For samples C and D, the voltage contacts were placed on opposing edges of the sample suitable for a Hall effect measurement. Sample N was measured using a 5 contact setup, allowing simultaneous longitudinal and Hall effect measurements. For comparison in the low-pressure limit, sample E was measured under ambient pressure only, equally with a 5 contact layout. Sample P was measured using a 5 contact layout inside a piston cylinder cell (PCC) using Daphne Oil 7373 as pressure transmitting medium, as previously reported in Refs. 16 and 17 (called Sample A there). All transport measurements were carried out using the AC LockIn technique with a low frequency and a low excitation current mA within the plane, unless stated otherwise. A further two single crystals were studied using the Tunnel Diode Oscillator (TDO) technique, using either Glycerol (TDO1) or a 4:1 mixture of Methanol:Ethanol (TDO2) as pressure media. The latter ensures hydrostatic conditions up to GPa, well beyond the highest pressure reported here, whereas the former shows non-hydrostatic behavior from 4-6 GPa onwards [27, 28, 25, 26]. In the TDO studies, we identify pressure-independent signatures associated with the superconducting transition temperatures of Pb, Sn and In, which occur in the solder joints outside the pressure cell. When they become superconducting, the quality factor of the circuit changes which affects the resonant frequency . For the DACs, we used the Ruby fluorescence technique at room temperature to determine the pressure inside the cell using multiple small Ruby chips. The reported pressures here correspond to the average before and after cooldown, and error bars indicate the difference which was usually below GPa. For the piston cylinder cell used for sample P, the pressure was determined from the superconducting transition temperature of Sn at low-temperatures. In order to compare the low- pressure scale of sample P reported before [16, 17] with the room-temperature pressure scales of the other samples reported here, the pressures determined for sample P were shifted by GPa for GPa and GPa for GPa to account for the pressure losses of Daphne 7373 during cool-downs. All high-pressure measurements were carried out on compression. Pressures were changed at room-temperature and the cells were allowed to relax until no change in pressure and the applied load could be resolved. Cooling rates were K/min except for sample N where higher rates were used.
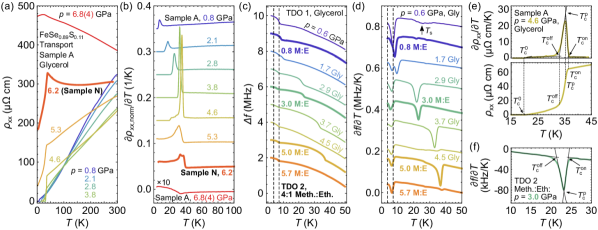
For a quantitative assessment of the evolution of superconductivity, we define four different superconducting transition temperatures, as exemplified in Figs. 1(e) and (f). Firstly, by fitting the derivatives of the resistivity and the TDO resonant frequency, or , respectively, the onset temperature is extracted from the crossing of tangents fitted to the high-temperature normal state data and the leading edge of the superconducting transition. Secondly, the peak temperature where the first derivatives show a maximum or minimum, respectively, is extracted from the crossing of tangents fitted to the leading and trailing edges of the transition. Thirdly, the offset temperature is defined analogously to , but using the trailing edge and the low-temperature data. Fourthly, we extract the true zero-resistance temperature when the signal falls below the noise level.
II Normal state and superconducting properties in zero magnetic field
II.1 Phase Diagram
Previous studies have established that at ambient pressure FeSe0.89S0.11 becomes superconducting below a sharp transition temperature K inside a nematic electronic phase below K [11, 29, 16, 30, 17, 19]. Upon application of hydrostatic pressure, the nematic transition temperature is quickly suppressed and a nematic quantum critical point is revealed around GPa as determined at low temperatures (corresponding to approximately GPa at the room-temperature pressure). Quantum oscillations have revealed the presence of a Lifshitz-like transition across the border of the nematic phase while the effective masses of the quasiparticles do not display divergent behaviour [30, 16].
Figures 1(a-d) show the temperature dependence of the zero-field resistivity and TDO resonant frequency for different single crystals of FeSe0.89S0.11 up to GPa. At the lowest pressure accessible with the Diamond Anvil Cell, the TDO data for GPa shows a weak anomaly around K, best visible as a dip in the temperature derivative shown in Fig. 1(d). We associate this anomaly with the nematic phase transition, in good agreement with previous reports using piston cylinder cells [16]. Moreover, Figs. 1(a-d) reveal clear signatures of superconducting phase transitions as either a sharp drop in the resistance, or a surge in the TDO resonant frequency. Interestingly, above GPa the superconducting transitions broaden significantly and become incomplete as the sharp drop in the resistance does not lead to a zero-resistance state anymore, as shown in Fig. 1(a). Therefore, in order to quantify the broadening and the loss of a fully superconducting phase, we will follow the evolution of four different superconducting transition temperatures, corresponding to the onset (), sharpest drop (), offset () and true zero-resistance (), as indicated in Figs. 1(e-f) and the Methods section.
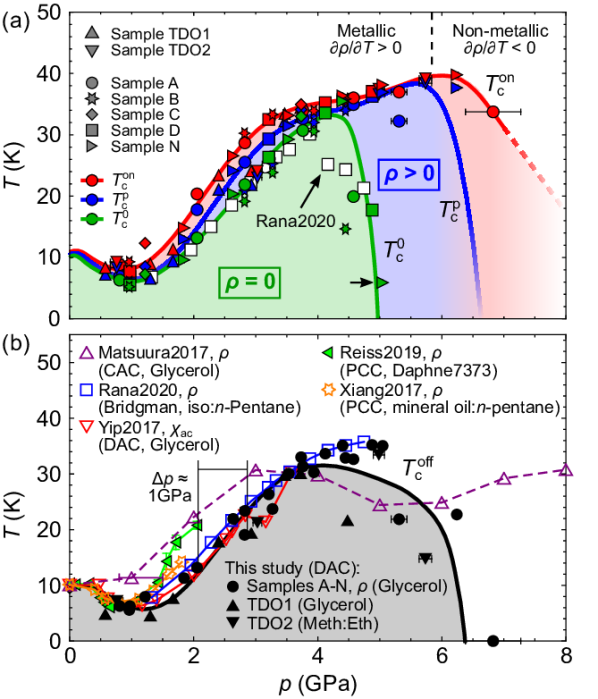
Figure 2 summarizes the evolution of the different superconducting transition temperatures in a detailed pressure-temperature phase diagram for all single crystals of FeSe0.89S0.11 studied here and in previous reports [18, 15, 29, 16, 19]. At the lowest pressures, the superconducting transition temperatures drop from K at ambient pressure towards a minimum K at a pressure of GPa, independent of the pressure technique or medium employed. In the intermediate pressure regime between , superconductivity is strongly enhanced and all critical temperatures continue to follow each other closely, reaching values close to K at 4.0 GPa. However, the highest values for are obtained for pressure techniques which ensure a more hydrostatic environment, such a piston cylinder cells or cubic anvil cells [15, 29, 16]. In contrast, studies performed using opposing anvil cells, as in this report and Ref. 18, display transition temperatures up to K lower, or shift the high-pressure, high- phase to higher pressures by GPa, as indicated in Fig. 2(b).
In the high pressure regime above GPa, the critical temperatures display divergent trends. Fig. 2 shows that the onset temperature keeps increasing for all samples studied and reaches a maximum close to K around GPa, remarkably similar to the maximum superconducting temperature of K detected in FeSe at GPa [10]. In contrast, the zero-resistance critical temperature and the temperature , marking the sharpest drop in the resistivity or the surge in the TDO resonant frequency, respectively, become strongly sample dependent. On average, drops quickly and vanishes around GPa, consistent with a previous report [19], whereas disappears around GPa. These distinct pressure dependencies of the critical temperatures , and suggest that the loss of superconductivity does not imply a closure of the gap, but rather an inhomogeneous and/or filamentary nature of superconductivity. This finding will be corroborated by the critical current studies that indicate a strongly reduced superconducting volume fraction, as discussed in Section III. Moreover, the alteration of the superconducting phase is consistent with a previous susceptibility study which identified a weakened diamagnetic shielding in the same pressure regime [18].
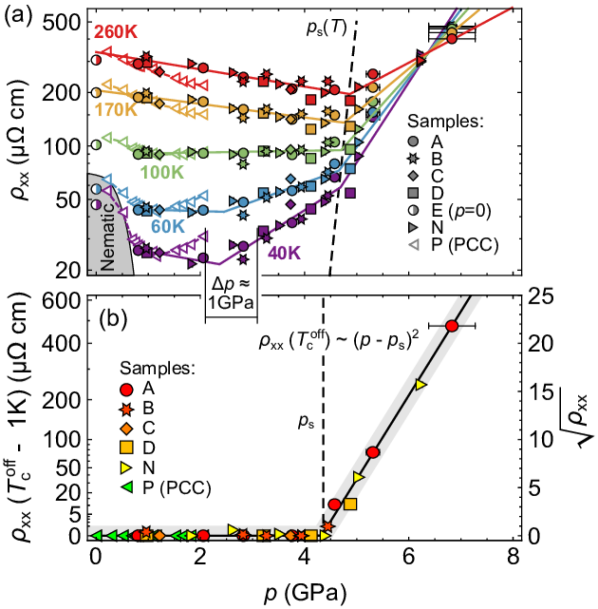
Mirroring the evolution of the superconducting transition temperatures with pressure, the overall behaviour of the resistivity is also very sensitive to the applied pressure in different regimes. To better quantify the relevant pressure ranges, Fig. 3(a) shows the isothermal evolution of the resistivity for all samples studied here. Initially, and at room temperature, the resistivity shows a continuous reduction for pressures GPa which appears consistent with an increasing electronic bandwidth as the orbital overlaps increase. In contrast, the low-temperature resistivity shows a more nuanced pressure dependence. At the lowest pressures, below GPa, a marked drop of the low-temperature resistivity is observed as the nematic phase is suppressed. This trend can be explained by a growing Fermi surface and a reduced quasiparticle mass, based on our previous high-pressure transport and quantum oscillation studies up to GPa [16]. Additionally, scattering off nematic and/or spin fluctuations as well as nematic domain boundaries within the nematic phase may further add to the low-pressure, low-temperature resistivity, but all effects get suppressed with increasing pressure [31, 32]. Upon further increasing the pressure, the low-temperature resistivity shows an upturn around GPa (sample P) or GPa (samples A-N). The corresponding pressure difference GPa between the resistivities of sample P and samples A-N is consistent with the pressure difference of their superconducting transition temperatures, as discussed above. Interestingly, for an intermediate temperature K, the resistivity appears essentially pressure independent between GPa and GPa, which corresponds to the visible crossing point of the resistivity curves in Fig. 1(a), similar to previous reports [16, 19]. Such a crossing could correspond to an electronic crossover from incoherent to coherent transport predicted for a Hund’s metal, or to a change in scattering or electronic correlations tuned by pressure [33].
Towards highest pressures, the evolution of the resistivity changes significantly at all temperatures. Figure 3(a) shows an upturn in the resistivity as a function of pressure at GPa. Since can be identified up to room temperature, we interpret it as a signature of a pressure induced structural transition. Figure 3(b) shows the residual resistivity just below the offset temperature which illustrates that the zero-resistivity superconducting state is lost above GPa. At higher pressures, the residual resistivity increases sharply as , signaling the emergence of a low-temperature resistive tail below the main superconducting transition. Eventually, the resistivity displays incomplete superconducting transition beyond GPa, as discussed above. This unusual loss of superconductivity is similar to previous studies of FeSe, where it was associated with a structural transition into a orthorhombic or possibly hexagonal phase [34, 8]. Therefore, the evolution of the normal and superconducting behavior at appear related and could be driven by a structural transition.
Importantly, the pressure GPa, at which there are substantial changes in the resistive and superconducting properties of FeSe0.89S0.11, is similar to the hydrostatic limit of the employed pressure medium Glycerol [28]. In order to test the influence of the pressure medium, we have performed a comparative study using the TDO technique with Glyercol and a 4:1 mixture of Methanol:Ethanol, which ensure hydrostatic conditions up to GPa [27, 28]. Figures 1(c) and (d) show the evolution of the resonant frequencies and their first derivatives, respectively, for both pressure media as a function of pressure and temperature. Since an estimation of the sample resistivity from the TDO frequency depends on precise knowledge of the experimental set up (sample and coil dimensions and any parasitic capacitance unavoidable in a pressure cell), we focus on the evolution of the superconducting transition only. Figs. 1(c) and (d) reveal that superconductivity is lost for both pressure media, albeit at a pressure about GPa larger when using Methanol:Ethanol compared to Glycerol. Therefore, the loss in superconductivity and the increase in resistivity are intrinsic to high-pressure FeSe0.89S0.11, but the exact pressure is affected by the transmitting medium.
II.2 Non-Fermi Liquid Behaviour
Despite the clear changes in the resistive and superconducting properties as well as their mutual correlation as a function of pressure, our multiple studies do not reveal signatures of any additional phase transition. The smooth temperature dependence of the isobar resistivity and the TDO resonant frequency (see Fig. 1), are in marked contrast to previous studies of FeSe1-xSx under high pressures. In the case of FeSe, the resistivity displays kink-like signatures at the onset of a SDW phase from pressure above GPa [8, 35, 29, 22], whereas FeSe0.88S0.12 shows weaker anomalies in resistivity in the range GPa [15]. We can rule out that any thermodynamic transition involving changes in the magnetic susceptibility occurs even within the superconducting phase as the TDO technique would be capable of detecting such transitions [36]. Furthermore, superconductivity survives in the high-pressure phase of FeSe and FeSe1-xSx for similar compositions when studied using a cubic anvil cell and no insulating behavior occurs up to GPa [8, 15] which clearly differs from our observations. In contrast, the observed loss of superconductivity under pressure observed here is consistent with a previous susceptibility study, using a similar pressure technique [18]. These seemingly contradictory results may point at a strong sensitivity of FeSe-based materials to uniaxial pressure arising from the thermal contraction of opposing anvil cells as employed here [25, 26] and in Ref. 18, combined with the additional effect induced by the sample thickness [22, 21].
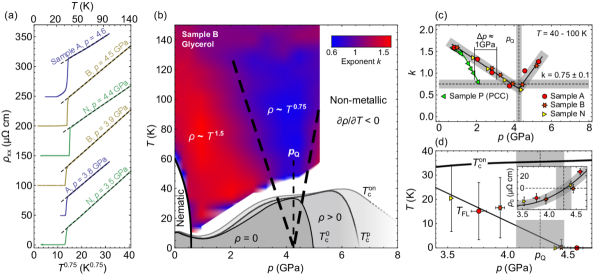
Yet, despite the absence of a signature of any long-range phase transition in the temperature dependence of the resistivity and TDO resonant frequency, we observe strong changes in the normal state properties at low temperatures which indicate that our samples are in the proximity to a pressure-induced electronic instability. Figure 4 summarizes the presence of a clear fan of non-Fermi liquid behavior in the resistivity, which is often regarded as a hall-mark of putative quantum critical behavior. The resistivity in the vicinity of displays a power-law form with for multiple samples, ranging from the onset of superconductivity up to K. To trace the pressure and temperature regimes where the exponent provides a valid description of the resistivity, we extract using a second derivative method as . A key advantage of this method is that it is independent of the knowledge of which is often unreliable to extract from high-temperature data. Figure 4(b) shows the pressure and temperature dependence of the exponent which reveals a fan-like structure above the superconducting dome for sample B, before the fan is truncated by non-metallic behavior from GPa onwards. Linearly extrapolating the low- and high-pressure edges of the fan to zero temperature, we find the fan to collapse to a point at GPa, close to the pressure scale identified above which is also the pressure close to the maximum of . The presence of a fan-like dependence of the resistivity exponent has been reported in many systems and it is typically regarded as a strong indicator for the presence of a putative quantum critical point (QCP) buried underneath the superconducting dome. A potential candidate for such behaviour could be an antiferromagnetic QCP, suggested to exist in the FeSe1-xSx under pressure, measured using a cubic anvil cell [8, 15].
Figure 4(c) shows that the analysis for the resistivity exponent gives consistent result for all samples measured using DACs, but differs in the pressure dependence from sample P measured in the piston cylinder cell. Here, was extracted over a fixed temperature interval between K and K outside the quantum critical fan from low pressures GPa and across the quantum critical fan at . At the lowest pressures, outside the nematic phase, we find for the DAC, in excellent agreement with sample P measured inside the piston cylinder cell, consistent with previous reports [37, 16]. For all samples measured in the DACs the exponent has a sample-independent pressure dependence and it is continuously reduced upon entering the quantum critical fan to reach a minimum of for GPa. Evidently, we detect a pressure offset in the evolution of in sample P (measured in a piston cylinder cell) by GPa around GPa (Figure 4(c)), which is consistent with the offset in and the absolute value of in this pressure range, shown in Figs. 2(b) and 3(b).
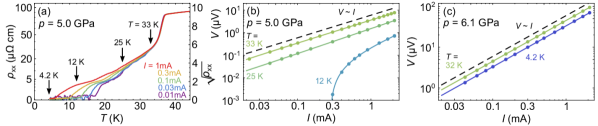
Figure 4(d) provides an additional test of the location of the quantum critical fan close to GPa. The inset shows the extracted values for as obtained from the fixed-exponent fits presented in Fig. 4(a). Evidently, for small pressures GPa, appears negative which is unphysical, in contrast to larger pressure GPa where a positive is obtained. This finding implies that for pressure lower than the putative quantum critical point, the resistivity must return to a larger exponent at low temperatures, e.g. return to Fermi liquid behavior with . We can make a rough estimate for such a Fermi liquid cross-over temperature by matching Fermi liquid and non-Fermi liquid behavior and requiring . The resulting K is shown in the main panel of Fig. 4(d). These values for are similar to our previous estimate close to the nematic quantum critical point where K was extracted for sample P [16]. Moreover, we find that is always lower than and thus cannot be resolved in Figure 4(b). This analysis also shows that a collapsing in the vicinity of is consistent within the experimental resolution.
Finally, we note that the extracted value of the resistivity exponent is unusual and differs from typical values for ferromagnetic or antiferromagnetic quantum criticality, in either 2D or 3D, and for clean or dirty systems [38, 39]. Hence, we cannot infer the nature of the QCP from this value. However, theoretical predictions for quantum critical exponents in transport measurements actually relate to the temperature dependence of the scattering rate , and not to the resistivity . Since the resistivity also depends on the charge carrier concentration and the effective mass , an explicit temperature dependence of these quantities will alter the observed resistivity exponent . Indeed, FeSe and related systems display a strong temperature dependence of the chemical potential [40] which manifests as a variation of the charge carrier density as a function of temperature. Additionally, inside the nematic phase, anisotropic scattering due to spin fluctuations may also become important [41, 42]. Further magnetotransport studies will be required to assess changes in scattering in the high-pressure phase of FeSe1-xSx.
III - Characteristic
We now turn to the nature of the high-pressure, low-temperature phase which displays a finite but incomplete superconducting phase. In order to separate normal metallic from partially superconducting resistances, we perform a --study to search for non-ohmic conduction and to determine the superconducting critical current density. Assuming an inhomogeneous superconducting phase with only filamentary superconducting paths, we would expect a strongly reduced critical current density , when measured across the entire sample, which should be the smallest close to . Figure 5(a) shows cooling curves on sample N at a pressure of GPa under different applied currents across the broad superconducting transition. At this pressure, the sample is tuned beyond , but it shows a distinct superconducting onset, and eventually a zero-resistance for all currents studied, see also Fig. 2. However, in contrast to expectations, we find a strongly current-dependent sample resistivity only for temperatures below K, whereas close to the onset and sharpest-drop , the resistivity is essentially current-independent, as shown in Fig. 5(b). By increasing the pressure towards GPa, shown in Fig. 5(c), we observe ohmic resistance at any temperature, despite a continuously well defined superconducting onset and sharp drop in the zero-field resistivity, cf. Fig. 1(a). This demonstrates that the high-pressure, low-temperature phase beyond cannot simply be understood as filamentary superconductivity, but a more complex model is required, as discussed below.
IV Summary and Discussion
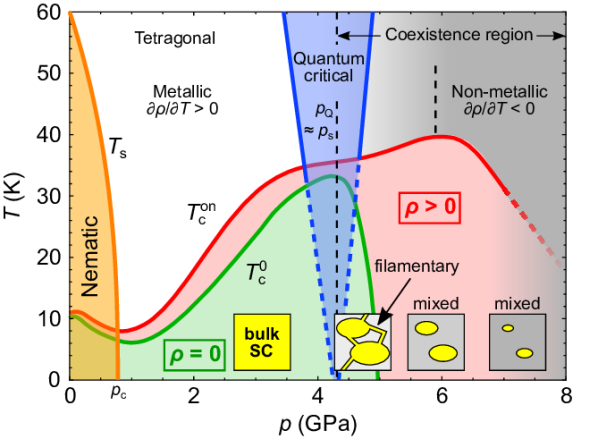
Our high-pressure study of the superconducting and normal state properties of FeSe0.89S0.11 reveals a complex pressure-temperature phase diagram, as summarized in Fig. 6. At very low pressures, the system displays a well-established nematic order below and [16, 17], before it becomes superconducting below K. Outside the nematic phase, first reaches a minimum of K at a pressure of GPa, before it surges towards K with increasing pressure. At high pressures, we observe a number of signatures in our transport data which suggest concomitant electronic and structural instabilities across GPa and GPa, respectively. Firstly, reaching up to room temperature, the resistivity shows a marked up-turn at , and the system develops a non-metallic temperature dependence. Secondly, we uncover clear signatures of non-Fermi liquid behavior at which suggests the presence of an electronic quantum critical point located at this pressure. Thirdly, the unusual - dependence clearly suggests a loss of the superconducting volume fraction, consistent with a previous susceptibility study [18].
The signatures of the high pressure phase could be explained considering a phase separation scenario, as sketched in Fig. 6. At low pressures, , the superconducting phase has sharp superconducting transitions and reaches the zero-resistance state, as shown in Fig. 1(a). Moreover, there is a large change in the TDO resonant frequency, as evident from Fig. 1(c), and a sizable response in a previous susceptibility study [18]. Therefore, this low-pressure superconducting phase reflects the bulk nature of the superconducting state of the single crystals. In contrast, in the high-pressure phase, a finite resistance remains at lowest temperatures which displays clear non-ohmic behaviour only close to , whereas the onset of the superconducting transition remains sharp and the finite resistance displays ohmic behaviour. This suggests that for temperatures just below , only isolated superconducting islands develop within an emerging non-metallic matrix but they fail to connect to provide a fully superconducting current path. Thus, a drop in the resistance is observed when the islands become superconducting, and any finite resistance measured in this temperature regime arises solely from the normal-state non-metallic matrix. In this case, the resistance should have ohmic behaviour and should essentially be current independent, as observed in Fig. 5. Upon further lowering the temperature, the remaining normal-state matrix gradually develops filamentary connections between the superconducting islands, which induce a strongly current dependent phase and non-ohmic resistance, as observed in Fig. 5. With increasing pressure, the superconducting islands shrink and gradually disappear which makes a filamentary connection unlikely. This development is fully consistent with the remaining but shrinking sharp drop of the sample resistance at and , even under a pressure of GPa, the fully ohmic resistance observed at any temperatures, and the lack of a zero-resistance phase. By increasing the pressure even further, the islands are lost eventually, and the drop in resistance disappears, as shown in Figs. 1(a).
The occurrence of a phase separation across is consistent with a structural first-order transition. Yet, the observation of signatures associated with quantum criticality at implies a second-order transition. The coexistence of such distinct transitions is highly unusual. Previous studies have reported pressure-induced structural transitions in FeSe1-xSx crystals at room temperature, however, they occur at much higher pressures than the low-temperature electronic instabilities. For example, FeSe displays signatures of a low-temperature SDW phase in the pressure range GPa which occurs together with a weak orthorhombic lattice distortion associated with the onset of the magnetic order. Yet, the system remains metallic in this pressure regime [8, 43, 23]. In contrast, a room-temperature structural instability from tetragonal towards orthorhombic and hexagonal phases in FeSe could be induced only at much higher pressures above GPa where non-metallic behavior was observed [8, 34, 23]. Similarly for FeSe0.88S0.12, it was suggested that a SDW phase is stabilized in the pressure range GPa from transport data anomalies, but no signatures of a non-metallic phase emerges at high pressures when using a cubic anvil cell [15]. A pressure-induced structural instability was detected for a similar compound at room temperatures beyond GPa only [44].
One interesting aspect of the pressure studies of FeSe1-xSx is that any discrepancies could be related to the different pressure media and pressure cell designs used in the experiments as well as the sample thickness. In the case of structural studies, often Helium is used as pressure medium which ensures a much more hydrostatic environment, as compared with Glycerol and 4:1 Methanol:Ethanol used here [23, 44]. Cubic anvil cells are also less prone to uniaxial thermal contractions than the opposing anvil cell used here [25, 26], and the resistivities display a zero-resistivity state beyond GPa [8, 15]. In contrast, studied performed with opposing anvil cell designs revealed a gradual loss of superconductivity around GPa and show good agreement with our study [18, 19]. This suggests that the concomitant structural and electronic instabilities could arise from finite uniaxial pressure components unavoidable in an opposing anvil cell setup. This assumption is supported by studies which demonstrated that the sample thickness and the choice of pressure medium can have profound influence on the stability of the SDW phase in FeSe [45, 21]. Thus, it is conceivable that finite uniaxial pressures along the crystallographic axis might trigger the structural transition around GPa. Indeed, many iron-based superconductors are very sensitive to uniaxial pressure components [46] and the electronic structure changes significantly with varying chalcogen height above the conducting Fe planes [47]. Interestingly, is remarkably similar to the hydrostatic limit of Glycerol which solidifies around GPa at room temperatures [28]. However, our TDO study demonstrates that superconductivity survives only to marginally higher pressures of GPa using a 4:1 mixture of Methanol:Ethanol as pressure medium, which has a solidification around GPa [27, 28]. This suggests that the structural and electronic instabilities are not directly triggered by the solidification of Glycerol.
A consequence of the concomitant first-order structural transition at and the second order electronic transition of possibly magnetic origin around is the inherent domain formation that would naturally lead to additional scattering of the charger-carriers. Interestingly, the resistivity trends observed under pressures can be compared with the evolution of the resistivity in the presence of strong impurity scattering in CuxFe1-xSe [48, 14]. The primary effect of the Cu-substitution is to disturb significantly the charge carrier transport in the Fe-planes, and thus to lead to a significant enhancement of scattering. As a result, the resistivity shows similar enhancements both in temperature dependence and in absolute values, as compared with those in the high-pressure phase, and additionally there is a strong reduction of charge carrier mobilities [14, 20]. On the other hand, the loss of superconductivity appears different in CuxFe1-xSe as the superconducting transition is strongly reduced with increasing Cu content. However, these distinct observations may be reconciled assuming the aforementioned phase separation between metallic/superconducting and non-metallic domains, respectively.
In summary, we have explored the high-pressure phase of the iron-based superconductor FeSe0.89S0.11. Our transport and TDO measurements revealed a strongly enhanced superconducting phase at high pressures, which gradually disappears beyond GPa as the system becomes non-metallic. This trend suggests the development of a phase separation triggered by an uniaxial pressure component induced first-order structural transition. At low temperatures, we revealed a fan-like structure of non-Fermi liquid behaviour towering above the superconducting phase which points towards a putative quantum critical point buried below. Our results reveal the occurrence of accidentally concomitant structural (first-order) and electronic (second-order) phase transitions which could explain the strongly reduced critical current density of the superconducting phase. These effects reported here emphasize the sensitivity of high- superconductivity of iron-chalcogenides to the structural and electronic degrees of freedom induced by uniaxial and hydrostatic pressures.
V Acknowledgments
We thank Sven Friedemann and Patricia Alireza for their valuable technical support setting up the high-pressure techniques in Oxford. We further acknowledge Matthew Watson for his previous measurement of sample E. This work was mainly supported by the EPSRC (EP/I004475/1, EP/I017836/1). P.R. and A.A.H. acknowledge financial support of the Oxford Quantum Materials Platform Grant (EP/M020517/1). Part of this work was supported by HFML-RU and LNCMI-CNRS, members of the European Magnetic Field Laboratory (EMFL) and by EPSRC (UK) via its membership to the EMFL (grant no. EP/N01085X/1). We acknowledge financial support of Oxford University John Fell Fund. Z.Z. acknowledges financial support from the EPSRC studentship (EP/N509711/1 and EP/R513295/1). A.I.C. acknowledges an EPSRC Career Acceleration Fellowship (EP/I004475/1) and Oxford Centre for Applied Superconductivity.
References
- Drozdov et al. [2015] A. P. Drozdov, M. I. Eremets, I. A. Troyan, V. Ksenofontov, and S. I. Shylin, Conventional superconductivity at 203 kelvin at high pressures in the sulfur hydride system, Nature 525, 73 (2015), arXiv:1506.08190 .
- Drozdov et al. [2019] A. P. Drozdov, P. P. Kong, V. S. Minkov, S. P. Besedin, M. A. Kuzovnikov, S. Mozaffari, L. Balicas, F. F. Balakirev, D. E. Graf, V. B. Prakapenka, E. Greenberg, D. A. Knyazev, M. Tkacz, and M. I. Eremets, Superconductivity at 250 K in lanthanum hydride under high pressures, Nature 569, 528 (2019), arXiv:1812.01561 .
- Grockowiak et al. [2022] A. D. Grockowiak, M. Ahart, T. Helm, W. A. Coniglio, R. Kumar, K. Glazyrin, G. Garbarino, Y. Meng, M. Oliff, V. Williams, N. W. Ashcroft, R. J. Hemley, M. Somayazulu, and S. W. Tozer, Hot Hydride Superconductivity Above 550 K, Frontiers in Electronic Materials 2, 1 (2022), arXiv:2006.03004 .
- Chu et al. [1993] C. W. Chu, L. Gao, F. Chen, Z. J. Huang, R. L. Meng, and Y. Y. Xue, Superconductivity above 150 K in HgBa2Ca2Cu3O8+δ at high pressures, Nature 365, 323 (1993).
- Sun et al. [2012] L. Sun, X.-J. Chen, J. Guo, P. Gao, Q.-Z. Huang, H. Wang, M. Fang, X. Chen, G. Chen, Q. Wu, C. Zhang, D. Gu, X. Dong, L. Wang, K. Yang, A. Li, X. Dai, H.-k. Mao, and Z. Zhao, Re-emerging superconductivity at 48 kelvin in iron chalcogenides, Nature 483, 67 (2012).
- Ge et al. [2014] J.-f. Ge, Z.-L. Liu, C. Liu, C.-l. Gao, D. Qian, Q.-k. Xue, Y. Liu, and J.-F. Jia, Superconductivity above 100 K in single-layer FeSe films on doped SrTiO3, Nature Materials 14, 285 (2014), arXiv:1406.3435 .
- Burrard-Lucas et al. [2013] M. Burrard-Lucas, D. G. Free, S. J. Sedlmaier, J. D. Wright, S. J. Cassidy, Y. Hara, A. J. Corkett, T. Lancaster, P. J. Baker, S. J. Blundell, and S. J. Clarke, Enhancement of the superconducting transition temperature of FeSe by intercalation of a molecular spacer layer, Nature Materials 12, 15 (2013).
- Sun et al. [2016] J. P. Sun, K. Matsuura, G. Z. Ye, Y. Mizukami, M. Shimozawa, K. Matsubayashi, M. Yamashita, T. Watashige, S. Kasahara, Y. Matsuda, J.-Q. Yan, B. C. Sales, Y. Uwatoko, J.-G. Cheng, and T. Shibauchi, Dome-shaped magnetic order competing with high-temperature superconductivity at high pressures in FeSe, Nature Communications 7, 12146 (2016), arXiv:1512.06951 .
- Wen et al. [2016] C. H. P. Wen, H. C. Xu, C. Chen, Z. C. Huang, X. Lou, Y. J. Pu, Q. Song, B. P. Xie, M. Abdel-Hafiez, D. A. Chareev, A. N. Vasiliev, R. Peng, and D. L. Feng, Anomalous correlation effects and unique phase diagram of electron-doped FeSe revealed by photoemission spectroscopy, Nature Communications 7, 10840 (2016).
- Sun et al. [2017] J. P. Sun, G. Z. Ye, P. Shahi, J.-Q. Yan, K. Matsuura, H. Kontani, G. M. Zhang, Q. Zhou, B. C. Sales, T. Shibauchi, Y. Uwatoko, D. J. Singh, and J.-G. Cheng, High- Tc Superconductivity in FeSe at High Pressure: Dominant Hole Carriers and Enhanced Spin Fluctuations, Physical Review Letters 118, 147004 (2017), arXiv:1611.07973 .
- Reiss et al. [2017] P. Reiss, M. D. Watson, T. K. Kim, A. A. Haghighirad, D. N. Woodruff, M. Bruma, S. J. Clarke, and A. I. Coldea, Suppression of electronic correlations by chemical pressure from FeSe to FeS, Physical Review B 96, 121103(R) (2017).
- Farrar et al. [2020] L. S. Farrar, M. Bristow, A. A. Haghighirad, A. McCollam, S. J. Bending, and A. I. Coldea, Suppression of superconductivity and enhanced critical field anisotropy in thin flakes of FeSe, npj Quantum Materials 5, 29 (2020).
- Ghini et al. [2021] M. Ghini, M. Bristow, J. C. A. Prentice, S. Sutherland, S. Sanna, A. A. Haghighirad, and A. I. Coldea, Strain tuning of nematicity and superconductivity in single crystals of FeSe, Physical Review B 103, 205139 (2021), arXiv:2102.11984 .
- Zajicek et al. [2022a] Z. Zajicek, S. J. Singh, H. Jones, P. Reiss, M. Bristow, A. Martin, A. Gower, A. McCollam, and A. I. Coldea, Drastic effect of impurity scattering on the electronic and superconducting properties of Cu-doped FeSe, Physical Review B 105, 115130 (2022a).
- Matsuura et al. [2017] K. Matsuura, Y. Mizukami, Y. Arai, Y. Sugimura, N. Maejima, A. Machida, T. Watanuki, T. Fukuda, T. Yajima, Z. Hiroi, K. Y. Yip, Y. C. Chan, Q. Niu, S. Hosoi, K. Ishida, K. Mukasa, S. Kasahara, J.-G. Cheng, S. K. Goh, Y. Matsuda, Y. Uwatoko, and T. Shibauchi, Maximizing by tuning nematicity and magnetism in FeSe1-xSx superconductors, Nature Communications 8, 1143 (2017).
- Reiss et al. [2020] P. Reiss, D. E. Graf, A. A. Haghighirad, W. Knafo, L. Drigo, M. Bristow, A. J. Schofield, and A. I. Coldea, Quenched nematic criticality and two superconducting domes in an iron-based superconductor, Nature Physics 16, 89 (2020).
- Reiss et al. [2021] P. Reiss, D. Graf, A. A. Haghighirad, T. Vojta, and A. I. Coldea, Signatures of a Quantum Griffiths Phase Close to an Electronic Nematic Quantum Phase Transition, Physical Review Letters 127, 246402 (2021).
- Yip et al. [2017] K. Y. Yip, Y. C. Chan, Q. Niu, K. Matsuura, Y. Mizukami, S. Kasahara, Y. Matsuda, T. Shibauchi, and S. K. Goh, Weakening of the diamagnetic shielding in FeSe1-xSx at high pressures, Physical Review B 96, 020502 (2017), arXiv:1705.07639 .
- Rana et al. [2020] K. Rana, L. Xiang, P. Wiecki, R. A. Ribeiro, G. G. Lesseux, A. E. Böhmer, S. L. Bud’ko, P. C. Canfield, and Y. Furukawa, Impact of nematicity on the relationship between antiferromagnetic fluctuations and superconductivity in FeSe0.91S0.09 under pressure, Physical Review B 101, 180503 (2020).
- Zajicek et al. [2022b] Z. Zajicek, S. J. Singh, and A. I. Coldea, Robust superconductivity and fragile magnetism induced by the strong Cu impurity scattering in the high-pressure phase of FeSe, Phys. Rev. Research 4, 043123 (2022b).
- Xie et al. [2021] J. Xie, X. Liu, W. Zhang, S. M. Wong, X. Zhou, Y. Zhao, S. Wang, K. T. Lai, and S. K. Goh, Fragile Pressure-Induced Magnetism in FeSe Superconductors with a Thickness Reduction, Nano Letters 21, 9310 (2021), arXiv:2110.15224 .
- Miyoshi et al. [2021] K. Miyoshi, S. Yamamoto, A. Shiota, T. Matsuoka, M. Ohe, Y. Yamamoto, and S. Nishigori, Disappearance and Survival of Superconductivity in FeSe under High Pressure, Journal of the Physical Society of Japan 90, 073706 (2021), arXiv:2103.16064 .
- Svitlyk et al. [2017] V. Svitlyk, M. Raba, V. Dmitriev, P. Rodière, P. Toulemonde, D. Chernyshov, and M. Mezouar, Complex biphase nature of the superconducting dome of the FeSe phase diagram, Physical Review B 96, 014520 (2017).
- Böhmer et al. [2016] A. E. Böhmer, V. Taufour, W. E. Straszheim, T. Wolf, and P. C. Canfield, Variation of transition temperatures and residual resistivity ratio in vapor-grown FeSe, Physical Review B 94, 024526 (2016).
- Moulding et al. [2020] O. Moulding, I. Osmond, F. Flicker, T. Muramatsu, and S. Friedemann, Absence of superconducting dome at the charge-density-wave quantum phase transition in -NbSe2, Physical Review Research 2, 043392 (2020), arXiv:2006.03422 .
- Moulding et al. [2022] O. Moulding, T. Muramatsu, C. J. Sayers, E. Da Como, and S. Friedemann, Suppression of charge-density-wave order in TiSe2 studied with high-pressure magnetoresistance, Electronic Structure 4, 035001 (2022).
- Jayaraman [1983] A. Jayaraman, Diamond anvil cell and high-pressure physical investigations, Reviews of Modern Physics 55, 65 (1983).
- Tateiwa and Haga [2009] N. Tateiwa and Y. Haga, Evaluations of pressure-transmitting media for cryogenic experiments with diamond anvil cell, Review of Scientific Instruments 80, 10.1063/1.3265992 (2009), arXiv:1001.0454 .
- Xiang et al. [2017] L. Xiang, U. S. Kaluarachchi, A. E. Böhmer, V. Taufour, M. A. Tanatar, R. Prozorov, S. L. Bud’ko, and P. C. Canfield, Dome of magnetic order inside the nematic phase of sulfur-substituted FeSe under pressure, Physical Review B 96, 024511 (2017).
- Coldea et al. [2019] A. I. Coldea, S. F. Blake, S. Kasahara, A. A. Haghighirad, M. D. Watson, W. Knafo, E. S. Choi, A. McCollam, P. Reiss, T. Yamashita, M. Bruma, S. C. Speller, Y. Matsuda, T. Wolf, T. Shibauchi, and A. J. Schofield, Evolution of the low-temperature Fermi surface of superconducting FeSe1-xSx across a nematic phase transition, npj Quantum Materials 4, 2 (2019), arXiv:1611.07424 .
- Wiecki et al. [2018] P. Wiecki, K. Rana, A. E. Böhmer, Y. Lee, S. L. Bud’ko, P. C. Canfield, and Y. Furukawa, Persistent correlation between superconductivity and antiferromagnetic fluctuations near a nematic quantum critical point in FeSe1-x Sx, Physical Review B 98, 1 (2018).
- Kuwayama et al. [2019] T. Kuwayama, K. Matsuura, Y. Mizukami, S. Kasahara, Y. Matsuda, T. Shibauchi, Y. Uwatoko, and N. Fujiwara, 77Se-NMR Study under Pressure on 12%-S Doped FeSe, Journal of the Physical Society of Japan 88, 033703 (2019), arXiv:1902.09133 .
- Haule and Kotliar [2009] K. Haule and G. Kotliar, Coherence–incoherence crossover in the normal state of iron oxypnictides and importance of Hund’s rule coupling, New Journal of Physics 11, 025021 (2009), arXiv:0805.0722 .
- Medvedev et al. [2009] S. Medvedev, T. M. McQueen, I. A. Troyan, T. Palasyuk, M. I. Eremets, R. J. Cava, S. Naghavi, F. Casper, V. Ksenofontov, G. Wortmann, and C. Felser, Electronic and magnetic phase diagram of -Fe1.01Se with superconductivity at 36.7 K under pressure, Nature Materials 8, 630 (2009), arXiv:0903.2143 .
- Terashima et al. [2015] T. Terashima, N. Kikugawa, S. Kasahara, T. Watashige, T. Shibauchi, Y. Matsuda, T. Wolf, A. E. Böhmer, F. Hardy, C. Meingast, H. von Löhneysen, and S. Uji, Pressure-induced antiferromagnetic transition and phase diagram in FeSe, Journal of the Physical Society of Japan 84, 1 (2015), arXiv:1502.03548 .
- Lin et al. [2020] W.-C. Lin, D. J. Campbell, S. Ran, I.-L. Liu, H. Kim, A. H. Nevidomskyy, D. Graf, N. P. Butch, and J. Paglione, Tuning magnetic confinement of spin-triplet superconductivity, npj Quantum Materials 5, 68 (2020), arXiv:2002.12885 .
- Bristow et al. [2020] M. Bristow, P. Reiss, A. A. Haghighirad, Z. Zajicek, S. J. Singh, T. Wolf, D. E. Graf, W. Knafo, A. McCollam, and A. I. Coldea, Anomalous high-magnetic field electronic state of the nematic superconductors FeSe1-xSx, Physical Review Research 2, 013309 (2020), 1904.02522 .
- Rosch [1999] A. Rosch, Interplay of Disorder and Spin Fluctuations in the Resistivity near a Quantum Critical Point, Physical Review Letters 82, 4280 (1999), arXiv:9810260 [cond-mat] .
- Brando et al. [2016] M. Brando, D. Belitz, F. M. Grosche, and T. R. Kirkpatrick, Metallic quantum ferromagnets, Reviews of Modern Physics 88, 025006 (2016), 1502.02898 .
- Rhodes et al. [2017] L. C. Rhodes, M. D. Watson, A. A. Haghighirad, M. Eschrig, and T. K. Kim, Strongly enhanced temperature dependence of the chemical potential in FeSe, Physical Review B 95, 195111 (2017), arXiv:1702.06321 .
- Farrar et al. [2022] L. S. Farrar, Z. Zajicek, A. B. Morfoot, M. Bristow, O. S. Humphries, A. A. Haghighirad, A. McCollam, S. J. Bending, and A. I. Coldea, Unconventional localization of electrons inside of a nematic electronic phase, Proceedings of the National Academy of Sciences 119, 10.1073/pnas.2200405119 (2022).
- Watson et al. [2015] M. D. Watson, T. Yamashita, S. Kasahara, W. Knafo, M. Nardone, J. Béard, F. Hardy, A. McCollam, A. Narayanan, S. F. Blake, T. Wolf, A. A. Haghighirad, C. Meingast, A. J. Schofield, H. v. Löhneysen, Y. Matsuda, A. I. Coldea, and T. Shibauchi, Dichotomy between the Hole and Electron Behavior in Multiband Superconductor FeSe Probed by Ultrahigh Magnetic Fields, Physical Review Letters 115, 027006 (2015).
- Kothapalli et al. [2016] K. Kothapalli, A. E. Böhmer, W. T. Jayasekara, B. G. Ueland, P. Das, A. Sapkota, V. Taufour, Y. Xiao, E. Alp, S. L. Bud’ko, P. C. Canfield, A. Kreyssig, and A. I. Goldman, Strong cooperative coupling of pressure-induced magnetic order and nematicity in FeSe, Nature Communications 7, 12728 (2016), arXiv:1603.04135 .
- Nikiforova et al. [2021] Y. A. Nikiforova, A. G. Ivanova, K. V. Frolov, I. S. Lyubutin, D. A. Chareev, A. O. Baskakov, S. S. Starchikov, I. A. Troyan, M. V. Lyubutina, P. G. Naumov, and M. Abdel-Hafiez, Crystal structure and phase transitions at high pressures in the superconductor FeSe0.89S0.11, Journal of Alloys and Compounds 860, 158419 (2021), 2009.11223 .
- Miyoshi et al. [2014] K. Miyoshi, K. Morishita, E. Mutou, M. Kondo, O. Seida, K. Fujiwara, J. Takeuchi, and S. Nishigori, Enhanced Superconductivity on the Tetragonal Lattice in FeSe under Hydrostatic Pressure, Journal of the Physical Society of Japan 83, 013702 (2014), 1310.7546 .
- Gati et al. [2020] E. Gati, L. Xiang, S. L. Bud’ko, and P. C. Canfield, Hydrostatic and Uniaxial Pressure Tuning of Iron‐Based Superconductors: Insights into Superconductivity, Magnetism, Nematicity, and Collapsed Tetragonal Transitions, Annalen der Physik 532, 2000248 (2020), arXiv:2005.09791 .
- Moon and Choi [2010] C.-Y. Moon and H. J. Choi, Chalcogen-Height Dependent Magnetic Interactions and Magnetic Order Switching in , Phys. Rev. Lett. 104, 057003 (2010).
- Gong et al. [2021] C. Gong, S. Sun, S. Wang, and H. Lei, Normal and superconducting state properties of Cu-doped FeSe single crystals, Physical Review B 103, 174510 (2021).