Early Results from GLASS-JWST. XIX: A High Density of Bright Galaxies at in the Abell 2744 Region
Abstract
We report the detection of a high density of redshift galaxies behind the foreground cluster Abell 2744, selected from imaging data obtained recently with NIRCam onboard JWST by three programs — GLASS-JWST, UNCOVER, and DDT#2756. To ensure robust estimates of the lensing magnification , we use an improved version of our model that exploits the first epoch of NIRCam images and newly obtained MUSE spectra, and avoids regions with where the uncertainty may be higher. We detect seven bright galaxies with demagnified rest-frame mag, over an area of sq. arcmin. Taking into account photometric incompleteness and the effects of lensing on luminosity and cosmological volume, we find that the density of galaxies in the field is about () larger than the average at mag reported so far. The density is even higher when considering only the GLASS-JWST data, which are the deepest and the least affected by magnification and incompleteness. The GLASS-JWST field contains 5 out of 7 galaxies, distributed along an apparent filamentary structure of 2 Mpc in projected length, and includes a close pair of candidates with mag having a projected separation of only 16 kpc. These findings suggest the presence of a overdensity in the field. In addition to providing excellent targets for efficient spectroscopic follow-up observations, our study confirms the high density of bright galaxies observed in early JWST observations, but calls for multiple surveys along independent lines of sight to achieve an unbiased estimate of their average density and a first estimate of their clustering.
1 Introduction
In just a few months, JWST has started to transform our understanding of the epoch of “cosmic dawn,” when the first sources of light likely started reionizing the intergalactic medium (Dayal & Ferrara, 2018; Robertson, 2022). Previous Hubble Space Telescope (HST) and ground-based surveys enabled a census of galaxies at redshift –8, about 1 Gyr after the Big Bang (e.g., Finkelstein et al., 2015; Castellano et al., 2016a; Bouwens et al., 2021), and the first investigations of galaxies at –11 (Ellis et al., 2013; Bouwens et al., 2016; McLeod et al., 2016; Ishigaki et al., 2018; Oesch et al., 2018; Morishita et al., 2018; Stefanon et al., 2019; Bowler et al., 2020; Roberts-Borsani et al., 2022a; Leethochawalit et al., 2022a; Bagley et al., 2022). The public datasets gathered through the JWST Early Release Observations (Pontoppidan et al., 2022) and Early Release Science Programs have enabled the detection of tens of candidate sources at , pushing the cosmic frontier beyond the limits of HST-WFC3 to the first 200–300 Myr after the Big Bang (e.g., Castellano et al., 2022a; Donnan et al., 2023; Finkelstein et al., 2022a; Morishita & Stiavelli, 2022; Naidu et al., 2022a; Yan et al., 2022; Roberts-Borsani et al., 2022b; Robertson et al., 2022; Bunker et al., 2023).
The results have been surprising: multiple independent analyses have shown that the number density of bright galaxies at is larger than predicted by theoretical models or on the basis of the extrapolation from lower-redshift estimates (e.g., Finkelstein et al., 2023; Harikane et al., 2023; Bouwens et al., 2022b, 2023; Pérez-González et al., 2023). This excess is most pronounced in the brightest part of the luminosity function (LF), which seems to evolve very little from to –12. This result is particularly tantalizing, because the brightest objects are detected at high significance in multiple bands and display a deep break, and are thus unlikely to be significantly contaminated by low-redshift interlopers (e.g., Fujimoto et al., 2022).
The origin of this excess is still to be determined — it can be due either to a higher efficiency in star formation and galaxy assembly than previously thought, which makes them more abundant and/or massive, or to deviations from common prior assumptions on their physical properties [e.g., the initial mass function (IMF), metallicity, and/or dust content] that increase their flux (Ferrara et al., 2022; Mason et al., 2023; Haslbauer et al., 2022; Kohandel et al., 2022; Ziparo et al., 2022; Fiore et al., 2022). More extreme explanations refer to nonstandard cosmological models to increase the abundance of bright and/or massive objects at very high redshift (e.g., Melia, 2014, 2023; Boylan-Kolchin, 2022; Menci et al., 2022; Kannan et al., 2022).
Among the various fields targeted by early JWST surveys, the first observations of a flanking field to the Hubble Frontier Field (HFF) cluster Abell 2744 (A2744 hereafter; Lotz et al., 2014; Castellano et al., 2016b) within the GLASS-JWST project delivered two of the brightest candidates at , dubbed GHZ1/GLASSz10 (at ) and GHZ2/GLASSz12 (at ) (Castellano et al. 2022a, C22a hereafter; Naidu et al. 2022a; Bakx et al. 2023; Donnan et al. 2023; Harikane et al. 2023; Yoon et al. 2022). Compared to other detections (or lack thereof) in other and often larger fields, the GLASS-JWST field immediately qualified itself as one of the most interesting areas to investigate the most luminous sources at cosmic dawn.
Recently, more data have been obtained on the A2744 area by a number of JWST programs: the second epoch of the GLASS-JWST Early Release Science Program (JWST-ERS-1324; Treu et al., 2022), the UNCOVER program (PIs Labbé and Bezanson, JWST-GO#2561; Bezanson et al., 2022), and the DDT program #2756 (PI Wenlei Chen), which significantly extend and deepen the surveyed area. We take advantage of these new data and present here an analysis of the abundance of galaxies at –11 selected in the NIRCam imaging data in the entire A2744 region, with two goals: (i) improve the determination of the density of bright galaxies at , and (ii) start to characterize the clustering properties of this population.
2 NIRCam imaging and photometry
| Filter | GLASS-JWST | DDT | UNCOVER |
|---|---|---|---|
| F090W | 29.5 | - | - |
| F115W | 29.7 | 28.2 | 29.1 |
| F150W | 29.5 | 28.3 | 29.0 |
| F200W | 29.6 | 28.6 | 29.0 |
| F277W | 29.8 | 28.8 | 29.3 |
| F356W | 29.9 | 28.8 | 29.4 |
| F410M | - | - | 28.8 |
| F444W | 29.6 | 28.6 | 28.9 |
Note. — 5 depths (mag) for point sources within a circular aperture of diameter .
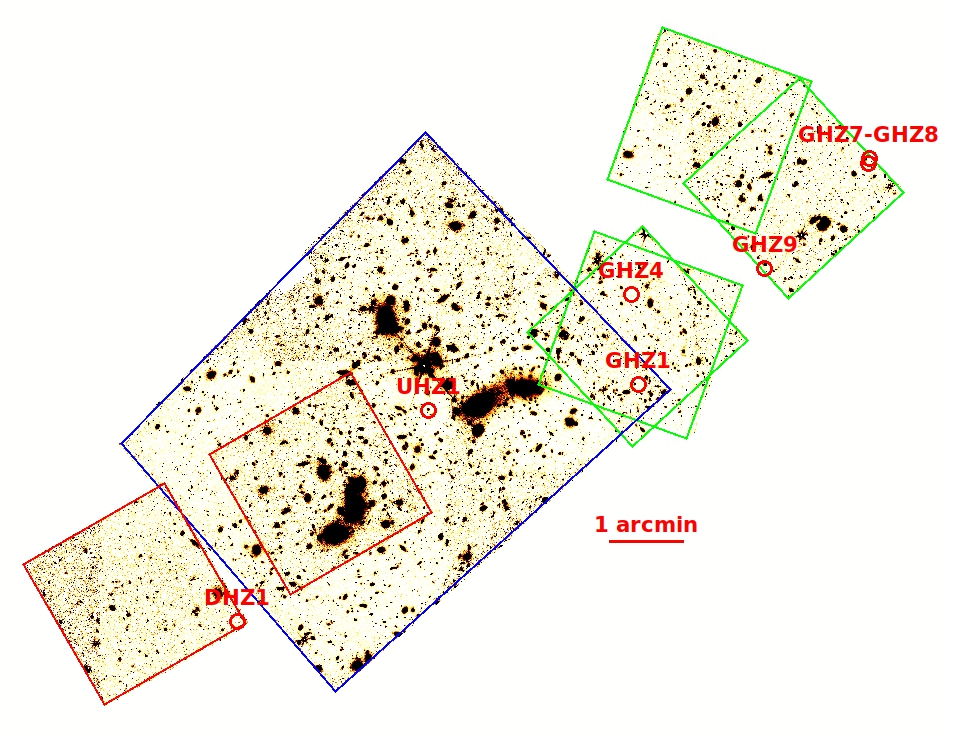
The NIRcam data analyzed in this paper are taken from three programs focused on the cluster A2744 and its surroundings. The GLASS-JWST NIRCam images have been taken in parallel to NIRISS on June 28–29, 2022, and in parallel to NIRSpec on Nov. 10–11, 2022. They consist of imaging through seven broad-band filters spanning from F090W to F444W as described by Treu et al. (2022). The UNCOVER NIRCam observations of the cluster A2744 were taken on November 2, 4, 7, and 15, and exploit the same filter set as GLASS-JWST, except that the F090W filter is replaced with F410M. Finally, NIRCAM imaging of A2744 was obtained as part of DDT program 2756 on October 20. The DDT-2756 (DDT, hereafter) filter set is the same as GLASS-JWST with the exception of the F090W filter, and overall shorter exposure times. The pointings overlap partially, resulting in the field geometry illustrated in Figure 1 (top).
The image reduction, and the methods used to detect sources and measure multiband photometry, build on those described by Merlin et al. (2022), and take into account the improvements in data processing and calibration that have become available since then.
| ID | F090W | F115W | F150W | F200W | F277W | F356W | F410M | F444W |
|---|---|---|---|---|---|---|---|---|
| GHZ1 | 2.4 2.3 | -2.1 2.3 | 62.1 2.8 | 78.8 2.5 | 78.7 2.2 | 81.7 2.0 | - | 111.8 4.4 |
| GHZ4 | -7.7 4.9 | -4.4 4.9 | 29.9 5.7 | 32.8 5.3 | 34.2 4.3 | 27.2 3.9 | - | 41.7 3.1 |
| GHZ7 | -0.9 2.4 | 0.03 2.3 | 32.4 2.5 | 38.2 2.3 | 30.9 1.8 | 25.9 1.7 | - | 28.8 3.6 |
| GHZ8 | -1.3 4.1 | -0.1 3.9 | 51.9 4.4 | 70.3 4.1 | 55.0 3.1 | 49.8 2.9 | - | 53.7 5.2 |
| GHZ9 | 3.3 2.2 | 2.2 2.1 | 29.5 2.4 | 24.2 2.2 | 31.2 1.8 | 35.8 1.6 | - | 40.9 3.9 |
| UHZ1 | - | 4.1 6.5 | 94.0 6.6 | 100.6 6.9 | 75.4 4.5 | 65.6 3.6 | 90.9 6.7 | 87.7 7.2 |
| DHZ1 | - | 22.3 12.5 | 397.4 11.9 | 418.6 10.2 | 309.9 7.2 | 300.2 6.8 | - | 353.3 17.9 |
Note. — Fluxes in nJy, not corrected for magnification.
A detailed description is given in a companion paper by Paris et al. (2023). For convenience of the reader, we briefly summarize below the information relevant for the present paper. Data reduction and flux calibration were obtained using the official JWST pipeline111https://jwst-docs.stsci.edu/jwst-science-calibration-pipeline-overview and exploiting the calibration files jwst_1019.pmap made available by STScI in November 2022. We then used a pipeline already adopted in similar projects (Fontana et al., 2014), based on SCAMP (Bertin, 2006) and SWarp (Bertin et al., 2002), to combine the single exposures into mosaics projected onto a common grid of pixels. For simplicity, considering the different depth and filter coverage of the three programs, and the need to perform simulations to assess the incompleteness in color space, we analyzed the three datasets independently and performed the simulations on each dataset separately. To avoid double counting and keep the fields independent from each other, certain regions were excluded from a given dataset; in practice, the UNCOVER NW corner was analyzed together with GLASS-JWST observations, and the portion of the DDT pointing that overlaps with UNCOVER was analyzed as part of the latter.
Objects were detected using a customized version of SExtractor (Bertin & Arnouts, 1996; Guo et al., 2013, v2.8.6) on the F444W coadded images. Total F444W fluxes in elliptical apertures as defined by Kron (1980) were measured with a-phot (Merlin et al., 2019). Fluxes in the other bands were measured with a-phot in several apertures at the positions of the detected sources using images point-spread-function (PSF)-matched to the F444W one. In the present analysis we use fluxes obtained by scaling the total F444W flux on the basis of the relevant color in FWHM diameter () apertures.
The mosaics are a combination of different exposures resulting in nonuniform depths. We summarize in Table 1 the typical 5 depths of the deepest regions for point sources within a circular aperture of diameter . Less-exposed regions can be 0.2–0.3 mag shallower depending on the band and field. The regions close to the cluster core are potentially affected by flux contamination from the intracluster light (ICL) (e.g., Merlin et al., 2016). We checked for possible systematics by injecting fake sources in different positions within the UNCOVER field. We found no photometric offset, indicating that the ICL contribution is effectively suppressed by the background-subtraction procedures adopted to build the final mosaics.
We estimate total, nonoverlapping areas of 22.5, 10.2, and 4.6 sq. arcmin in the UNCOVER, GLASS-JWST, and DDT fields (respectively) available for the selection of high-redshift candidates by considering the regions observed in all bands, and excluding the pixels occupied by foreground sources.
3 Selected galaxies at
We select objects at –11.5 using the color-color selection window defined by C22a:
| ID | R.A. | Dec | SFR | UV slope | ||||||
|---|---|---|---|---|---|---|---|---|---|---|
| deg. | deg. | mag | yr-1 | |||||||
| GHZ1 | 3.511929 | -30.371859 | -20.36 | 10.47 | 10.39 | 10.54 | 10.7 | 11.5 | -1.930.07 | 1.71 |
| GHZ4 | 3.513739 | -30.351561 | -19.44 | 10.27 | 10.11 | 10.43 | 2.0 | 4.3 | -2.310.36 | 1.66 |
| GHZ7 | 3.451363 | -30.320718 | -20.06 | 10.62 | 9.97 | 10.57 | 3.2 | 2.1 | -2.660.15 | 1.20 |
| GHZ8 | 3.451430 | -30.321796 | -20.73 | 10.85 | 10.14 | 10.79 | 17.5 | 0.8 | -2.600.14 | 1.20 |
| GHZ9 | 3.478756 | -30.345520 | -19.33 | 9.35 | 9.48 | 9.40 | 14.4 | 3.3 | -1.920.13 | 1.33 |
| DHZ1 | 3.617257 | -30.425565 | -21.61 | 9.31270.0002a | 25.4 | 25 | -1.800.08 | 1.66 | ||
| UHZ1 | 3.567065 | -30.377857 | -19.79 | 10.32 | 9.88 | 9.99 | 4.5 | 0.4 | -2.720.15 | 3.72 |
Note. — The demagnified, rest-frame have been obtained at the best-fit zphot redshift, and the uncertainties include the contribution of both photometry and magnification. Stellar masses and SFRs have been obtained at the best-fit zphot redshift as in Santini et al. (2022) and corrected for magnification. Uncertainties include error contribution from SED fitting and magnification. The UV slope is measured by fitting the F200W, F277W, and F356W bands; the uncertainties in the fit account for photometric errors (Castellano et al., 2012). The uncertainties in the magnification are at the 68% confidence level; see Sect. 4.1. aSpectroscopic redshift from Boyett et al. (2023). All properties of DHZ1 have been measured fixing the redshift at the spectroscopic value.
We require signal-to-noise ratio (SNR) in the F444W band, SNR in the other bands redward of the Lyman break, and SNR in the F090W band, where available. The selection yields 5 candidates in the GLASS-JWST field, 2 in UNCOVER, and 1 in the DDT region. The JWST photometry of the candidates is listed in Table 2.
The five selected objects in GLASS-JWST include GHZ1 and GHZ4 from C22a, and three galaxies in the region recently observed in the NIRSpec parallel and discussed here for the first time. In UNCOVER we select a new robust candidate UHZ1 with mag, outside of the area previously observed by the HFF. We note that object JD1B from Zitrin et al. (2014), recently confirmed to be at with NIRSpec (Roberts-Borsani et al., 2022b), is also formally selected by our criteria. However, we will not further discuss object JD1B, one of the multiple images of a strongly magnified ultrafaint galaxy, and it will not be used to estimate the ultraviolet (UV) LF in the present analysis which is limited to moderate-magnification regions (see Sect. 4). We checked the other counterimages reported by Zitrin et al. (2014), finding that JD1A is just outside the color-selection region, while the faintest one (JD1C) is not detected likely owing to the strong background in the F444W band from a nearby cluster galaxy. The nondetection of JD1A and in particular of JD1C are not surprising, considering the selection completeness level in the UNCOVER field (see Sect. 5) and that the catalog extraction is not optimized for the analysis of the inner cluster regions affected by significant crowding. The only candidate selected in the DDT program is also the brightest in the sample, with mag.
Objects GHZ1, GHZ4, and GHZ9 (from GLASS-JWST), and the UNCOVER and DDT candidates, have also been observed with HST under the HFF and BUFFALO (Steinhardt et al., 2020) programs. We further assessed their reliability by measuring the SNR at their position in the F606W, F814W, and F105W mosaics processed with the grizli pipeline (Brammer, 2022) in 02 diameter apertures, finding SNR in all cases.
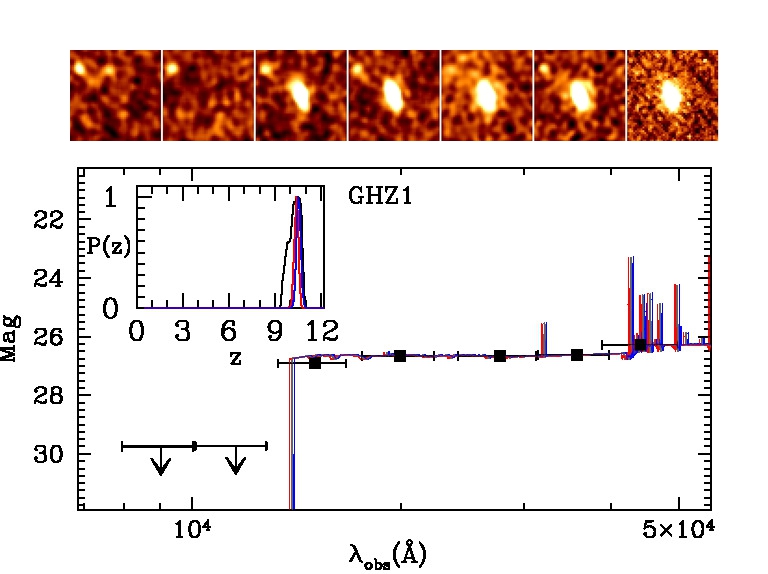
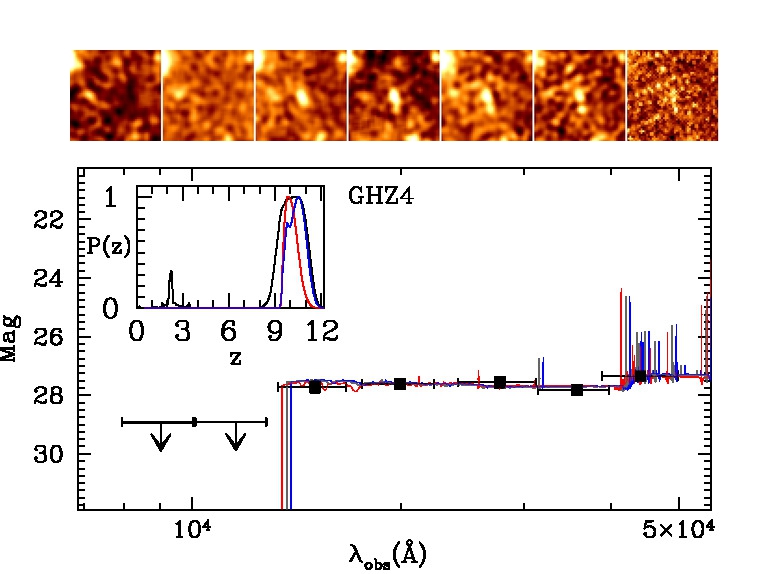
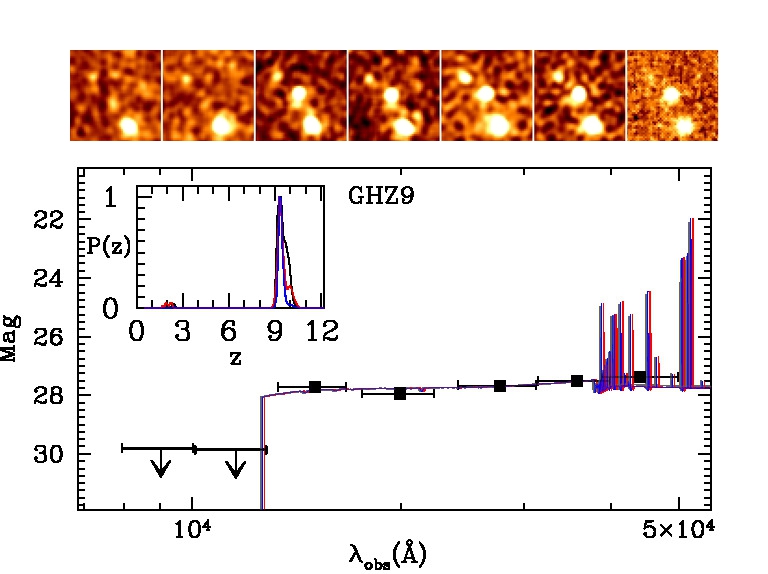
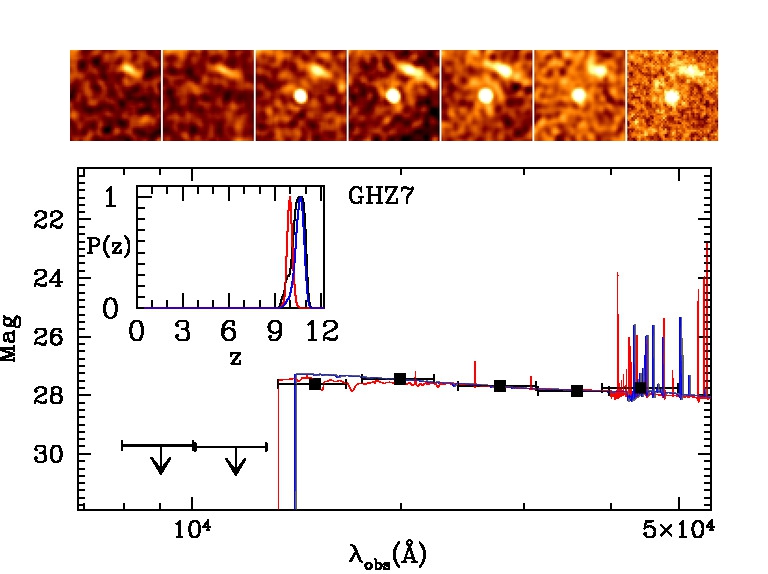
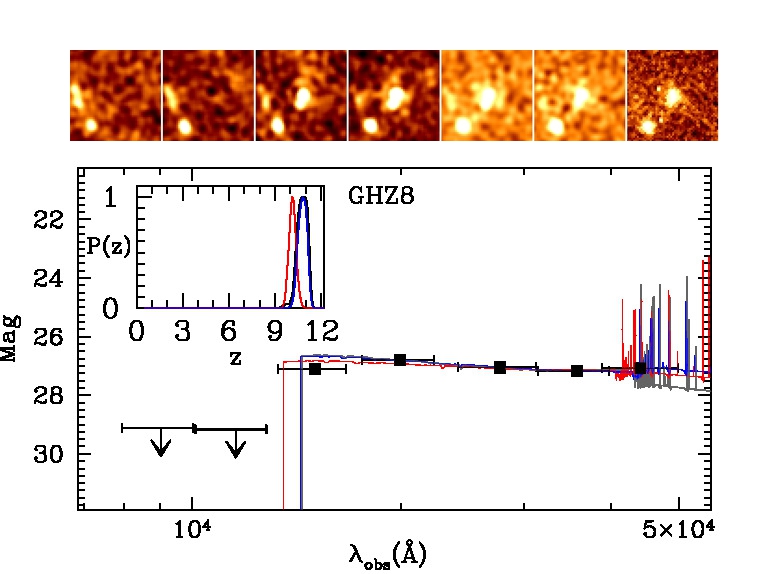
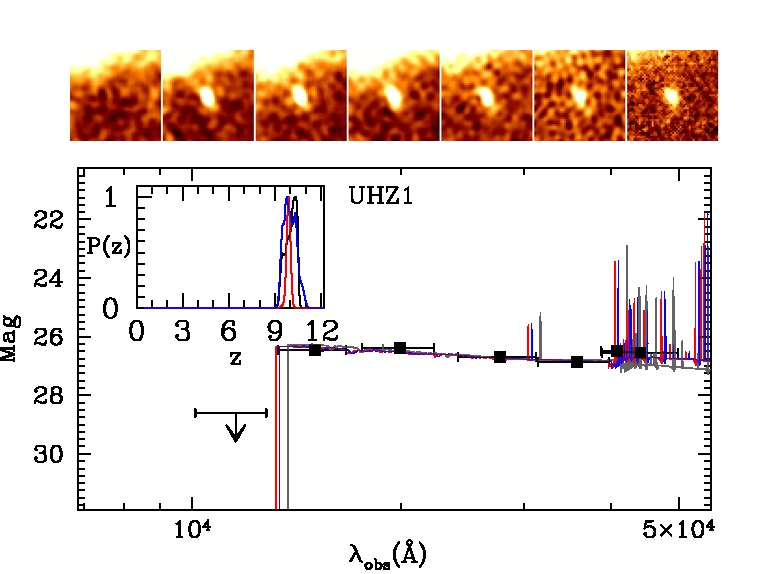
For all selected candidates we estimate photometric redshifts with EAzY (Brammer et al., 2008) and zphot (Fontana et al., 2000). The EAzY code was run assuming a flat prior with two different sets of templates: the default V1.3 spectral template (see Leethochawalit et al., 2022b), and the recently released templates by Larson et al. (2022) specifically designed for the analysis of JWST-selected galaxies at very high redshift. The analysis with zphot has been performed as described by Santini et al. (2022) by fitting the observed photometry with Bruzual & Charlot (2003, BC03 hereafter) templates having both declining and delayed star-formation histories; it models the contribution from nebular continuum and line emission following Schaerer & de Barros (2009) and Castellano et al. (2014). We show spectral energy distributions (SEDs), photometric redshift probability distributions, and thumbnails of the seven candidates in Figs. 2 and 3. Their properties are listed in Table 3, including demagnified and values based on the lensing model that will be discussed in Sect. 4.1.
The two objects GHZ1 and GHZ4 from C22a fall in the region recently reobserved in parallel to NIRSpec. Reassuringly, their SEDs and photometric redshifts obtained from the new data are in excellent agreement with those measured in the first GLASS-JWST NIRCam observations, with the deeper data analyzed here reducing the likelihood of the secondary photometric redshift solution at for GHZ4. Candidate GHZ1 also falls in the area that we have removed from the UNCOVER field to avoid duplications. The availability of the lensing model extending to the GLASS-JWST region allows us to estimate that they are moderately magnified, such that the intrinsic are –0.6 mag fainter than the estimates reported in our previous paper. The three newly found candidates in the newly observed GLASS-JWST area have observed –27.3 mag and similar SEDs. Two of them (GHZ7 and GHZ8, see Fig. 1) have very similar and are separated by only in the sky, corresponding to a projected separation of 16 kpc at — i.e. they are likely to be physically associated in a close pair. Two of the other three candidates previously reported by C22a (GHZ5 and GHZ6) do not enter the present sample, as with the new photometry they are located just outside the color-selection region. Their photometric redshift solutions still show a significant peak at as reported by C22a, but they are not included in the present analysis which is based only on color-selected candidates. A third candidate (GHZ3) of the C22a paper is instead detected in the new and deeper images obtained in the F090W filter, and it is therefore definitely not a galaxy. These findings are consistent with both the effect of photometric scatter, and, as far as GHZ3 is concerned, with the possible contamination level discussed by C22a. However, at variance with the C22a sample, none of the candidates discussed in the present paper show significant secondary photometric redshift solutions, most likely owing to the availability of deeper data in the GLASS-JWST field.
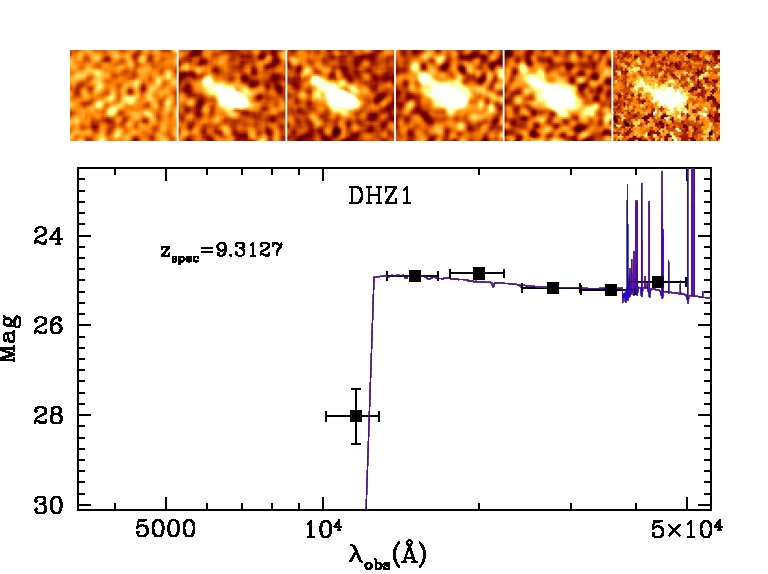
We note that various candidates are found not far from the image edges. However, they all fall in full-depth regions of the mosaics and we made sure that their detection and photometry are not affected by border effects. The most remarkable object in the present sample is galaxy DHZ1 from the DDT area. This object had also been previously selected as a high-redshift candidate from HFF imaging (Castellano et al., 2016b; Yue et al., 2018), and it has been recently spectroscopically confirmed at with NIRSPec (Boyett et al., 2023). DHZ1 has a demagnified mag, and a complex morphology indicative of an ongoing interaction or merging comprising two main components and an elongated tidal tail. In the following we will adopt for DHZ1 the redshift and parameters from Boyett et al. (2023).
Basic physical properties of the sample galaxies are summarized in Table 3. Corrected for lensing magnification, the star-formation rates (SFRs) range between 2 and 25 yr-1, the estimated stellar masses range between and , and the UV slopes range between and . We note that at the rest-frame optical bands are poorly constrained by NIRCAM data, at best in regions that can be contaminated by emission lines. Consequently, stellar masses can be subject to uncertainties and biases, and stellar ages are poorly constrained. For this reason we do not quote the latter in Table 3. The reported values appear to encompass the range of rest-frame properties of Lyman-break galaxies at these redshifts, as observed by recent surveys. We caution that these estimates have been obtained under the assumption of a Chabrier (2003) IMF, but may be substantially different if the underlying galaxy-wide IMF (e.g., Yan et al., 2021) is top-heavy, as proposed to explain the unexpected abundance of bright high-redshift galaxies in early JWST observations (Haslbauer et al., 2022; Finkelstein et al., 2023). Nonetheless, we report the estimated values to facilitate follow-up observations and we defer a more detailed analysis of the properties of these galaxies to future work.
4 Methodology
Estimating the LF of high-redshift galaxies in lensed fields is more complex than in blank fields. The additional complexity is usually justified by the extra gain in depth afforded by lensing magnification. In this work, however, motivated by the discovery of a significant number of bright galaxies, we focus primarily on the bright end of the LF, and postpone the study of the faintest objects to a future work. This choice allows us to keep the analysis simple and robust, building on the ingredients that we discuss below.
4.1 Lens Model
The A2744 region, especially that covered by the UNCOVER data, is affected by moderate to strong lensing amplification due to the foreground cluster, whose mass distribution is known to extend over a wide area covering the entire dataset (e.g., Merten et al., 2011). To properly account for the lensing effect, we have extended the pre-JWST lens model described by Bergamini et al. (2023a, B23 hereafter) by including 27 additional multiple images in the cluster core, as well as 29 in the NW region where two cluster galaxies (named G1 and G2 by B23) are present with luminosities similar to those of the central bright cluster galaxies. Owing to the rich strong-lensing (SL) features revealed by the NIRCam data, we refer to this region as “SL clump.” The identification of extra multiple images takes advantage of NIRCam multiband photometry, as well as new spectroscopic observations with VLT/MUSE (Prieto-Lyon et al., 2022; Bergamini et al., 2023b). MUSE coverage of the SL clump also enables the identification of additional cluster galaxies and the determination of their velocity dispersions, which are found to be consistent with the subhalo scaling relation resulting from the lens-model optimization. The total root-mean-square (RMS) separation between the observed and model-predicted positions of the 149 multiple images is . The extended and enhanced SL model is described in detail by Bergamini et al. (2023b).
For the purpose of the present work, we have computed the median magnification values and 95% confidence level intervals for each high- candidate by extracting 100 random sets of parameter values from the final Markov chain Monte Carlo (MCMC) chain, containing a total of samples. To account for systematic uncertainties owing to the choice of the total mass parametrization in the external region, we have combined the MCMC chains of two extended lens models, which include either one or two cluster-scale halos in the SL clump, using the same set of multiple image constraints.
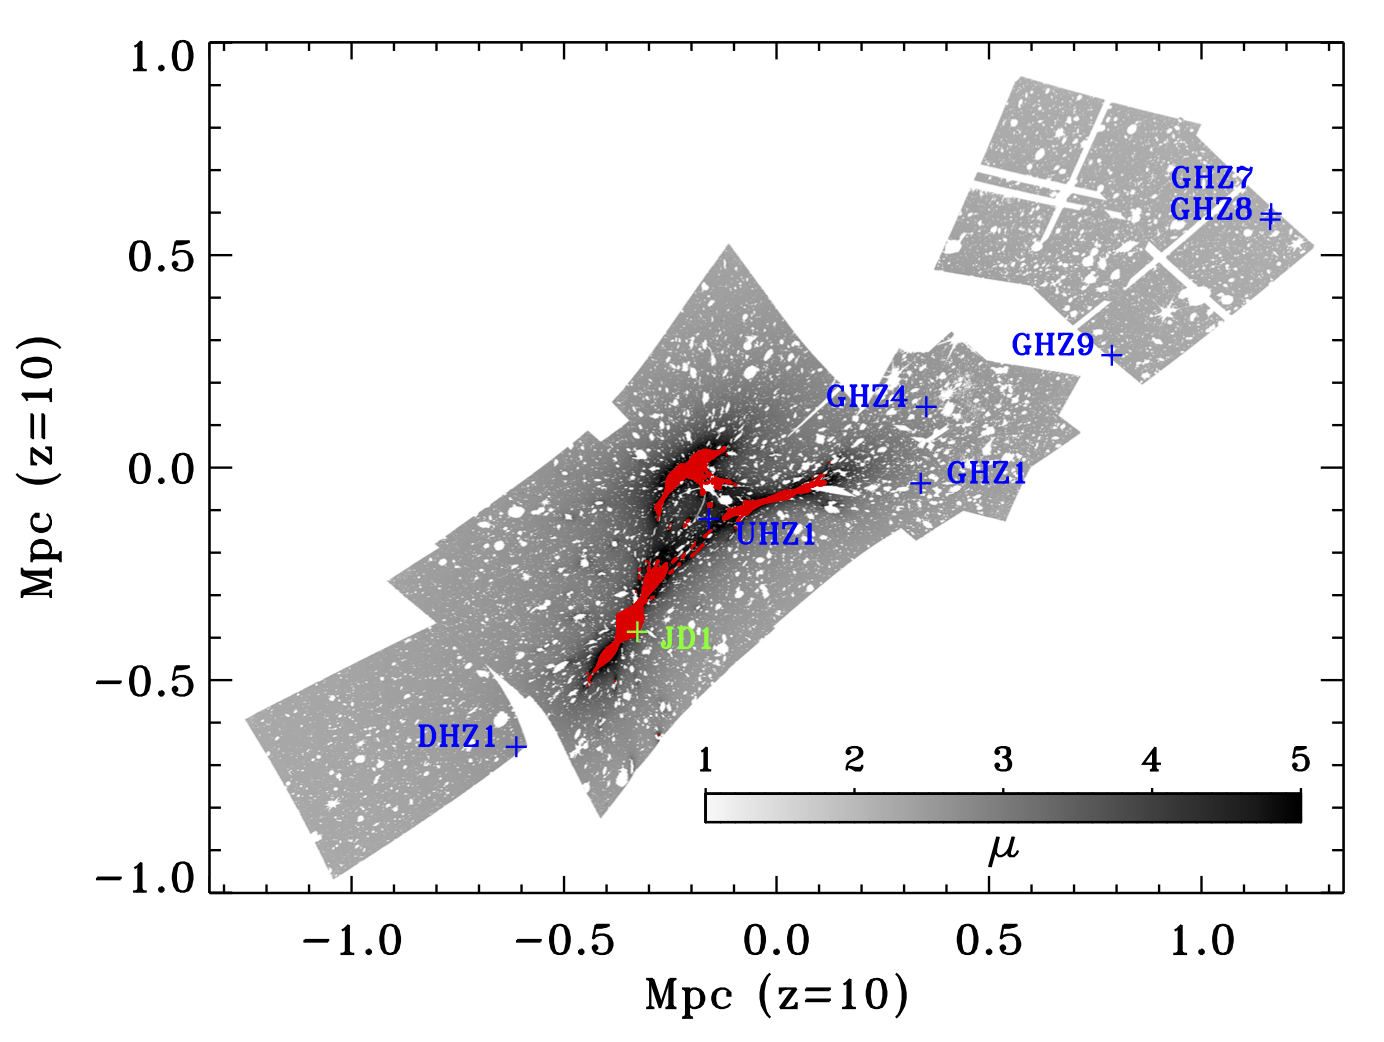
To derive the LF of the high- candidates, unlensed survey areas and volumes in the considered redshift bins are needed. Intrinsic survey areas are computed for each of the three fields by projecting the footprints of the observed regions on the source plane, at varying redshift in the range . To this aim, we use the deflection field from the extended lens model with the best positional RMS uncertainty (i.e., the one including only a single halo in the SL clump region). We also project onto the source plane the observed mask (excluding regions around bright sources) and the magnification maps in the aforementioned redshift range (see Figure 1-bottom). In this way, we can reconstruct the effective area on the source plane, for each of the three fields separately, where objects can potentially be identified around , and compute the corresponding magnification in each pixel. These maps are then combined to estimate the probed survey volume in each redshift and luminosity bin.
The seven galaxies at listed in Table 3 have low-to-moderate magnifications, ranging from 1.2 to (see Table 3), and are not multiply imaged (i.e., they lie outside the main caustics on the source plane at ). This allows us to limit our LF analysis to regions with , which has the significant advantage of avoiding strongly lensed regions where systematic uncertainties can be large, albeit associated with small survey volumes. As previously mentioned, JD1B is the only object at meeting our color-selection criteria and is thus excluded from the sample analyzed in this paper. The corresponding areas with in the source plane amount to 6.86, 9.44, and 3.26 sq. arcmin in the GLASS–JWST, UNCOVER, and DDT fields, respectively. By comparing the effective source plane area predicted by lens models with slightly different mass parametrizations, but similar positional RMS values, we estimate the systematic uncertainty on the effective survey volume (and therefore on the data points in the LF) to be approximately 5%.
We have also checked the predicted magnification values for our objects by the SL model recently released by the UNCOVER collaboration (Furtak et al., 2022)222Magnifcation maps made public as of Dec. 12, 2022.. Four of our seven candidates have magnification values at lower than 5 and in good agreement with the ones presented here, while the remaining three (i.e., GHZ7, GHZ8, and GHZ9) are not covered by their model.
| Mpc-3 mag-1 | ||
|---|---|---|
| 0 | 3.3 | |
| 1 | 2.1 | |
| 3 | 7.6 | |
| 3 | 18.0 |
Note. — The binned volume densities in the GLASS-JWST, UNCOVER, and DDT fields; uncertainties are computed for small-number Poisson statistics following Gehrels (1986).
5 The UV Luminosity Function in the A2744 Region
Even correcting for magnifications, our sample has remarkably bright UV magnitudes , corresponding to a high surface density of objects. We quantify the volume density by computing the UV LF in four evenly spaced rest-frame magnitude bins at mag. The effective volumes in each bin are obtained by taking into account the area at different magnification levels, and the relevant completeness for the selection of objects with the considered UV rest-frame magnitudes. In fact, the volume accessible for sources of a given intrinsic magnitude is
| (1) |
where . In practice, the effective volumes are calculated for the three bins reported in Table 4 by replacing the integral with sums in steps of and . The completeness values at different redshifts and magnifications are obtained on the basis of imaging simulations, and the element volumes available for the selection of high-redshift galaxies are computed as a function of on the basis of the area of the masked magnification maps.
The choice of limiting the analysis to galaxies identified in low-magnification areas, while not significantly reducing the probed volume, also simplifies the estimate of the completeness which does not require simulating multiply imaged objects. Imaging simulations are performed separately for the GLASS-JWST, UNCOVER, and DDT fields as described by C22a. Briefly, we inserted in blank regions of the observed images mock Lyman-break galaxies (LBGs) at and with a uniform distribution at mag. The observed magnitudes are obtained by randomly associating a model from a library based on BC03 models with metallicity , mag, constant star-formation history, Salpeter (1955) IMF, and Calzetti et al. (2000) extinction law. We assume that objects follow a circular Sersic (1968) light profile with index and that their effective radius scales with as , consistent with several estimates at comparable redshifts (e.g., Grazian et al., 2012; Kawamata et al., 2018; Bouwens et al., 2022a; Yang et al., 2022). Following Yang et al. (2022), we assume an effective radius of 0.8 kpc for objects with mag. In order to avoid overcrowding, simulations are repeated by inserting 500 objects each time. Detection, photometry, and color selection on the simulated galaxies are performed in the same way as for the real catalogs.
We consider for each object the demagnified reported in Table 3 which has been computed on the basis of the best-fit zphot template. Considering the width of the magnitude bins, magnification and redshift uncertainties do not significantly affect our results. The binned volume densities are then obtained as , where is the number of objects in the considered bin. The imaging simulations confirm that our selection criteria isolate objects at . The peak in the selection efficiency is found at , where the completeness is higher than 90% for mag objects in the GLASS-JWST field — the deepest of the three — while it is 40%–80% in DDT and UNCOVER (respectively) because of shallower depths and, in the case of UNCOVER, crowding. As a result, objects in the faintest magnitude bin can only effectively be selected in UNCOVER and GLASS-JWST (–80%), while the DDT field provides only a minor contribution to the effective volume (%).
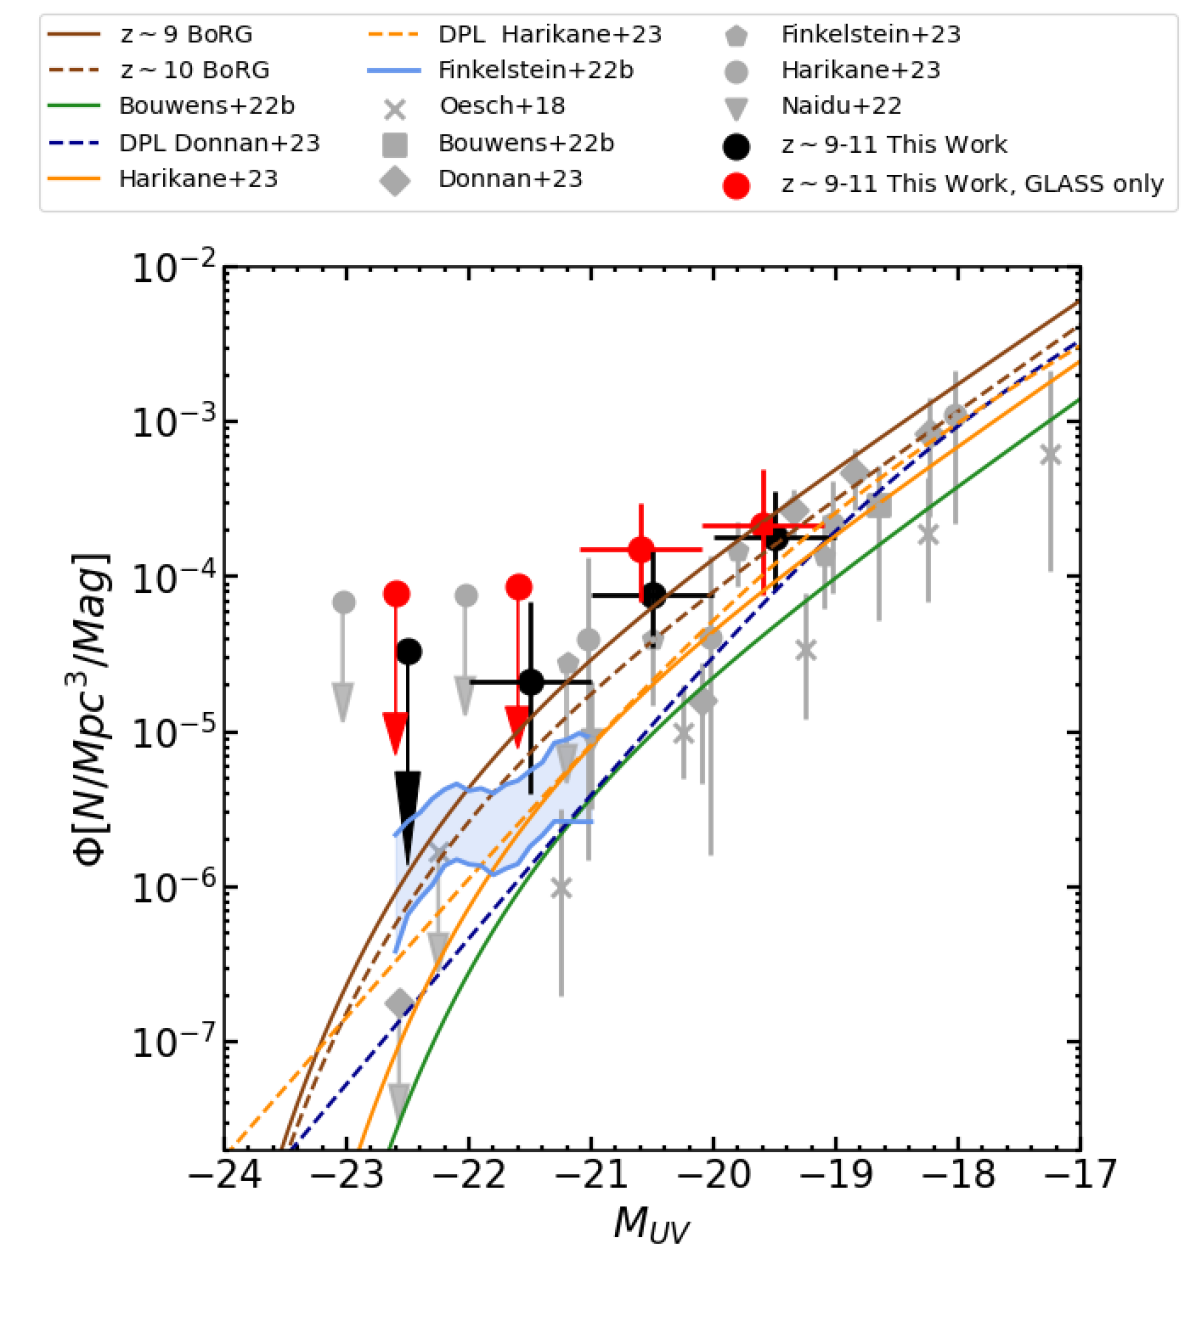
The binned UV LF is shown in Fig. 4, together with results from recent surveys in the same redshift range. The relevant values are presented in Table 4. We compute and plot in Fig. 4 the LF derived for the entire sample and considering GLASS-JWST only. It is immediately clear that the density of sources in our sample is significantly larger than the best-fit LF derived from previous JWST surveys — which in most cases include the first epoch of the GLASS-JWST data, and so may already be biased high. The density estimated from our entire sample is higher, but still consistent at , with that inferred at by previous wide-field imaging surveys with HST, such as BoRG (Leethochawalit et al., 2022a; Bagley et al., 2022), that do not include the GLASS-JWST data and were selected with a different filter complement. The discrepancy is particularly remarkable at mag, where it ranges between 4 and 10 times with respect to previous estimates, although of course there is considerable uncertainty at this stage. On the basis of the number of objects and on the surveyed volume, we estimate a cosmic variance at the level of –15%333Following the Cosmic Variance Calculator at https://www.ph.unimelb.edu.au/~mtrenti/cvc/CosmicVariance.html. See Trenti & Stiavelli (2008). in each of the three fields, where the highest value refers to the DDT region. This is much smaller than the Poisson uncertainty in the number counts.
While the high density measured in the field is suggestive of the presence of a physical overdensity, the accuracy of photometric redshifts prevents to confirm whether the objects, or part of them, are members of a localized structure. In this respect, we note that GHZ9 has best-fit photometric redshift solutions at , compatible with the spectroscopic value measured for DHZ1, while objects GHZ1, GHZ7 and GHZ8 are more likely placed at . In turn, GHZ4 and UHZ1 are compatible with both the and the redshift ranges. As a test, we estimated the UV LF in the two contiguous redshift bins at (4 objects, including GHZ4 and UHZ1) and (3 objects). We find that the number density of mag objects at in the A2744 field is higher than previous estimates, including the BoRG one but still consistent at with the latter. The UV LF at is in agreement with the BoRG estimate at intermediate magnitudes, but DHZ1 remains unexpected considering the probed volume as it points to a number density of extremely bright objects 3 times higher than predicted. Summarising, even when conservatively dividing the sample on the basis of the photometric redshifts, the estimated UV LFs point to a higher-than-expected density in the A2744 region.
Interestingly, we find an even higher density if we restrict the analysis to the GLASS-JWST field (red points in Fig. 4). This is the deepest area considered, and the region least affected by magnification (–1.7), so it is difficult to attribute this result to a higher contamination. In this region, our inferred density is higher even than the BoRG estimates at mag. Furthermore, we tested that when restricting the analysis to objects with photometric redshift in the interval in this field, our estimated density at that magnitude further increases by a factor of . We thus suggest that the GLASS-JWST area possibly includes an overdensity. The sources appear aligned along a filament-like structure of projected length Mpc with the pair GHZ7–GHZ8, separated by 16 kpc. The galaxies have similar colors and , resembling similar galaxy associations found in other high-redshift structures (e.g., Castellano et al., 2018, 2022b).
The sample size is too small to carry out a meaningful study of the two-point correlation function, but determining the clustering properties of bright galaxies at will be important to determine their average cosmic density, their halo mass, and their role in cosmic reionization (Endsley et al., 2020). As a first assessment, we have used the relation between UV magnitude and halo mass at from Mason et al. (2023) to estimate a lower limit to the total halo mass of the potential overdensity as the sum of the masses of the objects selected here. We find when considering the entire sample, and under the assumption that the overdensity is localized in the GLASS-JWST region. We then analysed 10 (26) independent lines of sight with the same area as the A2744 (GLASS-JWST) region from a light cone extracted with the FORECAST software (Fortuni et al., in prep.) from the IllustrisTNG simulation (Pillepich et al., 2018). We found no halos as massive as the ones estimated in our case, indicating a probability smaller than 5–10% of finding such an overdensity in our survey.
To obtain a more quantitative assessment, we estimated the rarity of the potential overdensity starting from the computation of the linear RMS density fluctuation predicted by the standard CDM cosmology. The cosmic volumes we consider correspond to mass scales and on the entire field and in the GLASS-JWST field, respectively. Assuming a CDM power spectrum, the above mass scales correspond (at ) to and , respectively. On the physical scales of our system, the density field is nonlinear, and a possible approximation for the true density distribution is a log-normal model (Klypin et al., 2018) for which can be approximated as the RMS in with a mean in this quantity of . Under these assumptions, the probability of finding an overdensity or larger in the entire volume sampled by the A2744 region is , while the probability of finding an overdensity or larger in the volume sampled by the GLASS-JWST field is .
These tests show that the potential overdensity in the A2744 region is rare, in particular as far as the high density contrast measured in the GLASS-JWST area is concerned, and unlikely to be found in this survey, also considering that the region hosts another rare overdensity at a slightly lower redshift (Morishita et al., 2022). Clearly, the accuracy achieved by photometric redshifts does not allow us to firmly constrain the presence of a localized structure. Extensive follow-up spectroscopy of the A2744 region is needed to confirm this hypothesis, and measure the redshift and extent of the possible overdensity.
6 Summary and Conclusions
The rapid discovery of an unexpectedly large number of galaxies at and beyond is one of the most tantalizing results obtained by the very first JWST observations. The higher than expected normalization of the UV LF at (e.g., C22a; Finkelstein et al., 2023) has already generated a lively theoretical debate about its potential physical explanations (e.g., Mason et al., 2023; Ferrara et al., 2022). In this context, it is important to carry out further studies to improve the statistics and start to explore the all-important issues of clustering and cosmic variance.
We report here the results of a search for galaxies in a new set of JWST imaging data, obtained by three different programs (GLASS-JWST, UNCOVER, and DDT#2756) in the region of the cluster Abell 2744. The combination of depth (GLASS-JWST is among the deepest fields obtained so far with JWST) and lensing magnification (although we limit our analysis to , where the lens model is robust) allows us to select with high reliability galaxies down to an intrinsic rest-frame luminosity of mag. Remarkably, we identify 7 galaxies at this redshift, including two previously reported in the first epoch of the GLASS-JWST dataset, and one object with spectroscopic confirmation at . Five of the galaxies are detected in the (relatively small) GLASS-JWST area, and are distributed along a filament-like structure Mpc in projected length. This sample consists of an excellent set of candidates for efficient follow-up spectroscopy with NIRSpec.
Building upon a revised lensing model that improves the description of the entire A2744 area by taking advantage of new multiple images and MUSE spectra, we compute the resulting number density in three magnitude bins and compare it with the results from recent JWST surveys. We conclude that the density of bright galaxies in the A2744 region is significantly higher than average, by factors that range between 3 and 10 depending on and on the survey taken as reference.
We conclude that extending the search in a larger area northwest of the cluster is necessary to further characterize this potential overdensity. Spectroscopic redshifts can determine whether these objects are part of a single physical overdensity (e.g., Laporte et al., 2022), or the apparent density is enhanced by chance superposition of galaxies at similar redshifts (e.g., Morishita et al., 2022). Finally, although all candidates show prominent Lyman breaks and robust photometric redshift solutions in the expected range, spectroscopic confirmation is needed to rule out any possible contamination in the sample from rare classes of lower-redshift interlopers (Vulcani et al., 2017; Zavala et al., 2022; Fujimoto et al., 2022; Naidu et al., 2022b; Arrabal Haro et al., 2023), in particular for objects with limited coverage at short wavelengths.
In conclusion, our study confirms the surprisingly high density of bright galaxies observed in early JWST observations, but calls for both extensive follow-up spectroscopy and wider surveys along multiple lines of sight to achieve an unbiased estimate of their number density and clustering properties.
References
- Arrabal Haro et al. (2023) Arrabal Haro, P., Dickinson, M., Finkelstein, S. L., et al. 2023, arXiv e-prints, arXiv:2303.15431. https://arxiv.org/abs/2303.15431
- Astropy Collaboration et al. (2013) Astropy Collaboration, Robitaille, T. P., Tollerud, E. J., et al. 2013, A&A, 558, A33, doi: 10.1051/0004-6361/201322068
- Bagley et al. (2022) Bagley, M. B., Finkelstein, S. L., Rojas-Ruiz, S., et al. 2022, arXiv e-prints, arXiv:2205.12980. https://arxiv.org/abs/2205.12980
- Bakx et al. (2023) Bakx, T. J. L. C., Zavala, J. A., Mitsuhashi, I., et al. 2023, MNRAS, 519, 5076, doi: 10.1093/mnras/stac3723
- Bergamini et al. (2023a) Bergamini, P., Acebron, A., Grillo, C., et al. 2023a, A&A, 670, A60, doi: 10.1051/0004-6361/202244575
- Bergamini et al. (2023b) —. 2023b, arXiv e-prints, arXiv:2303.10210, doi: 10.48550/arXiv.2303.10210
- Bertin (2006) Bertin, E. 2006, in Astronomical Society of the Pacific Conference Series, Vol. 351, Astronomical Data Analysis Software and Systems XV, ed. C. Gabriel, C. Arviset, D. Ponz, & S. Enrique, 112
- Bertin & Arnouts (1996) Bertin, E., & Arnouts, S. 1996, A&AS, 117, 393
- Bertin et al. (2002) Bertin, E., Mellier, Y., Radovich, M., et al. 2002, in Astronomical Society of the Pacific Conference Series, Vol. 281, Astronomical Data Analysis Software and Systems XI, ed. D. A. Bohlender, D. Durand, & T. H. Handley, 228
- Bezanson et al. (2022) Bezanson, R., Labbe, I., Whitaker, K. E., et al. 2022, arXiv e-prints, arXiv:2212.04026. https://arxiv.org/abs/2212.04026
- Bouwens et al. (2023) Bouwens, R., Illingworth, G., Oesch, P., et al. 2023, MNRAS, doi: 10.1093/mnras/stad1014
- Bouwens et al. (2022a) Bouwens, R. J., Illingworth, G. D., van Dokkum, P. G., et al. 2022a, ApJ, 927, 81, doi: 10.3847/1538-4357/ac4791
- Bouwens et al. (2016) Bouwens, R. J., Oesch, P. A., Labbé, I., et al. 2016, ApJ, 830, 67, doi: 10.3847/0004-637X/830/2/67
- Bouwens et al. (2021) Bouwens, R. J., Oesch, P. A., Stefanon, M., et al. 2021, AJ, 162, 47, doi: 10.3847/1538-3881/abf83e
- Bouwens et al. (2022b) Bouwens, R. J., Stefanon, M., Brammer, G., et al. 2022b, arXiv e-prints, arXiv:2211.02607. https://arxiv.org/abs/2211.02607
- Bowler et al. (2020) Bowler, R. A. A., Jarvis, M. J., Dunlop, J. S., et al. 2020, MNRAS, 493, 2059, doi: 10.1093/mnras/staa313
- Boyett et al. (2023) Boyett, K., Trenti, M., Leethochawalit, N., et al. 2023, arXiv e-prints, arXiv:2303.00306, doi: 10.48550/arXiv.2303.00306
- Boylan-Kolchin (2022) Boylan-Kolchin, M. 2022, arXiv e-prints, arXiv:2208.01611. https://arxiv.org/abs/2208.01611
- Brammer (2022) Brammer, G. 2022, gbrammer/golfir: Software pipeline for model photometry on images with different point spread functions, 1.0, Zenodo, Zenodo, doi: 10.5281/zenodo.7149516
- Brammer et al. (2008) Brammer, G. B., van Dokkum, P. G., & Coppi, P. 2008, ApJ, 686, 1503, doi: 10.1086/591786
- Bruzual & Charlot (2003) Bruzual, G., & Charlot, S. 2003, MNRAS, 344, 1000, doi: 10.1046/j.1365-8711.2003.06897.x
- Bunker et al. (2023) Bunker, A. J., Saxena, A., Cameron, A. J., et al. 2023, arXiv e-prints, arXiv:2302.07256, doi: 10.48550/arXiv.2302.07256
- Calzetti et al. (2000) Calzetti, D., Armus, L., Bohlin, R. C., et al. 2000, ApJ, 533, 682, doi: 10.1086/308692
- Castellano et al. (2012) Castellano, M., Fontana, A., Grazian, A., et al. 2012, A&A, 540, A39, doi: 10.1051/0004-6361/201118050
- Castellano et al. (2014) Castellano, M., Sommariva, V., Fontana, A., et al. 2014, A&A, 566, A19, doi: 10.1051/0004-6361/201322704
- Castellano et al. (2016a) Castellano, M., Yue, B., Ferrara, A., et al. 2016a, ApJ, 823, L40, doi: 10.3847/2041-8205/823/2/L40
- Castellano et al. (2016b) Castellano, M., Amorín, R., Merlin, E., et al. 2016b, A&A, 590, A31, doi: 10.1051/0004-6361/201527514
- Castellano et al. (2018) Castellano, M., Pentericci, L., Vanzella, E., et al. 2018, ApJ, 863, L3, doi: 10.3847/2041-8213/aad59b
- Castellano et al. (2022a) Castellano, M., Fontana, A., Treu, T., et al. 2022a, ApJ, 938, L15, doi: 10.3847/2041-8213/ac94d0
- Castellano et al. (2022b) Castellano, M., Pentericci, L., Cupani, G., et al. 2022b, A&A, 662, A115, doi: 10.1051/0004-6361/202243348
- Chabrier (2003) Chabrier, G. 2003, PASP, 115, 763, doi: 10.1086/376392
- Dayal & Ferrara (2018) Dayal, P., & Ferrara, A. 2018, Phys. Rep., 780, 1, doi: 10.1016/j.physrep.2018.10.002
- Donnan et al. (2023) Donnan, C. T., McLeod, D. J., Dunlop, J. S., et al. 2023, MNRAS, 518, 6011, doi: 10.1093/mnras/stac3472
- Ellis et al. (2013) Ellis, R. S., McLure, R. J., Dunlop, J. S., et al. 2013, ApJ, 763, L7, doi: 10.1088/2041-8205/763/1/L7
- Endsley et al. (2020) Endsley, R., Behroozi, P., Stark, D. P., et al. 2020, MNRAS, 493, 1178, doi: 10.1093/mnras/staa324
- Ferrara et al. (2022) Ferrara, A., Pallottini, A., & Dayal, P. 2022, arXiv e-prints, arXiv:2208.00720, doi: 10.48550/arXiv.2208.00720
- Finkelstein et al. (2015) Finkelstein, S. L., Ryan, Jr., R. E., Papovich, C., et al. 2015, ApJ, 810, 71, doi: 10.1088/0004-637X/810/1/71
- Finkelstein et al. (2022a) Finkelstein, S. L., Bagley, M. B., Haro, P. A., et al. 2022a, ApJ, 940, L55, doi: 10.3847/2041-8213/ac966e
- Finkelstein et al. (2022b) Finkelstein, S. L., Bagley, M., Song, M., et al. 2022b, ApJ, 928, 52, doi: 10.3847/1538-4357/ac3aed
- Finkelstein et al. (2023) Finkelstein, S. L., Bagley, M. B., Ferguson, H. C., et al. 2023, ApJ, 946, L13, doi: 10.3847/2041-8213/acade4
- Fiore et al. (2022) Fiore, F., Ferrara, A., Bischetti, M., Feruglio, C., & Travascio, A. 2022, arXiv e-prints, arXiv:2211.08937. https://arxiv.org/abs/2211.08937
- Fontana et al. (2000) Fontana, A., D’Odorico, S., Poli, F., et al. 2000, AJ, 120, 2206, doi: 10.1086/316803
- Fontana et al. (2014) Fontana, A., Dunlop, J. S., Paris, D., et al. 2014, A&A, 570, A11, doi: 10.1051/0004-6361/201423543
- Fujimoto et al. (2022) Fujimoto, S., Finkelstein, S. L., Burgarella, D., et al. 2022, arXiv e-prints, arXiv:2211.03896. https://arxiv.org/abs/2211.03896
- Furtak et al. (2022) Furtak, L. J., Zitrin, A., Weaver, J. R., et al. 2022, arXiv e-prints, arXiv:2212.04381. https://arxiv.org/abs/2212.04381
- Gehrels (1986) Gehrels, N. 1986, ApJ, 303, 336, doi: 10.1086/164079
- Grazian et al. (2012) Grazian, A., Castellano, M., Fontana, A., et al. 2012, A&A, 547, A51, doi: 10.1051/0004-6361/201219669
- Guo et al. (2013) Guo, Y., Ferguson, H. C., Giavalisco, M., et al. 2013, ApJS, 207, 24, doi: 10.1088/0067-0049/207/2/24
- Harikane et al. (2023) Harikane, Y., Ouchi, M., Oguri, M., et al. 2023, ApJS, 265, 5, doi: 10.3847/1538-4365/acaaa9
- Haslbauer et al. (2022) Haslbauer, M., Kroupa, P., Zonoozi, A. H., & Haghi, H. 2022, ApJ, 939, L31, doi: 10.3847/2041-8213/ac9a50
- Hunter (2007) Hunter, J. D. 2007, Computing in Science and Engineering, 9, 90, doi: 10.1109/MCSE.2007.55
- Ishigaki et al. (2018) Ishigaki, M., Kawamata, R., Ouchi, M., et al. 2018, ApJ, 854, 73, doi: 10.3847/1538-4357/aaa544
- Kannan et al. (2022) Kannan, R., Springel, V., Hernquist, L., et al. 2022, arXiv e-prints, arXiv:2210.10066. https://arxiv.org/abs/2210.10066
- Kawamata et al. (2018) Kawamata, R., Ishigaki, M., Shimasaku, K., et al. 2018, ApJ, 855, 4, doi: 10.3847/1538-4357/aaa6cf
- Klypin et al. (2018) Klypin, A., Prada, F., Betancort-Rijo, J., & Albareti, F. D. 2018, MNRAS, 481, 4588, doi: 10.1093/mnras/sty2613
- Kohandel et al. (2022) Kohandel, M., Ferrara, A., Pallottini, A., et al. 2022, arXiv e-prints, arXiv:2212.02519. https://arxiv.org/abs/2212.02519
- Kron (1980) Kron, R. G. 1980, ApJS, 43, 305, doi: 10.1086/190669
- Laporte et al. (2022) Laporte, N., Zitrin, A., Dole, H., et al. 2022, A&A, 667, L3, doi: 10.1051/0004-6361/202244719
- Larson et al. (2022) Larson, R. L., Hutchison, T. A., Bagley, M., et al. 2022, arXiv e-prints, arXiv:2211.10035. https://arxiv.org/abs/2211.10035
- Leethochawalit et al. (2022a) Leethochawalit, N., Roberts-Borsani, G., Morishita, T., Trenti, M., & Treu, T. 2022a, arXiv e-prints, arXiv:2205.15388. https://arxiv.org/abs/2205.15388
- Leethochawalit et al. (2022b) Leethochawalit, N., Trenti, M., Santini, P., et al. 2022b, arXiv e-prints, arXiv:2207.11135. https://arxiv.org/abs/2207.11135
- Lotz et al. (2014) Lotz, J., Mountain, M., Grogin, N. A., et al. 2014, in American Astronomical Society Meeting Abstracts, Vol. 223, American Astronomical Society Meeting Abstracts #223, 254.01
- Mason et al. (2023) Mason, C. A., Trenti, M., & Treu, T. 2023, MNRAS, 521, 497, doi: 10.1093/mnras/stad035
- McLeod et al. (2016) McLeod, D. J., McLure, R. J., & Dunlop, J. S. 2016, MNRAS, 459, 3812, doi: 10.1093/mnras/stw904
- Melia (2014) Melia, F. 2014, AJ, 147, 120, doi: 10.1088/0004-6256/147/5/120
- Melia (2023) —. 2023, MNRAS, 521, L85, doi: 10.1093/mnrasl/slad025
- Menci et al. (2022) Menci, N., Castellano, M., Santini, P., et al. 2022, ApJ, 938, L5, doi: 10.3847/2041-8213/ac96e9
- Merlin et al. (2016) Merlin, E., Amorìn, R., Castellano, M., et al. 2016, ArXiv e-prints. https://arxiv.org/abs/1603.02460
- Merlin et al. (2019) Merlin, E., Fortuni, F., Torelli, M., et al. 2019, MNRAS, 490, 3309, doi: 10.1093/mnras/stz2615
- Merlin et al. (2022) Merlin, E., Bonchi, A., Paris, D., et al. 2022, arXiv e-prints, arXiv:2207.11701. https://arxiv.org/abs/2207.11701
- Merten et al. (2011) Merten, J., Coe, D., Dupke, R., et al. 2011, MNRAS, 417, 333, doi: 10.1111/j.1365-2966.2011.19266.x
- Morishita & Stiavelli (2022) Morishita, T., & Stiavelli, M. 2022, arXiv e-prints, arXiv:2207.11671. https://arxiv.org/abs/2207.11671
- Morishita et al. (2018) Morishita, T., Trenti, M., Stiavelli, M., et al. 2018, ApJ, 867, 150, doi: 10.3847/1538-4357/aae68c
- Morishita et al. (2022) Morishita, T., Roberts-Borsani, G., Treu, T., et al. 2022, arXiv e-prints, arXiv:2211.09097. https://arxiv.org/abs/2211.09097
- Naidu et al. (2022a) Naidu, R. P., Oesch, P. A., van Dokkum, P., et al. 2022a, arXiv e-prints, arXiv:2207.09434. https://arxiv.org/abs/2207.09434
- Naidu et al. (2022b) Naidu, R. P., Oesch, P. A., Setton, D. J., et al. 2022b, arXiv e-prints, arXiv:2208.02794, doi: 10.48550/arXiv.2208.02794
- Oesch et al. (2018) Oesch, P. A., Bouwens, R. J., Illingworth, G. D., Labbé, I., & Stefanon, M. 2018, ApJ, 855, 105, doi: 10.3847/1538-4357/aab03f
- Oke & Gunn (1983) Oke, J. B., & Gunn, J. E. 1983, ApJ, 266, 713, doi: 10.1086/160817
- Paris et al. (2023) Paris, D., Merlin, E., Fontana, A., et al. 2023, arXiv e-prints, arXiv:2301.02179, doi: 10.48550/arXiv.2301.02179
- Pérez-González et al. (2023) Pérez-González, P. G., Costantin, L., Langeroodi, D., et al. 2023, arXiv e-prints, arXiv:2302.02429, doi: 10.48550/arXiv.2302.02429
- Pillepich et al. (2018) Pillepich, A., Springel, V., Nelson, D., et al. 2018, MNRAS, 473, 4077, doi: 10.1093/mnras/stx2656
- Pontoppidan et al. (2022) Pontoppidan, K. M., Barrientes, J., Blome, C., et al. 2022, ApJ, 936, L14, doi: 10.3847/2041-8213/ac8a4e
- Prieto-Lyon et al. (2022) Prieto-Lyon, G., Strait, V., Mason, C. A., et al. 2022, arXiv e-prints, arXiv:2211.12548. https://arxiv.org/abs/2211.12548
- Roberts-Borsani et al. (2022a) Roberts-Borsani, G., Morishita, T., Treu, T., Leethochawalit, N., & Trenti, M. 2022a, ApJ, 927, 236, doi: 10.3847/1538-4357/ac4803
- Roberts-Borsani et al. (2022b) Roberts-Borsani, G., Treu, T., Chen, W., et al. 2022b, arXiv e-prints, arXiv:2210.15639. https://arxiv.org/abs/2210.15639
- Robertson (2022) Robertson, B. E. 2022, ARA&A, 60, 121, doi: 10.1146/annurev-astro-120221-044656
- Robertson et al. (2022) Robertson, B. E., Tacchella, S., Johnson, B. D., et al. 2022, arXiv e-prints, arXiv:2212.04480. https://arxiv.org/abs/2212.04480
- Salpeter (1955) Salpeter, E. E. 1955, ApJ, 121, 161, doi: 10.1086/145971
- Santini et al. (2022) Santini, P., Fontana, A., Castellano, M., et al. 2022, arXiv e-prints, arXiv:2207.11379. https://arxiv.org/abs/2207.11379
- Schaerer & de Barros (2009) Schaerer, D., & de Barros, S. 2009, A&A, 502, 423, doi: 10.1051/0004-6361/200911781
- Sersic (1968) Sersic, J. L. 1968, Atlas de galaxias australes (Cordoba, Argentina: Observatorio Astronomico, 1968)
- Stefanon et al. (2019) Stefanon, M., Labbé, I., Bouwens, R. J., et al. 2019, ApJ, 883, 99, doi: 10.3847/1538-4357/ab3792
- Steinhardt et al. (2020) Steinhardt, C. L., Jauzac, M., Acebron, A., et al. 2020, ApJS, 247, 64, doi: 10.3847/1538-4365/ab75ed
- Trenti & Stiavelli (2008) Trenti, M., & Stiavelli, M. 2008, ApJ, 676, 767, doi: 10.1086/528674
- Treu et al. (2022) Treu, T., Roberts-Borsani, G., Bradac, M., et al. 2022, The Astrophysical Journal, 935, 110, doi: 10.3847/1538-4357/ac8158
- Treu et al. (2022) Treu, T., Calabro, A., Castellano, M., et al. 2022, arXiv e-prints, arXiv:2207.13527. https://arxiv.org/abs/2207.13527
- Vulcani et al. (2017) Vulcani, B., Trenti, M., Calvi, V., et al. 2017, ApJ, 836, 239, doi: 10.3847/1538-4357/aa5caf
- Yan et al. (2022) Yan, H., Cohen, S. H., Windhorst, R. A., et al. 2022, arXiv e-prints, arXiv:2209.04092. https://arxiv.org/abs/2209.04092
- Yan et al. (2021) Yan, Z., Jeřábková, T., & Kroupa, P. 2021, A&A, 655, A19, doi: 10.1051/0004-6361/202140683
- Yang et al. (2022) Yang, L., Leethochawalit, N., Treu, T., et al. 2022, MNRAS, 514, 1148, doi: 10.1093/mnras/stac1236
- Yoon et al. (2022) Yoon, I., Carilli, C. L., Fujimoto, S., et al. 2022, arXiv e-prints, arXiv:2210.08413. https://arxiv.org/abs/2210.08413
- Yue et al. (2018) Yue, B., Castellano, M., Ferrara, A., et al. 2018, ApJ, 868, 115, doi: 10.3847/1538-4357/aae77f
- Zavala et al. (2022) Zavala, J. A., Buat, V., Casey, C. M., et al. 2022, arXiv e-prints, arXiv:2208.01816. https://arxiv.org/abs/2208.01816
- Ziparo et al. (2022) Ziparo, F., Ferrara, A., Sommovigo, L., & Kohandel, M. 2022, arXiv e-prints, arXiv:2209.06840. https://arxiv.org/abs/2209.06840
- Zitrin et al. (2014) Zitrin, A., Zheng, W., Broadhurst, T., et al. 2014, ApJ, 793, L12, doi: 10.1088/2041-8205/793/1/L12