Evidence of under-developed torus and broad-line region of weak emission line quasars based on their spectral energy distribution
Abstract
To unravel the dominant cause of the weak emission line in a subset of optically selected radio-quiet ‘weak emission line quasars’ (WLQs), we have investigated the possibility of an underdeveloped broad line region (BLR). For this, we have modeled spectral energy distributions (SED) of 61 WLQs by using their optical and infrared (IR) photometric observations from SDSS and WISE respectively. SED fit consists of various emission components, including the luminosity from the dusty torus (). For comparison with the normal quasar, we have used a control sample of 55 QSOs for each WLQs matching in emission redshift and SDSS r-band. Based on our measurement of , we found a decrement of % in IR-luminosity in WLQs w.r.t the control sample of normal QSOs. Using / as the measure of torus covering factor () we found a similar decrement in WLQs covering factor, with their distribution being significantly different w.r.t. the normal QSOs with a KS-test of . As dusty torus and BLR covering factors are expected to be of a similar order in AGN, our results suggest that the BLR in the WLQs is underdeveloped and could be a dominant cause of the weakness of their emission line. As a result, our analysis gives support to the models of WLQs based on the evolution scenario being in an early stage of AGNs.
keywords:
galaxies: active – Galaxies: galaxies: jets – Galaxies : (galaxies:) quasars : general – Galaxies: (galaxies:) BL Lacertae objects: general – Galaxies1 Introduction
The key ingredients of a unified model of the AGN central engine are composed of a supermassive black hole in the center along with the various substructures including the accretion disk, broad line region (BLR), and dusty torus. The dusty torus plays a crucial role in absorbing radiation from the central part and re-emitting it in IR, as well as explaining the distinct characteristics of Type-1 and Type-2 AGN based on their different orientation relative to the line of sight (Antonucci, 1993; Urry & Padovani, 1995). The BLR region has high-velocity gas (FWHM = 1000–20,000 kms-1) being embedded in the gravitational potential well of a quasar’s supermassive black hole (SMBH). The high energy photons (UV and/or X-ray) from the accretion disk and corona photo-ionize the gas in BLR, giving rise to prominent broad emission lines with a rest-frame equivalent width (EWr) of about 50–110 Å for typical LyN v emission line in quasars (e.g., see Schneider et al., 1991; Francis et al., 1993; Osmer et al., 1994; Warren et al., 1994; Zheng et al., 1997; Brotherton et al., 2001; Dietrich et al., 2002). However, these lines can either disappear or appear much weaker (typically, EW Å for Ly N v) for a subclass of BL Lac objects (BLOs) in which optical/UV emission is dominated by the doppler boosted non-thermal continuum from the relativistic jet (e.g., see Begelman et al., 1984). As BLOs are jet dominated (e.g., see Urry & Padovani, 1995), they are radio loud having radio to optical flux density ratio, R111Radio loudness (R) is usually parameterized by the ratio of flux densities at 5 GHz and at 2500 Å in the rest frame, being R 10 and R 10 for radio-loud and radio-quiet respectively (e.g., see Kellermann et al., 1989).10. However, with the advent of large spectroscopic surveys, such as the Sloan Digital Sky Survey (SDSS; e.g., York et al., 2000) and the TwoDegree Field QSO Redshift Survey (2QZ; Boyle et al., 2000), a peculiar or new class of hundreds of high-redshift (mostly at ) radio-quiet quasars (RQQs) displaying exceptionally weak or even, in some cases completely missing, emission lines were discovered (e.g., see Collinge et al., 2005; Fan et al., 2006; Anderson et al., 2007; Plotkin et al., 2010a, b; Wu et al., 2011; Meusinger & Balafkan, 2014). These objects are commonly known as weak emission line quasars (WLQs), various models have been proposed for the observed weak emission lines, including (i) radiatively inefficient accretion flow (RIAF) leading to intrinsically weaker optical/UV continuum radiation (Yuan & Narayan, 2004), (ii) soft ionising continuum causing the weakness of emission lines in BLR (Leighly et al., 2007a, b; Laor & Davis, 2011; Wu et al., 2011; Luo et al., 2015), and (iii) anemic or unusual BLR Shemmer et al. (2010); Nikołajuk & Walter (2012), by postulating WLQs being in the early evolutionary phase of quasars (e.g., see Hryniewicz et al., 2010; Liu & Zhang, 2011).
On the observation side, many programs have also been carried out to either confirm or refute many of the models mentioned above. For instance, the observed high luminosity of WLQs (e.g., see Meusinger & Balafkan, 2014) excludes the possibility of radiatively inefficient accretion flow as the leading cause behind the origin of their weak emission lines. For models based on soft ionizing photons, the possible mechanisms are (i) a cold accretion disk around a supermassive black hole with for non-rotating and for maximally rotating black hole (Laor & Davis, 2011), though based on the measured SMBH mass of WLQs, it also appears to be an unlikely scenario (e.g., see Meusinger & Balafkan, 2014; Plotkin et al., 2015), (ii) extremely high accretion rate inducing a soft ionizing continuum (Leighly et al., 2007a, b), however, the observed low fraction of WLQs with such a required high accretion rate also excludes this possibility (e.g., see Nikołajuk & Walter, 2012). Another possibility is based on the high Eddington ratio in a geometrically thick accretion disk which creates a shielding gas that prevents the BLR from getting photo-ionized by a central continuum source (e.g.,see Wu et al., 2011; Luo et al., 2015; Ni et al., 2018; Paul et al., 2022). Sources with weak emission lines may also be obscured AGNs (Ulvestad & Antonucci, 1988), where spectropolarimetry is found useful to confirm or refute such possibility of obscuration of the continuum/BLR emission from the direct view (e.g., see Goodrich & Miller, 1988).
Alternatively, the BL-Lac nature of WLQs is also tested by comparing the intranight optical variability duty cycle (e.g., see Gopal-Krishna et al., 2013; Chand et al., 2014; Kumar et al., 2015, 2016, 2017) and nature of their optical polarization (e.g., see Smith et al., 2007; Diamond-Stanic et al., 2009; Heidt & Nilsson, 2011; Kumar et al., 2018). Unlike the blazars with higher INOV duty cycle ( 30 - 50%) (e.g., see Gopal-Krishna & Wiita, 2018) and higher polarization value, the WLQs are found to have a INOV duty cycle of 5% and polarization of , thus are more like a normal radio-quite quasars. These observational pieces of evidence seems to favour the scenario where WLQs might belong to the early phase of AGNs’ lifetime rather than being the radio-quiet counterparts of BL Lac. In this evolutionary scenario, the radiation from the spherical cocoon of gas can easily escape through the axis of angular momentum and hence help in the formation of doughnut-shape structure, finally leading to the dusty torus (e.g., see Liu & Zhang, 2011, their figure 5). Accordingly, the accretion disk in WLQs will be relatively recently established, and hence the BLR is unlikely to be significantly developed yet (e.g., see Hryniewicz et al., 2010; Liu & Zhang, 2011; Andika et al., 2020). This will have its consequences on the covering factor of the BLR in WLQs, to be at least an order of magnitude smaller compared to the normal QSOs, as found in the study of Nikołajuk & Walter (2012) based on the ratios of high-ionization line and low-ionization line regions. Additionally, Gaskell et al. (2007); Gaskell (2009) has argued that the covering factor of BLR and dusty torus has to be the same. This is due to the fact that lower covering factor of torus will lead to BLR in absorption which is not supported by observation (e.g., see Antonucci et al., 1989; Koratkar et al., 1992). Similarly, the torus with a covering factor higher than BLR will be unable to exist due to direct radiation from the central source on its portion not shielded by the BLR (e.g., see Gaskell, 2009). For instance, Netzer & Laor (1993) proposed that the outer boundary of the BLR is set by dust formation which is also confirmed by IR reverberation mapping (e.g., see Suganuma et al., 2006; Gaskell et al., 2007), predicting that the covering factor of BLR and dusty torus should be similar. Therefore, in the case of WLQs, if they have an underdeveloped BLR, then the smaller covering factor of the dusty torus will have additional observational consequences in the infrared (IR) band, viz., the reduction of its IR emissivity in comparison to the normal QSOs. To test this hypothesis, a comparison of the infrared spectral energy distribution (SED) of WLQs and normal QSOs matched in their optical luminosity and redshift will be very useful. In this context, Diamond-Stanic et al. (2009) has reported a reduction of about 30–40% in the IR luminosity of two WLQs (viz., SDSS J140850.91+020522.7 with EW(C IV) = 1.95 Å and SDSS J144231.72+011055.2 with EW(C IV) = 16.9 Å). Similarly, Zhang & Liu (2016) have also compared the IR luminosity of normal QSOs with WLQs by using SED fitting, and they have found that WLQs and normal QSOs are statistically similar, though their results are consistent with the evolution scenario. Also, their model of SED fitting was very simplistic, consisting of only the best-fit model of power law and a single-temperature black body. In such a simplistic model, any difference in the IR-luminosity originating from the dusty torus might get diluted in the absence of a proper decomposition of the various emission components of AGN nuclei, such as the AGN inner accretion disk, dusty torus, host galaxy, and the cold dust in star-forming regions. Therefore, to confirm or refute the scenario of the less developed BLR as the cause of the weak emission line in WLQs based on the observed IR emission from the dusty torus, it becomes important to carry out the SED fitting of the large sample of the WLQs by properly decomposing the various components of emissions. This forms the main motivation of the present work. Here we used IR observations of WLQs from the Wide-field Infrared Survey Explorer (WISE; Wright et al., 2010) band in conjunction with their SDSS observation in the optical band, to model the SED of each WLQ and compare it with the SED of control sample of normal QSOs matched in redshift and SDSS r-band magnitude.
2 Sample of WLQs
Our parent sample consists of WLQs selected from two catalogs based on the SDSS Data Release 7 (DR-7 Abazajian et al., 2009) given by Plotkin et al. (2010a, hereafter PL10) and Meusinger & Balafkan (2014, hereafter MB14). In table 6 of the PL10 catalog, they have given a list of 86 high-confidence WLQs based on featureless optical spectra and radio-quietness (i.e. ). In the catalog of MB14, they employed machine learning data mining techniques to the large database of quasars in the SDSS DR7 pipeline (DR-7; Abazajian et al., 2009). This is followed by manual inspection as well as imposing rest-frame equivalent-width thresholds: EW(Mg ii) Å and EW(C iv) Å, leading to a well-defined sample of 46 WLQs. Out of them, 9 were found to be common with the 86 WLQs taken from PL10, leading to the addition of only 37 WLQs from the MB14 sample. All the 86 WLQs in the PL10 are radio-quiet, having a radio-loudness parameter, R 10. However, among the 37 sources considered from the MB14 catalog, 15 sources were excluded due to their radio-loudness parameter R10. As a result, we are left with 108 WLQs (86 from PL10 and 22 from MB14) as our initial parental sample. We further checked for the availability of the WISE data for our sample of these 108 WLQs in the compilation of Pâris et al. (2018) in the SDSS DR14 quasar catalog and found that the WISE data is available for 98 WLQs. We have also carried out a visual inspection of the SDSS spectrum of these 98 WLQs and noted that 5 sources were genuinely identified as galaxies and hence reduced our sample to 93 sources. As an extra check for the genuine extra-galactic nature of our sources, we also checked the proper motion of our sources based on the proper motion catalog of Monet et al. (2003). For this, a criterion of proper motion to be either zero or consistent with zero at level is adopted (e.g., see Kumar et al., 2015). This criterion excluded 12 sources with significant proper motion and led us to a sample of 81 sources. Further, we have also excluded 4 sources belonging to crowded fields due to the high possibility of contamination of their photometric fluxes (to be used in our SED fit), leading to a sample of 77 sources. For the comparison of the SED of the WLQs with the normal quasars, we have made the control sample of normal quasars matching in redshift and r-band magnitude with WLQs within the tolerance of and mag, respectively. The chosen tolerance limits are found optimal to get 55 normal QSOs control samples for each WLQ except 8 WLQs. These 8 WLQs belong either to very low (0.04z0.06) or very high (3.5z6.5) redshift ranges, resulting in scarcity of sources for the control sample within the tolerance limits. This led to our sample of 69 WLQs sources along with a control sample of 55 normal QSOs for each of them, with details such as name, RA, DEC, optical (u, g, r, i, z) and infrared (W1, W2, W3, W4) magnitude, as given in Table 1 for WLQs as well as in Table 2 for the median properties of the control sample of normal QSOs corresponding to each WLQs.
| SN. | Source Name | R.A | Dec | z | err | err | err | err | err | err | err | err | err |
|---|---|---|---|---|---|---|---|---|---|---|---|---|---|
| 1 | J001444.03000018.5 | 3.68 | 0.005 | 1.549 | 18.2 0.02 | 17.990.03 | 17.870.03 | 17.720.02 | 17.580.02 | 14.980.04 | 13.960.04 | 11.290.2 | 8.340.04 |
| 2 | J001514.88103043.6 | 3.81 | 10.51 | 1.170 | 19.590.05 | 19.570.03 | 19.230.02 | 19.10.02 | 19.030.06 | 15.710.05 | 14.790.07 | 12.070.38 | 8.810.05 |
| 3 | J001741.87105613.2 | 4.42 | 10.94 | 1.806 | 19.220.03 | 19.00 0.03 | 18.8 0.02 | 18.640.02 | 18.630.04 | 16.060.06 | 14.730.06 | 11.510.21 | 8.750.06 |
| — | — | — | — | — | — | — | — | — | — | — | — | — | — |
| Note: The entire table is available in online version. Only a portion of this table is shown here to display its form and content. | |||||||||||||
| SN. | Source Name* | err | err | err | err | err | err | err | err | err |
|---|---|---|---|---|---|---|---|---|---|---|
| 1 | J001444.03000018.5 | 18.40 0.00 | 18.090.00 | 17.960.00 | 17.740.00 | 17.740.00 | 14.55 0.13 | 13.15 0.13 | 10.06 0.13 | 7.87 0.13 |
| 2 | J001514.88103043.6 | 19.70 0.01 | 19.550.00 | 19.220.00 | 19.2 0.00 | 19.27 0.01 | 15.53 0.13 | 14.33 0.13 | 11.48 0.13 | 8.66 0.13 |
| 3 | J001741.87105613.2 | 19.060.00 | 18.890.00 | 18.80 0.00 | 18.520.00 | 18.510.00 | 15.48 0.13 | 14.20 0.13 | 10.94 0.13 | 8.43 0.13 |
| — | — | — | — | — | — | — | — | — | — | — |
| Note:The entire table is available in online version. Only a portion of this table is shown here to display its form and content. | ||||||||||
3 Analysis and Results
In our analysis of SED fitting, we have used the observed flux value of our WLQs sample and control sample derived from their optical SDSS magnitude in u, g, r, i and z bands, and in IR using the WISE magnitude in W1, W2, W3, and W4 bands as listed in Table 1 and Table 2, respectively. Here in the control sample, we have used the median value of the magnitude of the 55 normal QSOs corresponding to each WLQ and the error bar on the median magnitude is estimated as expected on the mean value by propagating the observed error bar of the individual sources. For conversion of SDSS magnitude to flux at the central waveband of the filter, we have used the online platform provided by Gemini222https://www.gemini.edu/observing/resources/magnitudes-and-fluxes/conversions-between-magnitudes-and-flux observatory, which is based on SDSS calibrations. For the conversion of WISE magnitude, we have used the formulae
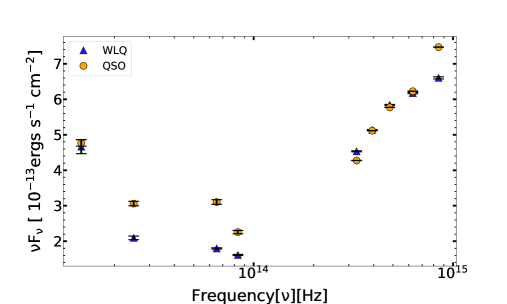
where is the zero magnitude flux density by assuming the AGN spectrum of the form , as detailed in Wright et al. (2010). In Fig. 1 we show the plot of the median values of the observed flux, at the central frequency of the WISE and SDSS filters, both for 69 WLQs as well as their control sample of normal QSOs. As can be seen from this figure, the WISE flux, especially in W1, W2, and W3, is systematically smaller for WLQs in comparison to their control sample of normal QSOs. The quantification of this difference (in observed frame) requires proper decomposition of SED (in rest frame) into its individual emission components, as detailed in the next section.
| SN. | Source Name | SB | BB | GA | TO | Age | N h | |||||||||
| 1 | J001444.03000018.5 | 8.75 | 2.23 | 2.97 | 3.88 | 2.50 | 0.10 | 0.05 | 5.68 | 21.29 | 46.63 | 46.39 | 46.7 | 46.2 | 46.19 | 45.97 |
| 2 | J001514.88103043.6 | 7.17 | 1.99 | 2.31 | 4.98 | 2.00 | 0.05 | 0.10 | 9.39 | 21.37 | 46.52 | 45.64 | 45.8 | 45.07 | 45.45 | 45.84 |
| 3 | J001741.87105613.2 | 6.39 | 2.24 | 2.45 | 3.61 | 2.39 | 0.04 | 0.27 | 6.47 | 21.38 | 46.27 | 46.29 | 46.29 | 45.37 | 46.19 | 45.6 |
| — | — | — | — | — | — | — | — | — | — | — | — | — | — | — | — | — |
| Note: The entire table is available in online version. Only a portion of this table is shown here to display its form and content. | ||||||||||||||||
| SN. | Source name∗ | SB | BB | GA | TO | Age | N h | |||||||||
| 1 | J001444.03000018.5 | 8.02 | 2.25 | 2.92 | 3.97 | 2.8 | 0.1 | 0.1 | 6.48 | 21.76 | 44.01 | 46.34 | 46.64 | 46.13 | 46.46 | 43.41 |
| 2 | J001514.88103043.6 | 10.16 | 1.67 | 2.28 | 3.58 | 2.28 | 0.05 | 0.04 | 8.13 | 21.26 | 43.99 | 45.61 | 45.78 | 45.04 | 45.72 | 43.28 |
| 3 | J001741.87105613.2 | 6.94 | 2.16 | 2.67 | 3.32 | 2.61 | 0.1 | 0.04 | 5.48 | 21.3 | 43.85 | 46.21 | 46.52 | 45.97 | 46.42 | 43.22 |
| — | — | — | — | — | — | — | — | — | — | — | — | — | — | — | — | — |
| Note: The entire table is available in online version. Only a portion of this table is shown here to display its form and content. | ||||||||||||||||
| Parameter∗ | WLQ | QSO | %deviation | ||
|---|---|---|---|---|---|
| SB | 1.99 0.22 | 1.68 | 1.84 0.23 | 1.78 | 5.93 19.17 |
| BB | 2.49 0.01 | 0.11 | 2.62 0.001 | 0.003 | 2.15 0.52 |
| GA | 4.29 0.05 | 0.39 | 3.52 0.004 | 0.03 | 23.01 1.44 |
| TO | 2.35 0.03 | 0.24 | 2.57 0.01 | 0.05 | 8.59 1.20 |
| EBV_bb | 0.06 0.01 | 0.08 | 0.10 0.01 | 0.02 | 6.27 15.47 |
| EBV_gal | 0.20 0.01 | 0.09 | 0.034 0.004 | 0.03 | 138.38 130.06 |
| Ldered(0.11 ) | 14.09 0.42 | 3.32 | 19.12 0.02 | 0.15 | 11.81 1.81 |
| Lga(0.11 ) | 5.16 0.15 | 1.17 | 6.28 0.01 | 0.06 | 5.75 7.37 |
| Ltor(130 ) | 8.85 0.51 | 4.002 | 13.99 0.29 | 2.32 | 41.69 1.59 |
| ∗SB, BB, GA, TO refers to normalization parameters of “starbusrt”, “big blue bump”, “galaxy” and “torus” component respectively. | |||||
| ∗EBV_bb, EBV_gal refers to the reddening parameters of “big blue bump” and “galaxy” component respectively. | |||||
| ∗Ldered, Lga, Ltor refers to the luminosity of “deredened big blue bump”, “galaxy” and “torus” component respectively. | |||||
| in unit of erg/s. | |||||
3.1 SED fitting using AGNfitter
The observed value of the flux at the central wavelength of the WISE and SDSS filters is used to fit the SED of each WLQ and the composite of their control sample, consisting of 55 normal QSOs, by using the publically available code AGNfitter333https://github.com/GabrielaCR/AGNfitter as detailed in Calistro Rivera et al. (2016). In brief, AGNfitter disentangles the physical processes responsible for AGN emission, such as the contribution from the stellar populations of the host galaxy, cold dust in star-forming regions, hot dusty torus, and AGN accretion disk. The SED can be constructed using model templates that depict the contribution of each source component at different wavelength ranges, including UV and optical wavelengths to sub-millimeters.
The SED of AGNs contains significant features in the ultraviolet to optical region known as the “Big Blue Bump”(BBB). The BBB is thought to originate from an optically thick accretion disk accreting matter into SMBH, whose energy contribution generally peaks at extreme ultraviolet wavelength regime (e.g., see Mathews & Ferland, 1987).
Modeling of BBB in AGNfitter is done by using the modified version of the empirical template given by Richards et al. (2006) which was derived based on composite spectrum obtained by using 259 Type-1 QSOs. The reddening law for this template was given by Prevot et al. (1984), which is found to be effective in treating reddening seen in Type-1 AGNs (e.g., see Hopkins et al., 2004; Salvato et al., 2008).
In their modification, they have independently modeled the mid-IR regime by using the warm dust template (e.g. Calistro Rivera et al., 2016).
The dusty torus components in AGNfitter are modeled using the empirical template given by Silva et al. (2004). For estimating the host galaxy contribution, a stellar population synthesis model of Bruzual & Charlot (2003) is used. Cold dust emission from the star-forming regions is modeled by using 169 templates with a wide range of SED shapes and luminosities (e.g., see Chary & Elbaz, 2001; Dale & Helou, 2002).
We have individually fitted the SED for each of the 69 WLQs and their corresponding fit of the median flux of their control sample of normal quasars, using AGNfitter, by converting the observed flux value to their rest-frame value.
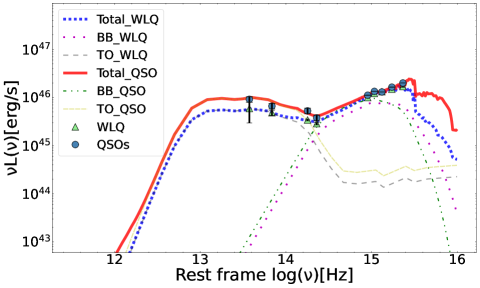
Further, to use the ratio of IR-luminosity to the bolometric luminosity () as a measure of covering factor of duty torus, we used the value from the literature. Out of the total 69 sources, the for 61 sources we have taken from Rakshit et al. (2020), and for 5 sources taken from the NASA/IPAC database444https://ned.ipac.caltech.edu/ and the remaining 3 sources without proper were excluded from our sample, reducing the sample to 66 sources. Lastly, we noticed in our SED fitted value of torus luminosity for 5 sources does not satisfy the physical condition of , and hence got excluded. This led to the final sample of 61 WLQs sources and the corresponding 61 SED fit of the median flux of the control sample consisting of 55 normal QSOs. The SED fits to our entire sample of 61 WLQs is given in online mode in Fig. A, however, for illustration in Fig. 2, we have shown our SED comparison of different components for one of the WLQs in our sample, namely J141141.96+140233.9, along with the corresponding fit of the median fluxes of its control sample of normal QSOs.
3.2 Dusty torus luminosity and covering factor
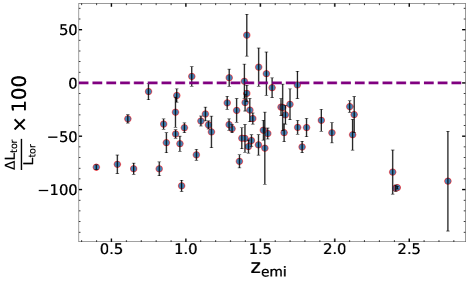
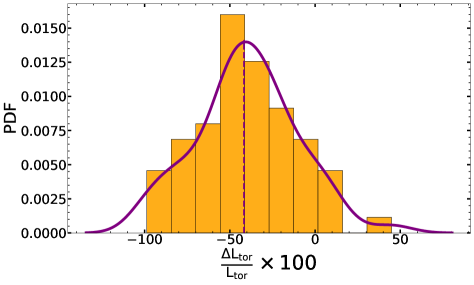
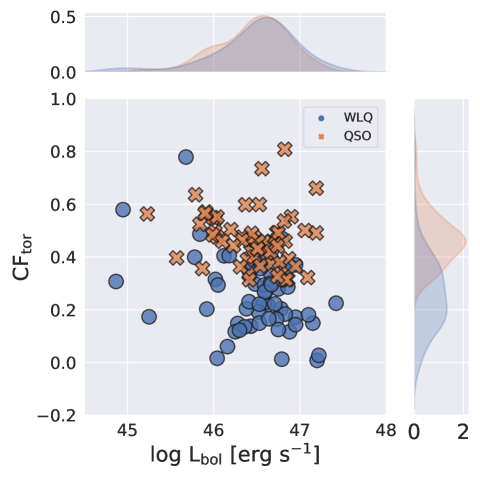
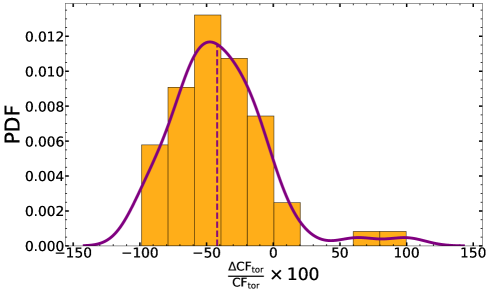
AGNfitter provides a list of various parameters associated with different components. Among them, few important are: (i) contribution from big blue bump (BBB) along with its reddening (E), (ii) torus emission parameterised by torus luminosity (L), torus column density, (iii) stellar emission parametrised by star formation time scale (), Galaxy age, reddening ((E)) and luminosity (L). The best-fit parameters of the SED fit of each of the 61 WLQs in our sample and their corresponding fit of the median fluxes of control sample of normal QSOs are given in Table 3 and Table 4, respectively. These parameters in AGNfitter are extracted based on their various realizations and the corresponding associated errors by using 16th and 84th-percentile realizations relative to the median 50th-percentile value, assuming the distribution function to be Gaussian. The scatter plot of with emission redshift () for our sample of 61 WLQs is shown in Fig. 3. As can be seen from this figure that (i) except for a few outliers, all WLQs shows smaller torus luminosity in comparison to their redshift and r-band magnitude matched sample of normal QSOs and (ii) the do not show any visual trend with the with their Pearson correlation coefficient of . This non-significant correlation of with allows us to carry out the statistical study of the entire sample even though our WLQs sample belongs to a range in (0.5 to 3.0). The median values of these parameters in 61 WLQs, and the percentage deviation of WLQs w.r.t the SED fit of the median flux of its control sample of normal QSOs are given in Table 5. In Fig. 4 we have plotted the kernel smooth probability distribution function (PDF) of . As can be seen from this figure that distribution is clearly showing smaller for WLQs with median value of to be . The Gaussian function fit to this distribution results in a typical uncertainty of . and got the bolometric luminosity from there. In total, we have 66 sources among 69 sources for which we have bolometric luminosity. Our estimated can also be used to estimate the covering factor of a torus (), in conjunction with the available measurements, as (e.g., see Zhang & Liu, 2016). The plot of with along with distributions of both for WLQs as well as normal QSOs are shown in Fig. 5. As can be seen from this figure, the distribution of WLQs and QSOs are similar with KS-test of , but the distribution of is significantly different with KS-test of , being systematically lower for WLQs. Since also includes the contribution from the , to check its impact on the derived result we also estimated the covering factor as - and found the percentage decrement of 61% which is higher than the 42% based on the use of . However, for the sake of comparison with earlier studies, we have adhered to the definition of covering factor of dusty torus as . In Fig. 6 we plot the kernel smooth probability distribution function of the percentage deviation of torus covering factor, -, which clearly shows the decrement in the covering factor of WLQs with a median value of about .
4 DISCUSSION AND CONCLUSIONS
With the advent of large spectroscopic surveys, various techniques have been used to unravel the nature of the enigmatic population of WLQs, especially in the context of testing two main scenarios: (i) insufficient ionizing photons as the cause of weak emission lines in WLQs and (ii) WLQs being in the early phase of quasar evolution where BLR is yet to be fully developed. As suggested by Gaskell (2009), such under-developed BLR will also suggest the low covering factor of the dusty torus, which will result in the decrement of IR-emission (e.g., see Sec. 1). To test this hypothesis, we have carried out the SED fitting of 61 WLQs and compared them with the control sample of the normal QSOs, matching in redshift and r-band magnitude (e.g., see Sec. 2). With our detailed SED modeling (e.g., see Sec. 3) the median value of is found to be with typical r.m.s scatter from the median of about 0.29 (e.g., see Fig. 4), suggesting that the torus luminosity of WLQs is about 42% lower in comparison to the redshift and (optical) luminosity matched sample of the normal QSOs.
Our results are consistent with many earlier studies suggesting that WLQs are in the AGN stage of the early phase of their evolution, where BLR has not yet fully developed and hence results in weak emission lines. For instance, Diamond-Stanic et al. (2009) reported that two WLQs are fainter in the IR band by 30-40% (e.g., see Sec. 1). On the other hand, Zhang & Liu (2016) have also carried out SED fitting of 73 WLQs, where although they did not find any significant difference in the SED of the WLQs and normal QSOs, their results were also supporting the evolution scenario for WLQs, where due to much larger scale of torus it should form before the formation of BLR. It may be noted that the procedure of SED fitting used in Zhang & Liu (2016), only involved components of power-law and black-body. However, in our SED fitting, we have carefully decomposed the various components of emission, which has allowed us to separate out the emission coming from the dusty torus. For comparison with normal QSOs, our study for the first time makes use of control sample matching in redshift and r-band magnitude. These two improvements have perhaps allowed us to detect the difference in torus luminosity of WLQs and normal QSOs, which was missing in the oversimplified aforementioned model used in Zhang & Liu (2016), in spite of the fact that the majority of sources in our sample overlap with their sample. Moreover, we also stress here that our results presented here are based on the comparison of WLQs SED fit with their redshifted and r-band luminosity matched control sample. As a result, any unknown systematics in observation and/or in SED modeling will not affect our above results of percentage deviation both regarding the torus (IR) luminosity as well as in the torus covering factor.
We also note that the emission redshift of our WLQs sample (hence of the redshift-matched control sample as well) varies over a wide range from 0.5 to 3.0. However, as can be seen from Fig. 3, the relative change of torus luminosity does not show any correlation with redshift. This non-evolution of with redshift enables us to compare statistically the distribution of the entire sample of WLQs with the control sample of normal QSOs, resulting in the aforementioned 422% IR-luminosity decrement in WLQs w.r.t the control sample of normal QSOs, comprising a 3 range of 36% to 48%. For individual sources also, it can be noted from Fig. 3 that the of WLQs is found to be consistently smaller in comparison to the control sample of normal QSOs, for all the individual sources in our sample except few outliers (being less than 10 percent). The distribution of is well fitted with Gaussian with a best fit mean of and of 0.29. The large value of () suggests that individual measurements of still have high uncertainty, which needs to be reduced either statistically by enlarging the sample size as employed in our study here or by using a large number of photometric data points in SED fit, such as by adding UV and X-ray data in future as well. It can also be noted that the error on the median (i.e., ) obtained after error propagation is almost half of the value obtained on the mean (i.e., ) based on the of the distribution. This could be either due to the error under-estimation in flux (i.e., magnitude) or over-estimation of the r.m.s scatter due to a few outliers. Nevertheless, to be on the conservative side, even if we took the higher conservative uncertainty (i.e., 4% on median value), the decrement detected here in IR-luminosity in WLQs w.r.t the control sample of normal QSOs still deviates from zero at high significance with 3 range of 30% to 54% around the measured value of .
Based on the measured width of the emission line, we notice that all the sources in our sample are Type-I AGNs, so it is unlikely that the decrement in IR flux in WLQs can be attributed to any an-isotropic emission of BBB component if it arises from the accretion disk, as such an effect would be dominant in the sample dominated by Type-II AGNs. We also note that the photometric data points used in optical-based on SDSS and in IR-based on WISE are not simultaneous. As a result, our SED fit implicitly assumes that the variation of WLQs and/or of QSOs used in our sample is not very significant. This could be a reasonable assumption as both WLQs and normal QSOs show nominal variation, unlike the highly variable sources such as Bl Lacs and blazar (e.g., see Diamond-Stanic et al., 2009; Shemmer et al., 2010; Nikołajuk & Walter, 2012; Kumar et al., 2018). Moreover, our study used a reasonably large sample, so any nominal variation between the epoch of IR and optical photometric observation in any individual source should not have any significant effect on our above statistical result. Further, we also noted that in our r-band magnitude matched sample of WLQ and normal QSOs, the possibility of the emission line flux contribution will be more in QSOs (due to strong emission lines) than in WLQs (due to weak emission lines). This implies that the intrinsic continuum of WLQs (having less contamination of emission lines) may be brighter (in optical and hence in IR as well) than their control sample of normal QSOs (matched in r-band magnitude). As a result, the actual decrement of IR flux in WLQs might be more than 42% as we have found here. The other possibility, in the context of our result of WLQs being in the early phase of AGN evolution, maybe the episodic phase of the AGN. However, observationally, AGN’s episodic activities are mainly inferred based on episodic changes in their brightness or recurring jet activities (e.g., see Saikia & Jamrozy, 2010; Khrykin et al., 2016), typically giving an episodic time scale of a few million years. In this scenario, if the WLQs phase is a new emerging episode of AGN activity, then it may be in the phase of growing brightness due to restarted AGN activities without destroying the BLR. This might lead to more decrement in continuum and hence increase the measured equivalent width of the emission line, contrary to the systematically smaller EW in WLQs. It suggests that the WLQs maybe perhaps in the early phase of AGN’s formation rather than belonging to any episodic phase.
The lower will also have additional consequences in lowering the torus covering factor () estimated as . As can be seen from Fig. 5 that the distribution for WLQs is significantly lower than that of the normal QSO, with KS-test of . This results in a median percentage decrement of (e.g., see Fig. 6) with a typical r.m.s scatter from the median of about , suggesting that the torus covering factor of WLQs on an average is about smaller with a of to than that of the normal QSOs of similar redshift and optical luminosity. The covering factor of the torus and the BLR has to be of a similar order (e.g., Antonucci et al., 1989; Netzer & Laor, 1993; Suganuma et al., 2006; Gaskell et al., 2007; Gaskell, 2009), so from our above results, we conclude that the BLR in the WLQs is underdeveloped and it can be a dominant cause of the weakness of their emission line. This gives support to the model of WLQs proposed based on their evolution scenario where WLQs are a special stage in the early phase of AGNs.
Acknowledgments
We thank the referee Professor Robert R. J. Antonucci for his critical comments and helpful suggestions on the manuscripts. RK and HC are grateful to Gabriela Calistro-Rivera for making the code AGNfitter public, and IUCAA for the hospitality under IUCAA associate programme.
DATA AVAILABILITY
The data used in this study are publicly available in the SDSS DR14 and WISE All-Sky Data Release.
References
- Abazajian et al. (2009) Abazajian K. N. et al., 2009, ApJS, 182, 543
- Anderson et al. (2007) Anderson S. F. et al., 2007, AJ, 133, 313
- Andika et al. (2020) Andika I. T. et al., 2020, The Astrophysical Journal, 903, 34
- Antonucci (1993) Antonucci R., 1993, Annual review of astronomy and astrophysics, 31, 473
- Antonucci et al. (1989) Antonucci R. R. J., Kinney A. L., Ford H. C., 1989, ApJ, 342, 64
- Begelman et al. (1984) Begelman M. C., Blandford R. D., Rees M. J., 1984, Reviews of Modern Physics, 56, 255
- Boyle et al. (2000) Boyle B. J., Shanks T., Croom S., Smith R., Miller L., Loaring N., Heymans C., 2000, Monthly Notices of the Royal Astronomical Society, 317, 1014
- Brotherton et al. (2001) Brotherton M., Tran H. D., Becker R., Gregg M. D., Laurent-Muehleisen S., White R., 2001, The Astrophysical Journal, 546, 775
- Bruzual & Charlot (2003) Bruzual G., Charlot S., 2003, Monthly Notices of the Royal Astronomical Society, 344, 1000
- Calistro Rivera et al. (2016) Calistro Rivera G., Lusso E., Hennawi J. F., Hogg D. W., 2016, Astrophysical journal., 833, 98
- Chand et al. (2014) Chand H., Kumar P., Gopal-Krishna, 2014, MNRAS, 441, 726
- Chary & Elbaz (2001) Chary R., Elbaz D., 2001, The Astrophysical Journal, 556, 562
- Collinge et al. (2005) Collinge M. J. et al., 2005, AJ, 129, 2542
- Dale & Helou (2002) Dale D. A., Helou G., 2002, The Astrophysical Journal, 576, 159
- Diamond-Stanic et al. (2009) Diamond-Stanic A. M. et al., 2009, ApJ, 699, 782
- Dietrich et al. (2002) Dietrich M., Hamann F., Shields J., Constantin A., Vestergaard M., Chaffee F., Foltz C., Junkkarinen V., 2002, The Astrophysical Journal, 581, 912
- Fan et al. (2006) Fan X. et al., 2006, AJ, 131, 1203
- Francis et al. (1993) Francis P., Hooper E. J., Impey C. D., et al., 1993, AJ
- Gaskell (2009) Gaskell C. M., 2009, New Astronomy Reviews, 53, 140
- Gaskell et al. (2007) Gaskell C. M., Klimek E. S., Nazarova L. S., 2007, arXiv preprint arXiv:0711.1025
- Goodrich & Miller (1988) Goodrich R. W., Miller J. S., 1988, ApJ, 331, 332
- Gopal-Krishna et al. (2013) Gopal-Krishna, Joshi R., Chand H., 2013, MNRAS, 430, 1302
- Gopal-Krishna & Wiita (2018) Gopal-Krishna, Wiita P. J., 2018, Bulletin de la Societe Royale des Sciences de Liege, 87, 281
- Heidt & Nilsson (2011) Heidt J., Nilsson K., 2011, A&A, 529, A162
- Hopkins et al. (2004) Hopkins P. F. et al., 2004, The Astronomical Journal, 128, 1112
- Hryniewicz et al. (2010) Hryniewicz K., Czerny B., Nikołajuk M., Kuraszkiewicz J., 2010, MNRAS, 404, 2028
- Kellermann et al. (1989) Kellermann K. I., Sramek R., Schmidt M., Shaffer D. B., Green R., 1989, AJ, 98, 1195
- Khrykin et al. (2016) Khrykin I., Hennawi J., McQuinn M., Worseck G., 2016, The Astrophysical Journal, 824, 133
- Koratkar et al. (1992) Koratkar A. P., Kinney A. L., Bohlin R. C., 1992, ApJ, 400, 435
- Kumar et al. (2018) Kumar P., Chand H., Srianand R., Stalin C. S., Petitjean P., Gopal-Krishna, 2018, MNRAS, 479, 5075
- Kumar et al. (2015) Kumar P., Gopal-Krishna, Chand H., 2015, MNRAS, 448, 1463
- Kumar et al. (2016) Kumar P., Hum C., Gopal-Krishna, 2016, Monthly Notices of the Royal Astronomical Society, 461, 666
- Kumar et al. (2017) Kumar P., Stalin C., Chand H., Srianand R., Petitjean P., 2017, Monthly Notices of the Royal Astronomical Society, 471, 606
- Laor & Davis (2011) Laor A., Davis S. W., 2011, MNRAS, 417, 681
- Leighly et al. (2007a) Leighly K. M., Halpern J. P., Jenkins E. B., Casebeer D., 2007a, ApJS, 173, 1
- Leighly et al. (2007b) Leighly K. M., Halpern J. P., Jenkins E. B., Grupe D., Choi J., Prescott K. B., 2007b, ApJ, 663, 103
- Liu & Zhang (2011) Liu Y., Zhang S. N., 2011, ApJ, 728, L44
- Luo et al. (2015) Luo B. et al., 2015, The Astrophysical Journal, 805, 122
- Mathews & Ferland (1987) Mathews W. G., Ferland G. J., 1987, ApJ, 323, 456
- Meusinger & Balafkan (2014) Meusinger H., Balafkan N., 2014, A&A, 568, A114
- Monet et al. (2003) Monet D. G. et al., 2003, AJ, 125, 984
- Netzer & Laor (1993) Netzer H., Laor A., 1993, ApJ, 404, L51
- Ni et al. (2018) Ni Q. et al., 2018, Monthly Notices of the Royal Astronomical Society, 480, 5184
- Nikołajuk & Walter (2012) Nikołajuk M., Walter R., 2012, MNRAS, 420, 2518
- Osmer et al. (1994) Osmer P. S., Porter A. C., Green R. F., 1994, The Astrophysical Journal, 436, 678
- Pâris et al. (2018) Pâris I. et al., 2018, Astronomy & Astrophysics, 613, A51
- Paul et al. (2022) Paul J. D. et al., 2022, The Astrophysical Journal, 929, 78
- Plotkin et al. (2010a) Plotkin R. M. et al., 2010a, AJ, 139, 390
- Plotkin et al. (2010b) Plotkin R. M., Anderson S. F., Brandt W. N., Diamond-Stanic A. M., Fan X., MacLeod C. L., Schneider D. P., Shemmer O., 2010b, ApJ, 721, 562
- Plotkin et al. (2015) Plotkin R. M. et al., 2015, ApJ, 805, 123
- Prevot et al. (1984) Prevot M., Lequeux J., Maurice E., Prévot L., Rocca-Volmerange B., 1984, Astronomy and Astrophysics, 132, 389
- Rakshit et al. (2020) Rakshit S., Stalin C., Kotilainen J., 2020, The Astrophysical Journal Supplement Series, 249, 17
- Richards et al. (2006) Richards G. T. et al., 2006, The Astrophysical Journal Supplement Series, 166, 470
- Saikia & Jamrozy (2010) Saikia D., Jamrozy M., 2010, arXiv preprint arXiv:1002.1841
- Salvato et al. (2008) Salvato M. et al., 2008, The Astrophysical Journal, 690, 1250
- Schneider et al. (1991) Schneider D. P., Schmidt M., Gunn J. E., 1991, AJ, 101, 2004
- Shemmer et al. (2010) Shemmer O. et al., 2010, The Astrophysical Journal Letters, 722, L152
- Silva et al. (2004) Silva L., Maiolino R., Granato G. L., 2004, Monthly Notices of the Royal Astronomical Society, 355, 973
- Smith et al. (2007) Smith P. S., Williams G. G., Schmidt G. D., Diamond-Stanic A. M., Means D. L., 2007, ApJ, 663, 118
- Suganuma et al. (2006) Suganuma M. et al., 2006, ApJ, 639, 46
- Ulvestad & Antonucci (1988) Ulvestad J. S., Antonucci R. R. J., 1988, ApJ, 328, 569
- Urry & Padovani (1995) Urry C. M., Padovani P., 1995, PASP, 107, 803
- Warren et al. (1994) Warren S. J., Hewett P. C., Osmer P. S., 1994, The Astrophysical Journal, 421, 412
- Wright et al. (2010) Wright E. L. et al., 2010, The Astronomical Journal, 140, 1868
- Wu et al. (2011) Wu J. et al., 2011, ApJ, 736, 28
- York et al. (2000) York D. G. et al., 2000, AJ, 120, 1579
- Yuan & Narayan (2004) Yuan F., Narayan R., 2004, The Astrophysical Journal, 612, 724
- Zhang & Liu (2016) Zhang X., Liu Y., 2016, The Astrophysical Journal, 830, 69
- Zheng et al. (1997) Zheng W., Kriss G. A., Telfer R. C., Grimes J. P., Davidsen A. F., 1997, The Astrophysical Journal, 475, 469