Mobility Census for the analysis of rapid urban development
Abstract
Traditionally urban structure and development are monitored using infrequent high-quality datasets such as censuses. However, human culture is accelerating and aggregating, leading to ever-larger cities and an increased pace of urban development. Our modern interconnected world also provides us with new data sources that can be leveraged in the study of cities. However, these often noisy and unstructured sources of big data pose new challenges. Here we propose a method to extract meaningful explanatory variables and classifications from such data. Using movement data from Beijing, which is produced as a byproduct of mobile communication, we show that meaningful features can be extracted, revealing for example the emergence and absorption of subcenters. In the future this method will allow the analysis of urban dynamics at a high spatial resolution (here, 500m) and near real-time frequency.
I Introduction
Understanding the dynamics of cities is a central goal of urban studies. Models and data have successfully explained urban structural evolution from various socioeconomic observations such as the evolution of income inequality [1, 2], ethnic identities [3, 4], environments [5], etc. For example the polycentric transition can be understood as the result of the competition among areas’ attractiveness as the balance of economic activities and the traffic congestion [6]; urban scaling laws were explained through balancing the socioeconomic outputs and infrastructural costs in [7].
Traditionally the development of cities has been studied using census datasets. On a decadal basis, a growing set of social variables (e.g. education outcomes, employment status, and housing conditions) are collected from the population and aggregated in spatial areas. Other studies use non-census datasets such as the American Communities Survey [8] or the Indicators of Multiple Deprivations in the UK [9]. Like the census, these datasets are carefully gathered in extensive surveys. They thus present high-quality data assembled at a significant cost. Hence census and census-like datasets are typically only available once every several years in most countries and thus offer only infrequent snapshots of urban development. This is aggravated by long turnaround times, meaning that data becomes available only years after data gathering has started.
Besides their well-known benefits, census-like datasets have some notable disadvantages. As they are based on fixed catalogues of questions they are biased by the question selection and phrasing and are not well suited to reveal unanticipated developments. Additionally decadal census data is starting to lose pace with the rapid development seen in modern megacities. To reveal sudden or novel development other, faster data are needed. For example, Germany has open-sourced mobility data to determine social structure and contact patterns in planning the COVID-19 response [10].
The recent progress in the availability of high-frequency mobility data opens up significantly new perspectives, enabling the rapid analysis based on unstructured and noisy, but rich and comparatively unbiased datasets. The patterns revealed in this type of data indicate some critical and diverse structures of the city on much shorter scales, e.g., the spatial and temporal decomposition of purpose [11], the role of cultural ties in human mobility [12], and the interplay between contact patterns and epidemic spreading [13, 14].
Mobility data is produced as a byproduct of our modern interconnected society and hence is less refined than purpose-generated datasets. Some obstacles must thus be overcome to allow for gainful analysis. Specifically, mobility data is primarily available in the form of location traces, sequences of locations at which an individual has been. Thus the data contains socioeconomic interactions only indirectly and is more complex and high-dimensional than the feature tables of typical census datasets. Nevertheless, our movement in space is driven by socioeconomic parameters and lifestyle choices and thus encodes much information on urban structure in an indirect way. This defines the need for preprocessing to create still high-dimensional, but more census-like data tables that capture mobility features of areas, rather than individual traces.
In the analysis of tabular census-like datasets recent progress has been made using diffusion maps [15, 16], a manifold learning technique that reduces the dimensionality of structured datasets in biological and social studies [17, 18, 19, 20]. Diffusion maps provide a nonlinear, deterministic, and hypothesis-free approach that identifies explanatory parameters in large high-dimensional datasets. For example, diffusion maps were recently used to extract explanatory variables from census data [20], pinpointing hubs of higher education and deprivation by higher education and deprivation as key factors shaping the urban environment.
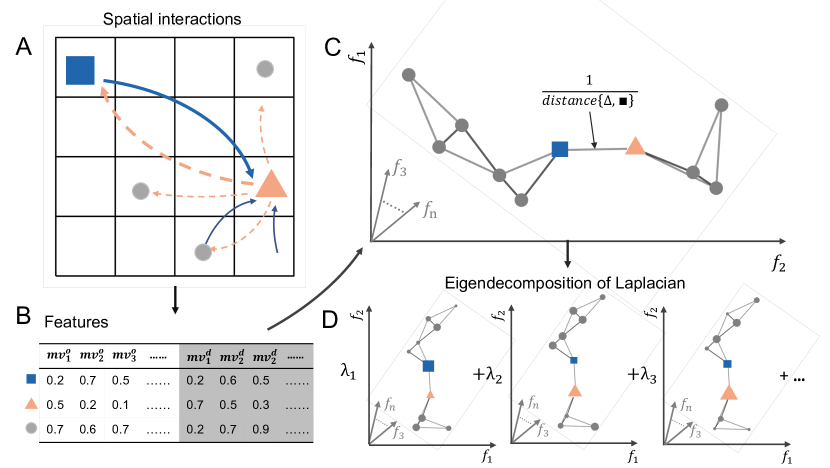
Here we propose Mobility Census (MC), a computational framework for high-frequency analysis of urban structure. Starting from mobility data, we discretized geographical space into a 500m grid. For each of these areas a rich set of features is then computed from the data. The result is a data table in which aspects of the mobility are captured by the values of 1,106 variables for each location. We then use diffusion mapping to reduce the dimensionality of this dataset and thus extract a set of aggregated variables that explain most of the variation between areas.
Using multi-year high-frequency mobility data of Beijing as an example, we discover the polycentric isolation patterns and separate local and global mobility features by analyzing indicators from recent human mobility studies and comparing the eigenfeatures and spatial distributions of the first-order statistics. We show that the place’s economic prosperity, location, and local irreplaceability are the most important mobility variables. Our study highlights Beijing’s rapid change, including the evolution of subcentres from the functional supplements of the main city to independent entities. In some cases this be attributed to important events such as the construction of a new airport, while in others they are the result of an accumulation of small scale changes.
II A census for human mobility
We illustrate the proposed procedure using an example dataset from Beijing. This data contains movements of all customers of China Unicom in the period August 1st to August 31st in 2018 and from May 1st to May 31st in 2021, amounting to ca. users and movements.
We start processing this data by partitioning the area of Beijing into a grid of cells. For each of these cells, we find the movements that start and end in the respective cell. This results in lists of timestamped movements, which have a different number of entries, depending on the cell under consideration.
To reduce the complexity of the dataset we then convert the list of movements for every cell to a set of 1,106 statistical properties that we call mobility variables. The mobility variables measure characteristic properties of the movements that start or terminate in the respective cell (see Supporting Information, SI). In this way, we thus obtain a census-like feature table for each of the cells.
The construction of the feature table provides a first reduction of data complexity. However, the feature table is still a high-dimensional data set that suffers from the curse of dimensionality [21]. To overcome this curse we further explore this table using a diffusion map analysis that was previously applied to census data [20].
The basic idea of the diffusion map [15] is that salient features of the data can be discovered by analyzing the topological structure of the dataset. The analysis starts by finding the most similar pairs of cells. Following [18], we compute the similarities between cells as a Spearman rank correlation [22] between the cell’s feature list (see SI).
A central insight underlying the diffusion map is that comparisons between very dissimilar objects are highly unreliable and introduce noise that can quickly swamp the salient information. It is therefore essential to remove such low-confidence comparisons from the analysis. Following an established approach [23, 24], we restrict the comparisons used in the subsequent steps to the 10 most similar cells of each cell.
The remaining comparisons now form a complex network between cells that can be mathematically described by a row-normalized Laplacian matrix [20]. The dimension of the eigenvectors of this matrix equals the number of cells. An eigenvector thus assigns a value to each of the cells. We can thus interpret the entries of each of the eigenvectors as one new feature for the cells. The new features identified in this way are in many ways similar to principal components [25], but provide a more robust, nonlinear parameterization of complex high-dimensional data.
In the following, we refer to the new features identified from the diffusion map as eigenfeatures (EF). Each EF corresponds to an eigenvalue which scales inversely with the variation captured by the respective feature. Hence the eigenvalues are indicative of the importance of the respective features, such that the most important eigenfeature is the one with the lowest non-zero eigenvalue.
III Dominant Patterns
We start our analysis by plotting the most important EFs (Fig. 2). We visualize the EFs as maps color-coded by the EF’s entries. For the first EF, , we find the highest values in the center, which coincide with central business areas such as Financial Street (a), China World Trade Center Towers (b), and Sanlitun. Pronounced local maxima also occur at emerging hubs of economic activity such as Xierqi-Huilongguan Fig. 2A(c) and Wangjing, Fig. 2A(d), well-known as the headquarters of most high-paying, high-tech companies, which act as local hubs of development. We thus conclude that detects a high density of workplaces in the urban center and subcenters.
To further explore we find the most strongly correlated mobility variables. The strongest correlations with indicators of a high volume of flow toward areas ranked highly by . This is consistent with our interpretation as the 1% of cells that score highest in this indicator contain 6% of the residential population but 13% of the workplaces. Also highly correlated is an indicator of flow diversity, which indicates that the areas highlighted by receive flow from a diverse range of origins.
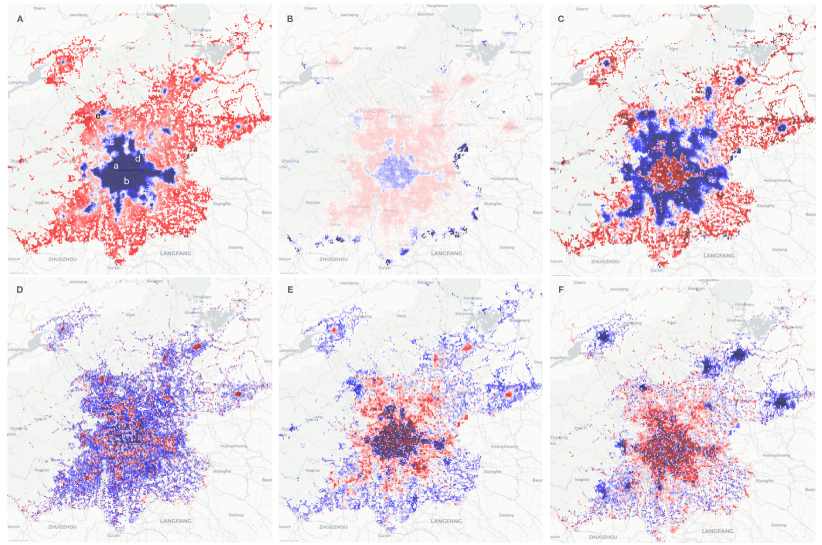
The second EF, , is the most strongly localized of the first six EFs, which can be mathematically verified by computing the inverse participation ratio (see SI). It has pronounced maxima at several locations in the south where major highways, such as the G103, G106, G230, and G102, enter the city. Moreover, we find a maximum in the center of Beijing at Sanlitun, an area well known for its embassies and nightclubs. What unites these locations is that they receive significant long-distance travel at nighttime hours, which is due to late-night party-goers (Sanlitun), or trucks, which are not allowed to travel in the daytime under Chinese regulations (motorway entry points). The long-distance, nighttime visits create a distinct traffic pattern that the diffusion map picks up. The most correlated variable with is an indicator of the diversity of in- and out-flow and trip duration, which is consistent with this interpretation.
In 2018, also highlighted some areas in the northern subcenters (see SI), but the respective maxima are no longer visible on the map for 2021. This can be interpreted as a sign the subcenters have lost attractivity as long-distance destinations in this period. Indeed, the house-job ratio and residential population in these subcenters increased significantly [26] and hence likely receive less long-range commuter traffic.
EF has a pronounced concentric structure, with strong positive values found both in the city centre and outlying villages, whereas the outer areas of the city are assigned negative values. In diffusion maps such high-low-high patterns can appear as harmonic modes of other prominent features. One must therefore particularly careful to avoid over-interpreting them. However, in a real date even harmonic modes often convey useful information.
Considering the metrics that correlate with highlights an indicator of the diversity of centrality values found in the surroundings. Thus places receiving high values in this EF are those which are surrounded by locations that differ in importance. Such differences are very pronounced in the city centre, whereas the outer areas supporting the center are much more uniform. In the outermost belt strong differences return, likely due to the spatial self-organization of outlying villages [27]. Hence, the boundary line where crosses from the negative back into the positive can be regarded as the true boundary of the city.
Computing the difference between the indicating variance of centrality and indicating centrality highlights local places of interest. The values of highlight local attractions. To confirm this we compared the highest values of in the center to the most searched shopping malls which reveal a very good agreement (Fig. 3A).
The next three EFs have a pronounced structure on the 500m scale. EF correlates very well with sinks and sources of short-range commuter traffic, with positive (negative) values marking the sources (sinks) of flows (Fig. 2D). The EF also correlates strongly with mobility variables that measure features that measures the relative volume during hours that correspond to typical closing times of businesses, corroborating this interpretation. We see that emerging software industry centers at Xierqi, Wangjing, and Yizhuang all receive strongly positive values. EF is similar but correlates with morning opening hours rather than evening closing times. These observations suggest and being livability and workplaceness indicators, respectively.
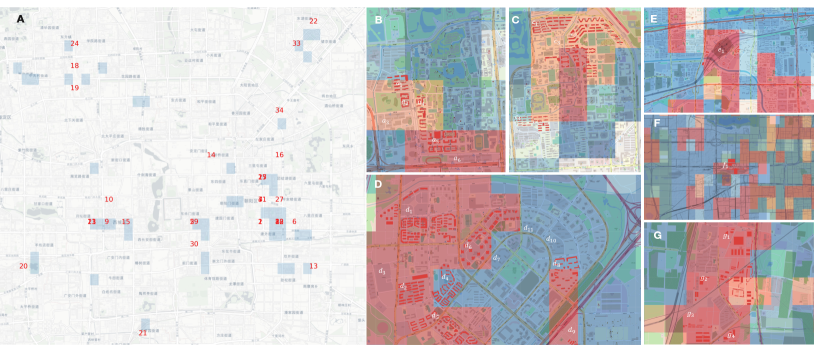
To corroborate the interpretation of we also explored it on a smaller scale, by considering the locations Peking University, Tsinghua University and Wangjing. At the detailed scale separates workplaces and residential sections within these areas (3B-D).
EF also exhibits a highly detailed pattern with positive and negative values occurring often in close proximity. However the center receives mostly positive values whereas the subcentres have mostly negative entries. This eigenfeature correlates strongly with mobility variables indicating long-distance trips. Hence we interpret this eigenfeature as an indicator of long-distance attractivity. This is confirmed by considering the entries on the detailed scale where the highest values of this EF are found at railway stations and the largest wholesale food market (Fig. 3E-G).
Interestingly, repeating the analysis for 2018 (Fig. S10) reveals also pronounced positive values in the sub-centers, which have vanished by 2021. This could indicate a change in mobility behavior induced by the COVID-19 restrictions, which also constrained travel on this scale and/or the increasing residential population mentioned above.
IV Subcentre evolution
Above we showed that the diffusion can extract salient functional variables (the EFs) from the high-dimensional set of mobility variables. It thus provides a reduction of the dimensionality of the data that is also valuable for subsequent analysis. Here we further aggregate the data by applying a Gaussian mixture model (GMM) [17], a statistical technique that can be used to break the data into distinct clusters.
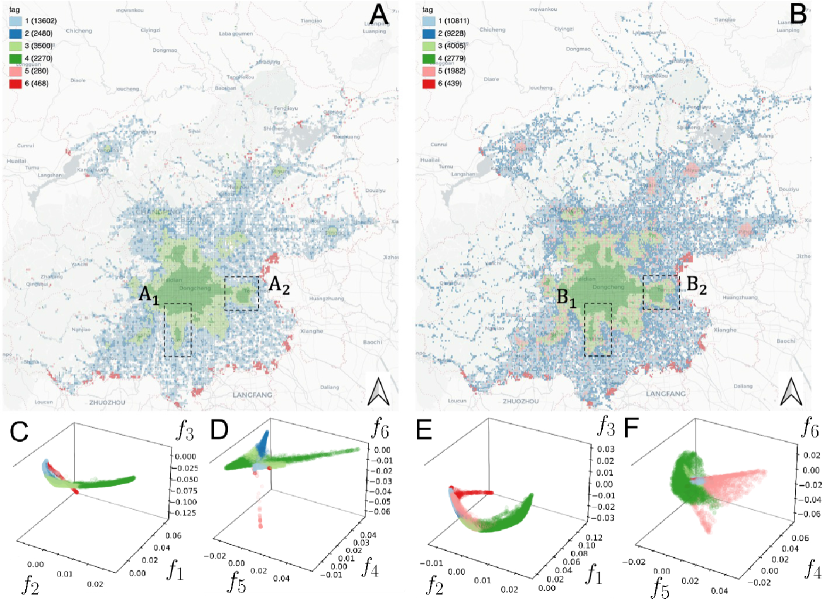
In the Beijing data GMM identifies 6 clusters (see SI). To gain a visual impression of the quality of the clustering result we can visualize the clusters in the data space defined by the most important EFs (Fig. 4C-F). This visualization shows that the partition the data manifold into coherent sections. Coloring the clusters in geographical space (Fig. 4A,B) reveals a clear separation into different areas, which we can operationally identify as rural areas (clusters 1,2, depending on local centrality), urban fringe (3), urban center (4), subcenters (5) and major gateways to the city (6).
We now use these operational designations in a longitudinal comparison of the situation in 2018 and 2021. While the big picture in both of these years is similar there are some notable differences. First we notice that the category that we identified as subcenter is much more prominent in 2021 than it was in 2018. During this period three areas in Northeastern Beijing (Pinggu, Huairou, and Miyun) and one area in Northwestern Beijing (Yanqing) transitioned from the urban fringe to the subcenter category. We conclude that new work opportunities, a rising residential population and also possibly COVID-19 related mobility restrictions have caused these four areas to develop into fully-fledged subcenters.
Another area of interest is Daxing in southern Beijing. In 2018 this well-developed subcenter is classified as an urban center while being separated from the main city center by an area of urban fringe. By contrast in 2021 the central area of Daxing has become connected to the main city center. A major event in this area that occurred in the intervening period is the opening of Beijing Daxing International Airport. We conclude that the construction and opening of this airport tied Daxing closer to the city center accelerated in the former fringe between the two areas, which is also evidenced by the construction of major motorways and underground connections in this area. As a result the subcenter of Daxing was effectively absorbed into the city center.
We see a similar development also in the area of Tongzhou which becomes likewise connected to the city center between 2018 and 2021. In this case the development was likely triggered by the relocation of Beijing municipal government, which moved to Tongzhou in 2019.
V Conclusions
In this paper, we proposed a new method, the mobility census, for the analysis of urban structure from big unstructured datasets. The proposed method first generates a large number of different metrics (here 250) for each geographical area, to turn the unstructured dataset into a structured table. We then use the diffusion map to extract a smaller number of salient features. This reduces the dimensionality of the data, and thus avoids the “curse of dimensionality” while enabling subsequent analysis.
Application of the method to Beijing showed that the method can identify distinct functional classes of areas. While the diffusion map does not in itself provide an interpretation of these classes, interpretations can be assigned using expert knowledge. We note that such interpretations, including the ones in this paper, should at first be treated as hypothesis, but can later be corroborated using additional analysis and data.
Already the diffusion map analysis identifies major explanatory variables that shape the city (cf. [20]), such attractivity, workplace and housing density and nighttime activity. Revealing these features provides insight into the functional organization of cities and their temporal evolution. Notably, the method provides this information with high spatial (here, 500m) and temporal (1 month) resolution.
The dimensionality reduction provided by the diffusion map also enables subsequent steps, such as the clustering analysis presented here. We showed that this analysis provides a useful tool to categorize areas within cities and identify boundaries. Moreover, it provides a high-resolution view of important geographical processes, such as the emergence of fully-fledged subcenters and the absorption of subcenters into the city center.
The mobility data used in this study is presently produced at a massive scale as a byproduct of mobile communication. The mobility census method proposed here can be applied to aggregated data products of such mobility data, thus avoiding data protection concerns. Moreover, it provides a numerically efficient, deterministic, and hypothesis-free approach to the analysis of such data. We envision that in the future, the application of this method may provide a high-resolution and near-real-time view of the evolution of our ever-growing and ever-accelerating urban environments.
This research was funded by the National Natural Science Foundation of China (41830645 and 41971331). Xiu was funded by the China Scholarship Council.
References
- Atkinson and Brandolini [2009] A. B. Atkinson and A. Brandolini, On data: a case study of the evolution of income inequality across time and across countries, Cambridge Journal of Economics 33, 381 (2009).
- Bryan and Martinez [2008] K. A. Bryan and L. Martinez, On the evolution of income inequality in the united states, FRB Richmond Economic Quarterly 94, 97 (2008).
- Kertzer and Arel [2002] D. I. Kertzer and D. Arel, Censuses, identity formation, and the struggle for political power, Census and identity: The politics of race, ethnicity, and language in national censuses 1 (2002).
- Benjamin et al. [2005] D. Benjamin, L. Brandt, and J. Giles, The evolution of income inequality in rural china, Economic Development and Cultural Change 53, 769 (2005).
- Carpio et al. [2020] M. Carpio, Á. González, M. González, and K. Verichev, Influence of pavements on the urban heat island phenomenon: A scientific evolution analysis, Energy and Buildings 226, 110379 (2020).
- Louf and Barthelemy [2013] R. Louf and M. Barthelemy, Modeling the polycentric transition of cities, Physical review letters 111, 198702 (2013).
- Bettencourt et al. [2007] L. M. Bettencourt, J. Lobo, D. Helbing, C. Kühnert, and G. B. West, Growth, innovation, scaling, and the pace of life in cities, Proceedings of the national academy of sciences 104, 7301 (2007).
- Bureau [2009] C. Bureau, Statistical abstract of the United States 2010 (Government Printing Office, 2009).
- Payne and Abel [2012] R. A. Payne and G. A. Abel, Uk indices of multiple deprivation—a way to make comparisons across constituent countries easier, Health Stat Q 53, 2015 (2012).
- Wiedermann et al. [2022] M. Wiedermann, A. H. Rose, B. F. Maier, J. J. Kolb, D. Hinrichs, and D. Brockmann, Evidence for positive long-and short-term effects of vaccinations against covid-19 in wearable sensor metrics–insights from the german corona data donation project, arXiv preprint arXiv:2204.02846 (2022).
- Peng et al. [2012] C. Peng, X. Jin, K.-C. Wong, M. Shi, and P. Liò, Collective human mobility pattern from taxi trips in urban area, PloS one 7, e34487 (2012).
- Wu et al. [2016] W. Wu, J. Wang, and T. Dai, The geography of cultural ties and human mobility: Big data in urban contexts, Annals of the American Association of Geographers 106, 612 (2016).
- Barrat et al. [2021] A. Barrat, C. Cattuto, M. Kivelä, S. Lehmann, and J. Saramäki, Effect of manual and digital contact tracing on covid-19 outbreaks: a study on empirical contact data, Journal of the Royal Society Interface 18, 20201000 (2021).
- Oliver et al. [2020] N. Oliver, B. Lepri, H. Sterly, R. Lambiotte, S. Deletaille, M. De Nadai, E. Letouzé, A. A. Salah, R. Benjamins, C. Cattuto, et al., Mobile phone data for informing public health actions across the covid-19 pandemic life cycle, Science advances 6, eabc0764 (2020).
- Coifman et al. [2005] R. R. Coifman, S. Lafon, A. B. Lee, M. Maggioni, B. Nadler, F. Warner, and S. W. Zucker, Geometric diffusions as a tool for harmonic analysis and structure definition of data: Diffusion maps, Proceedings of the national academy of sciences 102, 7426 (2005).
- Coifman and Lafon [2006] R. R. Coifman and S. Lafon, Diffusion maps, Applied and computational harmonic analysis 21, 5 (2006).
- Levin et al. [2021] R. Levin, D. L. Chao, E. A. Wenger, and J. L. Proctor, Insights into population behavior during the covid-19 pandemic from cell phone mobility data and manifold learning, Nature Computational Science 1, 588 (2021).
- Ryabov et al. [2022] A. Ryabov, B. Blasius, H. Hillebrand, I. Olenina, and T. Gross, Estimation of functional diversity and species traits from ecological monitoring data, Proceedings of the National Academy of Sciences 119, e2118156119 (2022).
- Fahimipour and Gross [2020] A. K. Fahimipour and T. Gross, Mapping the bacterial metabolic niche space, Nature communications 11, 1 (2020).
- Barter and Gross [2019] E. Barter and T. Gross, Manifold cities: social variables of urban areas in the uk, Proceedings of the Royal Society A 475, 20180615 (2019).
- Weber et al. [1998] R. Weber, H.-J. Schek, and S. Blott, A quantitative analysis and performance study for similarity-search methods in high-dimensional spaces, in VLDB, Vol. 98 (1998) pp. 194–205.
- Spearman [1904] C. Spearman, nthe proof and measurement of association between two things, oamerican j (1904).
- Altman [1992] N. S. Altman, An introduction to kernel and nearest-neighbor nonparametric regression, The American Statistician 46, 175 (1992).
- Nadler [2008] B. Nadler, Finite sample approximation results for principal component analysis: A matrix perturbation approach, The Annals of Statistics 36, 2791 (2008).
- Abdi and Williams [2010] H. Abdi and L. J. Williams, Principal component analysis, Wiley interdisciplinary reviews: computational statistics 2, 433 (2010).
- Lin et al. [2015] D. Lin, A. Allan, and J. Cui, The impact of polycentric urban development on commuting behaviour in urban china: Evidence from four sub-centres of beijing, Habitat International 50, 195 (2015).
- Christaller [1966] W. Christaller, Central places in southern Germany, Vol. 10 (Prentice-Hall, 1966).