Av. Fernandez Concha 700, Las Condes, Santiago, Chile. 11email: c.obasi@uandresbello.edu 22institutetext: Centre for Basic Space Science, University of Nigeria, Nsukka Nigeria. 33institutetext: Vatican Observatory, V00120 Vatican City State, Italy. 44institutetext: Centro de Astronomía (CITEVA), Universidad de Antofagasta, Av. Angamos 601, Antofagasta, Chile. 55institutetext: Millennium Institute of Astrophysics, Nuncio Monseñor Sotero Sanz 100, Of. 104, Providencia, Santiago, Chile. 66institutetext: Department of Physics, University of California, Davis, CA 95616. 77institutetext: Instituto de Astronomía Teórica y Experimental (IATE, CONICET-UNC), Laprida 854, Córdoba, Argentina. 88institutetext: Observatorio Astronómico de Córdoba, Universidad Nacional de Córdoba, Laprida 854, Córdoba, Argentina. 99institutetext: Max-Planck Institute for Astronomy, Koenigstuhl 17, 69177 Heidelberg, Germany.
The globular cluster system of the nearest Seyfert II galaxy Circinus
Abstract
Context. The globular cluster (GC) system of Circinus galaxy has not been probed previously partly because of the location of the galaxy at - 3.8∘ Galactic latitude which suffers severely from interstellar extinction, stellar crowding and Galactic foreground contamination. However the deep near-infrared (NIR) photometry by the VISTA Variables in the Via Láctea Extended Survey (VVVX) in combination with the precise astrometry of Gaia EDR3 allow us to map GCs in this region.
Aims. Our long-term goal is to study and characterise the distributions of GCs and Ultra-compact dwarfs of Circinus galaxy which is the nearest Seyfert II galaxy. Here we conduct the first pilot search for GCs in this galaxy.
Methods. We use NIR VVVX photometry in combination with Gaia EDR3 astrometric features such as astrometric excess noise and BP/RP excess factor to build the first homogeneous catalogue of GCs in Circinus galaxy. A robust combination of selection criteria allows us to effectively clean interlopers from our sample.
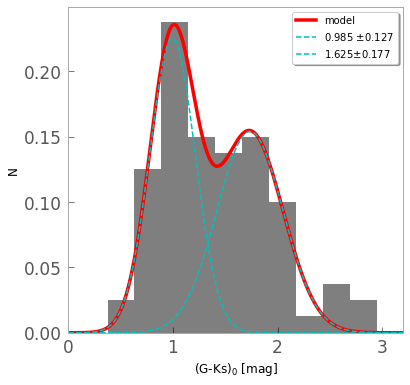
Results. We report the detection of 70 GC candidates in this galaxy at a 3 confidence level. They show a bimodal colour distribution with the blue peak at (G-Ks)0 = 0.9850.127 mag with a dispersion of 0.2110.091 mag and the red peak at (G-Ks)0 = 1.6250.177 mag with a dispersion of 0.4820.114 mag. A GC specific frequency (SN) of 1.30.2 was derived for the galaxy, and we estimated a total population of 12040 GCs. Based on the projected radial distribution it appears that Circinus has a different distribution of GC candidates than MW and M31.
Conclusions. We demonstrate that Circinus galaxy hosts a sizeable number of cluster candidates. This result is the first leap towards understanding the evolution of old stellar clusters in this galaxy.
Key Words.:
Circinus-galaxy–Old stellar Populations–Globular Clusters1 Introduction
Circinus galaxy or ESO 97-G13 is a nearby spiral galaxy first observed by Freeman et al. (1977) on optical plates. The galaxy is found at J2000 R.A. = 14h 13m 09.906s, DEC = -65º 20’ 20.47” ( = 311º.326, b = -3º.808), which is highly obscured and veiled by dust and high foreground stellar density from our Galaxy. The central region presents an interstellar extinction in the V-band of AV = 3.96 mag obtained by Schlafly & Finkbeiner (2011). It has a radial velocity of 434.41 km (or a redshift of 0.001448, Meyer et al., 2004) and it is located at about 4 Mpc away from the Milky Way (MW). The spectroscopic observations made by Oliva et al. (1994, 1998) showed an active nucleus confirming that Circinus is a Seyfert II galaxy.
The galaxy has an active core that is strong in X-ray, infrared and radio emissions (Guo et al., 2019; Yang et al., 2009). Matt et al. (1996) found an X-ray spectrum that is consistent with Compton scattering and fluorescent emission from cold matter illuminated by an obscured active nucleus. The IRAS fluxes of 246 Jy at 60 mm and 314 Jy at 100 mm (Ghosh et al., 1992; Yamada et al., 1993) are consistent with a far-infrared luminosity of 6 109 L⊙ which suggest a high starburst activity. It has been shown that Circinus contains a bright compact source through radio continuum observations (Freeman et al., 1977; Whiteoak & Bunton, 1985; Harnett, 1987; Davies et al., 1998) and prominent radio lobes roughly perpendicular to the galaxy’s major axis (Harnett et al., 1990; Elmouttie et al., 1995). Marconi et al. (1994) detected a circum-nuclear ring in the H line which implies a high concentration of molecular gas (see also Jones et al., 1999; Koribalski et al., 2004). Jones et al. (1999) showed that Circinus galaxy is over 80 arcmin long or nearly 100 kpc using its distance of 4 Mpc from HI observations taken with the Australia Telescope Compact Array (ATCA). They also found that Circinus has a large-scale spiral pattern with the inner radius being about 250 arcsec or 5 kpc. It contains a highly elongated structure with non-circular motions which suggests that Circinus is a barred spiral galaxy. Low resolution 21 cm observations have revealed the enormous HI envelope of the galaxy, its large-scale gas disk is shown to extend over an area more than one degree in diameter and is argued to be much larger than the stellar disk. The HI physical diameter of Circinus resembles that of the M83 galaxy (Jerjen & Koribalski, 2008).
Circinus appears to be isolated and has no known merger history. For et al. (2012) presented a detailed study of the galaxy, investigating its star formation, dust and gas properties in both the inner and outer disk using high-resolution Spitzer mid-infrared images with IRAC (3.6, 5.8, 4.5, 8.0 m) and MIPS (24 and 70 m) and sensitive HI data from the ATCA and the 64 m Parkes telescope. They derived AV = 2.1 mag from the spectral distribution and showed global star formation rates between 3 and 8 M⊙ yr-1. Together with Centaurus A they are the closest active galaxies to the MW. We show in Table 1 the measured parameters of this galaxy. Despite all the richness and interesting features found in this galaxy, most studies have been only limited to its nuclear region because of the location in the sky. The 2MASS Large Galaxy Atlas (Jarrett et al., 2003) gave us the initial view of the stellar content of Circinus, which was limited by its dust opacity at 2 m and its dense stellar foreground. They have prevented a detailed investigation of its large-scale structure and star clusters. As of today, we do not understand how the old stellar associations of Circinus are distributed.
Star clusters are crucial in our understanding of the evolution of galaxies. For this reason, we are using a combination of VISTA Variables in the Vía Láctea Extended Survey (VVVX, Minniti, 2018) data with Gaia EDR3 (Gaia Collaboration et al., 2021) to conduct the first search of globular clusters (GC) in Circinus galaxy. The paper is organized as follows: in Section 2 we describe the observations and in Section 3 we elaborate our methods to be used to search for the GCs. We present our results in Section 4 and the summary and conclusions in Section 5.
2 Observations
We used the VVVX described by Minniti (2018); Obasi et al. (2021) which maps the Galactic bulge and southern disk in the NIR with the VIRCAM (VISTA InfraRed CAMera) at the 4.1m wide-field Visible and Infrared Survey Telescope for Astronomy (VISTA; Emerson & Sutherland, 2010) at the European Southern Observatory (ESO) Paranal Observatory (Chile).
In this work, the data used consist of the two VVVX tiles e656 and e657, which cover the field of Circinus galaxy.
We created a photometric catalogue using SExtractor version 2.3.1 (Bertin & Arnouts, 1996), which is a program designed to detect, deblend, measure and classify sources from astronomical images. SExtractor is known as a useful tool to analyse overlapping objects found within the crowded region of the bulge and the disk. In order to generate the catalogue we used SExtractor in double-image mode with the Ks (full width at half maximum, FWHM=0.5′′) image as a reference because of its better quality. The Ks image was used for source detection, and H and J-passband images were used for colour measurements only. We set our DETECT_THRESH and ANALYSIS_THRESH to 5 in order to minimise spurious detections.
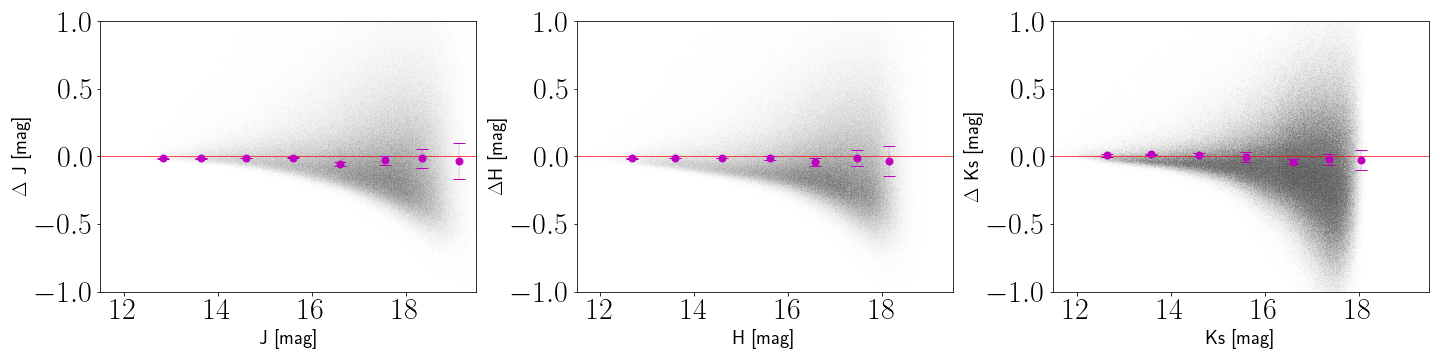
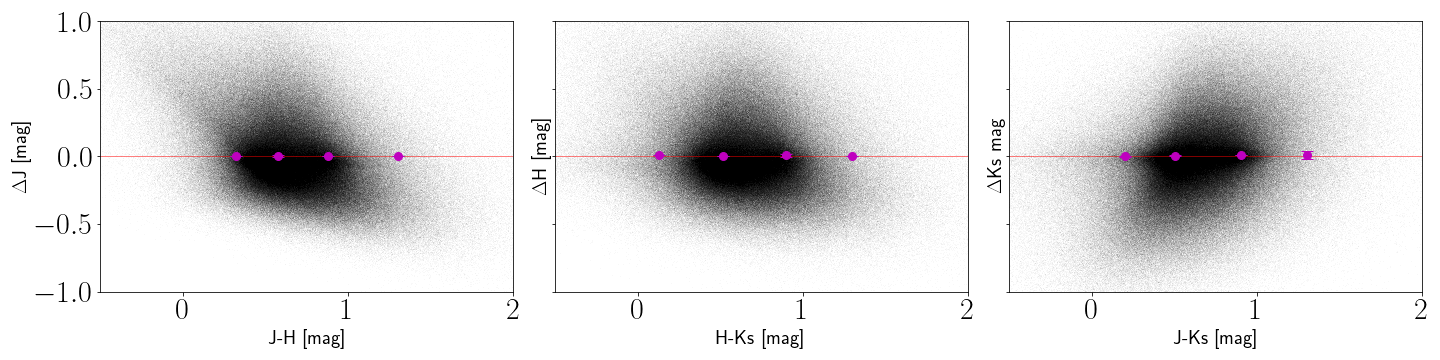
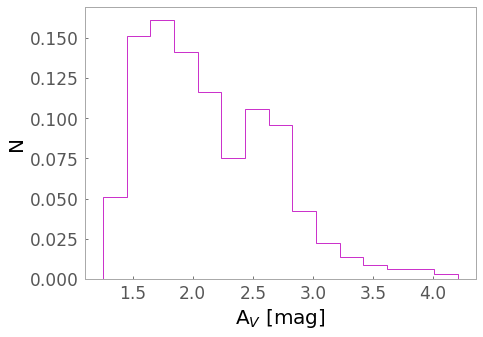
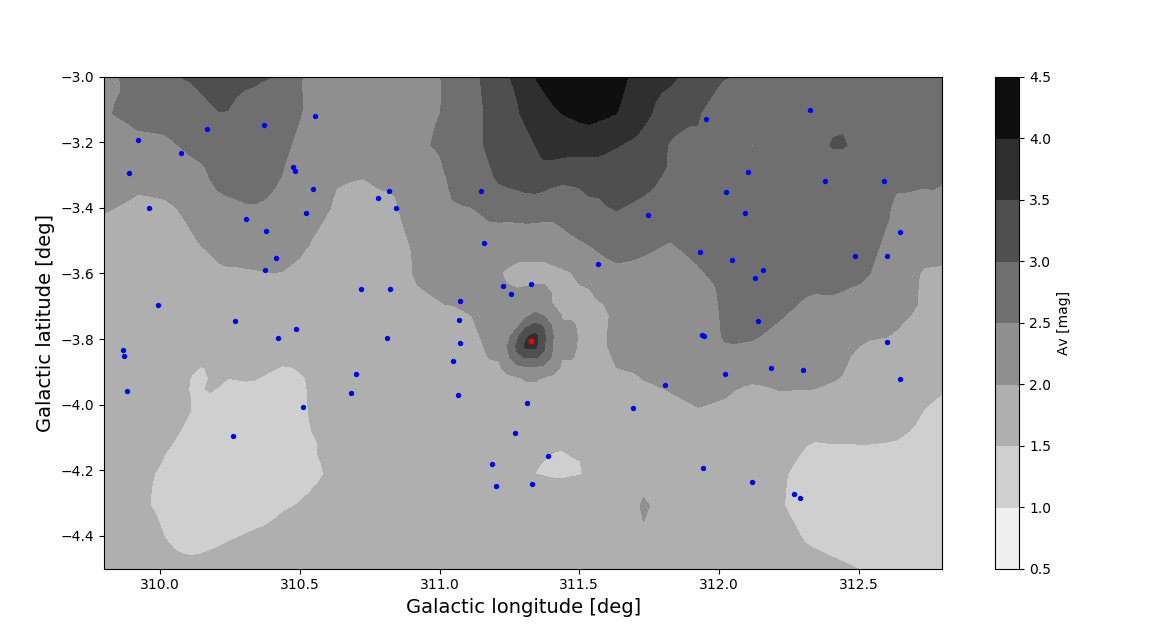
The photometry in each of the VVVX fields e656 and e657 was treated independently. The magnitudes were corrected for total interstellar extinctions following the maps of Schlafly & Finkbeiner (2011). Based on our detected point sources, we show in Figure 1 the total interstellar extinction distribution in the two VVVX fields which include Circinus galaxy. The peak in AV is around 1.7 mag with a mean value of 2 mag. The complex pattern shown by the interstellar extinction makes it necessary to perform this correction locally instead of adopting a global AV. Using AV = 3.1 E(B-V), we derived AV = 3.96 mag for Circinus centre. Relative extinctions AJ= 0.280AV, AH=0.184AV and AKs=0.118AV from Catelan et al. (2011) were used to obtain interestellar extinctions for each point sources. Once the catalogues were generated for each field, we use the point spread function (PSF) photometry to calibrate them using a preliminary version of the new VVVX photometric catalogue (Alonso-García et al., in prep; hereafter AG22). Before the calibration, the mean differences between AG22 and our instrumental magnitudes from SExtractor (MAG_AUTO) for the J, H and Ks passbands are 0.091, 0.088, and 0.053 mag, respectively. In Figure 2, we show the differences in the J, H and Ks magnitudes compared with our magnitudes after the zero point corrections (upper panels) and colours (bottom panels). For the upper panels, we divided our photometry into 1 magnitude bins and computed the median difference for each bin. For the bottom panels, bins of 0.4 mag were used and the median values for the differences in JHKs were also computed. The median values were then plotted, there seem to be no clear colour dependence. Our detection limits in J, H and KS passbands were 18.5, 18.0, and 17.5 mag, respectively. At the completion of the calibration, the two fields were concatenated as a single catalogue. As there was a small superposition between both VVVX fields, duplicate sources were removed and a sample of homogeneous data for Circinus galaxy was generated.
3 Searching for Globular Clusters
First, detected objects were classified into point and extended sources using the CLASSSTAR index provided by SExtractor. The CLASSSTAR is a stellarity index that is associated with the light distribution of the source.
It ranges from 1 for point sources such as stars to 0 for extended objects like galaxies.
To disentangle the different source types, SExtractor relies on a multi-layer feed-forward neural network trained using supervised learning to estimate a posteriori probability that the detection would be either a point source or an extended object. We selected point sources by adopting CLASSSTAR 0.5. 902,667 objects passed this selection which represents about 80 of all source detected. We then applied colour cuts in order to photometrically select those points sources that have colours and magnitudes consistent with those expected for GCs in other galaxies. From the catalogue of
Wang et al. (2014) there are 568 spectroscopically confirmed GCs
(Galleti et al., 2004)111This is the 2012 revised and updated Bologna catalogue of M31 GCs and candidates. It contains 625 confirmed GCs, 568 of which have a match in Wang et al. (2014) catalogue.
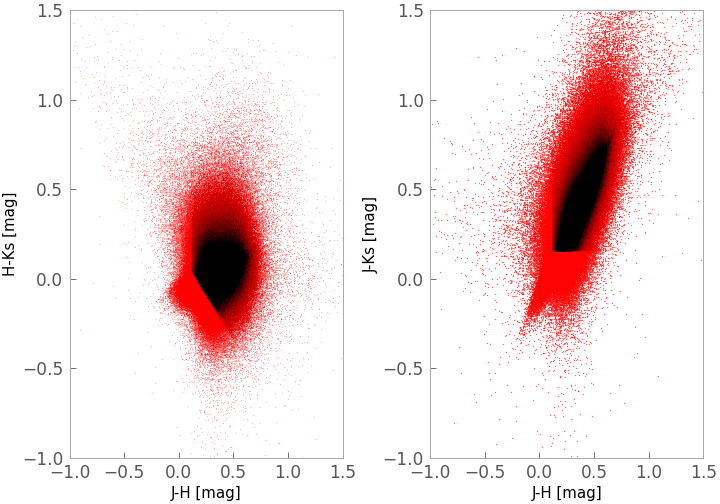
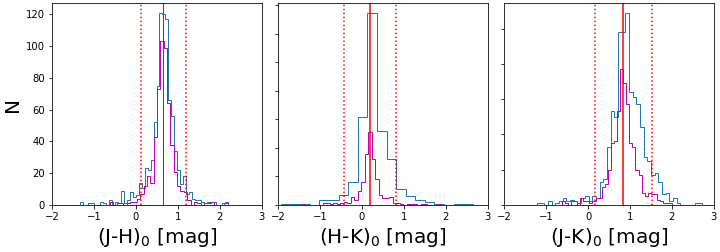
https://cdsarc.cds.unistra.fr/viz-bin/cat/V/143 that we used for our colour selection. Our adopted colour cuts were restricted to 2 statistical level from the mean GCs colours. This allows us to minimise the contamination from foreground stars. In Figure 12, we show the complete Wang et al. (2014) GC catalogue in blue and in magenta the confirmed GCs.
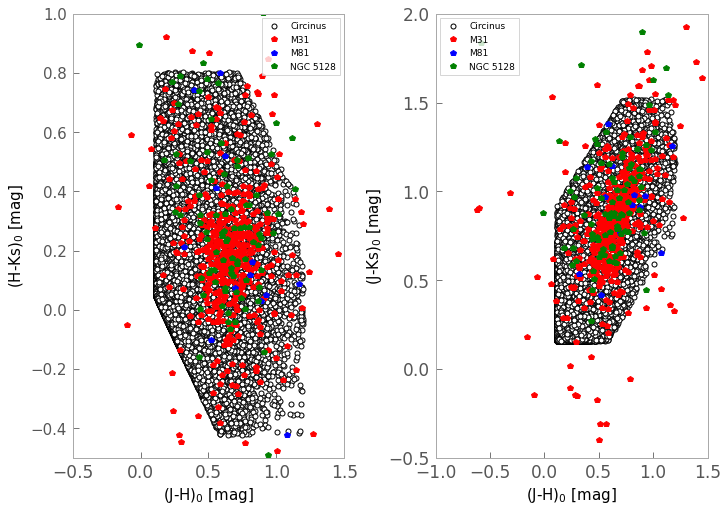
The mean colour obtained and their limits as applied to our selection are given as 0.655, 0.113 (J-H)0 1.197 mag, 0.189, -0.424 (H-Ks)0 0.802 mag and 0.839, 0.159 (J-Ks)0 1.519 mag. We obtained 791662 sources after the colour cuts, which account for 87.7 of
the total sources. The colour-colour selected region used for the rest of the analysis is shown in Figure 3. Upper panels show our selected region with black points and the bottom panels our selection overlaid with confirmed
GCs of M31 (Wang et al., 2014), M81 (Nantais & Huchra, 2010) and NGC5128 (Woodley et al., 2009; Taylor et al., 2015). They indicate that GCs occupy a wide range of colours.
Additionally, the sources that satisfy our colour cuts were cross-matched with Gaia EDR3 within a radius of 0.5′′. Gaia is an all-sky astrometric catalogue of more than a billion sources. The spatial resolution of the survey has improved from 0.40′′ in Gaia DR2 (Lindegren et al., 2018) to 0.18′′ in Gaia EDR3 (Gaia Collaboration et al., 2021) GCs have effective radii of 2-10 pc as given in Harris (1991). At the distance of Circinus, they appear as marginally extended sources to Gaia which has a resolution of 0.059′′ per pixel in the scanning direction. By combining the VVVX data with a pixel size of 0.34′′ and Gaia EDR3 data, we can take advantage of some of the Gaia astrometric features to resolve the GCs of Circinus galaxy. The Gaia EDR3 catalogue for a circular region of radius 1.6 deg. centred on RA = 213.29∘ and DEC = -65.33 ∘ (corresponding to a diameter of 108 kpc at the distance of Circinus) was downloaded. At low Galactic latitudes the contamination by foreground stars is very severe (Baravalle et al., 2018). Because Circinus is located just at b = -3.8∘, below the Galactic plane, and also veiled by the Galactic disk, most of the detected objects are therefore expected to be stars within the Galactic plane. The use of Gaia EDR3 is crucial in eliminating MW foreground stars using their proper motions and parallaxes. Any source with a significant proper motion or parallax can be excluded from our analysis as being a foreground object. The total proper motion of each object was obtained assuming that the combined proper motion has a distribution with two degrees of freedom. In this way, the proper motion likelihood of 1-cumulative distribution function (CDF) of the Rayleigh distribution was assigned to each object. In this study, we considered only objects whose proper motion probability values are consistent with zero at 2. Sources with probability values smaller than -1 or greater than 1 are considered as foreground stars, and were assigned proper motion likelihood = 0 and therefore were removed from our analysis.
A similar procedure was adopted for the the parallax. We assumed that the measurements follow a Gaussian distribution. If the parallax is significant at 2, the likelihood assigned is -0.4 Plx 0.4 Sources with 3 parallax measurements were assigned parallax likelihood = 0 and were not considered in the rest of our analysis. As the fourth step, the sources that satisfied our previous criteria were then subjected to some tests with the astrometric excess noise (AEN) and photbprp excess factor (BRexcess). These are two Gaia parameters that are found very useful in disentangling point and extended sources. Voggel et al. (2020) demonstrated how these two parameters might be used to select extended sources such as GCs out to a distance of 25 Mpc. The AEN is a statistical computation that quantifies the goodness of the fit of their five parameter astrometric model to the astrometry for each target. The AEN is measured in milli-arcseconds (mas) and is equal to 0 for a well fit star and larger for a poorer fit. It has been shown in Voggel et al. (2020) that objects that are extended sources generally have larger AEN values and this could be exploited in selecting marginally resolved objects such as GCs. On the other hand, the BRexcess gives the ratio of the sum of the flux of the Blue photometer (BP, 3300-6800 ) plus the Red photometer (RP, 6400-10500 ) with the flux in the broad- G passband. Its importance and usefulness come from the unique way these fluxes are derived. Both the BP and RP magnitudes are measured from the flux within a larger aperture of 3.42.1 arcsec2, while the G magnitude is obtained from profile fitting with an effective resolution of 0.4′′ (Evans et al., 2018). The variation means that extended sources have a higher BRexcess than point sources, since fitting an effective point-source profile to an extended source in the G passband misses some of the total light. Voggel et al. (2020) used the combination of these two parameters to identify over 600 new luminous cluster candidates in the halo of NGC5128 out to a projected radius of 150 kpc. In a follow-up study by Hughes et al. (2021), they used this method to estimate a total population of 1450160 GCs to a projected radius of 150 kpc in NGC5128 demonstrating its robustness. In using both the AEN and BRexcess they calculated the likelihood that a source is an extended source (GC) within a radial range of 10-60′ from the galaxy center to define a line of 3 above the mean foreground star AEN and BR value derived are given in equations 1 and 2.
| (1) |
| (2) |
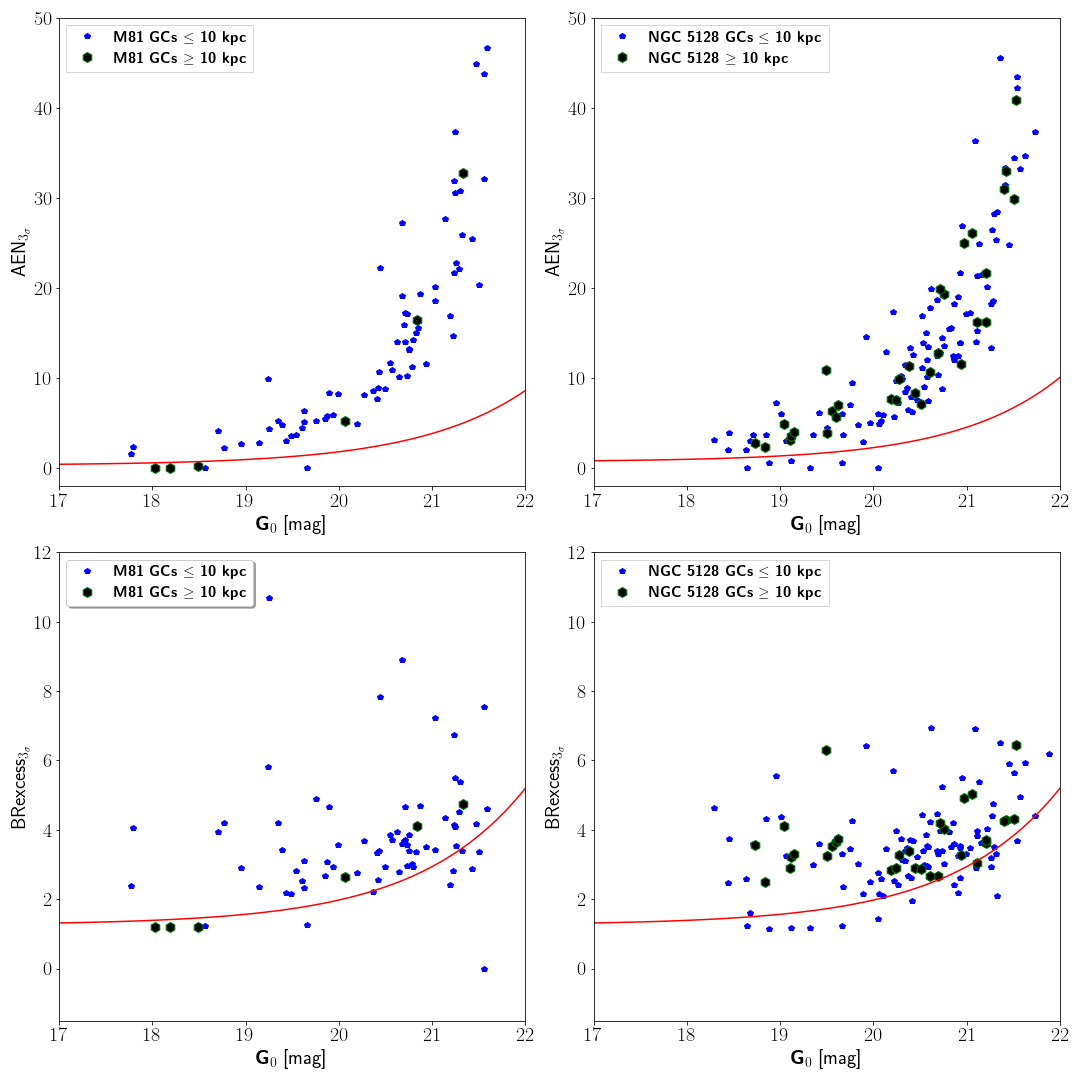
We tested the above procedure by using spectroscopically confirmed GCs in M81 of Nantais & Huchra (2010) and NGC5128 of Woodley et al. (2009) and Taylor et al. (2015). The M81 catalogue comprises 108 confirmed GCs and after cross matching with the Gaia EDR3 catalogue we found 77 counterparts. We adopted a distance modulus of 27.64 0.09 for M81 (Freedman & Madore, 1988) and corrected for relative extinctions in G passband with the relation AG=0.86AV given by Fernández-Alvar et al. (2021). For each source, the distance to the centre was computed and six sources had distances greater than 10 kpc from the galaxy centre. For NGC5128 we used two catalogue of spectroscopic confirmed catalogues comprising 37 GCs by Woodley et al. (2009) and 140 GCs by Taylor et al. (2015). These catalogues were then cross matched with Gaia EDR3 and 134 sources were found in common. For NGC5128, a distance modulus of 27.9 0.2 was adopted from Rejkuba (2004). Then we proceed to compute the distance of each GC from the centre and a total of 31 sources have radial distances greater than 10 kpc. Figure 4 shows the properties for NGC5128 and M81 using equations 1 and 2 of Hughes et al. (2021) as AEN vs G magnitudes and BRexcess vs G magnitudes (upper and lower panels, respectively). Blue points are sources with radial distances less than 10 kpc while black points are sources with distances greater than 10 kpc. The red curve represents the 3 probability that a source is more extended than a point source (in our case GCs). We find the brighter objects tends to have smaller AEN values, which could be attributed to the statistical uncertainties in Gaia observations. We might conclude that all the black points are consistent with being point sources for NGC5128. Three points are below the curve for M81 and they might be most probably misclassified foreground stars (see Hughes et al., 2021). It’s important to note that the above procedure is sensitive to objects with distances 10 kpc to the galaxy centre. In this analysis, we only considered the outermost parts of the galaxy where the internal extinction is less severe compared to the central part. We applied this procedure to all the sources in Circinus galaxy that satisfied our previous criteria. There are 260 sources that satisfied the AEN criterion and 176 sources the BRexcess cut. As additional step, the sources should also satisfy the spread model parameter criterion. , is another star-galaxy classifier that was added in the newest SExtractor versions. The value of this parameter is usually zero for stars, positive for extended sources and negative for detections smaller than the PSF, such as cosmic rays, etc . We adopted the same cut used by Baravalle et al. (2018) for searching extragalactic sources in VVV data ( ¿ 0.002). For Circinus galaxy, 141 of the sources satisfy all the above criteria.
Finally, we also examined the ellipticity and FWHM of the sources inspecting their morphology (roundness and size) as one critical criterion for selecting GCs (see Minniti et al., 1996; Alonso & Minniti, 1997; Rejkuba, 2001). Both features are convenient parameters to obtain a bonafide GCs sample. However, using only FWHM as discriminating criterion will lead to the rejection of both very concentrated and very loose clusters. Conversely using only roundness will underestimate the GCs sample. By applying these two stringent criteria together, we can trade off masquerading interlopers as well as some true genuine GCs. We adopted 0.4 consistent with Georgiev et al. (2009) and Woodley & Gómez (2010) and 2FWHM (pixels) 4 consistent with Alonso & Minniti (1997); Rejkuba (2001) obtaining a final sample of 78 potential Circinus GCs within the colour limits.
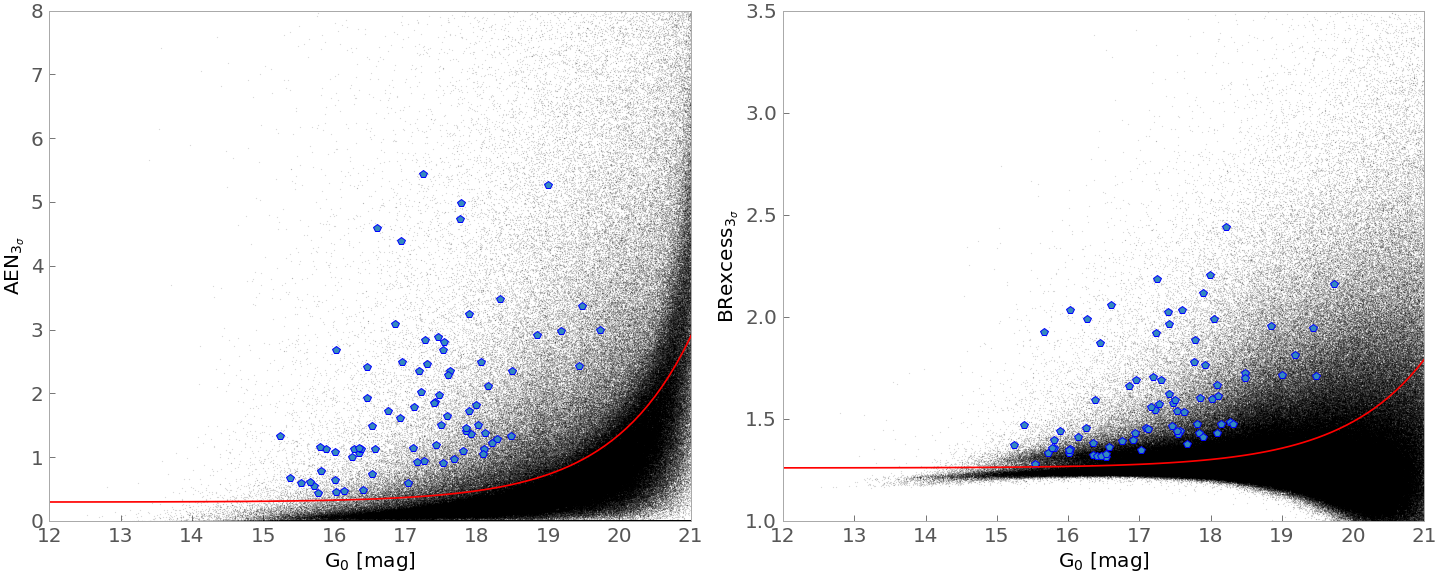
In Figure 5, we show the AEN as a function of G magnitudes with equation 1 (left panel) and BRexcess as a function of G magnitudes together with equation 2 (right panel) for the 902,667 points in Circinus galaxy. Over plotted in blue are our final GC candidates.
[b] Reference Central position ,(J2000) 14h13m10s.2, -65∘ 20′ 20′′ 1 , 311∘.3,-3∘.8 1,3 Type Sb 1 Distance D 4.00.8 Mpc 1,2 Optical extent at B25 6.′92.′7 1 H I extent** 32′ 15′ 2 Position angle PAHI 210∘ 5∘ 2 Inclination angle iHI 65∘ 2∘ 1 Systemic velocity sys 4392 km (H I) 1 Heliocentric velocity 38047 km s-1 (optical) 1 Velocity width υ20 29010 km s-1(H I) 1 Rotation velocity rot 1527 km s-1(H I) 1 Far-infrared luminosity LFIR 6 109 L⊙ 1 H I mass MHI 7.20.5109 M⊙ 2 9109 M⊙ 3 Total mass Mtot 1.20.21011 M⊙ 1 Global star formation rate SFR 3 - 8 M⊙ yr-1 3
4 Results
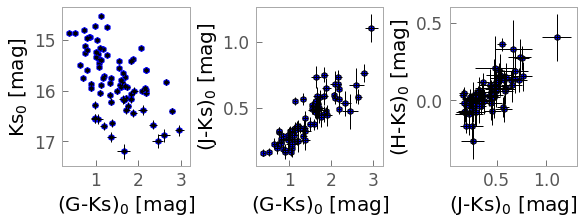
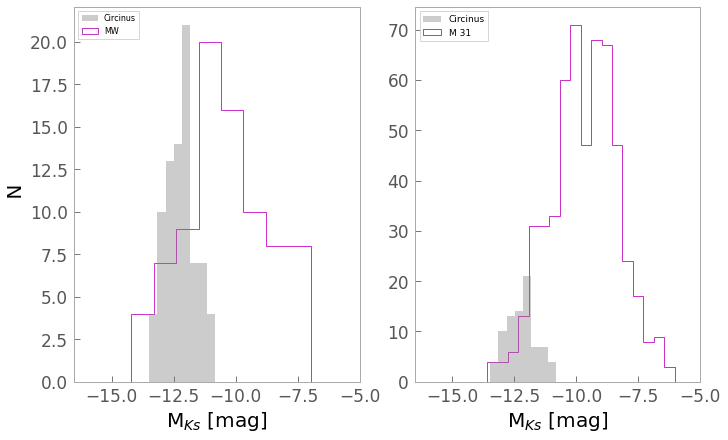
Our final sample is composed of 78 GC candidates (including contaminators) found in Circinus galaxy. We corrected for interstellar extinction in each of the objects. Figure 6 shows the (G-Ks)0 vs Ks colour-magnitude diagram and the (G-Ks)0 vs (J-Ks)0, (G-Ks)0 vs (H-Ks)0 colour-colour diagrams (left, middle and right panels). In Figure 7 we show the NIR luminosity function (MKs) of the 78 GCs compared with those of the MW (Nantais et al., 2006) and M31 (Wang et al., 2014). The MW sample contains 99 GCs while M31 have 568 confirmed GCs. The Figure shows that we are only detecting the brightest GCs in Circinus. Our sample did not reach the expected GCs turnover in infrared of Mks=-10 mag, (if we assume (V-Ks) mean colour of 2.5 mag), it is difficult to accurately estimate the total number of GCs (NGC) in Circinus and their specific frequency (SN) which defines NGC per unit galaxy luminosity normalised to a galaxy with an absolute V magnitude of -15 (Harris & van den Bergh, 1981). However, we can use the relation given in Harris et al. (2013) to estimate roughly NGC. The relation reads
| (3) |
where Re is the effective radius of the galaxy and e is the velocity dispersion. The above parameters for Circinus have been reported where Re=6.5kpc1kpc Jarrett et al. (2003) and e=7520km/s Hu (2008). The total number of GCs in Circinus is therefore estimated to be 120 40. With this result, we can calculate the SN of GCs using the equation provided in (Harris & van den Bergh, 1981) represented by
| (4) |
where M is the absolute visual magnitude. Given that the apparent magnitude is 12.1 mag (De Vaucouleurs et al., 1991) and AV = 3.96 mag, this implies that the absolute magnitude MV =-19.87 mag, we obtained SN of 1.30.24. This result is consistent with SN values for spiral galaxies usually 1 (van den Bergh & Harris, 1982).
We tested for bimodality in the colour distribution of our sample. Most GCs found in massive galaxies have shown to exhibit bimodal colour distributions (see Brodie & Strader, 2006; Brodie et al., 2014; Harris et al., 2017). Nonetheless, in some studies Gebhardt & Kissler-Patig (1999); Chies-Santos et al. (2012); Beasley et al. (2018), there have been reports of uni-modal colour distributions for GCs which were argued to have formed at the same time in isolated galaxies with no history of mergers. We used the Gaussian mixture model (GMM)222GMM code employs the likelihood-ratio test to compare the goodness of fit for a double Gaussian vs a single Gaussian. It estimates the probability of a best-fit double model providing the means,widths of the two components, their separation DD in terms of combined widths and their overall kurtosis. Importantly, GMM also provides the positions, relative widths and fraction of objects associated with each peak as well as their uncertainties based on bootstrap resampling.
| Colour | N | Blue | Red | fblue | fred | Kurt | DD | p(2) |
|---|---|---|---|---|---|---|---|---|
| (G-J)0 | 78 | 0.9640.125 | 1.9500.337 | 56.819.3 | 21.219.3 | 0.594 | 3.171.17 | 0.037 |
| (G-H)0 | 78 | 1.0950.172 | 1.7710.315 | 47.522.0 | 30.522.0 | 0.339 | 2.580.92 | 0.285 |
| (G-Ks)0 | 78 | 0.9850.127 | 1.6250.308 | 33.816.4 | 44.216.4 | 0.308 | 2.080.69 | 0.039 |
developed by Muratov & Gnedin (2010) specifically to test for bimodality in GC systems. The model shows that our sample is well described by a bimodal distribution with the blue peak at (G-Ks)0 = 0.9850.127 mag with a dispersion of 0.2110.091 mag and the red peak at (G-Ks)0 = 1.6250.0177 mag with a dispersion of 0.4820.114 mag. A similar bimodal distribution can also be observed in other colours combinations as shown in table 2 where we present the results of the GMM analysis for the colours (G-J)0, (G-H)0, and (G-)0. In column one, we present the colour, in column 2 the number of objects, in columns 3 to 4 the blue and red peaks, in columns 5 to 6, we provide the fraction of objects in each peak, and in columns 7 to 9, we show the Kurtosis, and the peak separations (as measured in units of the fitted s for the two Gaussian models) as well as the P( 2) values. Two of the three colours that have been inspected show consistency between the blue and red fractions in the colour distribution. The third colour has a bias favoring the red fraction. Nevertheless, the low P( 2) values from the GMM tests confirm that a bimodal Gaussian distribution is preferred over a unimodal distribution. Figure 8 shows this colour distribution of GC candidates with a bin size of 0.1 mag, giving another evidence of their nature. The red curve shows the fit.
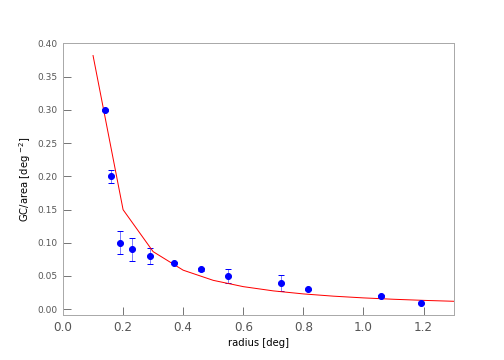
Also, the density distribution follows a power law which is frequently observed for GCs with r-1.4. The number of GCs is still uncertain for determining a proper radial profile. However, it is clear from Figure 9 that our cluster candidates follow a distribution which closely resembles many other extragalactic GC systems (see e.g Gómez & Richtler, 2004; Brodie & Strader, 2006). Even if the true profile and background level remains to be determined, a clear concentration in the central parts of Circinus can be seen, which favours a true GC nature of our sample.
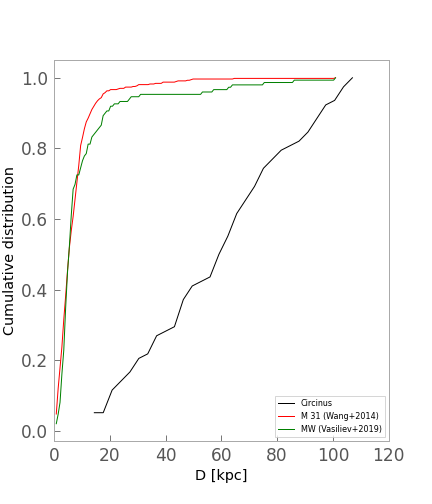
In Figure 10 we compare the projected radial distances of Circinus, M 31 and MW GCs. As can be observed, large concentrations of clusters are found for D 30 kpc in M 31 and MW. We used the 568 confirmed GCs in M31 (Wang et al., 2014) and 150 in the MW catalogue (Vasiliev, 2019) for this comparison of which 93.3 and 81.3 are within distances 30 kpc compared to 12.5 for Circinus. In light of these findings, a fundamental question arises regarding the level of contamination in our sample, as well as the similarity in GC distributions between MW, M31, and Circinus. As part of our effort to provide some insight into this question, we examined two empty fields at opposite ends of Circinus that were about 2.4 degrees away from Circinus. The fields are located at similar latitudes and their extinction patterns are relatively similar to those of Circinus with a mean AV 2 mag. As far as the area covered is concerned, it is the same by construction. We applied the exact same procedure we used for analysing Circinus. In each of the fields, we found 8 and 10 sources that met our adopted criteria. These amount to 10.3% and 12.8% contamination respectively. Therefore, we estimate that our sample is contaminated with 11.5 interlopers. Based on the projected radial distribution it appears that Circinus has a different distribution of GC candidates than MW and M31. However, the data available at present do not allow a conclusive assessment of the differences in GC radial distribution. Our sample must be cleaned up to eliminate interlopers, as well as searched for GCs in the bulge and disk to get a good idea of the overall distribution before such claim can be made. Follow-up spectroscopic observations of these candidates will help to weed out contaminators. The ratio of our 70 GC candidates (interlopers accounted for) with the estimated 12040 GC population expected in Circinus, suggest that about 58 of the total GC population is located in the halo. In Figure 11, we show the spatial distribution of the 78 selected GC candidates in Galactic coordinates. The regions with the same optical total interestellar extinction AV derived from the extinction maps of Schlafly & Finkbeiner (2011) are superimposed with different AV levels as shown with the grey-bar. The closest object to the galaxy centre is located at a projected radial distance of about 11 kpc. About 80 of the cluster candidates are located in regions with low AV interestellar extinctions (0.5 to 2.0 mag). However, more GC candidates might be missing at central regions with higher extinctions. Table LABEL:table2 shows the 78 GC candidates, listing the identification in column (1), the J2000 equatorial coordinates in columns (2) and (3), the J0, H0, and Ks 0 magnitudes with their respective errors in columns (4) to (9), the Gaia magnitude in column (10), the FWHM in column (11), the ellipticity and the AV, AJ, AH, AKs, AG extinctions in columns (12) to (17) and the galactocentric distances in column (18).
5 Conclusions
This is the first study of the old stellar association in Circinus galaxy which is the nearest known Seyfert II galaxy. We performed our search using VVVX photometry together with the Gaia EDR3 catalogue. Taking advantage of the sharp contrast and reduced reddening sensitivity in the NIR VVVX frames and the excellent resolution of the Gaia EDR3 astrometry features (AEN and BRexcess), we found a total of 78 GC candidates that satisfied all our stringent criteria. The GC colour distribution is well described by two normal functions with a blue peak at (G-Ks)0 = 0.9850.127 mag with a dispersion 0.2110.091 mag and a red peak at (G-Ks)0 = 1.6250.177 mag with a dispersion of 0.4820.114 mag. We estimated NGCs of 120 40 and derived an SN of 1.3 0.2 The density distribution follows a power law with r-1.4. The most distant GCs that we detected are located at a projected distance of about 107 kpc from the center of the galaxy, indicating that Circinus has an extended GC system. The true nature of these objects must be determined through follow-up spectroscopic observations.
Acknowledgements.
We gratefully acknowledge the use of data from the ESO Public Survey program IDs 179.B-2002 and 198.B-2004 taken with the VISTA telescope and data products from the Cambridge Astronomical Survey Unit. This work has made use of data from the European Space Agency (ESA) mission Gaia (https://www.cosmos.esa.int/gaia), processed by the Gaia Data Processing and Analysis Consortium (DPAC, https://www.cosmos.esa.int/web/gaia/dpac/consortium). Funding for the DPAC has been provided by national institutions, in particular, the institutions participating in the Gaia Multilateral Agreement. We also acknowledge the comments of the anonymous reviewer whose positive feedback helped to improve the quality of this paper D.M. gratefully acknowledges support by the ANID BASAL projects ACE210002 and FB210003. D.M. and M. G. also gratefully acknowledge support by Fondecyt Project No. 1220724. J.A.-G. acknowledges support from Fondecyt Regular 1201490 and from ANID – Millennium Science Initiative Program – ICN12_009 awarded to the Millennium Institute of Astrophysics MAS.—————————————–
References
- Alonso & Minniti (1997) Alonso, M. V. & Minniti, D. 1997, ApJS, 109, 397
- Baravalle et al. (2018) Baravalle, L. D., Alonso, M. V., Castellón, J. L. N., et al. 2018, AJ, 155, 46
- Beasley et al. (2018) Beasley, M. A., Trujillo, I., Leaman, R., & Montes, M. 2018, Nature, 555, 483
- Bertin & Arnouts (1996) Bertin, E. & Arnouts, S. 1996, A&A, 117, 393
- Brodie et al. (2014) Brodie, J. P., Romanowsky, A. J., Strader, J., et al. 2014, AJ, 796, 52
- Brodie & Strader (2006) Brodie, J. P. & Strader, J. 2006, ARA&A, 44, 193
- Catelan et al. (2011) Catelan, M., Minniti, D., Lucas, P., et al. 2011, in RR Lyrae Stars, Metal-Poor Stars, and the Galaxy
- Chies-Santos et al. (2012) Chies-Santos, A., Larsen, S., Cantiello, M., et al. 2012, A&A, 539, A54
- Davies et al. (1998) Davies, R. I., Forbes, D. A., Ryder, S., et al. 1998, MNRAS, 293, 189
- De Vaucouleurs et al. (1991) De Vaucouleurs, G., De Vaucouleurs, A., Corwin Jr, H., et al. 1991, Sky and Telescope, 82, 621
- Elmouttie et al. (1995) Elmouttie, E., Haynes, R., Jones, K., et al. 1995, MNRAS, 275, L53
- Emerson & Sutherland (2010) Emerson, J. & Sutherland, W. 2010, The Messenger, 139, 2
- Evans et al. (2018) Evans, D., Riello, M., De Angeli, F., et al. 2018, A&A, 616, A4
- Fernández-Alvar et al. (2021) Fernández-Alvar, E., Kordopatis, G., Hill, V., et al. 2021, MNRAS, 508, 1509
- For et al. (2012) For, B.-Q., Koribalski, B., & Jarrett, T. 2012, MNRAS, 425, 1934
- Freedman & Madore (1988) Freedman, W. L. & Madore, B. F. 1988, AJ, 332, L63
- Freeman et al. (1977) Freeman, K., Karlsson, B., Lynga, G., et al. 1977, A&A, 55, 445
- Gaia Collaboration et al. (2021) Gaia Collaboration, Brown, A. G. A., Vallenari, A., et al. 2021, A&A, 649, A1
- Galleti et al. (2004) Galleti, S., Federici, L., Bellazzini, M., Pecci, F. F., & Macrina, S. 2004, A&A, 416, 917
- Gebhardt & Kissler-Patig (1999) Gebhardt, K. & Kissler-Patig, M. 1999, AJ, 118, 1526
- Georgiev et al. (2009) Georgiev, I. Y., Puzia, T. H., Hilker, M., & Goudfrooij, P. 2009, MNRAS, 392, 879
- Ghosh et al. (1992) Ghosh, S., Bisht, R., Iyengar, K., et al. 1992, ApJ, 391, 111
- Gómez & Richtler (2004) Gómez, M. & Richtler, T. 2004, A&A, 415, 499
- Guo et al. (2019) Guo, X.-L., Xin, Y.-L., Liao, N.-H., & Fan, Y.-Z. 2019, ApJ, 885, 117
- Harnett (1987) Harnett, J. 1987, MNRAS, 227, 887
- Harnett et al. (1990) Harnett, J., Whiteoak, J., Reynolds, J., et al. 1990, MNRAS, 244, 130
- Harris (1991) Harris, W. E. 1991, ARA&A, 29, 543
- Harris et al. (2017) Harris, W. E., Ciccone, S. M., Eadie, G. M., et al. 2017, AJ, 835, 101
- Harris et al. (2013) Harris, W. E., Harris, G. L., & Alessi, M. 2013, AJ, 772, 82
- Harris & van den Bergh (1981) Harris, W. E. & van den Bergh, S. 1981, AJ, 86, 1627
- Hu (2008) Hu, J. 2008, MNRAS, 386, 2242
- Hughes et al. (2021) Hughes, A. K., Sand, D. J., Seth, A., et al. 2021, APJ, 914, 16
- Jarrett et al. (2003) Jarrett, T., Chester, T., Cutri, R., et al. 2003, AJ, 125, 525
- Jerjen & Koribalski (2008) Jerjen, H. & Koribalski, B. S. 2008, Galaxies in the Local Volume (Springer), p.41
- Jones et al. (1999) Jones, K., Koribalski, B., Elmouttie, M., & Haynes, R. 1999, MNRAS, 302, 649
- Koribalski et al. (2004) Koribalski, B. S., Staveley-Smith, L., Kilborn, V. A., et al. 2004, AJ, 128, 16
- Lindegren et al. (2018) Lindegren, L., Hernández, J., Bombrun, A., et al. 2018, A&A, 616, A2
- Marconi et al. (1994) Marconi, A., Moorwood, A., Origlia, L., et al. 1994, The Messenger, 78, 20
- Matt et al. (1996) Matt, G., Fiore, F., Perola, G., et al. 1996, MNRAS, 281, L69
- Meyer et al. (2004) Meyer, M. J., Zwaan, M. A., Webster, R. L., et al. 2004, MNRAS, 350, 1195
- Minniti (2018) Minniti, D. 2018, in The Vatican Observatory, Castel Gandolfo: 80th Anniversary Celebration (Springer), 63–71
- Minniti et al. (1996) Minniti, D., Alonso, M., Goudfrooij, P., et al. 1996, ApJ, 467, 221
- Muratov & Gnedin (2010) Muratov, A. L. & Gnedin, O. Y. 2010, ApJ, 718, 1266
- Nantais & Huchra (2010) Nantais, J. B. & Huchra, J. P. 2010, AJ, 139, 2620
- Nantais et al. (2006) Nantais, J. B., Huchra, J. P., Barmby, P., Olsen, K. A., & Jarrett, T. H. 2006, AJ, 131, 1416
- Obasi et al. (2021) Obasi, C., Gómez, M., Minniti, D., & Alonso-García, J. 2021, A&A, 654, A39
- Oliva et al. (1998) Oliva, E., Marconi, A., Cimatti, A., & di Serego Alighieri, S. 1998, A&A, 329, L21
- Oliva et al. (1994) Oliva, E., Salvati, M., Moorwood, A., & Marconi, A. 1994, A&A, 288, 457
- Rejkuba (2001) Rejkuba, M. 2001, A&A, 369, 812
- Rejkuba (2004) Rejkuba, M. 2004, A&A, 413, 903
- Schlafly & Finkbeiner (2011) Schlafly, E. F. & Finkbeiner, D. P. 2011, AJ, 737, 103
- Taylor et al. (2015) Taylor, M. A., Puzia, T. H., Gomez, M., & Woodley, K. A. 2015, AJ, 805, 65
- van den Bergh & Harris (1982) van den Bergh, S. & Harris, W. E. 1982, AJ, 87, 494
- Vasiliev (2019) Vasiliev, E. 2019, MNRAS, 2832V
- Voggel et al. (2020) Voggel, K. T., Seth, A. C., Sand, D. J., et al. 2020, ApJ, 899, 140
- Wang et al. (2014) Wang, S., Ma, J., Wu, Z., et al. 2014, ApJ, 148, 4
- Whiteoak & Bunton (1985) Whiteoak, J. B. & Bunton, J. D. 1985, PASA, 6, 171
- Woodley & Gómez (2010) Woodley, K. A. & Gómez, M. 2010, PASA, 27, 379
- Woodley et al. (2009) Woodley, K. A., Harris, W. E., Puzia, T. H., et al. 2009, AJ, 708, 1335
- Yamada et al. (1993) Yamada, T., Takata, T., Djamaluddin, T., et al. 1993, ApJS, 89, 57
- Yang et al. (2009) Yang, Y., Wilson, A. S., Matt, G., et al. 2009, ApJ, 691, 131
Appendix A Colour cuts & Table Listing GC candidates
| ID |
|
|
|
|
|
|
|
|
|
|
|
|
|
|
|
|
|||||||||||||||||||||||||||||||||
|---|---|---|---|---|---|---|---|---|---|---|---|---|---|---|---|---|---|---|---|---|---|---|---|---|---|---|---|---|---|---|---|---|---|---|---|---|---|---|---|---|---|---|---|---|---|---|---|---|---|
| 0 | 209.646 | -65.2543 | 16.55 | 0.02 | 16.29 | 0.04 | 16.28 | 0.08 | 17.28 | 3.81 | 0.26 | 2.14 | 0.6 | 0.39 | 0.25 | 1.84 | 106 | ||||||||||||||||||||||||||||||||
| 1 | 209.9556 | -65.7977 | 16.41 | 0.02 | 16.04 | 0.03 | 15.9 | 0.06 | 17.46 | 2.49 | 0.11 | 1.87 | 0.52 | 0.34 | 0.22 | 1.6 | 101 | ||||||||||||||||||||||||||||||||
| 2 | 210.0543 | -65.896 | 15.65 | 0.02 | 15.28 | 0.02 | 15.31 | 0.04 | 16.57 | 3.11 | 0.1 | 1.82 | 0.51 | 0.34 | 0.22 | 1.57 | 101 | ||||||||||||||||||||||||||||||||
| 3 | 210.702 | -65.2801 | 17.23 | 0.03 | 16.91 | 0.06 | 16.91 | 0.1 | 18.28 | 2.64 | 0.21 | 2.34 | 0.66 | 0.43 | 0.28 | 2.02 | 76 | ||||||||||||||||||||||||||||||||
| 4 | 210.8203 | -65.5881 | 17.16 | 0.02 | 16.56 | 0.04 | 16.4 | 0.07 | 19.18 | 2.97 | 0.18 | 1.77 | 0.49 | 0.32 | 0.21 | 1.52 | 74 | ||||||||||||||||||||||||||||||||
| 5 | 211.1837 | -65.2004 | 15.03 | 0.01 | 14.78 | 0.01 | 14.74 | 0.02 | 15.72 | 3.16 | 0.09 | 2.17 | 0.61 | 0.4 | 0.26 | 1.86 | 62 | ||||||||||||||||||||||||||||||||
| 6 | 211.1937 | -65.1237 | 16.37 | 0.02 | 16.01 | 0.03 | 16.09 | 0.06 | 17.42 | 3.66 | 0.24 | 2.16 | 0.6 | 0.4 | 0.25 | 1.85 | 63 | ||||||||||||||||||||||||||||||||
| 7 | 211.5559 | -65.7712 | 15.76 | 0.01 | 15.24 | 0.01 | 15.17 | 0.02 | 17.22 | 2.67 | 0.05 | 1.47 | 0.41 | 0.27 | 0.17 | 1.27 | 59 | ||||||||||||||||||||||||||||||||
| 8 | 211.9328 | -65.6819 | 15.72 | 0.01 | 15.47 | 0.01 | 15.46 | 0.02 | 16.53 | 2.61 | 0.08 | 1.58 | 0.44 | 0.29 | 0.19 | 1.36 | 46 | ||||||||||||||||||||||||||||||||
| 9 | 212.7034 | -65.4799 | 16.05 | 0.01 | 15.68 | 0.02 | 15.56 | 0.04 | 17.1 | 3.5 | 0.3 | 1.77 | 0.5 | 0.33 | 0.21 | 1.52 | 20 | ||||||||||||||||||||||||||||||||
| 10 | 209.6601 | -65.1488 | 15.73 | 0.01 | 15.52 | 0.02 | 15.5 | 0.04 | 16.14 | 3.01 | 0.18 | 2.52 | 0.71 | 0.46 | 0.3 | 2.17 | 107 | ||||||||||||||||||||||||||||||||
| 11 | 209.9389 | -65.7813 | 16.03 | 0.02 | 15.79 | 0.02 | 15.86 | 0.05 | 16.75 | 3.74 | 0.09 | 1.89 | 0.53 | 0.35 | 0.22 | 1.62 | 102 | ||||||||||||||||||||||||||||||||
| 12 | 211.0332 | -65.9285 | 16.26 | 0.01 | 15.87 | 0.02 | 15.73 | 0.05 | 17.42 | 3.68 | 0.16 | 1.34 | 0.38 | 0.25 | 0.16 | 1.15 | 77 | ||||||||||||||||||||||||||||||||
| 13 | 210.2055 | -65.0511 | 15.44 | 0.01 | 15.16 | 0.02 | 15.12 | 0.04 | 15.89 | 2.98 | 0.04 | 2.98 | 0.83 | 0.55 | 0.35 | 2.56 | 93 | ||||||||||||||||||||||||||||||||
| 14 | 211.058 | -64.9099 | 16.42 | 0.02 | 15.82 | 0.03 | 15.86 | 0.04 | 17.19 | 3.87 | 0.15 | 2.13 | 0.6 | 0.39 | 0.25 | 1.83 | 72 | ||||||||||||||||||||||||||||||||
| 15 | 210.0427 | -65.1478 | 15.85 | 0.01 | 15.4 | 0.02 | 15.37 | 0.03 | 17.24 | 2.8 | 0.14 | 2.48 | 0.69 | 0.46 | 0.29 | 2.13 | 96 | ||||||||||||||||||||||||||||||||
| 16 | 209.8827 | -65.3385 | 15.14 | 0.01 | 14.92 | 0.01 | 14.95 | 0.03 | 15.81 | 2.81 | 0.1 | 1.89 | 0.53 | 0.35 | 0.22 | 1.62 | 99 | ||||||||||||||||||||||||||||||||
| 17 | 210.1386 | -65.6147 | 16.46 | 0.03 | 16.0 | 0.04 | 16.02 | 0.08 | 17.92 | 3.15 | 0.03 | 1.77 | 0.5 | 0.33 | 0.21 | 1.52 | 93 | ||||||||||||||||||||||||||||||||
| 18 | 210.6621 | -64.9864 | 15.59 | 0.01 | 15.23 | 0.01 | 15.27 | 0.03 | 16.03 | 2.87 | 0.12 | 2.79 | 0.78 | 0.51 | 0.33 | 2.4 | 81 | ||||||||||||||||||||||||||||||||
| 19 | 210.9808 | -65.0815 | 15.6 | 0.01 | 15.29 | 0.02 | 15.28 | 0.03 | 16.34 | 3.21 | 0.13 | 2.38 | 0.67 | 0.44 | 0.28 | 2.04 | 70 | ||||||||||||||||||||||||||||||||
| 20 | 210.8899 | -65.2929 | 15.44 | 0.02 | 15.14 | 0.02 | 15.19 | 0.03 | 16.38 | 3.12 | 0.02 | 2.15 | 0.6 | 0.4 | 0.25 | 1.85 | 70 | ||||||||||||||||||||||||||||||||
| 21 | 211.0256 | -65.3646 | 15.85 | 0.02 | 15.58 | 0.02 | 15.53 | 0.04 | 16.6 | 4.0 | 0.32 | 2.04 | 0.57 | 0.38 | 0.24 | 1.76 | 66 | ||||||||||||||||||||||||||||||||
| 22 | 211.2093 | -65.5939 | 16.56 | 0.02 | 16.25 | 0.03 | 16.22 | 0.06 | 17.58 | 3.27 | 0.08 | 1.63 | 0.46 | 0.3 | 0.19 | 1.4 | 63 | ||||||||||||||||||||||||||||||||
| 23 | 211.3385 | -65.5525 | 15.5 | 0.02 | 15.17 | 0.02 | 15.16 | 0.03 | 16.27 | 3.99 | 0.21 | 1.66 | 0.46 | 0.31 | 0.2 | 1.43 | 59 | ||||||||||||||||||||||||||||||||
| 24 | 211.9026 | -65.095 | 15.58 | 0.02 | 15.22 | 0.02 | 15.38 | 0.03 | 16.45 | 3.6 | 0.23 | 1.96 | 0.55 | 0.36 | 0.23 | 1.68 | 44 | ||||||||||||||||||||||||||||||||
| 25 | 212.1071 | -65.4834 | 16.24 | 0.02 | 15.89 | 0.02 | 15.89 | 0.05 | 17.03 | 3.18 | 0.21 | 1.6 | 0.45 | 0.29 | 0.19 | 1.37 | 36 | ||||||||||||||||||||||||||||||||
| 26 | 212.6931 | -65.103 | 16.18 | 0.01 | 15.79 | 0.02 | 15.76 | 0.05 | 17.12 | 3.26 | 0.29 | 2.18 | 0.61 | 0.4 | 0.26 | 1.87 | 24 | ||||||||||||||||||||||||||||||||
| 27 | 212.6585 | -65.355 | 15.23 | 0.01 | 14.99 | 0.01 | 14.95 | 0.02 | 15.8 | 3.4 | 0.18 | 1.99 | 0.56 | 0.37 | 0.23 | 1.71 | 18 | ||||||||||||||||||||||||||||||||
| 28 | 212.7143 | -65.4207 | 16.24 | 0.01 | 15.73 | 0.02 | 15.59 | 0.04 | 17.77 | 2.74 | 0.21 | 1.84 | 0.52 | 0.34 | 0.22 | 1.58 | 18 | ||||||||||||||||||||||||||||||||
| 29 | 212.6281 | -65.2966 | 16.58 | 0.02 | 16.14 | 0.02 | 16.0 | 0.05 | 18.1 | 3.4 | 0.32 | 2.05 | 0.57 | 0.38 | 0.24 | 1.76 | 20 | ||||||||||||||||||||||||||||||||
| 30 | 212.8148 | -65.5737 | 16.59 | 0.02 | 16.2 | 0.03 | 16.15 | 0.06 | 17.84 | 2.98 | 0.12 | 1.63 | 0.46 | 0.3 | 0.19 | 1.4 | 21 | ||||||||||||||||||||||||||||||||
| 31 | 211.0072 | -65.0896 | 16.94 | 0.02 | 16.53 | 0.05 | 16.69 | 0.08 | 17.89 | 3.73 | 0.12 | 2.38 | 0.67 | 0.44 | 0.28 | 2.04 | 69 | ||||||||||||||||||||||||||||||||
| 32 | 210.9581 | -65.4085 | 16.61 | 0.02 | 15.99 | 0.03 | 16.04 | 0.06 | 18.22 | 3.56 | 0.14 | 1.99 | 0.56 | 0.37 | 0.23 | 1.71 | 68 | ||||||||||||||||||||||||||||||||
| 33 | 211.7361 | -65.0835 | 16.09 | 0.01 | 15.66 | 0.02 | 15.61 | 0.04 | 17.78 | 3.1 | 0.03 | 1.95 | 0.55 | 0.36 | 0.23 | 1.67 | 49 | ||||||||||||||||||||||||||||||||
| 34 | 211.8109 | -65.0526 | 16.31 | 0.02 | 15.93 | 0.03 | 15.94 | 0.04 | 17.53 | 3.46 | 0.17 | 2.0 | 0.56 | 0.37 | 0.24 | 1.72 | 48 | ||||||||||||||||||||||||||||||||
| 35 | 211.7861 | -65.3681 | 17.46 | 0.03 | 17.06 | 0.05 | 16.99 | 0.13 | 19.43 | 2.99 | 0.26 | 1.56 | 0.44 | 0.29 | 0.18 | 1.34 | 44 | ||||||||||||||||||||||||||||||||
| 36 | 212.0291 | -65.3367 | 16.52 | 0.01 | 16.01 | 0.02 | 15.94 | 0.05 | 17.68 | 3.78 | 0.34 | 1.63 | 0.46 | 0.3 | 0.19 | 1.4 | 37 | ||||||||||||||||||||||||||||||||
| 37 | 211.9312 | -65.6224 | 15.1 | 0.01 | 14.79 | 0.01 | 14.75 | 0.02 | 16.02 | 2.99 | 0.18 | 1.64 | 0.46 | 0.3 | 0.19 | 1.41 | 44 | ||||||||||||||||||||||||||||||||
| 38 | 212.553 | -64.957 | 15.63 | 0.01 | 15.37 | 0.02 | 15.34 | 0.03 | 16.35 | 3.68 | 0.09 | 2.69 | 0.75 | 0.49 | 0.32 | 2.31 | 34 | ||||||||||||||||||||||||||||||||
| 39 | 213.251 | -65.7362 | 16.71 | 0.02 | 16.11 | 0.03 | 15.98 | 0.05 | 18.15 | 2.95 | 0.17 | 1.59 | 0.44 | 0.29 | 0.19 | 1.36 | 28 | ||||||||||||||||||||||||||||||||
| 40 | 213.3396 | -65.7953 | 17.55 | 0.04 | 17.21 | 0.06 | 16.88 | 0.13 | 19.48 | 3.0 | 0.2 | 1.61 | 0.45 | 0.3 | 0.19 | 1.39 | 32 | ||||||||||||||||||||||||||||||||
| 41 | 212.9437 | -65.2087 | 17.07 | 0.03 | 16.58 | 0.03 | 16.39 | 0.1 | 18.49 | 2.88 | 0.18 | 2.01 | 0.56 | 0.37 | 0.24 | 1.73 | 14 | ||||||||||||||||||||||||||||||||
| 42 | 213.0214 | -65.2235 | 15.46 | 0.01 | 15.21 | 0.01 | 15.21 | 0.03 | 16.01 | 3.5 | 0.37 | 2.05 | 0.57 | 0.38 | 0.24 | 1.76 | 11 | ||||||||||||||||||||||||||||||||
| 43 | 213.1648 | -65.1713 | 16.32 | 0.01 | 15.87 | 0.02 | 15.84 | 0.06 | 17.47 | 2.36 | 0.23 | 1.88 | 0.53 | 0.35 | 0.22 | 1.62 | 12 | ||||||||||||||||||||||||||||||||
| 44 | 213.4063 | -65.5202 | 16.73 | 0.02 | 16.4 | 0.02 | 16.3 | 0.07 | 18.05 | 3.6 | 0.08 | 1.63 | 0.46 | 0.3 | 0.19 | 1.4 | 13 | ||||||||||||||||||||||||||||||||
| 45 | 213.6302 | -65.7496 | 16.42 | 0.01 | 15.9 | 0.01 | 15.84 | 0.06 | 18.48 | 3.6 | 0.1 | 1.51 | 0.42 | 0.28 | 0.18 | 1.3 | 30 | ||||||||||||||||||||||||||||||||
| 46 | 213.6953 | -65.6493 | 17.2 | 0.03 | 16.83 | 0.05 | 16.67 | 0.1 | 19.0 | 3.01 | 0.25 | 1.5 | 0.42 | 0.28 | 0.18 | 1.29 | 25 | ||||||||||||||||||||||||||||||||
| 47 | 213.9453 | -64.84 | 16.76 | 0.02 | 16.24 | 0.02 | 16.17 | 0.07 | 17.99 | 3.1 | 0.13 | 2.85 | 0.8 | 0.52 | 0.34 | 2.45 | 40 | ||||||||||||||||||||||||||||||||
| 48 | 214.2796 | -65.4149 | 16.88 | 0.02 | 16.46 | 0.03 | 16.38 | 0.08 | 18.09 | 2.87 | 0.24 | 1.88 | 0.53 | 0.35 | 0.22 | 1.61 | 29 | ||||||||||||||||||||||||||||||||
| 49 | 214.5096 | -64.6824 | 16.9 | 0.02 | 16.38 | 0.02 | 16.64 | 0.08 | 18.02 | 3.85 | 0.13 | 2.56 | 0.72 | 0.47 | 0.3 | 2.2 | 58 | ||||||||||||||||||||||||||||||||
| 50 | 214.7067 | -64.7219 | 16.38 | 0.02 | 16.0 | 0.02 | 16.01 | 0.06 | 17.5 | 2.47 | 0.02 | 2.54 | 0.71 | 0.47 | 0.3 | 2.18 | 60 | ||||||||||||||||||||||||||||||||
| 51 | 214.6406 | -64.5995 | 16.14 | 0.01 | 15.88 | 0.02 | 15.95 | 0.05 | 16.86 | 3.96 | 0.36 | 2.49 | 0.7 | 0.46 | 0.29 | 2.14 | 65 | ||||||||||||||||||||||||||||||||
| 52 | 214.7177 | -64.8725 | 16.78 | 0.03 | 16.47 | 0.03 | 16.56 | 0.1 | 17.63 | 2.92 | 0.22 | 2.68 | 0.75 | 0.49 | 0.32 | 2.3 | 53 | ||||||||||||||||||||||||||||||||
| 53 | 214.9468 | -64.8944 | 16.39 | 0.03 | 16.0 | 0.03 | 15.91 | 0.06 | 17.6 | 2.42 | 0.16 | 2.78 | 0.78 | 0.51 | 0.33 | 2.39 | 58 | ||||||||||||||||||||||||||||||||
| 54 | 215.0736 | -65.0166 | 15.21 | 0.01 | 15.0 | 0.01 | 14.98 | 0.03 | 15.78 | 2.51 | 0.28 | 2.69 | 0.75 | 0.49 | 0.32 | 2.31 | 57 | ||||||||||||||||||||||||||||||||
| 55 | 214.9383 | -65.2082 | 15.02 | 0.01 | 14.8 | 0.01 | 14.8 | 0.02 | 15.54 | 2.31 | 0.05 | 2.13 | 0.6 | 0.39 | 0.25 | 1.83 | 49 | ||||||||||||||||||||||||||||||||
| 56 | 215.42 | -65.4863 | 16.08 | 0.01 | 15.83 | 0.02 | 15.72 | 0.04 | 16.92 | 3.25 | 0.24 | 1.68 | 0.47 | 0.31 | 0.2 | 1.44 | 63 | ||||||||||||||||||||||||||||||||
| 57 | 215.261 | -64.5335 | 17.09 | 0.03 | 16.53 | 0.03 | 16.44 | 0.08 | 18.32 | 3.02 | 0.2 | 2.69 | 0.75 | 0.5 | 0.32 | 2.32 | 81 | ||||||||||||||||||||||||||||||||
| 58 | 213.3722 | -65.621 | 15.56 | 0.01 | 15.31 | 0.02 | 15.24 | 0.03 | 16.25 | 3.63 | 0.21 | 1.58 | 0.44 | 0.29 | 0.19 | 1.36 | 20 | ||||||||||||||||||||||||||||||||
| 59 | 215.677 | -64.7121 | 15.17 | 0.02 | 14.98 | 0.03 | 15.0 | 0.03 | 16.03 | 2.67 | 0.08 | 2.75 | 0.77 | 0.51 | 0.32 | 2.37 | 83 | ||||||||||||||||||||||||||||||||
| 60 | 214.187 | -64.497 | 15.95 | 0.01 | 15.68 | 0.02 | 15.76 | 0.05 | 16.46 | 2.5 | 0.17 | 2.96 | 0.83 | 0.54 | 0.35 | 2.55 | 64 | ||||||||||||||||||||||||||||||||
| 61 | 214.4463 | -64.888 | 16.27 | 0.01 | 15.82 | 0.02 | 15.8 | 0.04 | 17.4 | 3.52 | 0.36 | 2.57 | 0.72 | 0.47 | 0.3 | 2.21 | 46 | ||||||||||||||||||||||||||||||||
| 62 | 214.6598 | -65.1219 | 16.12 | 0.01 | 15.8 | 0.02 | 15.76 | 0.04 | 16.93 | 2.38 | 0.09 | 2.3 | 0.64 | 0.42 | 0.27 | 1.98 | 43 | ||||||||||||||||||||||||||||||||
| 63 | 214.676 | -65.1239 | 16.17 | 0.02 | 15.69 | 0.02 | 15.42 | 0.06 | 17.25 | 3.68 | 0.39 | 2.3 | 0.64 | 0.42 | 0.27 | 1.98 | 43 | ||||||||||||||||||||||||||||||||
| 64 | 214.9766 | -64.3485 | 15.03 | 0.02 | 14.91 | 0.02 | 14.86 | 0.03 | 15.38 | 2.77 | 0.23 | 2.85 | 0.8 | 0.52 | 0.34 | 2.45 | 85 | ||||||||||||||||||||||||||||||||
| 65 | 215.9346 | -64.6718 | 16.63 | 0.02 | 16.09 | 0.02 | 15.95 | 0.04 | 18.11 | 3.96 | 0.3 | 2.41 | 0.67 | 0.44 | 0.28 | 2.07 | 91 | ||||||||||||||||||||||||||||||||
| 66 | 215.9726 | -64.5859 | 15.02 | 0.01 | 14.9 | 0.01 | 14.86 | 0.02 | 15.24 | 2.93 | 0.22 | 2.36 | 0.66 | 0.43 | 0.28 | 2.03 | 95 | ||||||||||||||||||||||||||||||||
| 67 | 216.1489 | -64.9173 | 17.68 | 0.05 | 17.4 | 0.07 | 17.19 | 0.15 | 18.85 | 3.44 | 0.05 | 1.9 | 0.53 | 0.35 | 0.22 | 1.63 | 89 | ||||||||||||||||||||||||||||||||
| 68 | 213.6556 | -65.0388 | 16.91 | 0.02 | 16.46 | 0.03 | 16.17 | 0.08 | 17.81 | 3.02 | 0.2 | 2.33 | 0.65 | 0.43 | 0.27 | 2.0 | 24 | ||||||||||||||||||||||||||||||||
| 69 | 214.9895 | -65.5057 | 16.78 | 0.02 | 16.34 | 0.02 | 16.19 | 0.06 | 17.85 | 2.91 | 0.17 | 1.76 | 0.49 | 0.32 | 0.21 | 1.51 | 51 | ||||||||||||||||||||||||||||||||
| 70 | 214.9922 | -64.8638 | 16.82 | 0.02 | 16.54 | 0.03 | 16.56 | 0.09 | 17.55 | 2.32 | 0.24 | 2.73 | 0.77 | 0.5 | 0.32 | 2.35 | 60 | ||||||||||||||||||||||||||||||||
| 71 | 215.2915 | -65.1353 | 16.8 | 0.02 | 16.48 | 0.02 | 16.55 | 0.08 | 17.52 | 3.71 | 0.25 | 2.14 | 0.6 | 0.39 | 0.25 | 1.84 | 60 | ||||||||||||||||||||||||||||||||
| 72 | 215.554 | -65.0999 | 15.74 | 0.01 | 15.44 | 0.02 | 15.4 | 0.03 | 16.53 | 2.33 | 0.03 | 2.1 | 0.59 | 0.39 | 0.25 | 1.8 | 68 | ||||||||||||||||||||||||||||||||
| 73 | 215.7254 | -64.4617 | 16.35 | 0.02 | 15.98 | 0.02 | 16.05 | 0.06 | 17.16 | 2.5 | 0.18 | 2.58 | 0.72 | 0.48 | 0.3 | 2.22 | 95 | ||||||||||||||||||||||||||||||||
| 74 | 216.3452 | -65.0076 | 16.21 | 0.01 | 15.82 | 0.01 | 15.66 | 0.04 | 17.3 | 3.22 | 0.3 | 1.7 | 0.48 | 0.31 | 0.2 | 1.46 | 92 | ||||||||||||||||||||||||||||||||
| 75 | 215.7889 | -65.4676 | 17.89 | 0.03 | 17.19 | 0.03 | 16.78 | 0.11 | 19.73 | 2.66 | 0.07 | 1.42 | 0.4 | 0.26 | 0.17 | 1.22 | 73 | ||||||||||||||||||||||||||||||||
| 76 | 215.8472 | -65.4723 | 15.94 | 0.01 | 15.61 | 0.01 | 15.41 | 0.03 | 16.95 | 3.58 | 0.34 | 1.39 | 0.39 | 0.26 | 0.16 | 1.19 | 75 | ||||||||||||||||||||||||||||||||
| 77 | 214.4796 | -65.3112 | 15.08 | 0.04 | 14.89 | 0.05 | 14.53 | 0.03 | 15.66 | 2.77 | 0.04 | 2.01 | 0.56 | 0.37 | 0.24 | 1.73 | 35 |