A Glimpse of the Stellar Populations and Elemental Abundances of Gravitationally Lensed, Quiescent Galaxies at with Keck Deep Spectroscopy
Abstract
Gravitational lenses can magnify distant galaxies, allowing us to discover and characterize the stellar populations of intrinsically faint, quiescent galaxies that are otherwise extremely difficult to directly observe at high redshift from ground-based telescopes. Here, we present the spectral analysis of two lensed, quiescent galaxies at discovered by the ASTRO 3D Galaxy Evolution with Lenses survey: AGEL1323 (, , ) and AGEL0014 (, , ). We measured the age, [Fe/H], and [Mg/Fe] of the two lensed galaxies using deep, rest-frame-optical spectra (S/N Å-1) obtained on the Keck I telescope. The ages of AGEL1323 and AGEL0014 are Gyr and Gyr, respectively, indicating that most of the stars in the galaxies were formed less than 2 Gyr after the Big Bang. Compared to nearby quiescent galaxies of similar masses, the lensed galaxies have lower [Fe/H] and [Mg/H]. Surprisingly, the two galaxies have comparable [Mg/Fe] to similar-mass galaxies at lower redshifts, despite their old ages. Using a simple analytic chemical evolution model connecting the instantaneously recycled element Mg with the mass-loading factors of outflows averaged over the entire star formation history, we found that the lensed galaxies may have experienced enhanced outflows during their star formation compared to lower-redshift galaxies, which may explain why they quenched early.
1 Introduction
How galaxies form and evolve to the state we see today has been a long-standing question in modern astronomy. One way to unveil the evolutionary history of a galaxy is to constrain its chemical composition because the overall metal abundance of a galaxy reflects the interplay among the gravitational potential (e.g., Dekel & Silk, 1986), star formation efficiency (e.g., Calura et al., 2009; Magrini et al., 2012) and galactic inflows/outflows (e.g., Finlator & Davé, 2008). The well-known mass–metallicity relation (MZR), a tight correlation between galaxy stellar mass and metallicity, has been widely used to investigate the metal retention of galaxies at different masses and redshifts (e.g., Tremonti et al., 2004; Gallazzi et al., 2005; Erb et al., 2006; Finlator & Davé, 2008; Kirby et al., 2013; Lu et al., 2015; Ma et al., 2016; Kacprzak et al., 2016; Leethochawalit et al., 2019; Zhuang et al., 2021).
While the majority of previous studies have used metallicity (i.e., gas-phase oxygen abundance or stellar-phase iron abundance) to characterize the chemical abundances of galaxies that cannot be resolved into stars, spectroscopic studies have turned to detailed abundances of galaxies using modern techniques, such as full-spectrum fitting of the stellar continuum to determine stellar abundances (e.g., Conroy et al., 2018). Measuring the abundances of individual elements (including O, Mg, Si and Ca) in stellar populations is a more effective probe of galactic chemical evolution than measuring iron alone. While iron is primarily produced in Type Ia supernovae of low-mass stars with a delayed explosion timescale, -elements are synthesized by core-collapse supernovae of massive stars. Because of the difference in their recycling time, bulk enhancement—[/Fe]—has been used to measure the duration of star formation historically (e.g., Thomas et al., 2005; Walcher et al., 2015; Kriek et al., 2016), if assuming a closed box where outflows and/or inflows are absent. In addition, elements can be approximated to be instantaneously recycled given the short lifetime of massive stars, so they can be used in some simple chemical evolution models. For instance, Leethochawalit et al. (2019) used the relation between stellar masses and [Mg/H] for quiescent galaxies derived from chemical evolution models to constrain the mass-loading factors of galactic outflows, when galaxies are assumed to be leaky boxes in this case.
Whereas the stellar abundances of quiescent galaxies have been extensively studied out to (Choi et al., 2014; Gallazzi et al., 2014; Leethochawalit et al., 2018, 2019; Beverage et al., 2021), we still have limited knowledge about the chemical composition of stellar populations at , especially -enhancements. A more nuanced understanding of the chemical abundances of high- galaxies is crucial to develop a full picture of the chemical evolution and enrichment of galaxies through cosmic time. Unlike measuring the gas-phase abundances for high- star-forming galaxies, which relies on strong emission lines, constraining the stellar abundances for high- quiescent galaxies requires deep spectroscopy to capture the faint stellar absorption lines. Consequently, the few available measurements at are either based on a stacked spectrum of quiescent galaxies at similar redshifts and masses (e.g., Onodera et al., 2015; Carnall et al., 2022) or ultra-deep spectroscopy, which typically requires tens of hours on large ground-based 8-10 m telescopes for a single galaxy (e.g., Toft et al., 2012; Lonoce et al., 2015; Kriek et al., 2016, 2019). Several studies have also attempted to determine the stellar metallicity of high- quiescent galaxies using low-resolution grism spectra obtained with the Hubble Space Telescope (HST) (e.g., Morishita et al., 2018; Estrada-Carpenter et al., 2019), but these studies primarily used the continuum shape. Consequently, they cannot characterize the detailed shapes of stellar absorption lines, leading to high degeneracy between stellar metallicity and other galaxy properties, such as age.
Gravitational lensing is a promising way to revolutionize our understanding of faint, high- quiescent galaxies because it magnifies both the flux and angular resolution of distant galaxies. The magnified flux of lensed galaxies enabled us to obtain comparable or even higher signal-to-noise (S/N) spectra with shorter integration times, allowing us to investigate the stellar population from the faint stellar continua more accurately (e.g., Newman et al., 2018; Jafariyazani et al., 2020; Man et al., 2021). The magnified, lensed galaxies are more extended, providing us an opportunity to resolve the galaxies that are much more compact in the source plane in exquisite detail. With the help of gravitational lensing, early studies were able to reveal unprecedented details of high- galaxies, such as the metallicity gradient (e.g., Leethochawalit et al., 2016; Jafariyazani et al., 2020) and morphology (e.g., Newman et al., 2018; Man et al., 2021).
In this work, we present the spectral analysis of two gravitationally lensed, quiescent galaxies at discovered by the ASTRO 3D Galaxy Evolution with Lenses (AGEL) survey (Tran et al., 2022) in order to characterize their stellar populations, especially the stellar elemental abundances. In Section 2, we describe our sample and data used for analysis. We explain how we determine the stellar mass and stellar population properties in Section 3. We present our results (the measured stellar population age, [Fe/H] and [Mg/Fe]) in Section 4 and discuss their physical implications in Section 5. Finally, we summarize our findings in Section 6. Throughout this work we assume a flat CDM cosmology with , and km s-1 Mpc-1.
2 Galaxy Sample and Data
2.1 The Lensed Galaxies
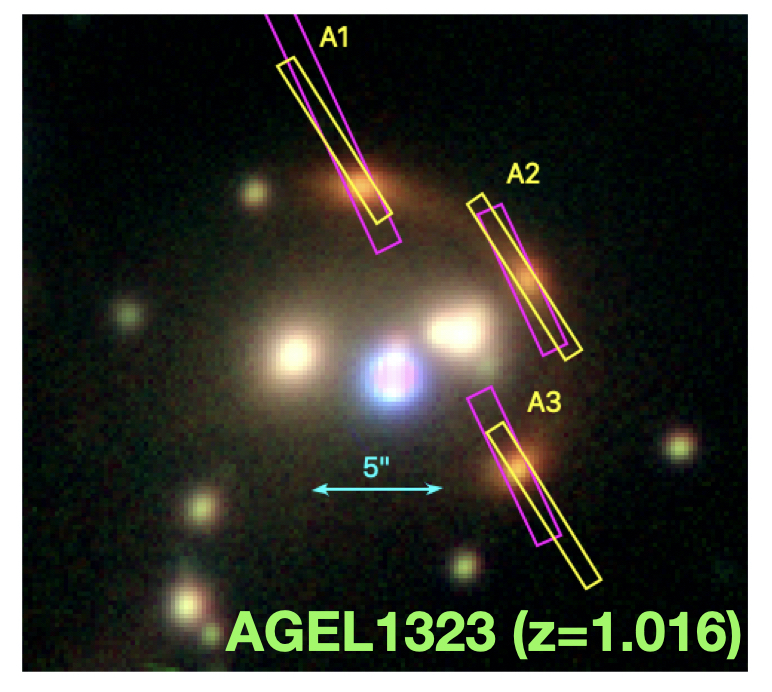
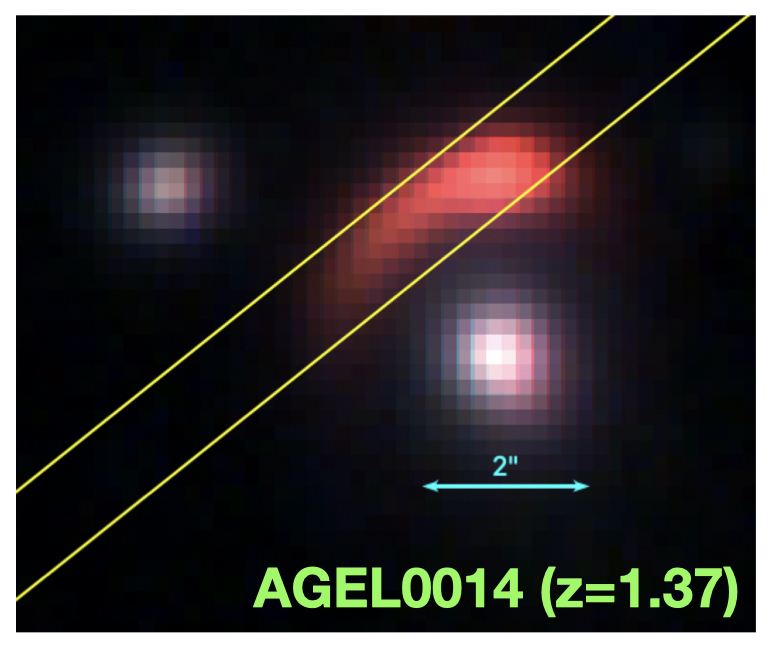
The two gravitationally lensed galaxies, AGEL132304+034319 (hereafter AGEL1323) at and AGEL001424+004145 (AGEL0014) at , were identified as part of the AGEL survey (Tran et al., 2022). The AGEL survey performed spectroscopic observations on strong gravitational lenses selected from the Dark Energy Survey (DES; Abbott et al., 2018) and the Dark Energy Camera Legacy Survey (DECaLS; Dey et al., 2019) to measure their redshifts. These lensed galaxy candidates were discovered using convolutional neural networks (Jacobs et al., 2019a, b) and were notable for their red arcs. AGEL1323 was also independently discovered by the COOL-LAMPS Surveys as COOL J1323+0343 (Sukay et al., 2022) in a visual search of the northern galactic cap portion of the southern DECaLS dataset.
Neither galaxy displayed emission lines in the identification spectra from AGEL survey, indicating their quiescent nature. As shown in Figure 1, AGEL1323 is a five-image111Two of the lensed images are only visible in high resolution HST imaging (Figure 2). system lensed by a group of galaxies with three visible clumps, while AGEL0014 is an arc spanning at least 3″ lensed by a foreground lens galaxy. The magnified flux of the lensed images make the two galaxies ideal for studying the detailed abundances and spatially resolved kinematics with deep spectroscopy. While this paper focuses on the chemical abundances of the lensed galaxies, Sweet et al. (2023, in prep.) will present a high-resolution kinematic analysis of AGEL1323 in an upcoming paper.
In 2021, we acquired deeper follow-up observations with Keck/LRIS and Keck/MOSFIRE for the galaxies to capture the portion of the rest-frame optical between 3600 Å and 5500 Å, which is sufficient to recover the ages and Fe and Mg abundances of the stellar population (Leethochawalit et al., 2018, 2019; Zhuang et al., 2021). In this section, we describe the spectroscopic and photometric data used for the stellar population analyses (Table 1).
| Object | R.A. | Decl. | Instrument | Date | Integration Time | S/Na | |
|---|---|---|---|---|---|---|---|
| (J2000) | (J2000) | (Å-1) | |||||
| AGEL1323 | 1.016 | Keck/LRIS | 2021-04-05 | 6.0 h | 60 | ||
| Keck/MOSFIRE-Y | 2021-04-17 | 5.0 h | 50 | ||||
| ∗Keck/MOSFIRE-Y | 2021-04-17 | 786 s | - | ||||
| ∗Keck/MOSFIRE-Ks | 2021-04-17 | 105 s | - | ||||
| ∗HST/WFC3-F200LP | 2022-06-18 | 600 s | - | ||||
| ∗HST/WFC3-F140W | 2022-06-18 | 598 s | - | ||||
| AGEL0014 | 1.374 | Keck/MOSFIRE-Y | 2021-08-17 | 1.5 h | 50 | ||
| Keck/MOSFIRE-J | 2021-08-17 | 1.5 h | 40 | ||||
| ∗Keck/MOSFIRE-J | 2021-10-30 | 1830 s | - | ||||
| ∗Keck/MOSFIRE-Ks | 2021-10-30 | 1668 s | - |
2.2 Spectroscopy
2.2.1 Keck/LRIS
We observed AGEL1323 with LRIS on the Keck I telescope with the D560 dichroic, 400/8500 grating and 1″ slit width for the red side for a total of 6 hours. The seeing varied between ″ and ″ throughout the night. We determined a FWHM of 6.47 Å from the spectrum of the arc lamp, corresponding to 3.21 Å in the rest frame. The spectral energy distribution of AGEL1323 is such that the blue side of the LRIS spectrum had insufficient flux for a meaningful analysis.
The data were reduced with PypeIt (Prochaska et al., 2020a, b), a semi-automatic software that performs flat field correction, cosmic ray removal, wavelength calibration, flexure correction via sky lines, heliocentric corrections, sky subtraction and spectral extraction. Because we used HgNeArCdZn lamps, different from the archived arcs in PypeIt, we calibrated the wavelength solution by visually identifying the arc lines instead of using the automatic line detecting algorithms. The extracted 1D spectra of each image of AGEL1323 (A1, A2, and A3) were flux-calibrated and coadded separately after the main run of PypeIt. The telluric corrections were performed directly on the coadded science spectra, which fits a fifth-order polynomial model representing the continuum of the galaxy and spectral regions sensitive to telluric absorption to a grid of telluric spectral templates. Readers are referred to PypeIt’s website222PypeIt: https://pypeit.readthedocs.io/en/release/index.html for details. The coadded spectra for the three lensed images were stacked with inverse variation weighting to maximize the S/N in order to better characterize the stellar population properties.
2.2.2 Keck/MOSFIRE
We observed AGEL1323 with MOSFIRE Y-band on Keck I telescope MOSFIRE-Y using a slit width of 0.7″ for the slit mask for 5 hours. The seeing was around 1″, yielding a FWHM of Å. On the second night, we observed AGEL0014 using a slit width of 1.0″ for a total of 3 hours in Y and J band. The seeing was around 0.4″ on the second night, providing a FHWM of 3.5 Å in the Y-band and 4.4 Å in the J-band.
The raw data were reduced using the MOSFIRE DRP333MOSFIRE DRP: https://keck-datareductionpipelines.github.io/MosfireDRP/ to generate a coadded 2D spectrum for the entire night. Generally, the MOSFIRE DRP expects that the data were taken with a standard dithering pattern of ABAB within the slits, which results in one positive and one negative trace in the differential image. However, we adopted a non-standard dither pattern for AGEL1323 because the small separations () between the three lensed images do not allow enough room to nod within the slits. We therefore required the telescope to nod across the slits. The mask was designed to have two pairs of slits separated by 23.94″, corresponding to the length of three slits. Three traces of the three lensed images were present on the different slits at the two different telescope pointings. This strategy made the differential image consist of either a positive or a negative trace in one slit. We modified the DRP slightly to handle the sky subtraction to account for this nodding solution. In each slit of the differential image, the light profile was generated from the median of 2D spectrum. We then fit a Gaussian profile to the light profile and masked out the regions within 2 where most of the light is from the galaxy. We then estimated the sky background from the unmasked regions. We also experimented with a few choices of thresholds and found that 2 masking could give the cleanest background while keeping enough signal from the galaxy.
One-dimensional (1D) spectra were extracted from the 2D spectrum produced by the DRP using MOSPEC (Strom et al., 2017). We used optimal extraction (Horne, 1986). The flux calibration was performed by comparing the observed spectrum of the standard star with the Vega spectrum scaled to its J-band magnitude. A B-spline was fitted to the ratio of the scaled spectrum to the observed spectrum to derive the response curve. We then applied the curve to other extracted science spectra to obtain the flux-calibrated, telluric-corrected spectrum of each science target.
2.3 Photometry
2.3.1 Ground-based Imaging
To construct the lens model, we obtained MOSFIRE images for AGEL1323 and AGEL0014 on 2021 Apr 5 and 2021 Oct 30, respectively. The sky was clear on both nights, with an average seeing of 0.82″ on Apr 5 and 0.65″ on Oct 30. We reduced the images by using the standard IRAF commands to perform dark subtraction, flat correction, and sky subtraction. The final images have a limiting magnitude of 24.88 mag in the J-band and 24.38 mag in the Ks-band for AGEL0014, and 23.93 mag in the Y-band and 23.14 mag in the Ks-band for AGEL1323 on a pixel-to-pixel basis. We performed the flux calibration by comparing the instrumental magnitudes of 2MASS stars in the field obtained from SExtractor (Bertin & Arnouts, 1996) with the values in 2MASS Point Source Catalog (Skrutskie et al., 2006).
2.3.2 HST/WFC3
We used F140W and F200LP images from HST/WFC3 from program 16773 (PI Glazebrook). The target was observed in the IR/F140W filter for 3 exposures of 200 seconds, and in the UVIS/F200LP filter for 2 exposures of 300 seconds (Shajib et al., 2022a, b). The images were reduced using the STScI DrizzlePac software package to align the separate exposures, as well as correct for background distortion and remove flagged cosmic rays. Within the AstroDrizzle function, we customized the WCS for the final stacked output to rotate the filters in the same orientation. We set the final pixel size of “0.08 to match the F200LP filter with the scaling of filter F140W. To create the mock-RGB combined image in Figure 2, we used the Lupton et al. (2004) algorithm implemented in astropy’s make_lupton_rgb.
3 Methods
3.1 Lens Modeling
To obtain a reliable mass estimate, a lens model is needed to calculate the magnification factor and yield the delensed stellar mass. We used the lens modeling software PyAutoLens444https://github.com/Jammy2211/PyAutoLens (Nightingale & Dye, 2015; Nightingale et al., 2018, 2021a, 2021b) to fit the observed images.
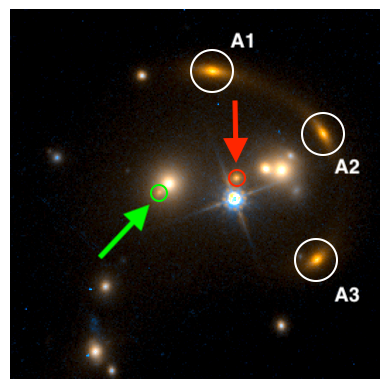
Although Sukay et al. (2022) already constructed the lens model for AGEL1323 by fitting the Magellan/FourStar -band image with LENSTOOL (Jullo et al., 2007) and derived a magnification factor of , our HST data reveals a fifth image of the source that was not identified by Sukay et al. (2022). The counter-image is very close to one of the lens galaxies and marked by the green arrow in Figure 2. Our results differ from those of Sukay et al. because the counter-image is visible only with the high spatial resolution of our HST images. As a result, our lens model results in a significantly lower magnification.
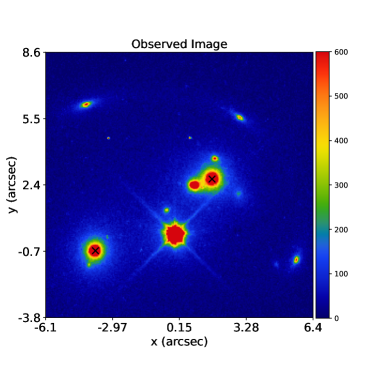
AGEL1323 is a group scale lens containing multiple lens galaxies. We fit the HST F200LP imaging data. We first subtract the light of the two brightest galaxies marked with black crosses in Figure 3, by fitting elliptical Sérsic light profiles. To this foreground subtracted data we apply a custom mask (drawn via a graphical user interface) which retains only the lensed source’s multiple images. We then fit a mass model where the mass of the two galaxies marked with black crosses in Figure 3 are singular isothermal ellipsoids, and the group’s host dark matter halo is modeled with a spherical NFW profile (Navarro et al., 1997). The NFW profile’s concentration is set to the mean of the mass-concentration relation of Ludlow et al. (2016). The source is again modeled by an elliptical Sérsic profile. We fit the mass and source profiles simultaneously. As shown in Figure 3, the best-fit model successfully reproduces all five images, including the central image. We define the magnification as the ratio of the total image-plane flux of the source divided by the total source-plane flux, and infer a value of .
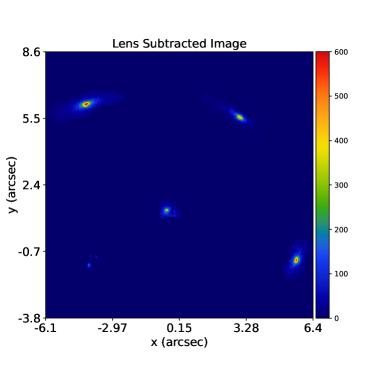
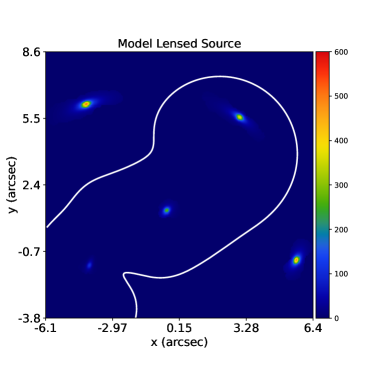
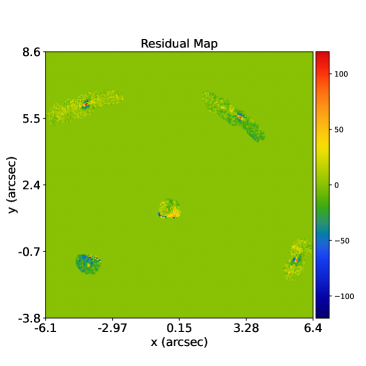
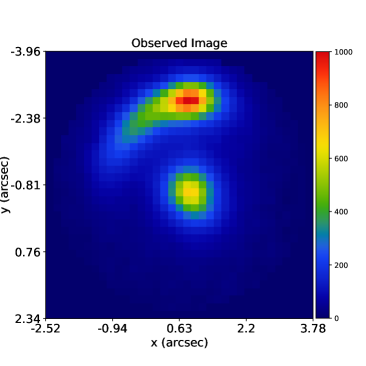
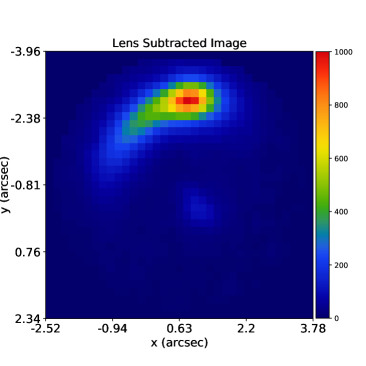
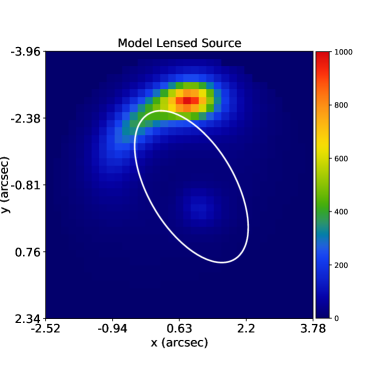
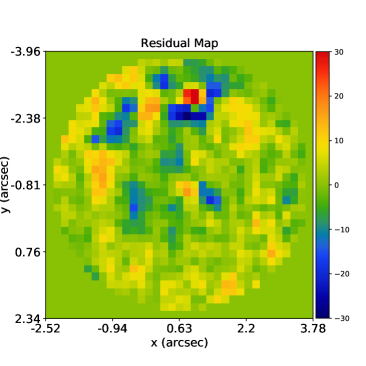
For AGEL0014, we performed the fitting on the MOSFIRE-Ks image. For the lens galaxy, we fit an elliptical Sérsic light profile for its light and singular isothermal ellipsoid for its mass. For the source, we fit an elliptical Sérsic light profile. We fit all three components simultaneously, using the nested sampling algorithm dynesty (Speagle, 2020). As shown in Figure 4, the best-fit model successfully detects a faint source counter image, which is offset from the lens galaxy center and is not visible until after the lens light subtraction. For the magnification we infer a value of .
3.2 Stellar Mass Estimates
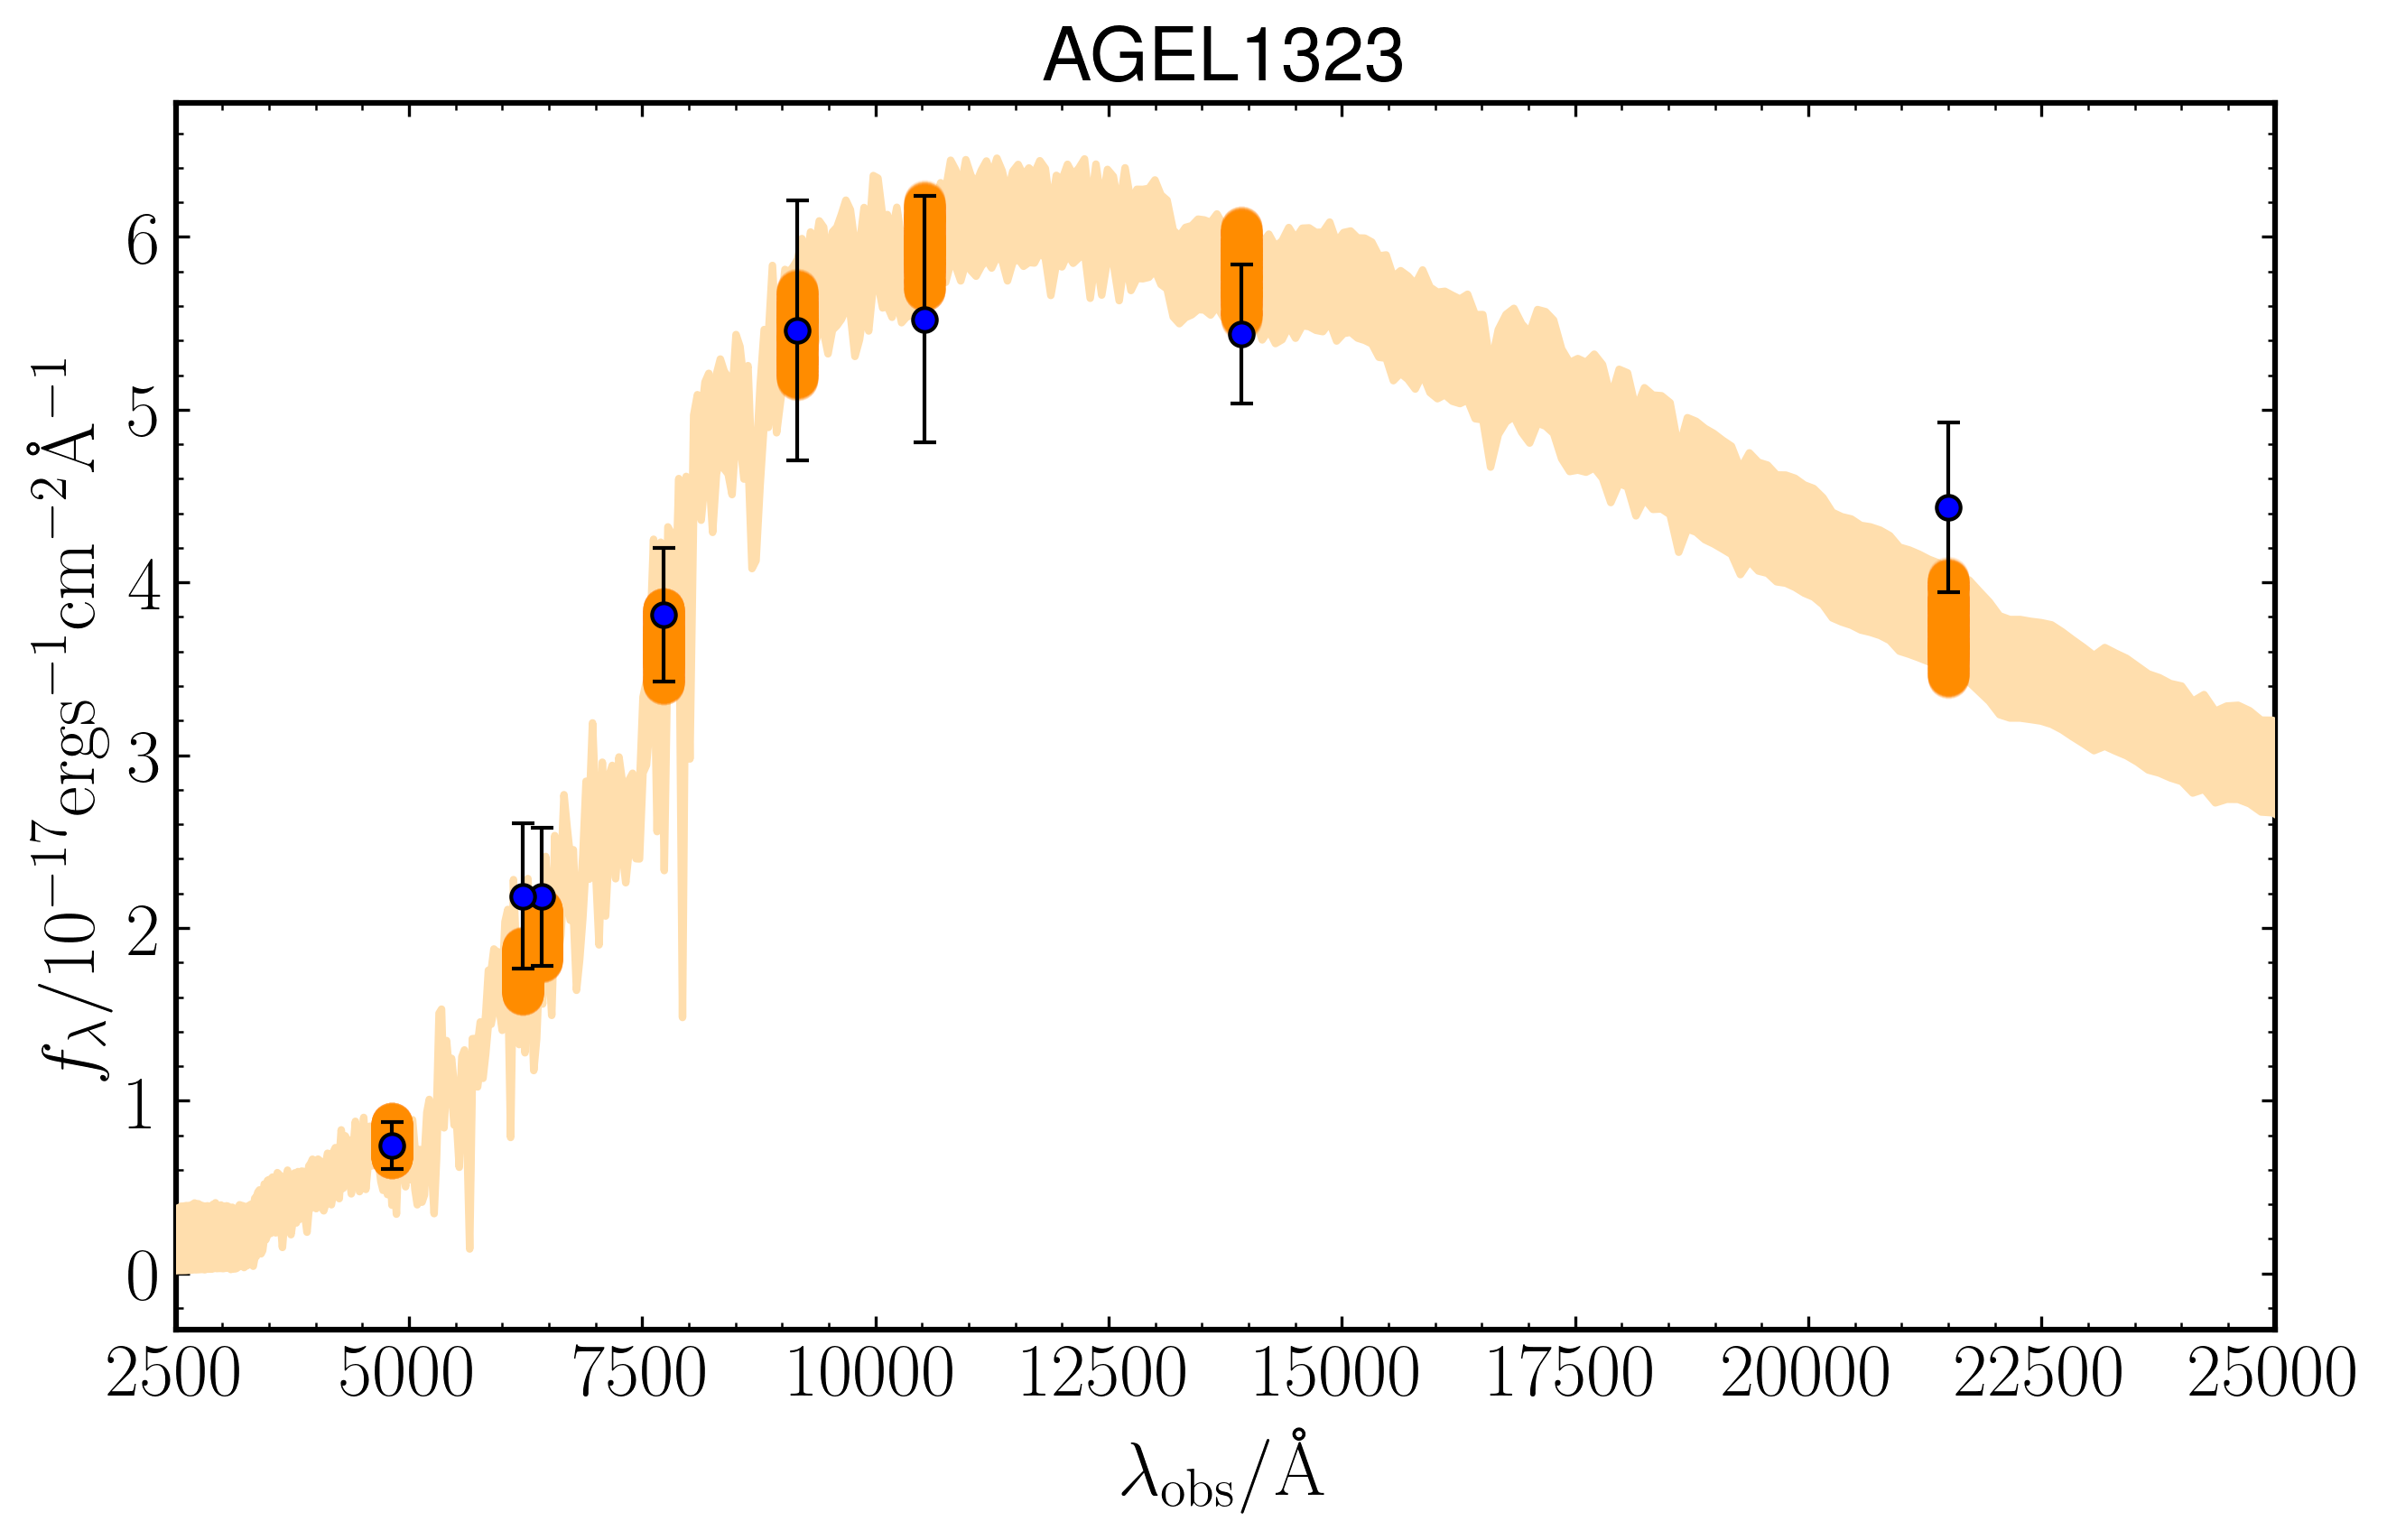
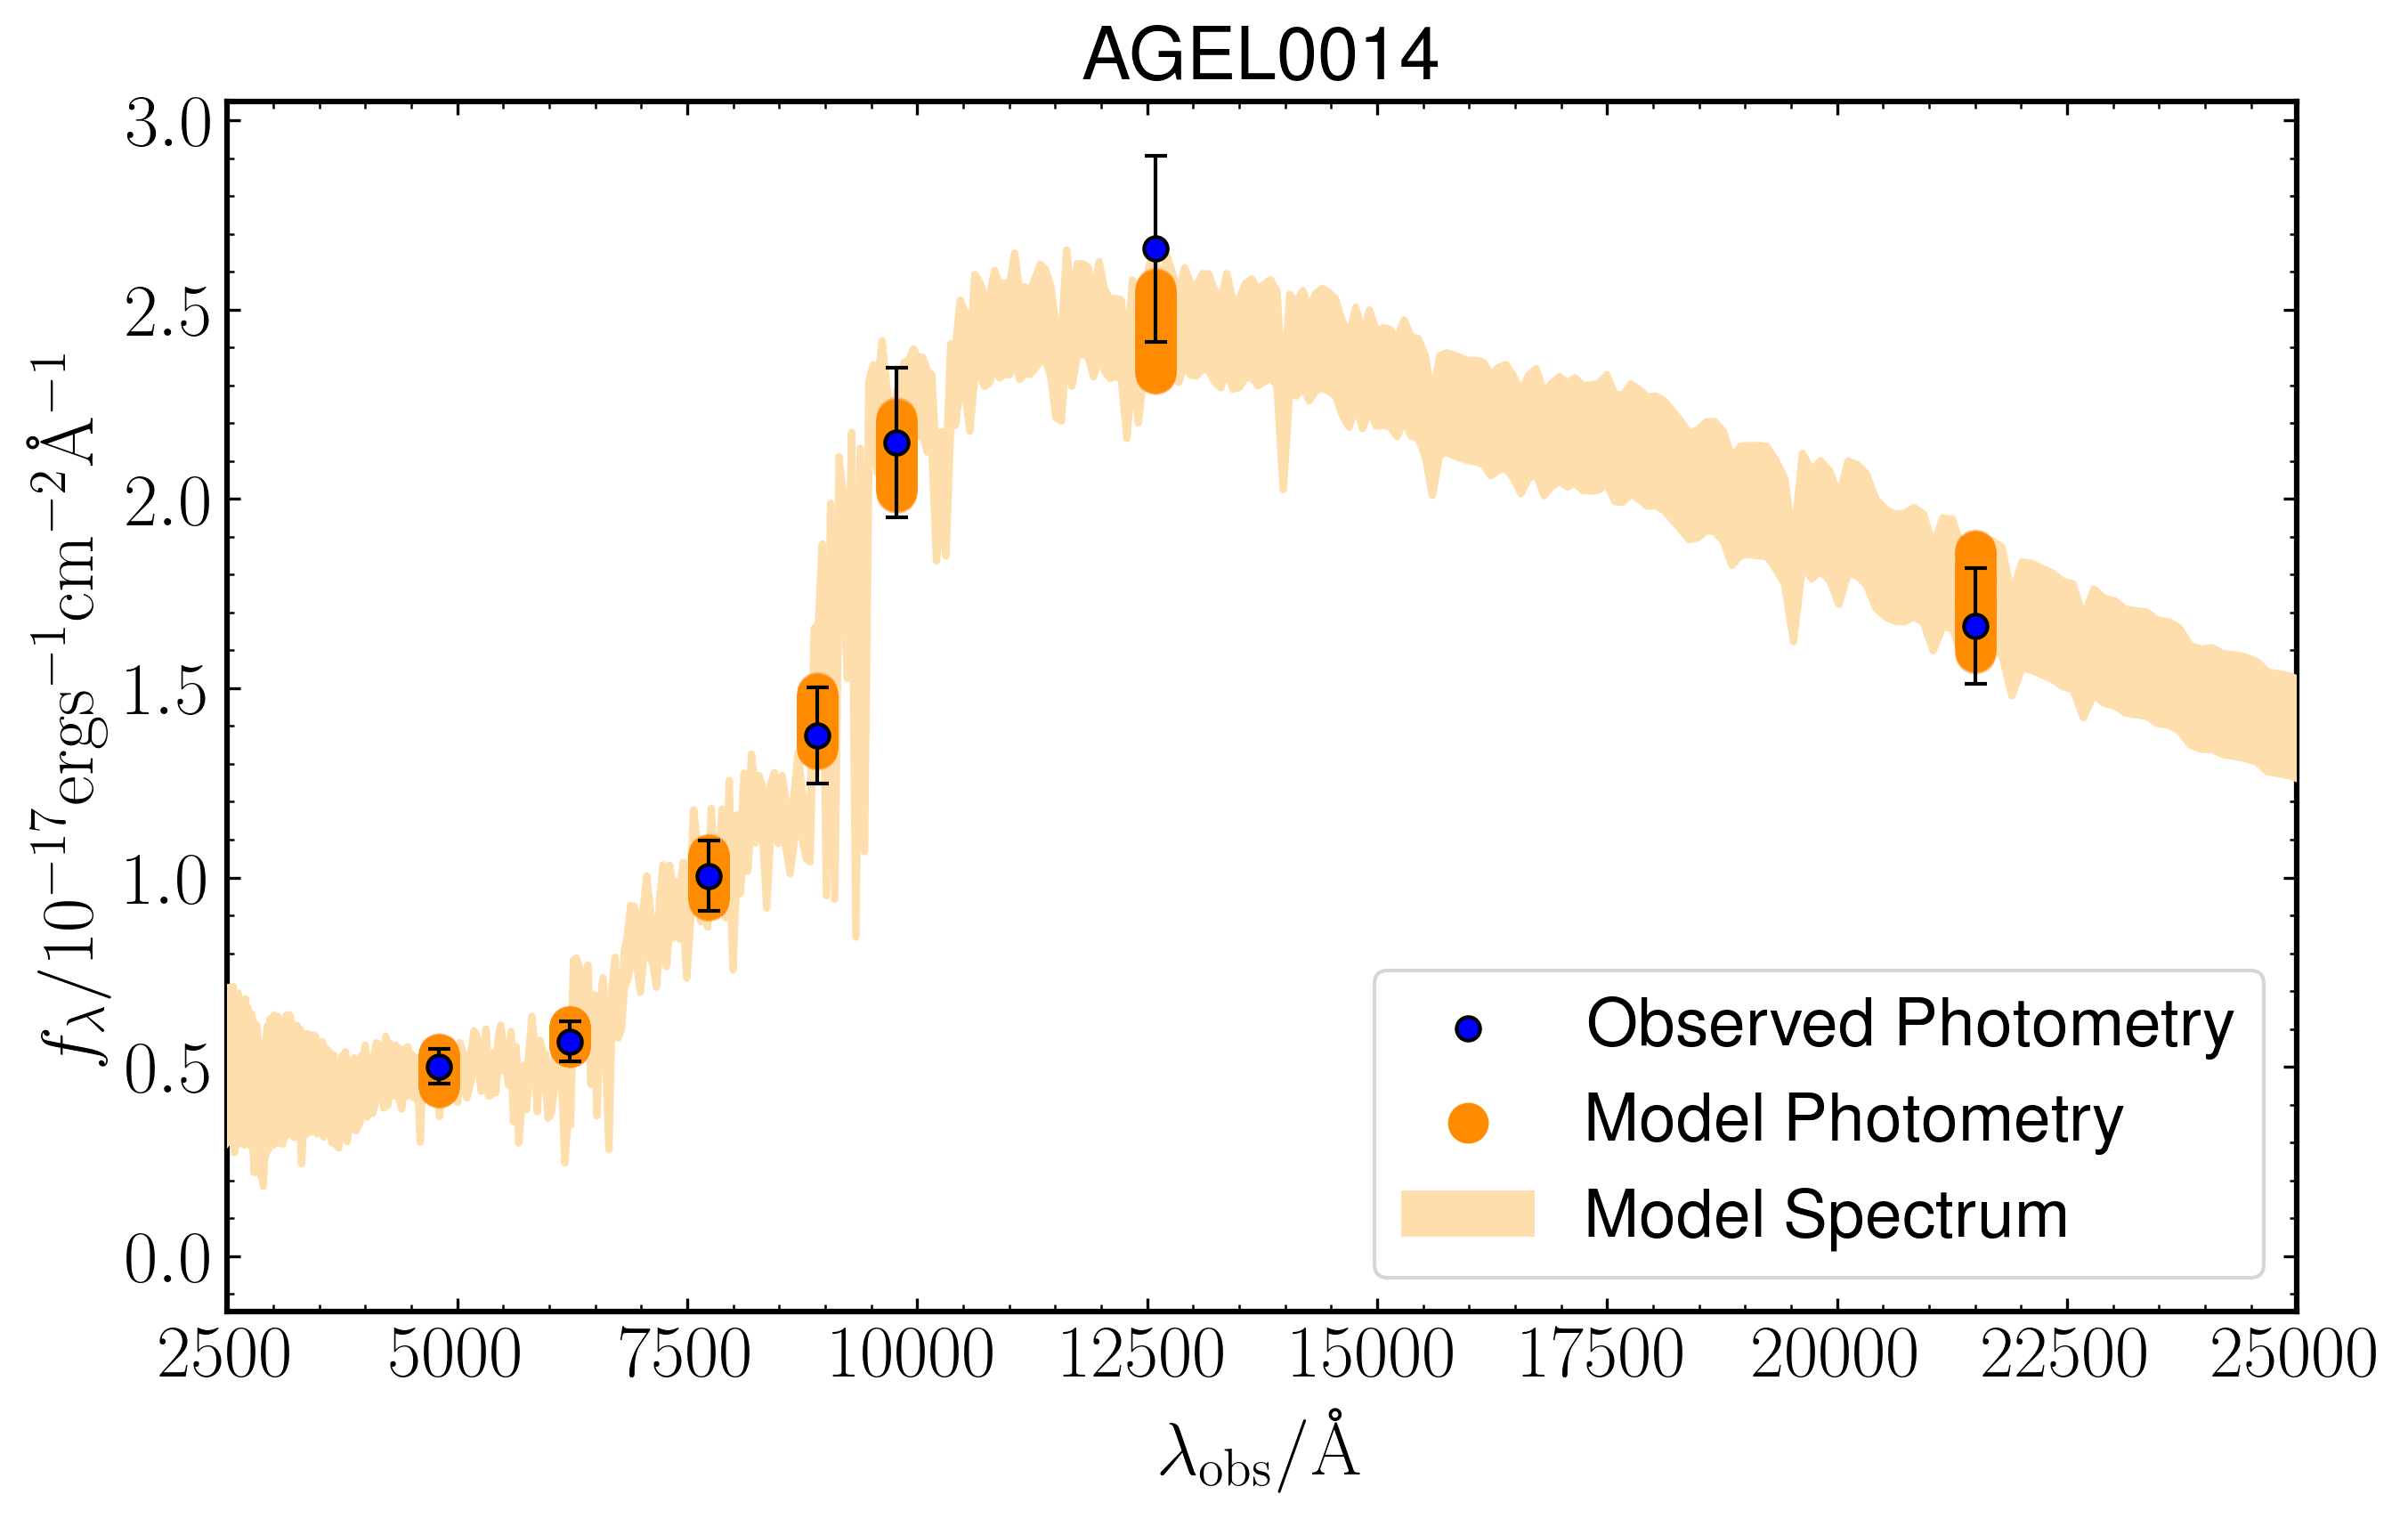
The lensed stellar masses were measured by fitting the broadband spectral energy distribution (SED). For AGEL1323 we used photometry from DECaLS , HSC-, MOSFIRE-YKs and HST/WFC3-F140W. We adopted HSC- and MOSFIRE-YKs for the photometry of AGEL0014. For each galaxy, we smoothed the high resolution images to match the point spread function (PSF) with the one that has lowest resolution and extracted the photometry from the reduced images with SExtractor (Bertin & Arnouts, 1996). We padded the photometric uncertainties to 0.1 mag if the formal errors are smaller than that to account for possible systematics originated from complicated morphologies of the lensing system. The photometry is corrected for Galactic reddening using the values measured by Schlafly & Finkbeiner (2011).
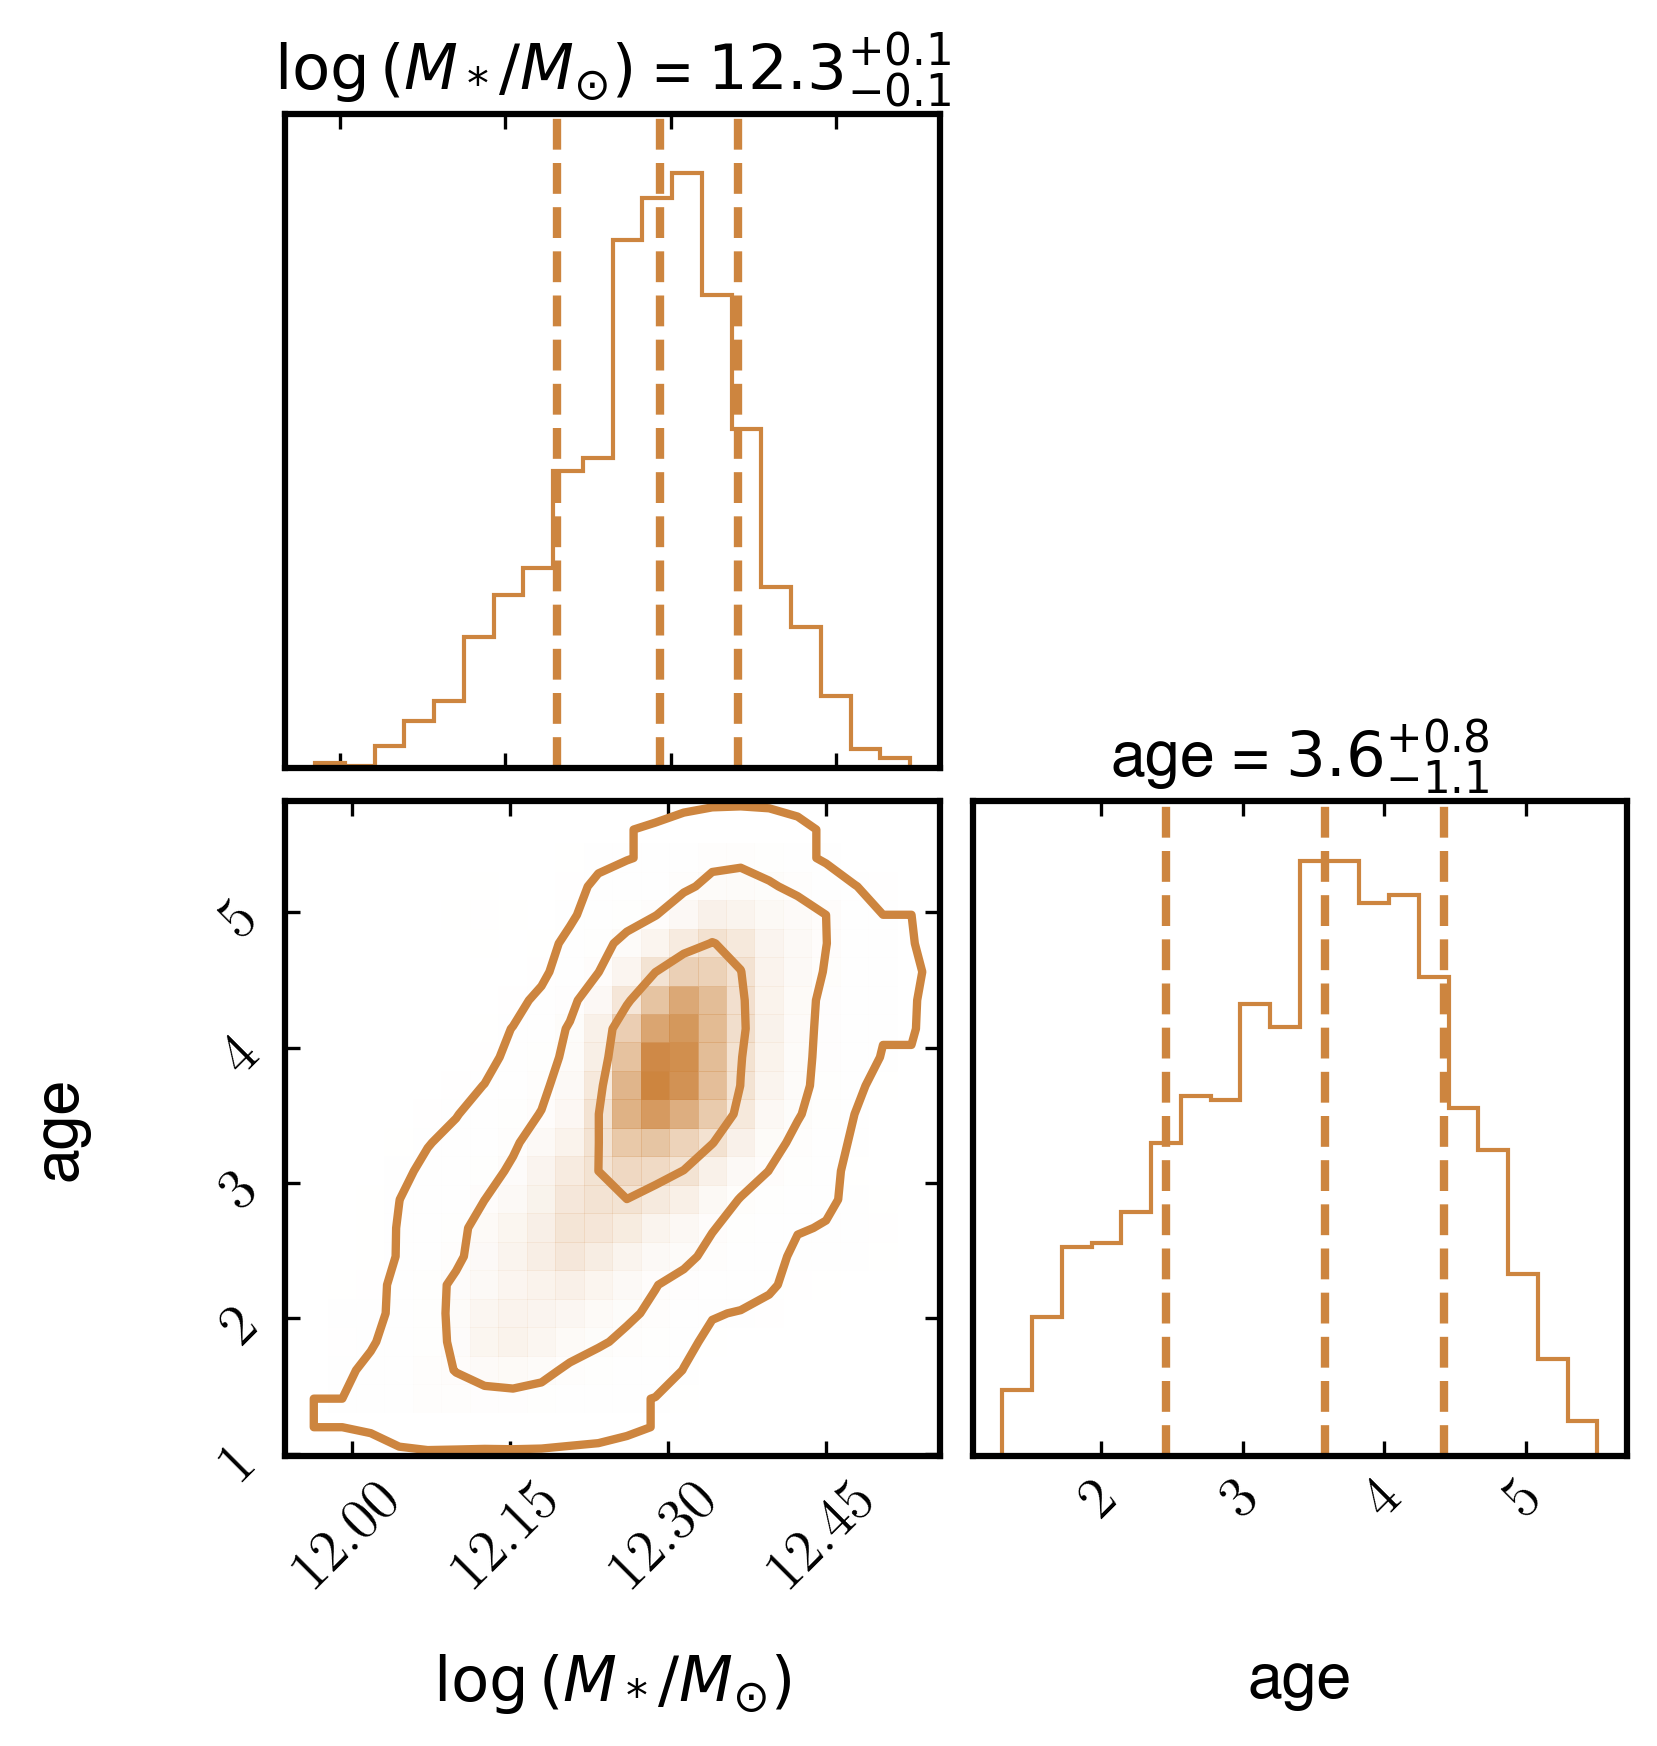
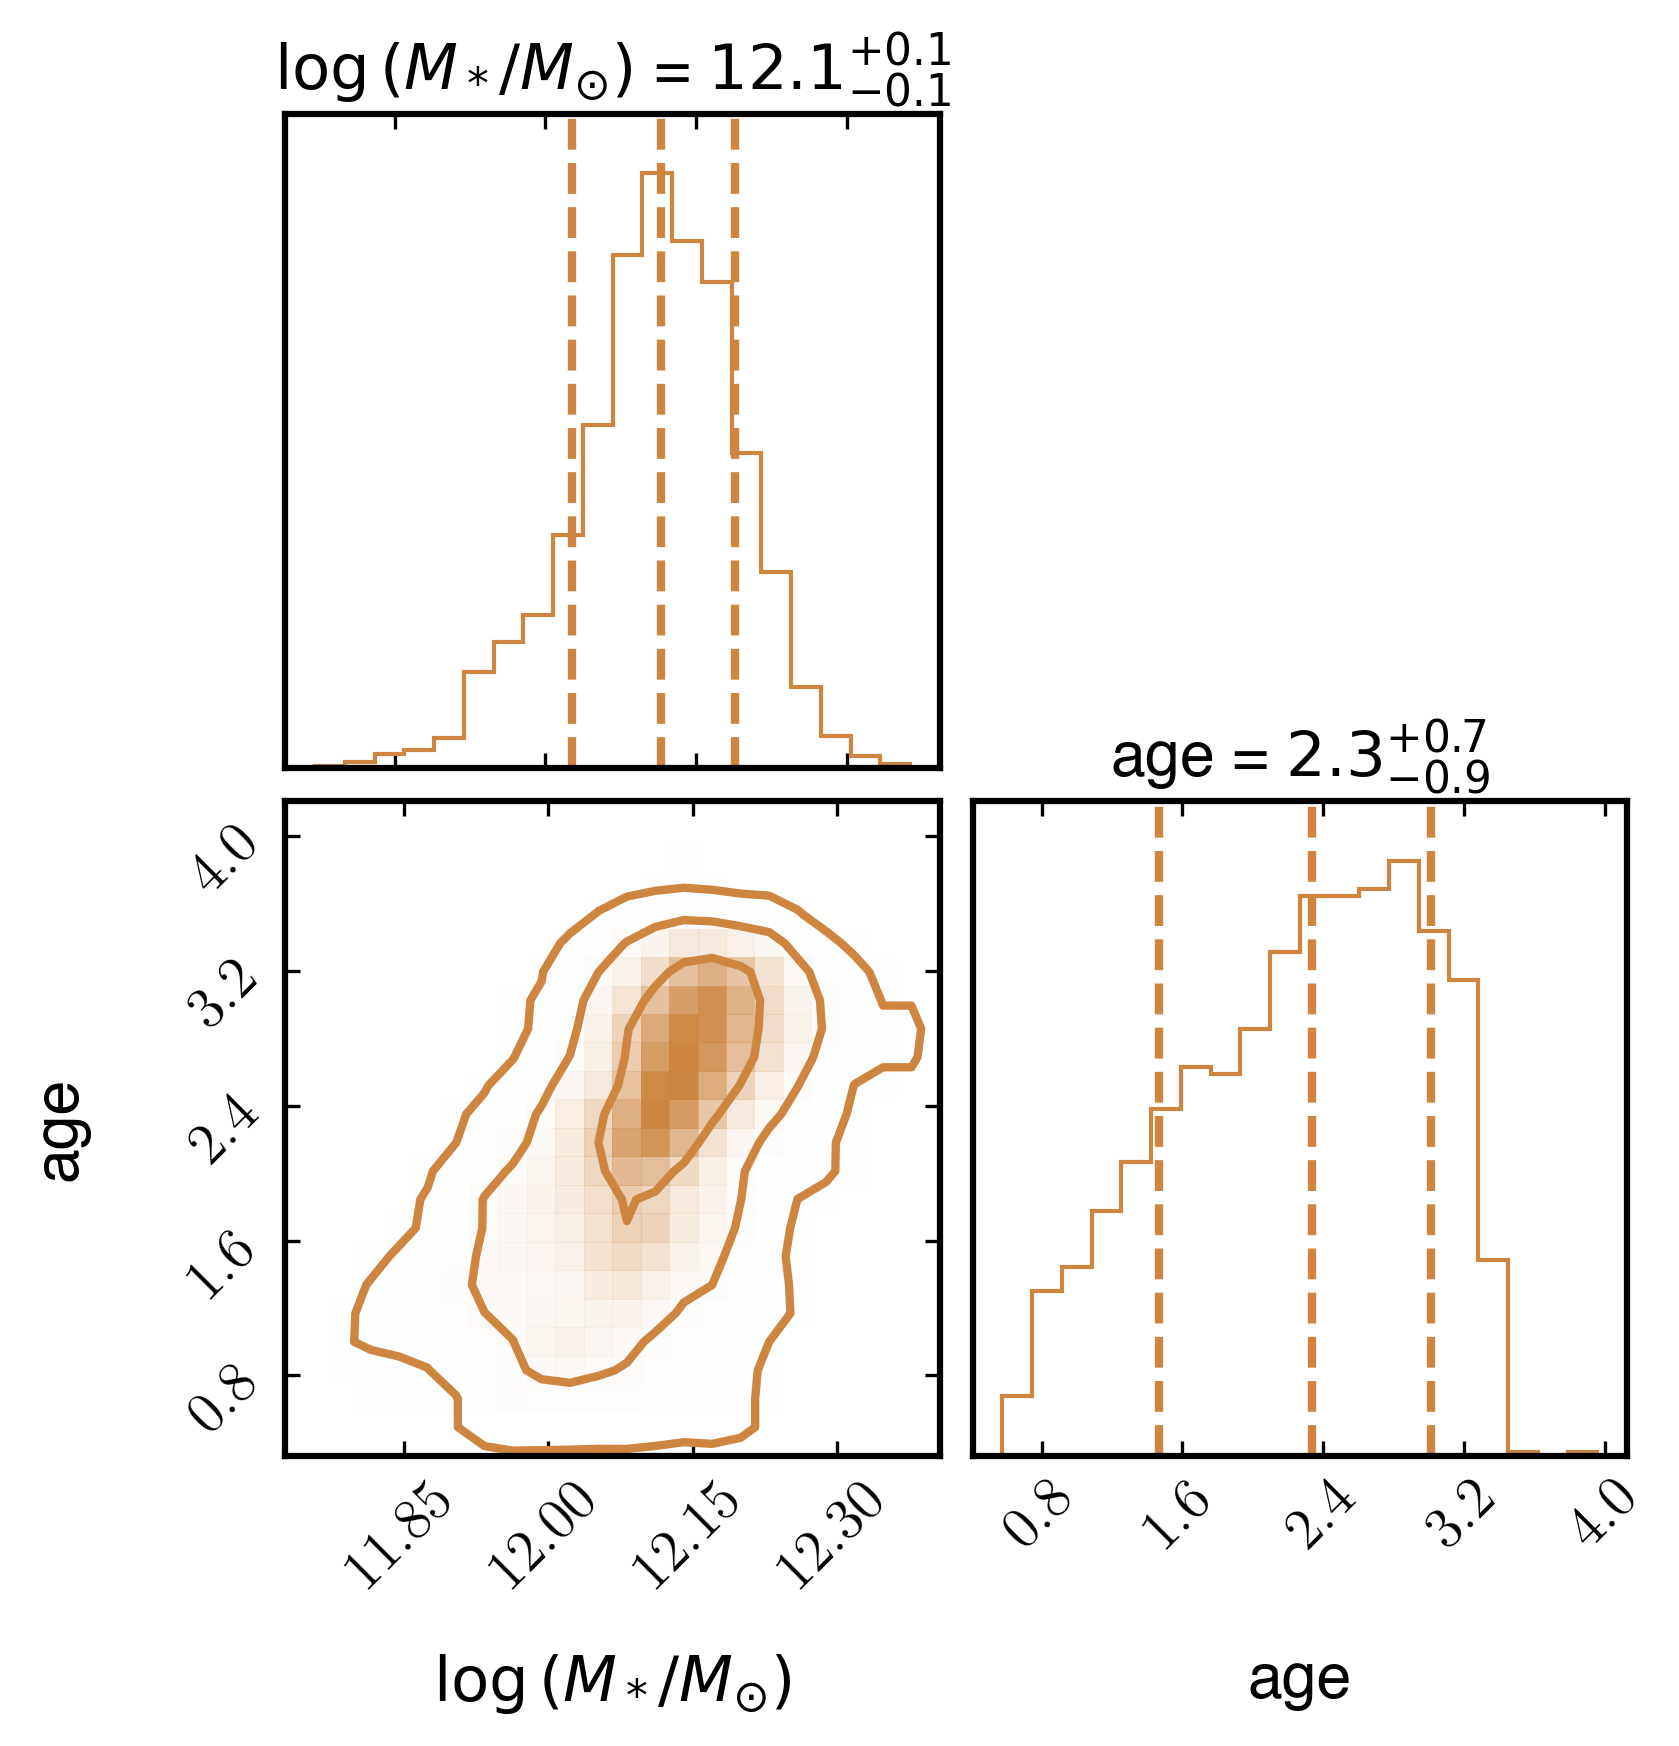
We modeled the SED assuming an delayed exponentially declining (delayed-) SFH with BAGPIPES (Carnall et al., 2018, 2019). We used the Calzetti et al. (2000) dust extinction law and required the attenuation in the band () to be varied between . The redshift for each galaxy has a Gaussian prior centered at in the AGEL catalog, with a standard deviation of . The other free parameters and their priors are stellar mass (), stellar metallicity (), time since the onset of star formation ( Myr 555 stands for the age of the universe at the observed redshift.), and the -folding SFR timescale (). As shown in Figure 5, the SED models yield a lensed stellar mass of and for AGEL1323 and AGEL0014, respectively, which translates a delensed stellar mass of and when the magnification is corrected.
To quantify the systematic uncertainties of stellar masses due to different assumptions on SFH, we also performed SED fitting with four other SFH models, including single burst, single exponentially declining, log-normal, and double-power-law SFHs. The root-mean-square (RMS) errors among the best-fit stellar masses666The best-fit stellar masses here mean the median value of the 1D posterior distribution. of different models are used as estimates of the systematic uncertainties ( dex for AGEL1323 and dex for AGEL0014). In the end, we obtained a delensed stellar mass of for AGEL1323 and for AGEL0014. We also performed some robustness tests: experimenting with different detection and analysis thresholds for SExtractor, including spectroscopic data for SED fitting, and only fitting for the photometry reported by Sukay et al. (2022). All the results are consistent with our reported values within .
For both galaxies, the delensed stellar masses of the two galaxies derived from the SED fitting and the velocity dispersion determined from the full-spectrum fitting (Section 3.3) are consistent with the stellar mass–velocity dispersion relation of quiescent galaxies at (Belli et al., 2014; Mendel et al., 2020).
3.3 Stellar Population Fitting
We analyzed the combined spectra using the full-spectrum fitting algorithm absorption line fitter (alf, Conroy & van Dokkum, 2012; Conroy et al., 2018) because of its capability of measuring detailed elemental abundances in addition to overall stellar metallicity, [Fe/H]. alf uses MIST isochrones (Choi et al., 2016) and empirical stellar spectra (Sánchez-Blázquez et al., 2006; Villaume et al., 2017), along with a theoretical response function covering a wide range of elemental abundances. This code operates on the continuum-normalized spectrum by fitting a high-order polynomial to the ratio of the model and data to avoid potential issues with imperfect flux calibration and dust attenuation. This functionality also allows alf to fit multiple spectra of the same source taken on various instruments with different flux calibrations and instrumental resolutions. The fitting is accomplished with the ensemble Markov Chain Monte Carlo (MCMC) sampler emcee (Foreman-Mackey et al., 2013) to efficiently explore a large parameter space.
We used alf’s simple mode, which assumes a simple stellar population (SSP) and a fixed Kroupa (2001) initial mass function (IMF). It simultaneously fits for the recession velocity, velocity dispersion, stellar age, stellar metallicity [Fe/H], and the abundances of C, N, O, Na, Mg, Si, Ca, and Ti. The resulting stellar population parameters are SSP-equivalent, which are similar to light-weighted age and abundances. Following Beverage et al. (2021), the default priors were used, except that of maximum age was set to be 1 Gyr older than the age of universe at the observed redshift to fully explore the parameter space and to avoid a truncated posterior distribution. The recovered parameters are consistent with the results when the maximum allowed age is the age of universe at the observed redshift. Although alf also has a full mode describing a double-component stellar population, Conroy et al. (2018) indicated that the simple mode is more reliable when only the blue optical spectrum is available. Zhuang et al. (2021) also found out that the abundances derived from the alf simple mode are more consistent with those obtained from resolved stellar spectroscopy. Therefore, the following analysis focuses on the results obtained from the simple mode.
Given the quality and wavelength coverage of our data, we focused on the age, [Fe/H], and [Mg/Fe] derived from alf. We chose to measure Mg for two reasons. First, Mg is one of the -elements that is mainly produced by core-collapse supernovae. Due to the short lifetime of massive stars, its recycling time can be approximated as instantaneous, for which magnesium is a good tracer of the overall galaxy evolution. For instance, Leethochawalit et al. (2019) used [Mg/H] of quiescent galaxies as a proxy to constrain the mass-loading factor of outflows averaged over the entire SFH. Second, the Mg triplet at 5170 Å, which minimally overlaps with absorption features of other elements, is available in our spectra, allowing us to determine the Mg abundance reliably.
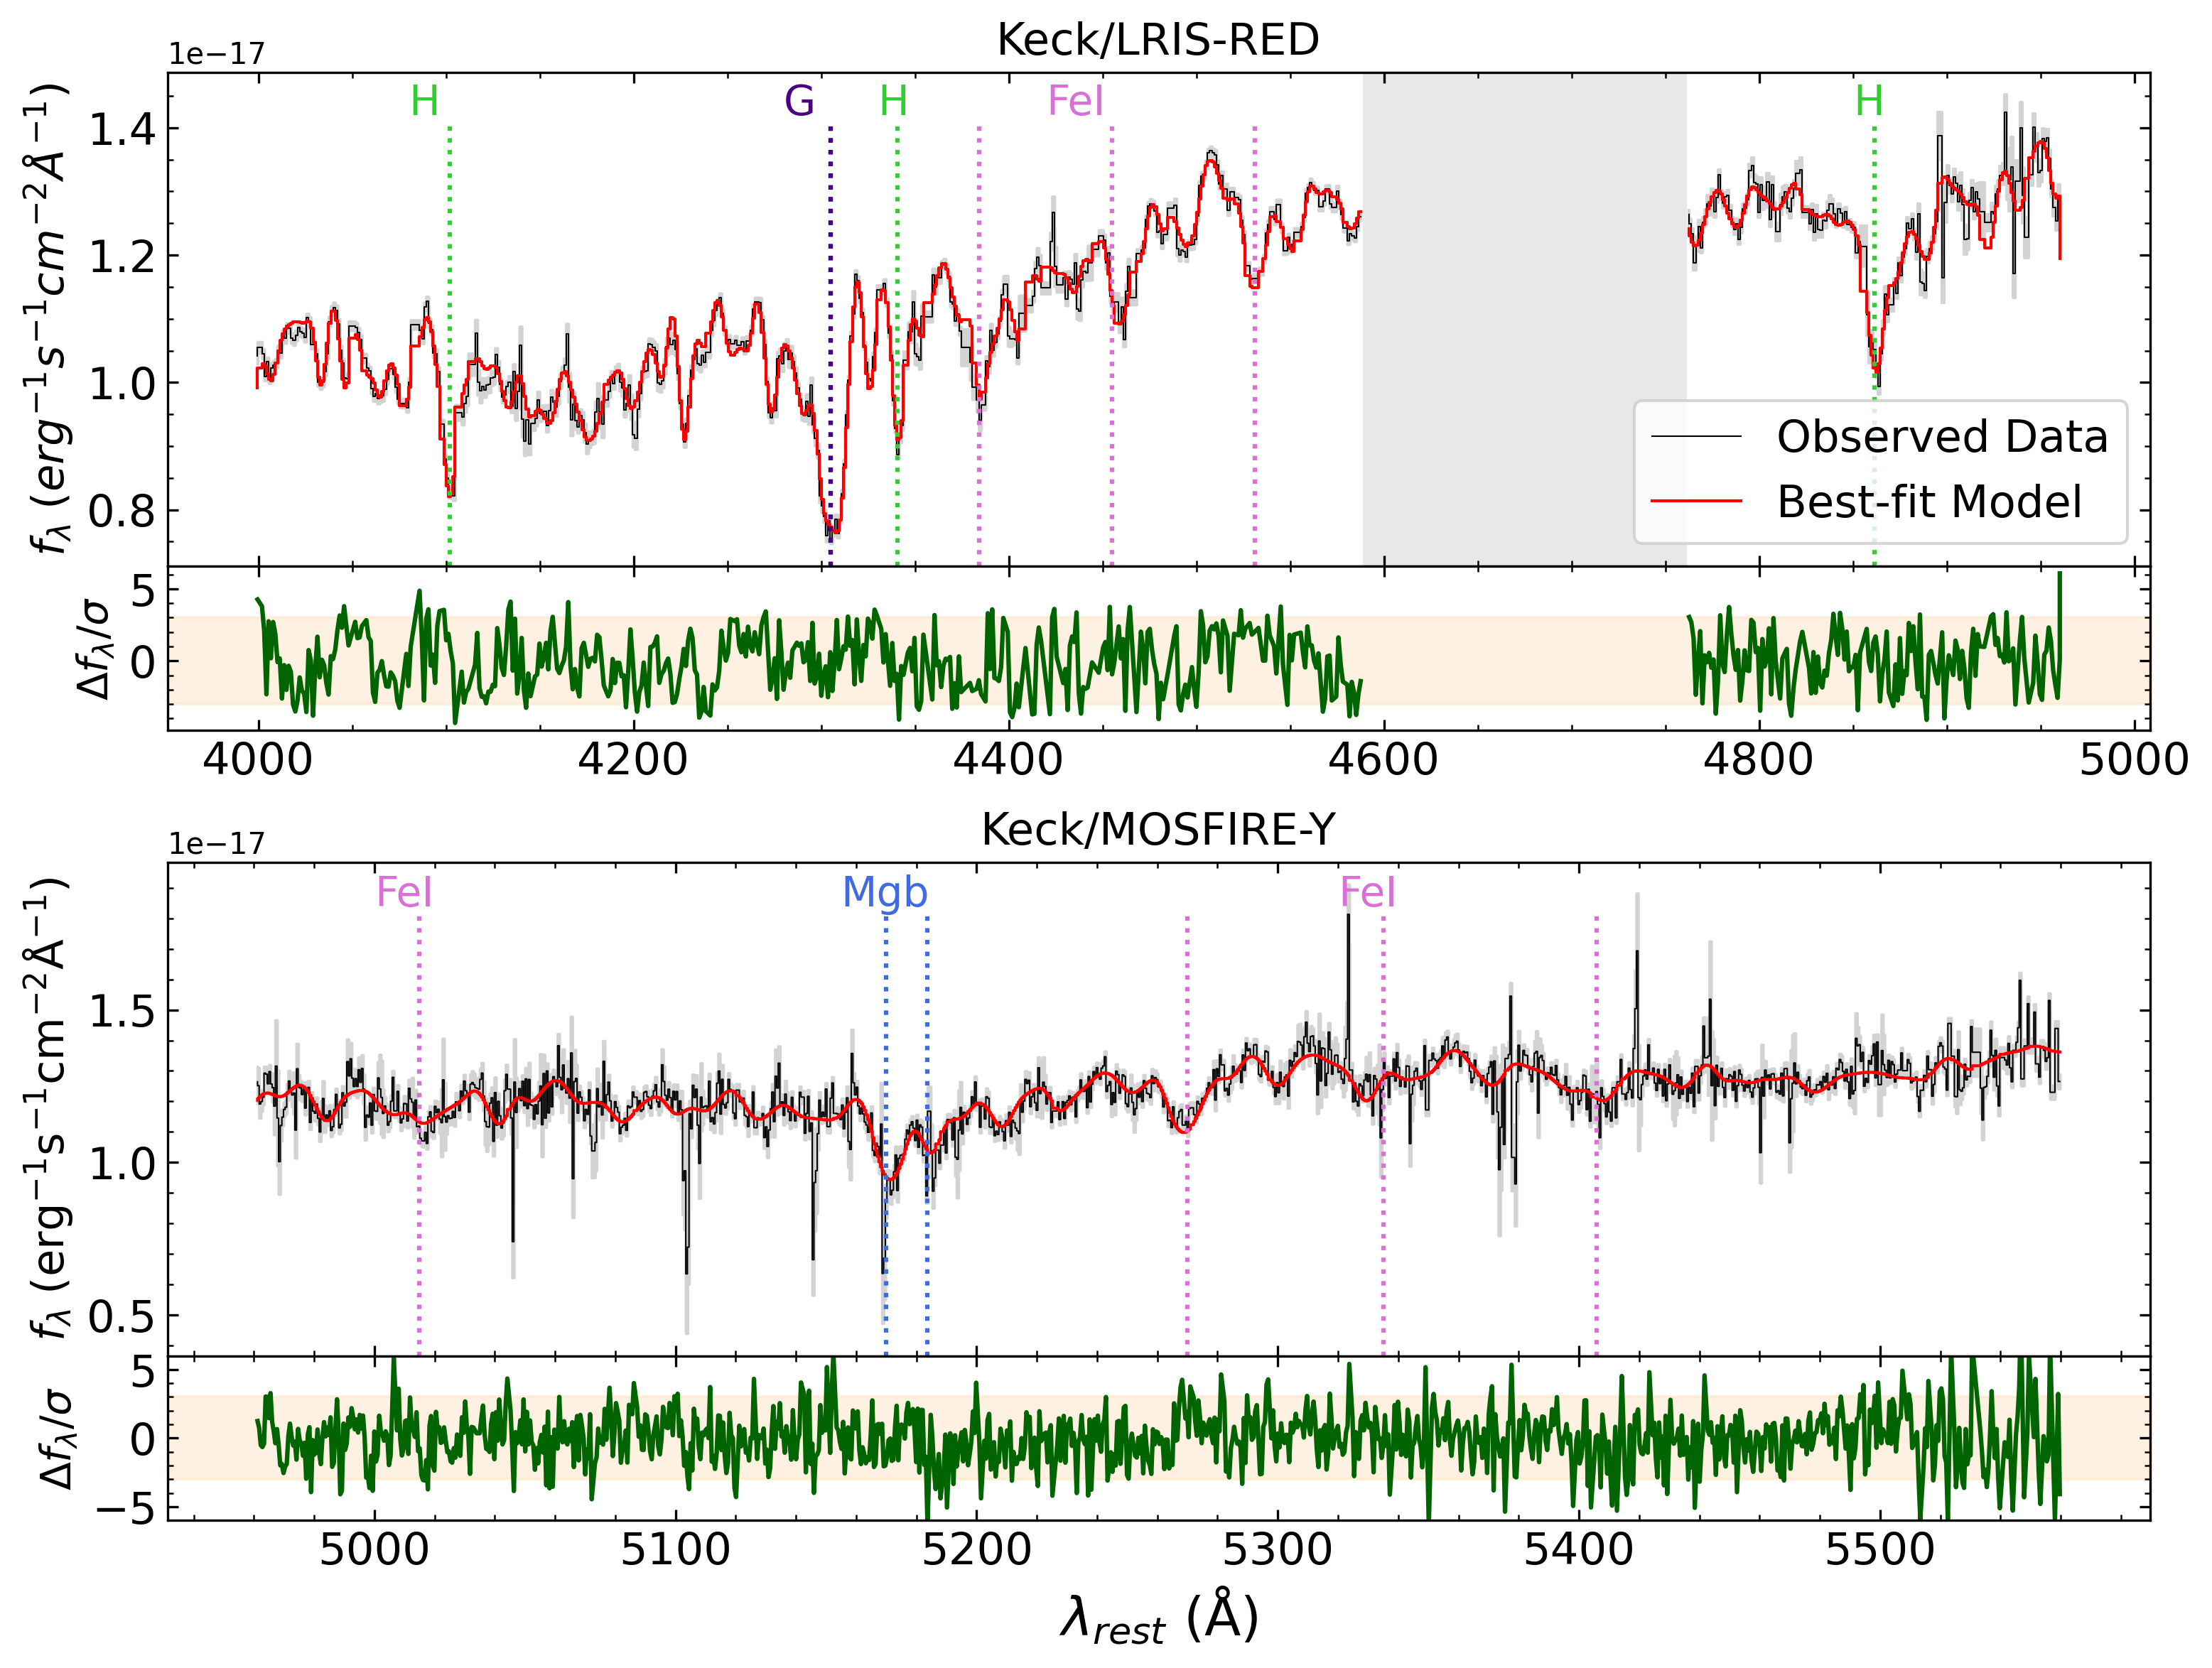
We excluded any regions below 4000 Å for the alf fitting because the difficulty of matching the continuum around the 4000 Å break may introduce some errors in the recovered abundances 777private communication with Meng Gu. This also excluded the Ca ii H and K lines from the fitting, which is known to have strong non-local thermodynamic equilibrium (NLTE) effects that the current models poorly reproduce (Conroy et al., 2018). For each spectrum, we ran two iterations to remove the sky line residuals. In the first iteration, we only masked out the regions where the telluric features cannot be corrected. After the first fit, the pixels with 4 deviations from the best-fit model were masked to reduce the contamination of bright sky lines to the fitting. We then re-fit the spectrum with the new pixel mask to determine the best-fit model and the corresponding stellar population parameters. The reduced of each spectrum is greater than 1, which may result from either models imperfections or underestimated flux uncertainties from the data reduction pipeline. Therefore, the uncertainties reported in Table 2 are rescaled by the square root of the reduced to incorporate the systematic errors that were not captured by the posterior distribution and the random errors. We experimented with different degrees of polynomials for continuum normalization and found out that all the measurements are consistent with each other.
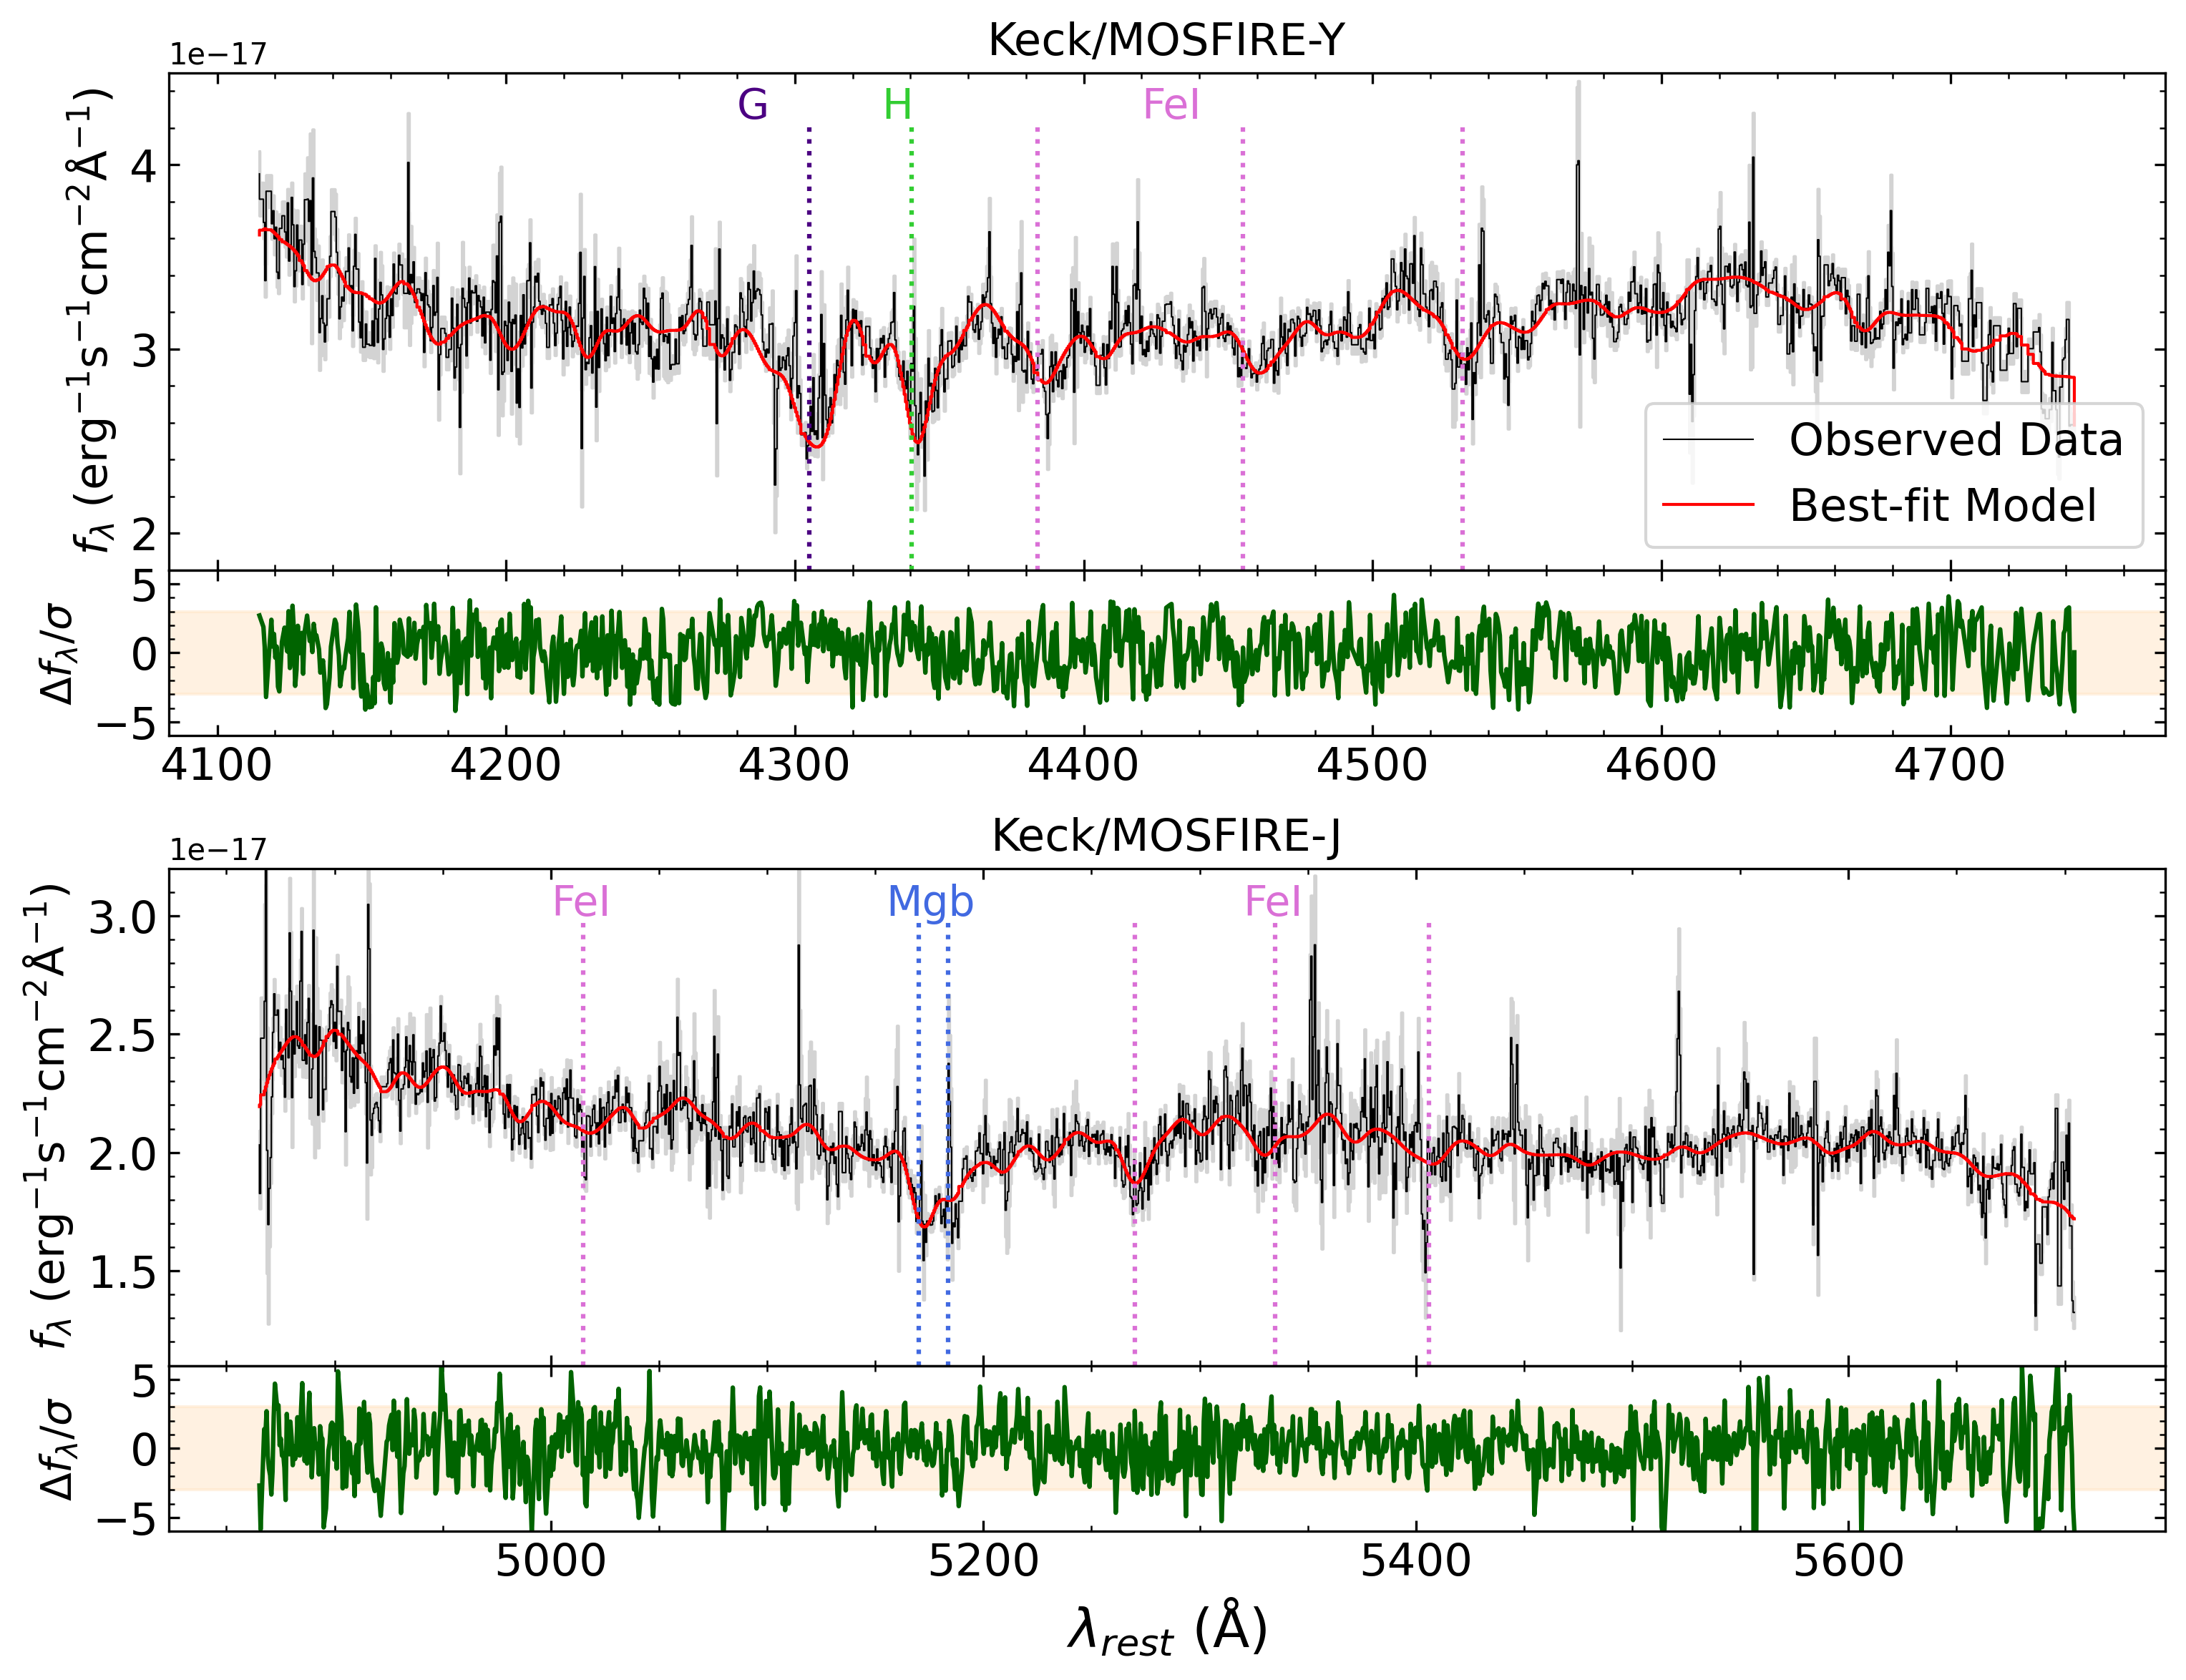
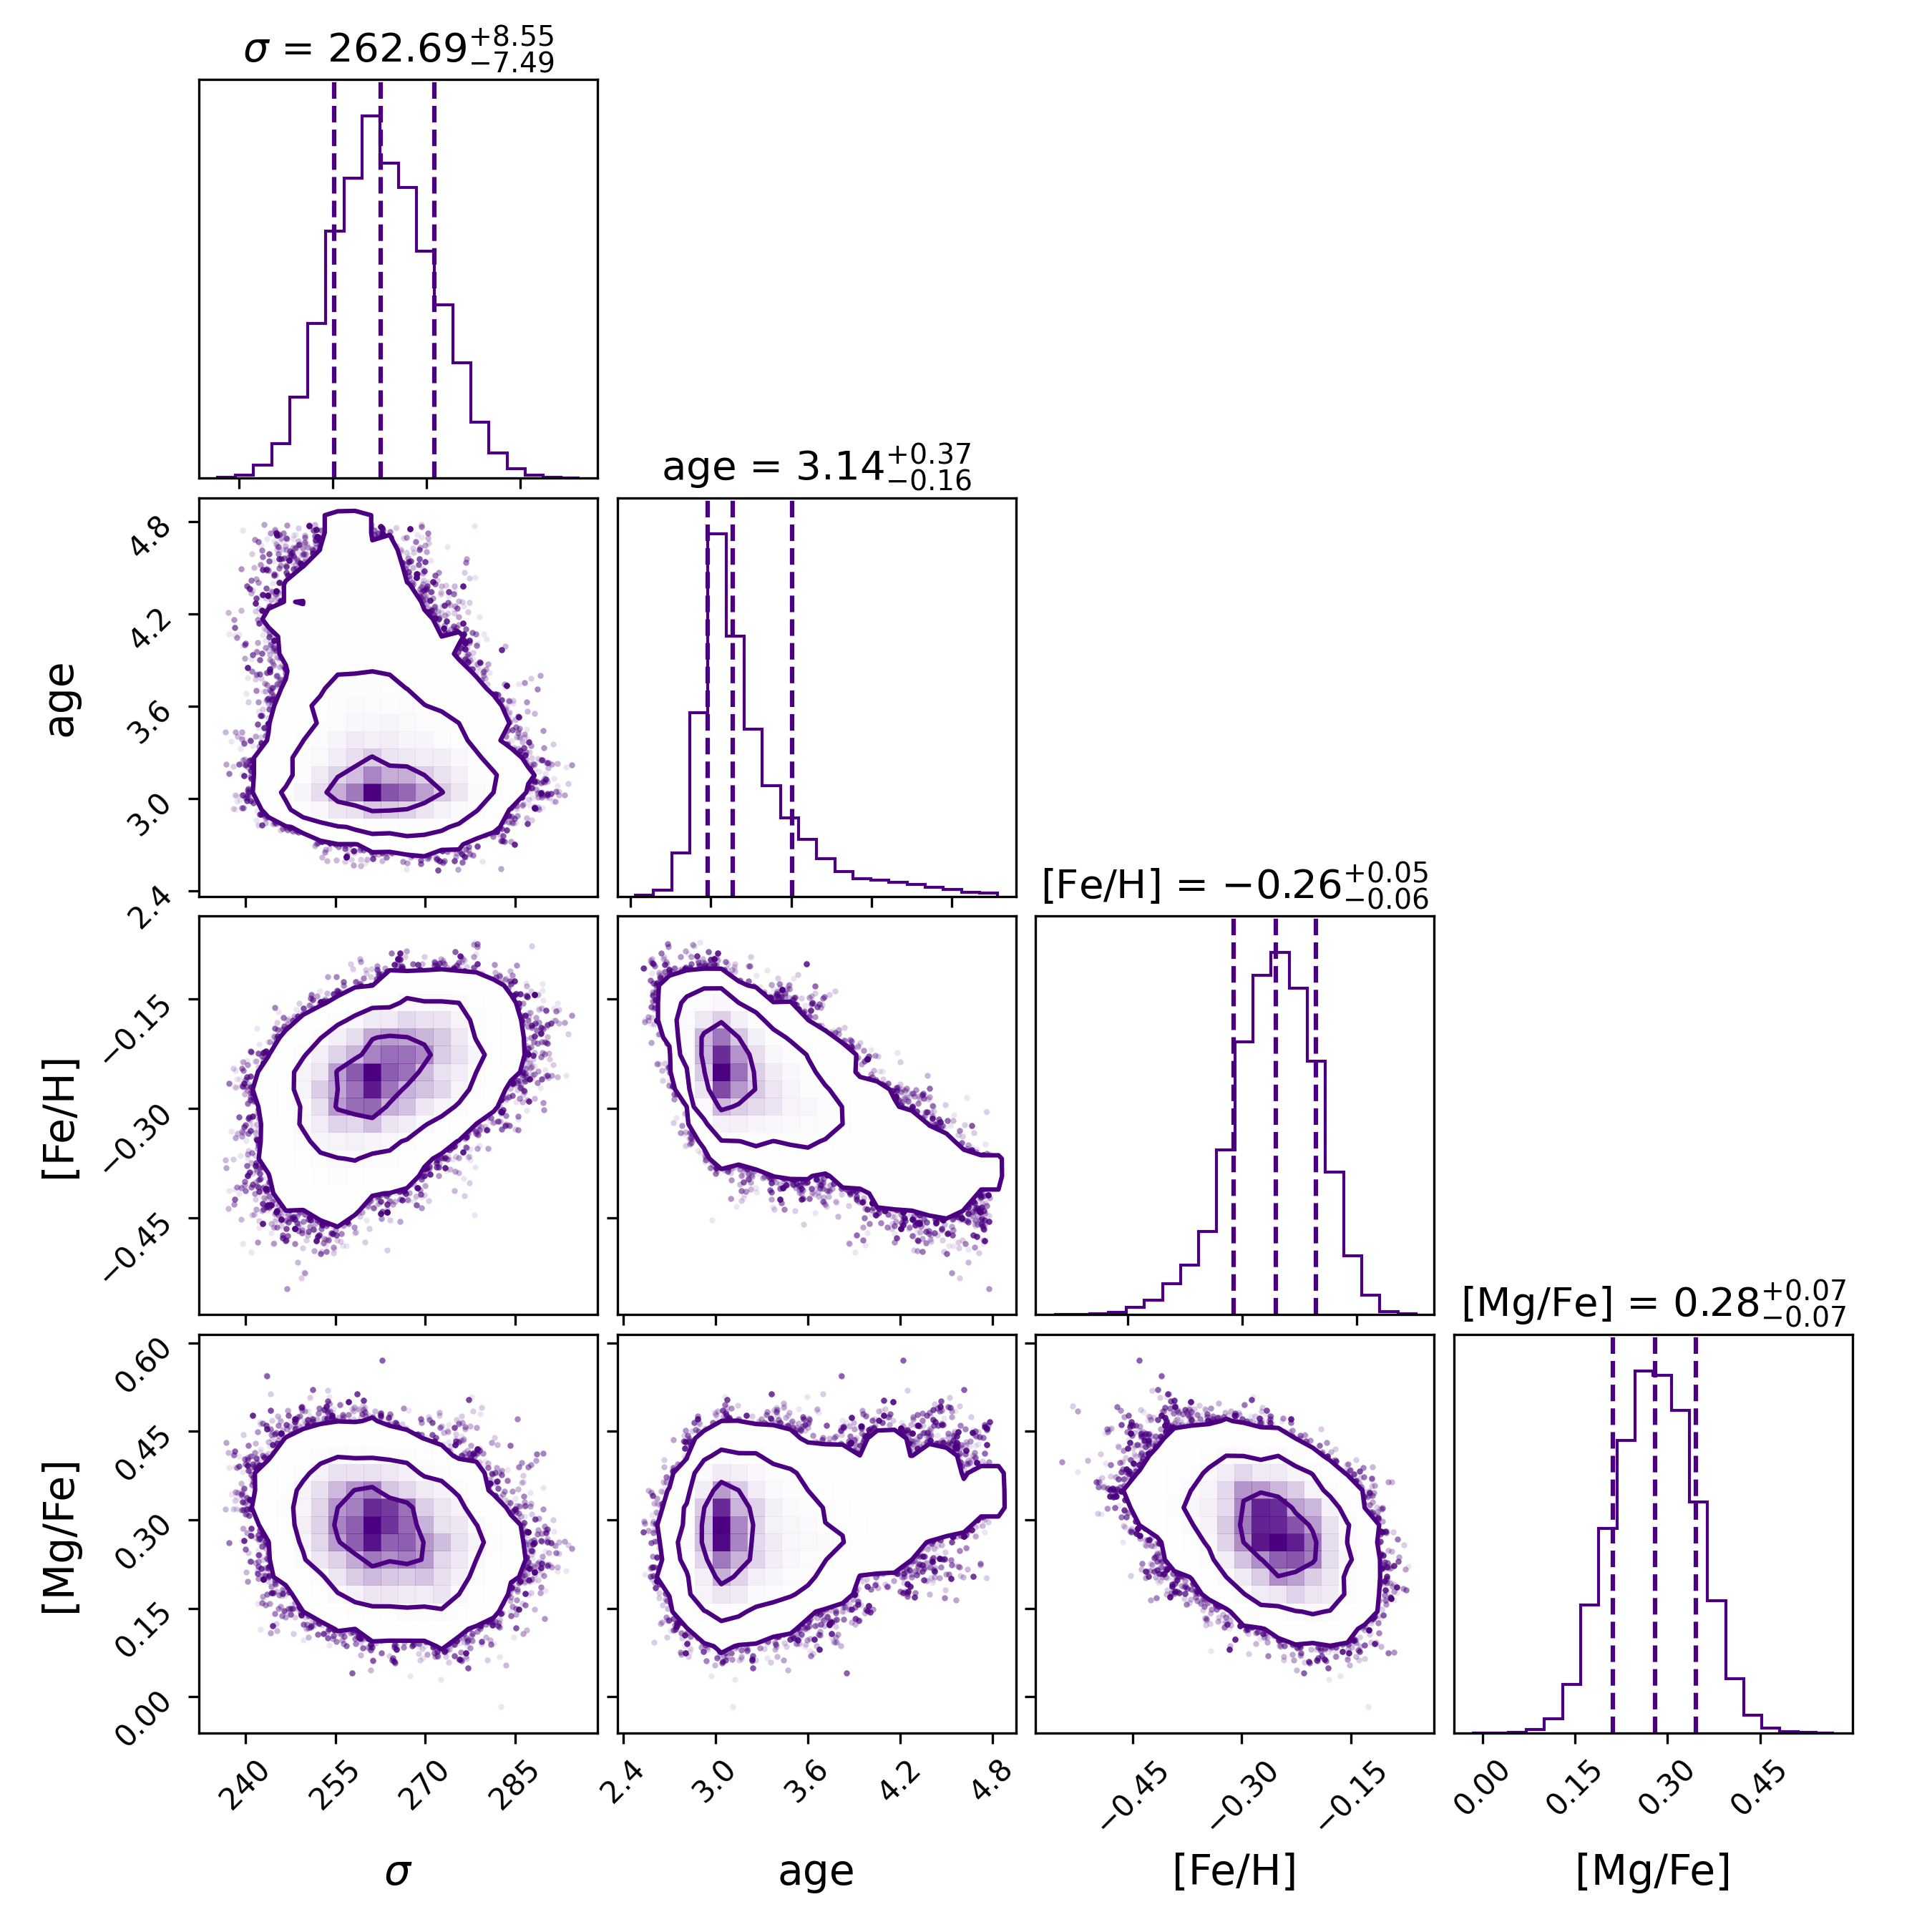
The observed spectra and best-fit models determined by alf’s simple mode, as well as the posterior distributions of the corresponding model parameters without the error correction, are shown in Figure 6 for AGEL1323 and Figure 7 for AGEL0014. We list all measured parameters in Table 2.
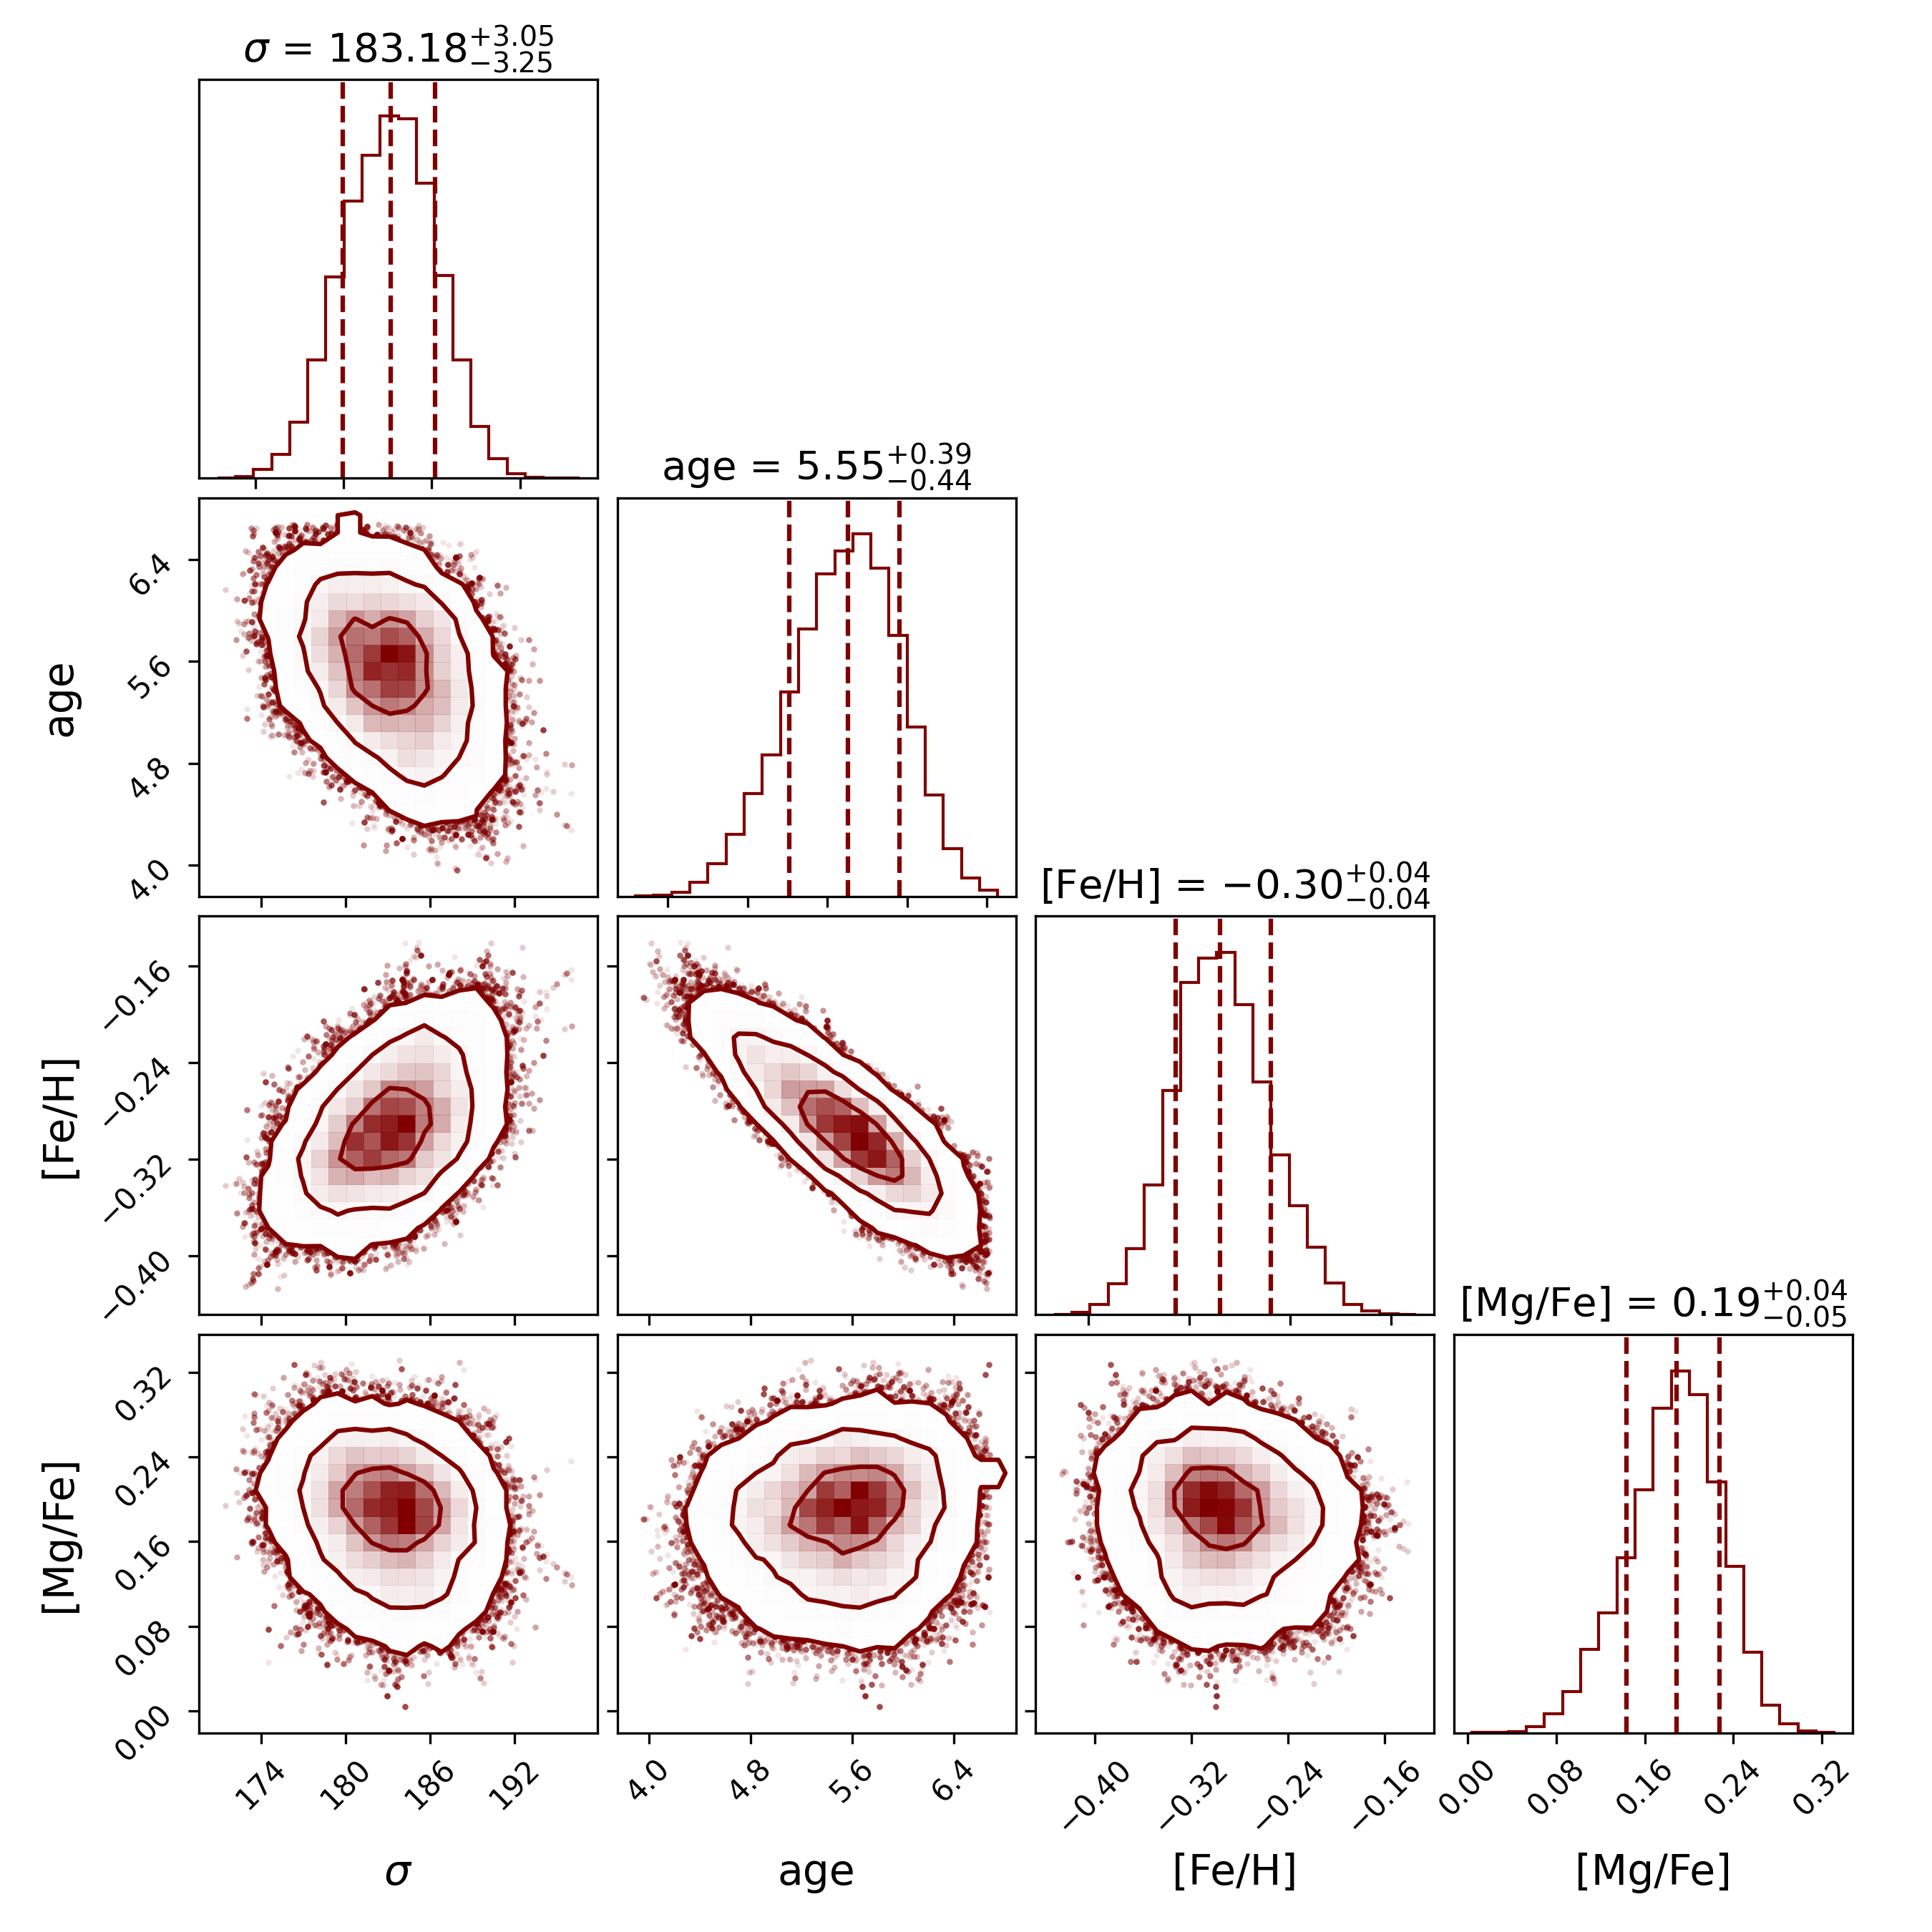
| Row | Quantity | Unit | AGEL1323 | AGEL0014 |
|---|---|---|---|---|
| (1) | ||||
| (2) | km s-1 | |||
| (3) | Gyr | |||
| (4) | [Fe/H]SSP | dex | ||
| (5) | [Mg/Fe]SSP | dex | ||
| (6) | [Mg/H]SSP | dex | ||
| (7) | - | 3.88 | 3.80 |
Note. — Rows show (1) the delensed stellar mass estimates; (2-7) the velocity dispersion, stellar ages, [Fe/H], [Mg/Fe], [Mg/H] and the reduced determined from alf’s simple mode assuming an SSP. The errors here have been corrected for the systematic uncertainties originated from the imperfect models and underestimated noise from the pipelines (See Section 3.3).
4 Results
4.1 Old Ages and Possible Rapid Star Formation
The measured SSP ages of AGEL1323 and AGEL0014 are Gyr and Gyr, respectively, both corresponding to a formation redshift of . Although the SSP assumption may be too simple compared to the true SFHs, the SSP age is still a good indicator of the time when most of stars were formed in a galaxy considering its bias towards the youngest population. In other words, our alf results suggest that the majority of the stellar populations in the two galaxies were formed less than 2 Gyr after the Big Bang, indicating that they must have experienced rapid star formation to reach the stellar masses we see today.
4.2 Chemical Abundances of the Lensed Galaxies
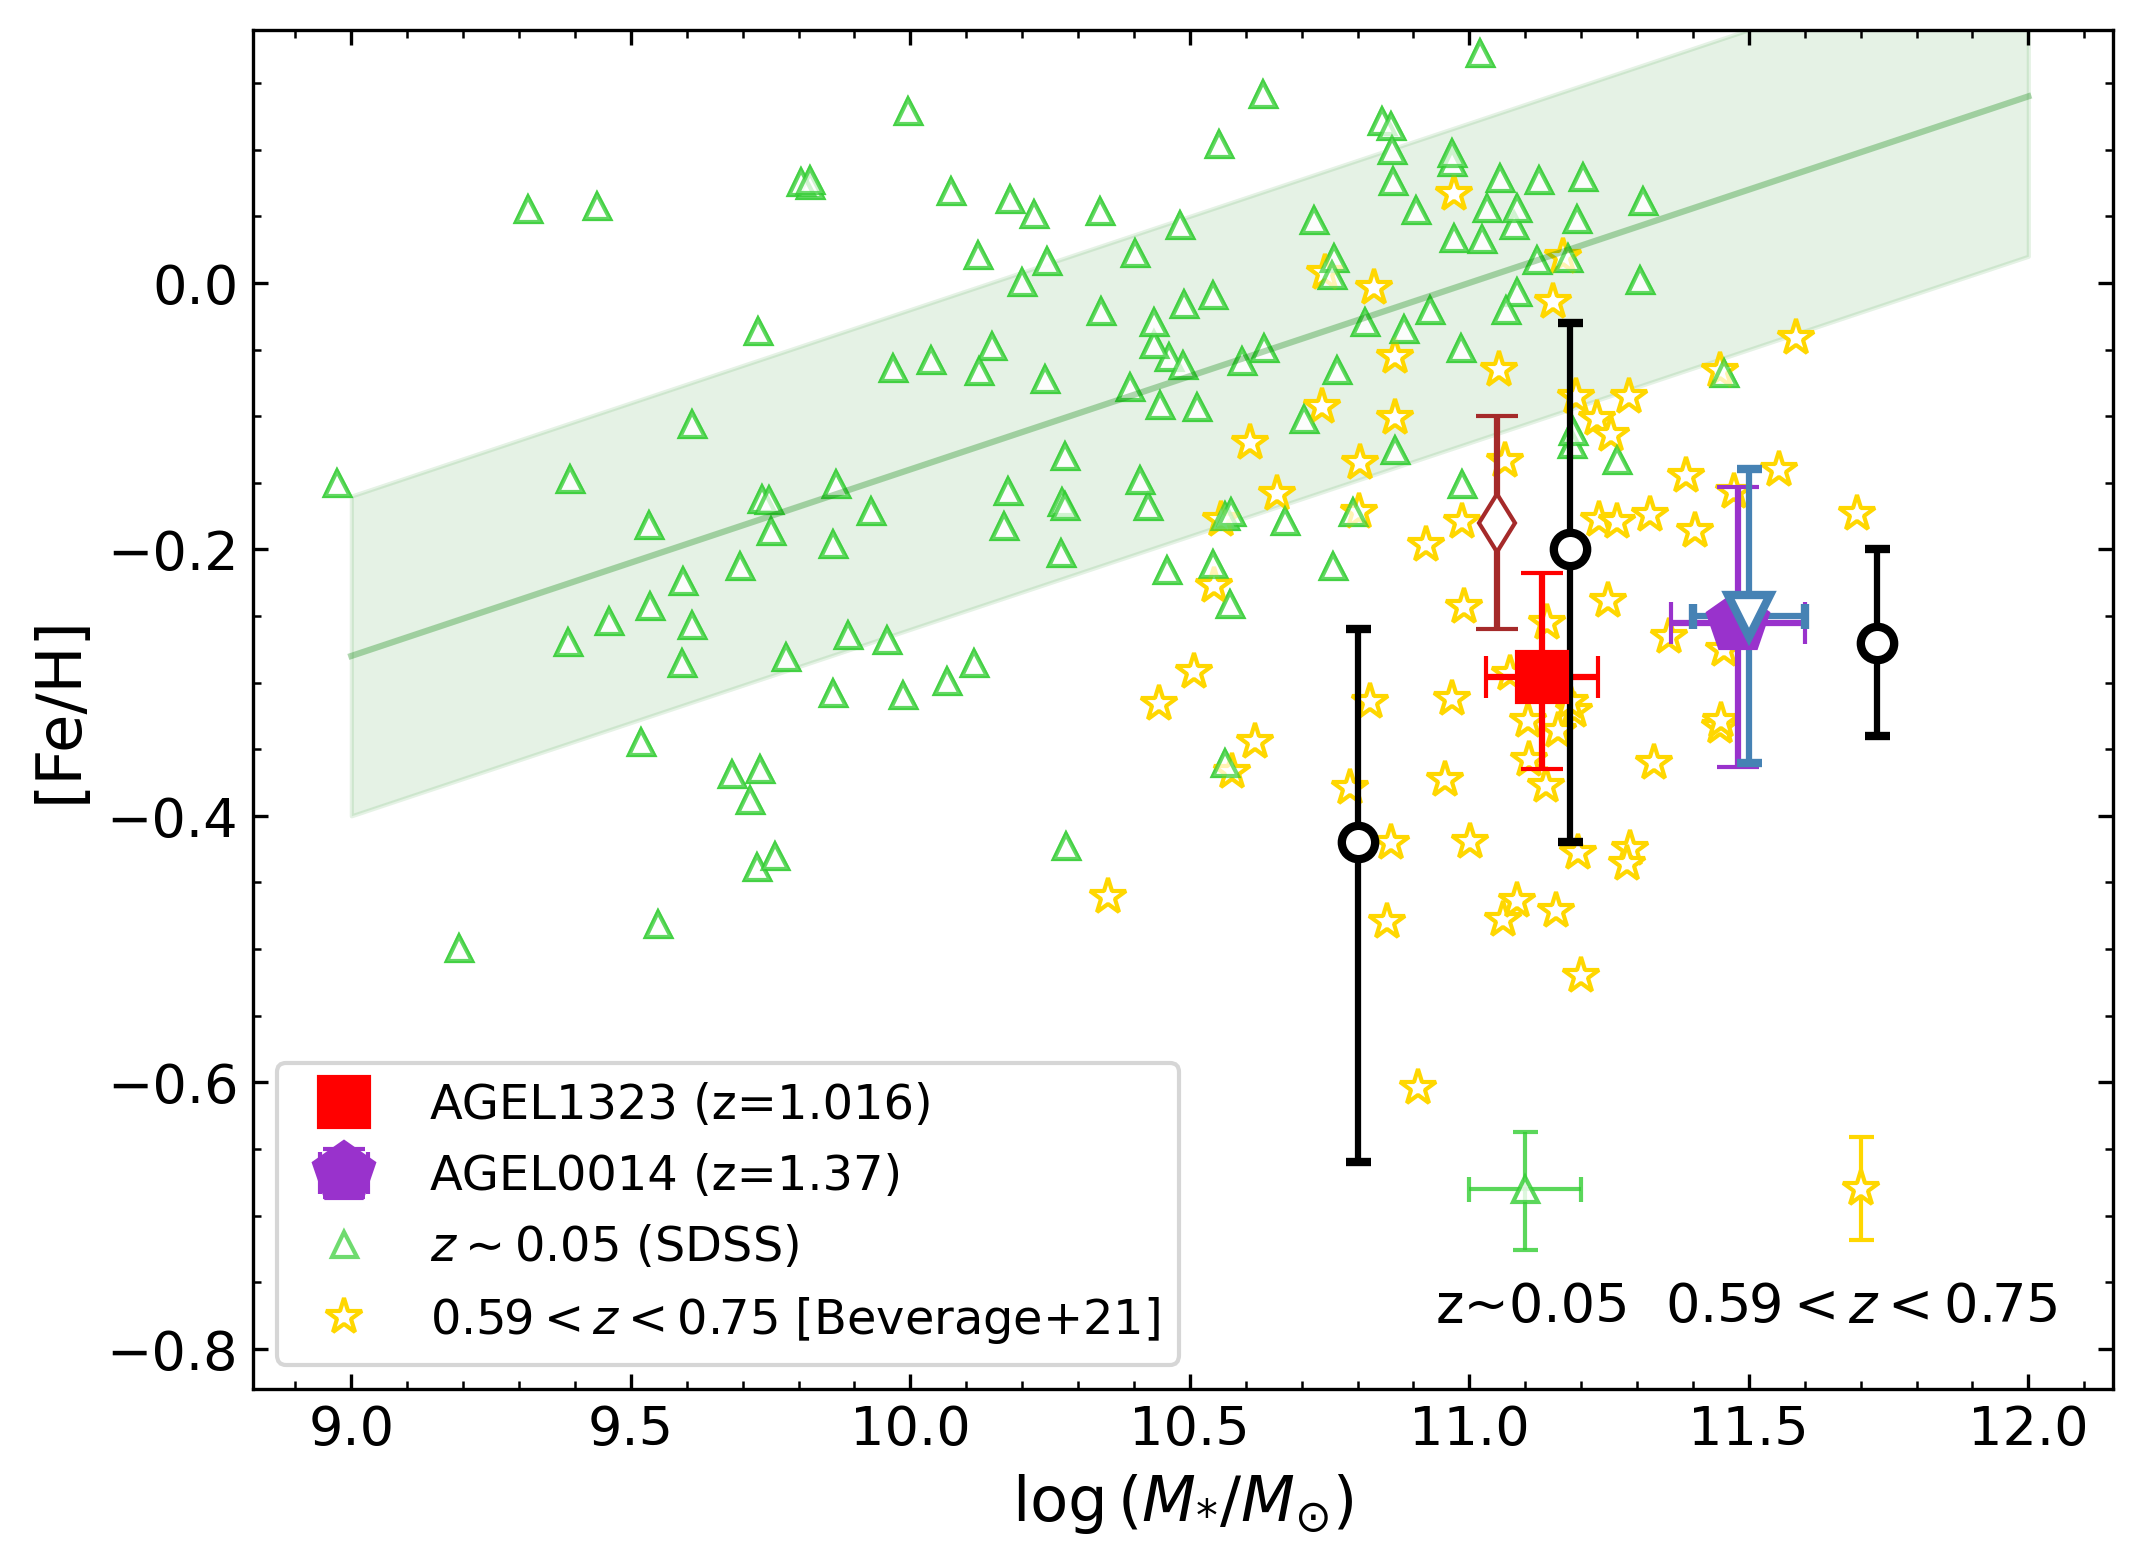
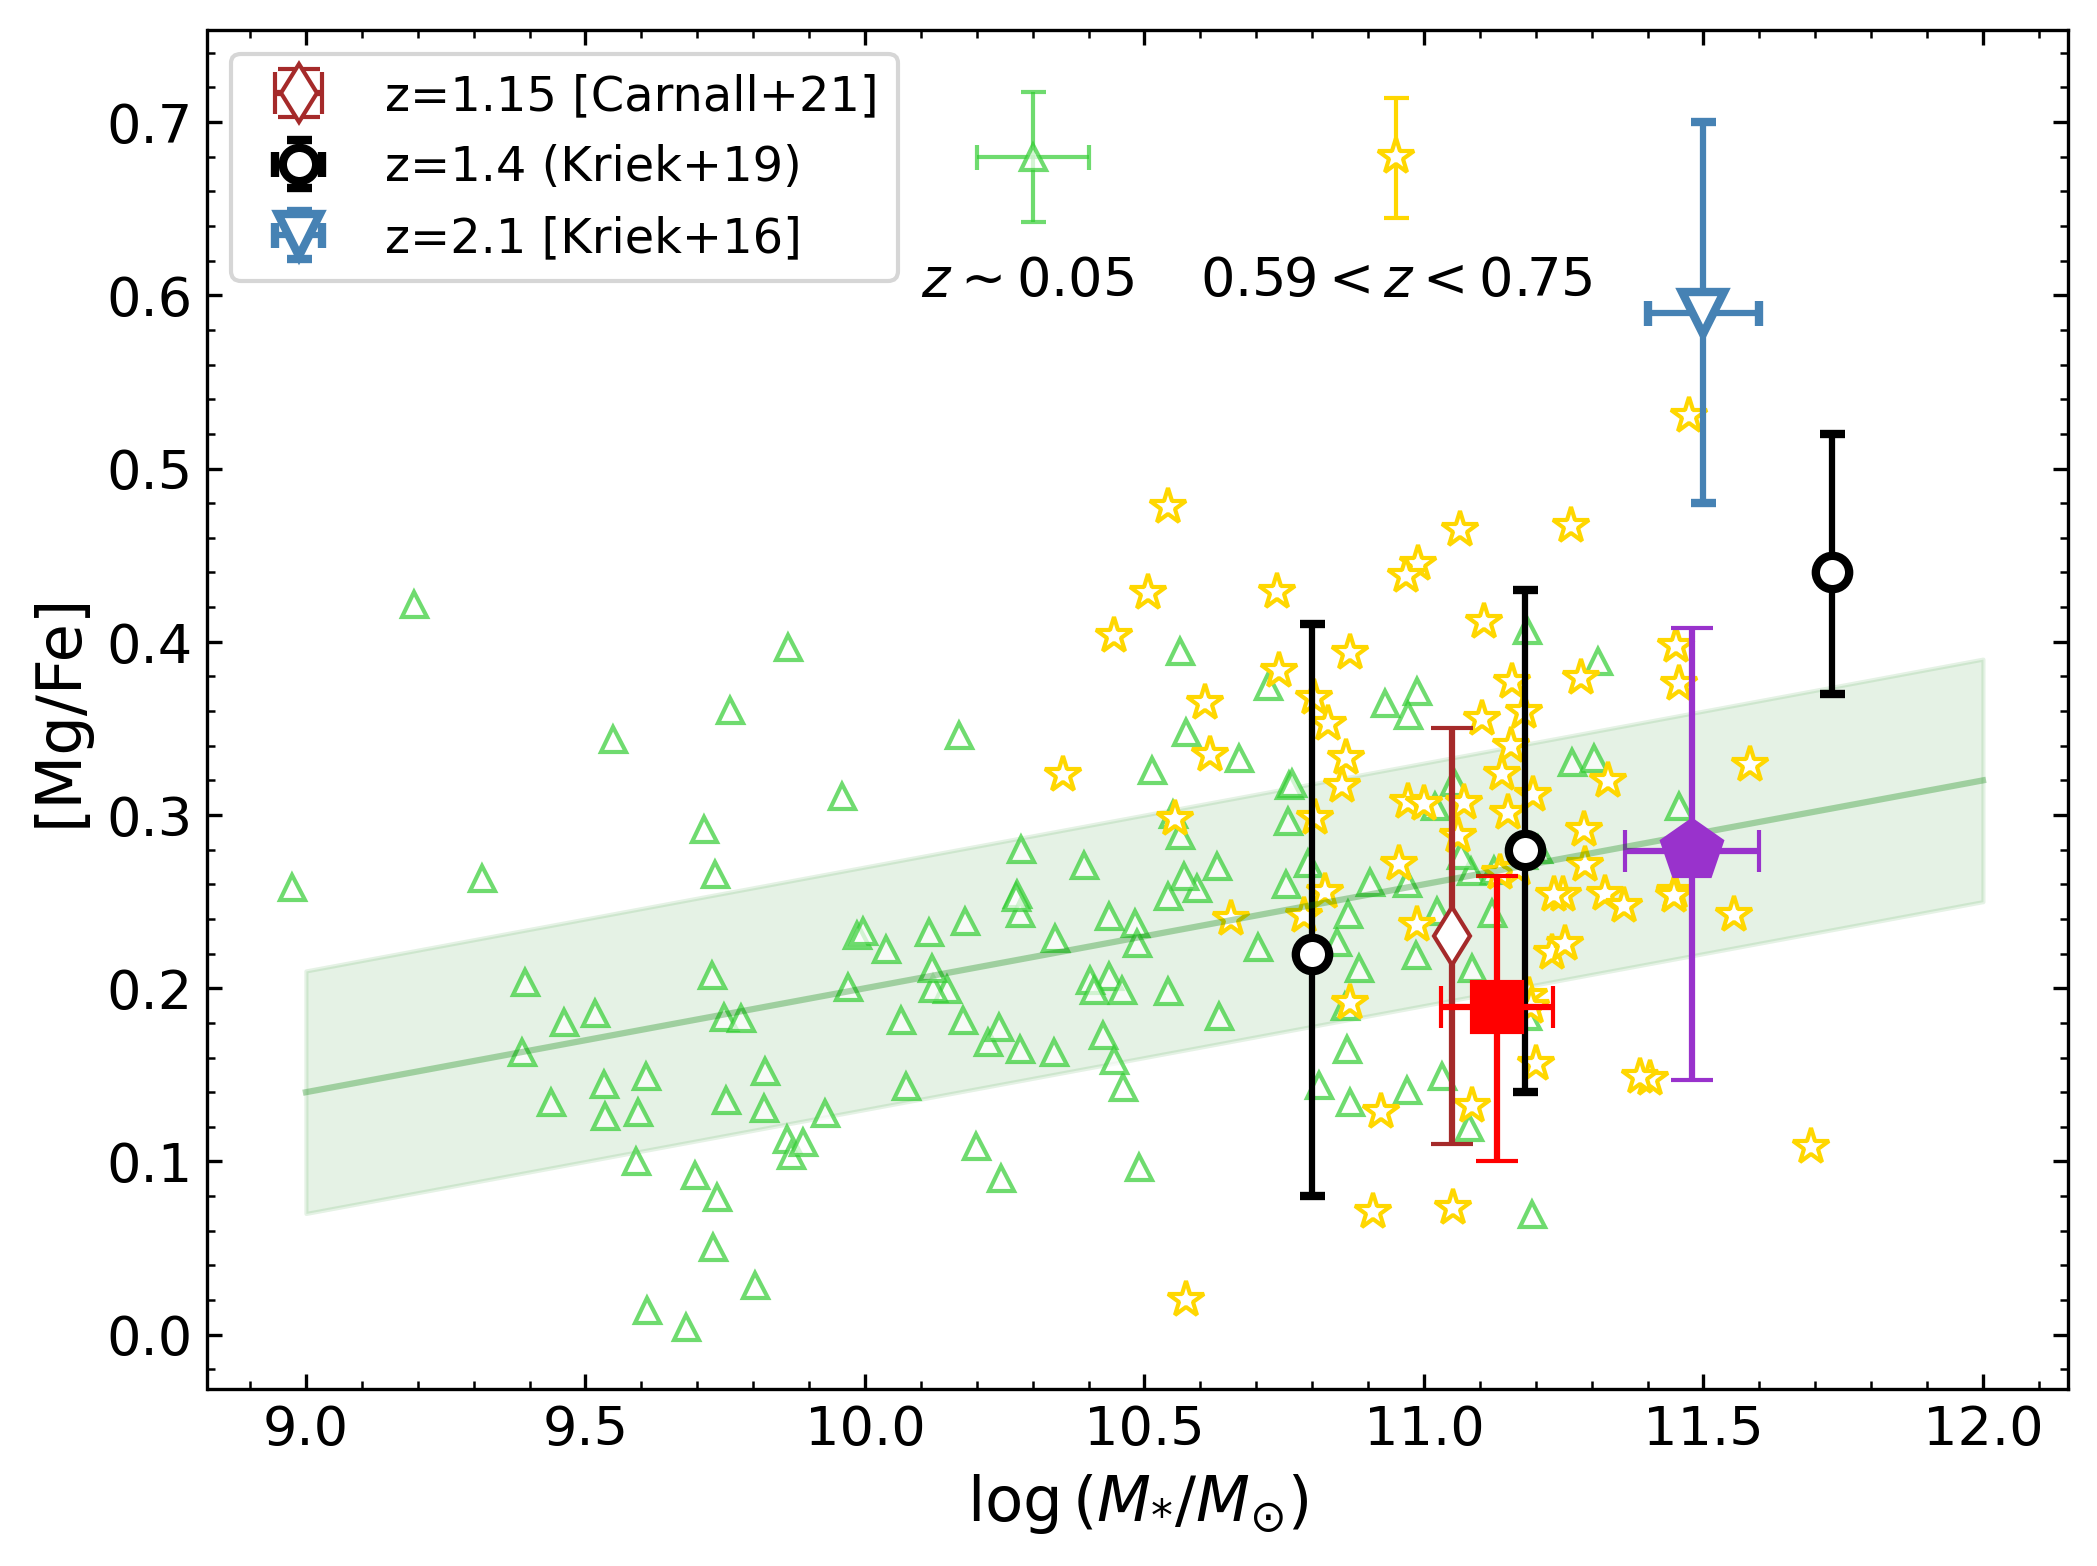
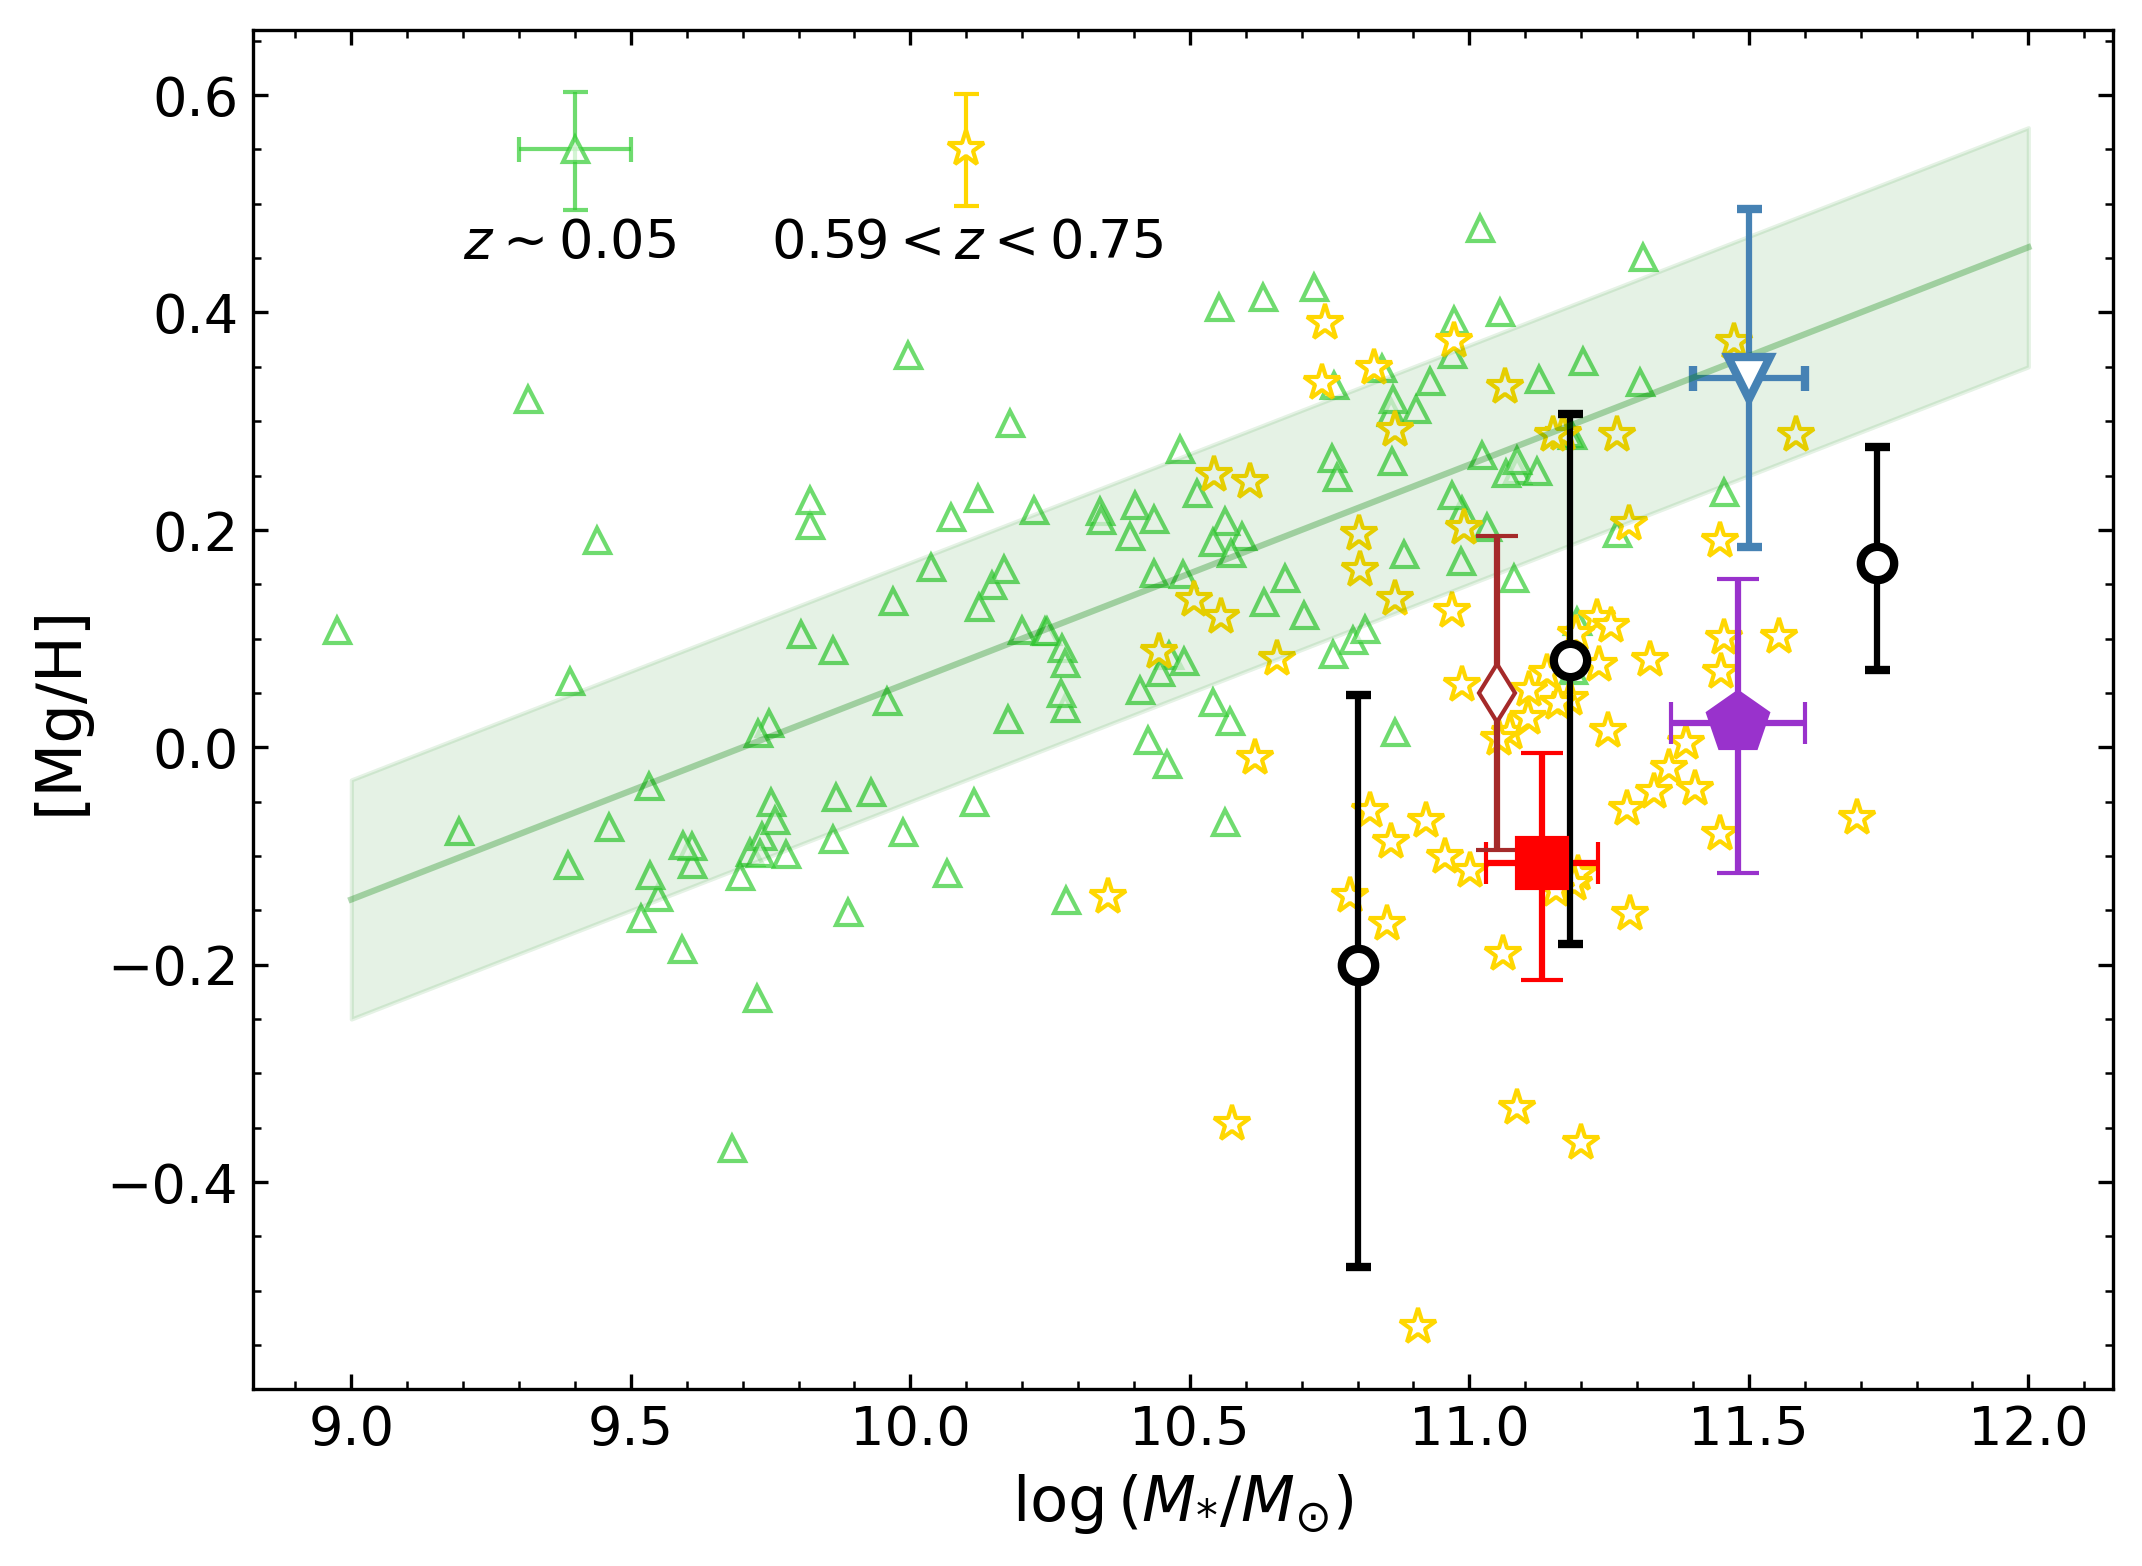
In Figure 8, we show the measured [Fe/H], [Mg/Fe], [Mg/H] of the AGEL galaxies compared with other quiescent galaxies at different redshifts as a function of stellar mass. To minimize the systematic effects between various full-spectrum fitting algorithms based on different model assumptions, we limit our comparison to those derived using the alf simple mode. We compare our results with the LEGA-C sample at (Beverage et al., 2021) and other quiescent galaxies at (Kriek et al., 2016, 2019; Carnall et al., 2022). We also plot a sample of local SDSS galaxies () as reference. The SDSS sample is taken from Leethochawalit et al. (2019), who randomly selected 152 quiescent galaxies from the Gallazzi et al. (2005) sample in the mass range . We re-measured their abundances with alf using the same wavelength range as the spectra of the lensed galaxies for consistency. We excluded the galaxies for which posterior distributions hit the upper or lower limits of the priors, leaving a sample of 123 galaxies. The best-fit MZRs of [Fe/H] [Fe/H], [Mg/Fe], and [Mg/H] for the updated alf measurements of nearby SDSS galaxies are:
| (1) | ||||
where . These relations are shown in Figure 8 to show the evolution in the mass–metallicity relation for the samples at different redshifts.
The lensed galaxies and most of the high- galaxies are more metal-poor than their local counterparts with similar stellar masses, consistent with the redshift evolution of the MZR found by Choi et al. (2014) and Leethochawalit et al. (2019). However, the [Fe/H] of the AGEL galaxies, along with other high- galaxies, appear to be comparable to those of the LEGA-C galaxies. This finding does not necessarily contradict the redshift evolution. Leethochawalit et al. (2019) estimated that the normalization of the MZR decreases 0.04 dex per observed Gyr, which translates to a decrease of 0.2 dex in [Fe/H] from to , and roughly 0.1 dex from to . If we assume the intrinsic scatter of the MZR ( dex at , Leethochawalit et al., 2019) has negligible redshift evolution, the combined effects of the observed uncertainties and intrinsic scatter in [Fe/H] at a given stellar mass can account for why the AGEL galaxies have similar [Fe/H] as LEGA-C galaxies at lower redshifts. A larger sample would be necessary to further investigate the redshift evolution of the MZR at high-.
Jafariyazani et al. (2020) found one quiescent galaxy at to be more metal-rich () than most quiescent galaxies at any redshift. Because this measurement is a significant outlier in metallicity compared to most of the previous studies, which discovered more metal-poor quiescent galaxies at higher redshifts, we do not include the result by Jafariyazani et al. (2020) in our comparison. It is beyond the scope of this work to understand why that galaxy at is significantly more metal-rich than other high- quiescent galaxies.
The measurements of [Mg/Fe] of the AGEL galaxies are comparable to those in the nearby universe at similar masses, although the scatter in the mass–[Mg/Fe] relations of LEGA-C galaxies makes it hard to know if there is any redshift evolution between and . Typically, [Mg/Fe] can be used to probe the SFH. Because iron has a more delayed production timescale than magnesium, Kriek et al. (2016, 2019) used the measured [Mg/Fe] as a proxy for star formation duration when assuming a closed box model, suggesting that high- quiescent galaxies with enhanced [Mg/Fe] should have shorter star formation timescales. Therefore, the redshift evolution in the mass–[Mg/Fe] relation may reveal whether high- galaxies have SFHs distinct from those at lower redshifts.
However, the existing studies of redshift evolution in the mass–[Mg/Fe] relation are quite controversial. Leethochawalit et al. (2019) found that [Mg/Fe] is smaller at higher redshifts at fixed stellar mass for cluster quiescent galaxies below , while Kriek et al. (2019) and Beverage et al. (2021) did not detect any significant redshift evolution for LEGA-C galaxies at and three quiescent galaxies at . Given the current sample size, the mass–[Mg/Fe] relation appears to be similar at local and and thus in favor of what Beverage et al. (2021) and Kriek et al. (2019) found, but again a larger sample would be needed for stronger constraints.
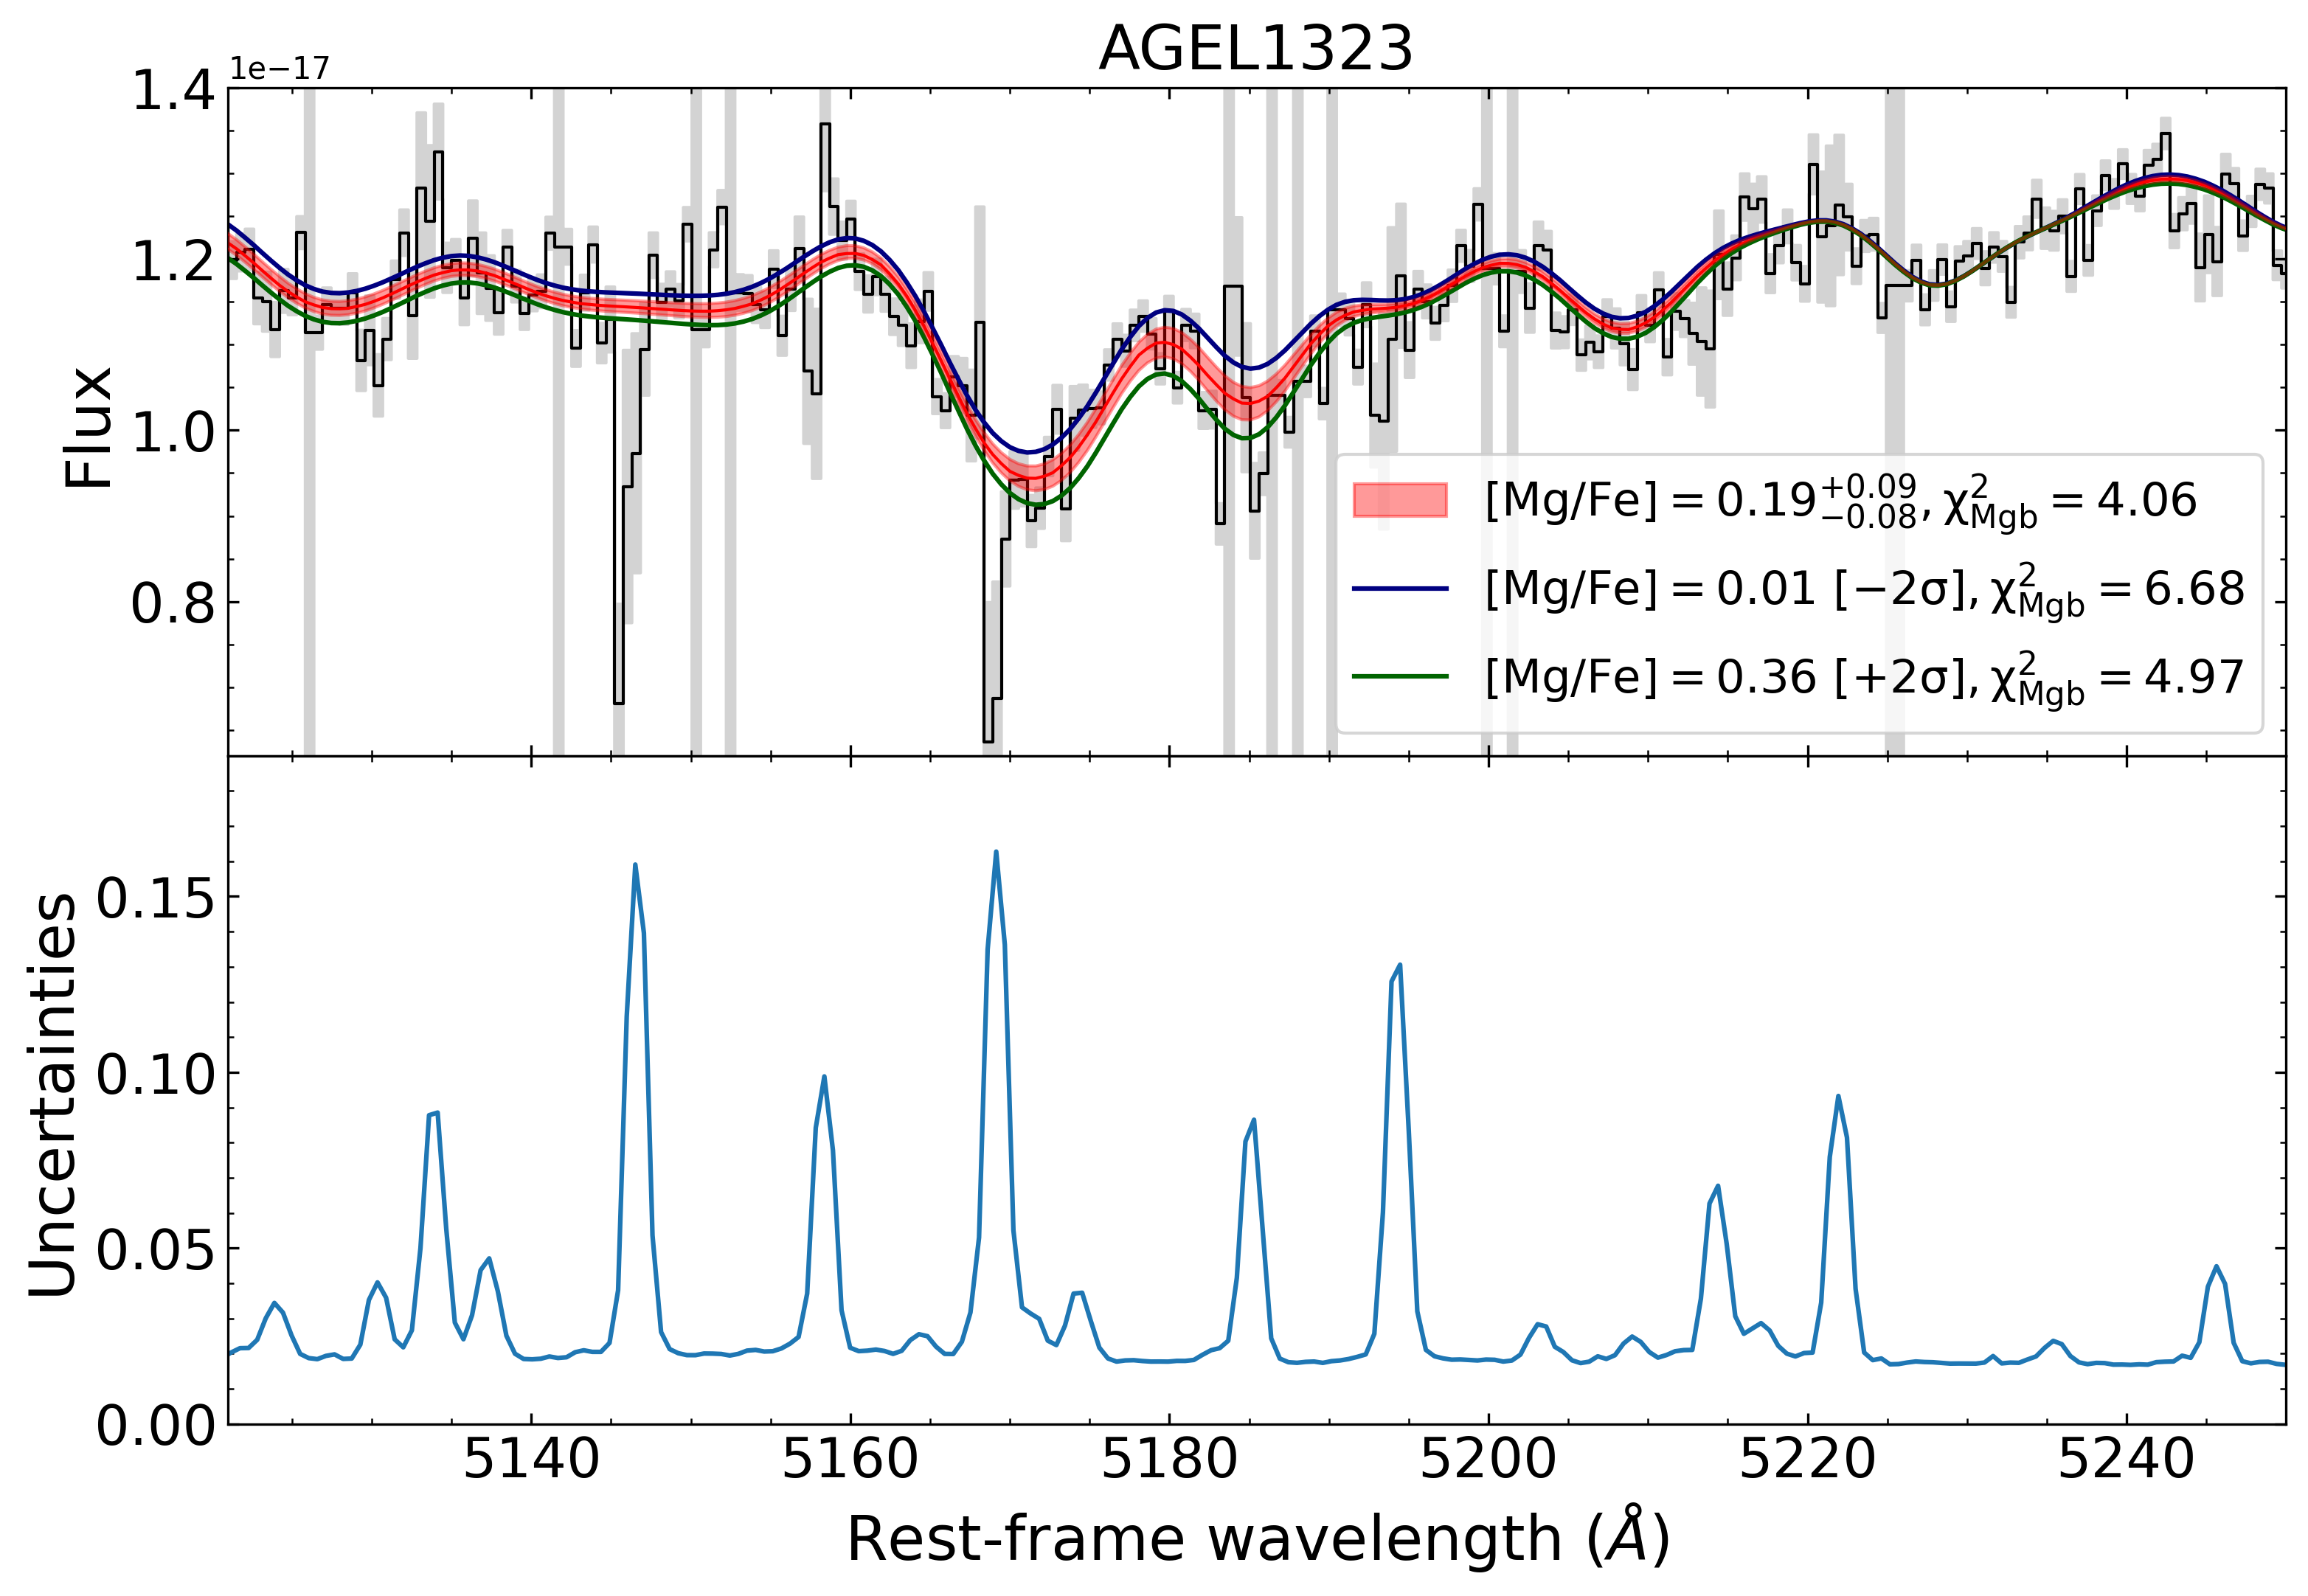
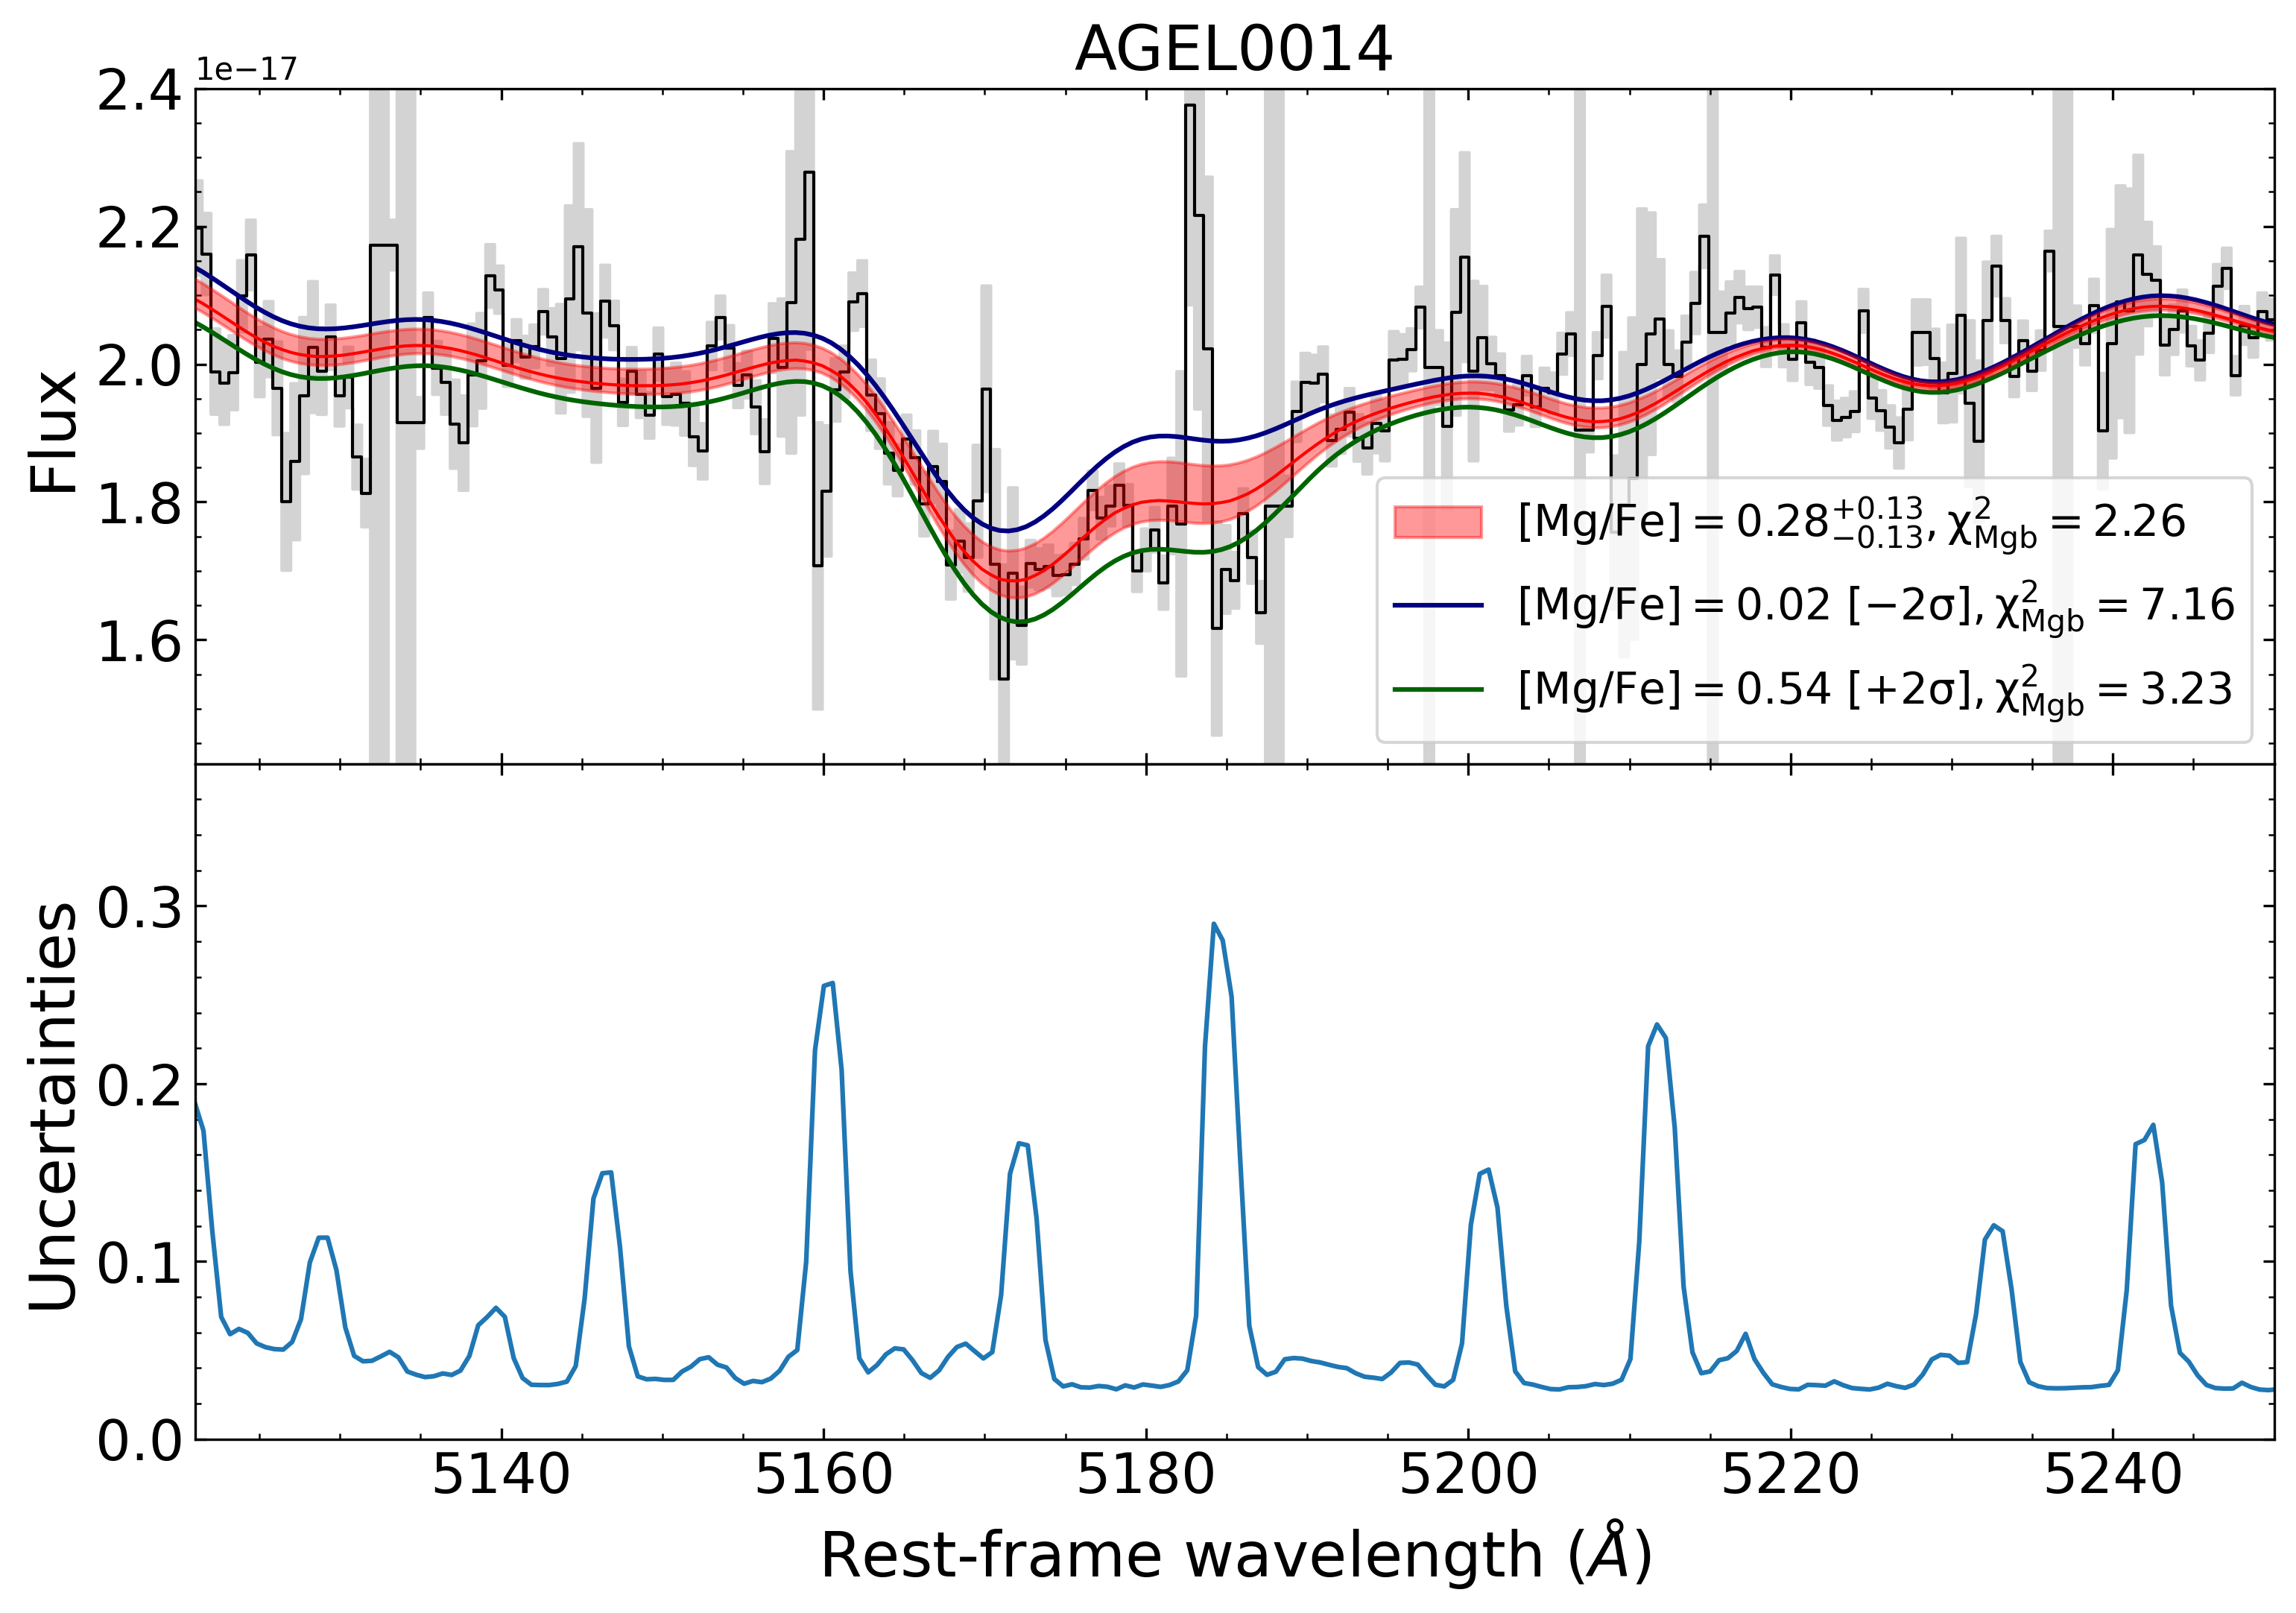
The absence of significant -enhancement of the lensed galaxies is unexpected because we expect old, quiescent galaxies to have enhanced [/Fe] ratios. The unexpected result inspired us to consider carefully whether the measured [Mg/Fe] from alf might be underestimated due to imperfect flux calibrations. As a full-spectrum fitting algorithm, alf adopts the information from the whole spectrum, including the continuum and metal absorption lines, to constrain the Mg abundance. Conroy et al. (2018) indicated that the continuum between 4000 Å and 5300 Å is also sensitive to Mg abundance, for which any small mismatch between the continuum level of the model spectrum and that of the observed data due to imperfect flux calibrations over a wider wavelength range may bias the measurement of [Mg/Fe]. For each galaxy, we generated alf model spectra with different [Mg/Fe] but fixed all other parameters to the best-fit values returned by alf.
Figure 9 shows model spectra with [Mg/Fe] varying within of the best-fit value compared to the observed data near the Mg b triplet region for each galaxy. We chose the Mg b triplet because it is the most prominent Mg feature in the observed wavelength range. These narrow atomic features are less affected by the flux calibrations than wider Mg-bearing molecular bands nearby. We evaluate the reduced near the Mg b for model spectra with higher or lower [Mg/Fe] than the best-fit value and compare them with that of the best-fit model. As shown in Figure 9, for both lensed galaxies, neither a more -rich nor a more -poor model can better describe Mg b triplet than the best-fit model does, which validates our measured [Mg/Fe] obtained from the full-spectrum fitting.
We now scrutinize the expectation that [Mg/Fe] should be enhanced in old, quiescent galaxies. In fact, the shape of SFH, merger history, the delayed explosion time of Type Ia supernovae and the presence of outflows/inflows can all affect the final [Mg/Fe] at the time when the galaxies quenched. For this reason, a galaxy that rapidly built its mass (e.g., over Gyr) does not necessarily have to be very -enhanced. We have seen such evidence in the Local Group. de los Reyes et al. (2022, among others) found that Sculptor, a dwarf spheroidal galaxy in the Local Group, finished forming stars within 0.9 Gyr, but has only a moderate -enhancement of , comparable to [Mg/Fe] of our lensed galaxies.
In addition, [Mg/Fe] of the lensed galaxies appears to be positively correlated with stellar mass, consistent with the findings of Kriek et al. (2019). We believe future James Webb Space Telescope (JWST) observations would be able to yield more reliable measurements of [Mg/Fe] in order to constrain the mass–[Mg/Fe] relation in the high- universe (Nanayakkara et al., 2022).
With the new measurements of our lensed galaxies, a mass dependence of [Mg/H] emerges for quiescent galaxies at , suggesting that [Mg/H] is likely to be correlated with stellar mass in the high- universe. The AGEL galaxies and other high- galaxies appear to have lower [Mg/H] compared to local quiescent galaxies. This redshift evolution in the mass–[Mg/H] relation is contradictory to the results of Leethochawalit et al. (2019), who argued for universal relations for quiescent galaxies at . While the discrepancy may result from different full-spectrum fitting algorithms used to determine [Mg/H], it is more likely that galaxies observed at , especially those that formed at , may have experienced qualitatively different physical processes shaping the final [Mg/H]. We discuss one of the possible origins in Section 5.2.
5 Discussion
5.1 Dependence of Abundances on Galaxy Formation Time
As many literature studies have reported the evolution of the MZR with observed redshift for quiescent galaxies (e.g., Gallazzi et al., 2014; Choi et al., 2014; Leethochawalit et al., 2019), it is natural to ask whether such evolution is driven by galaxies’ observed redshifts (age of the universe when galaxies were observed) or formation redshifts (age of the universe when galaxies formed). In other words, should we expect galaxies located at similar redshifts or those forming stars at similar time to have similar metal abundances? Leethochawalit et al. (2019) studied the evolution of the MZR below and argued that evolution of metallicity is more fundamental with formation redshift when mass dependence is removed. Following Leethochawalit et al. (2019), we investigate the dependence of abundances on galaxy formation time here.
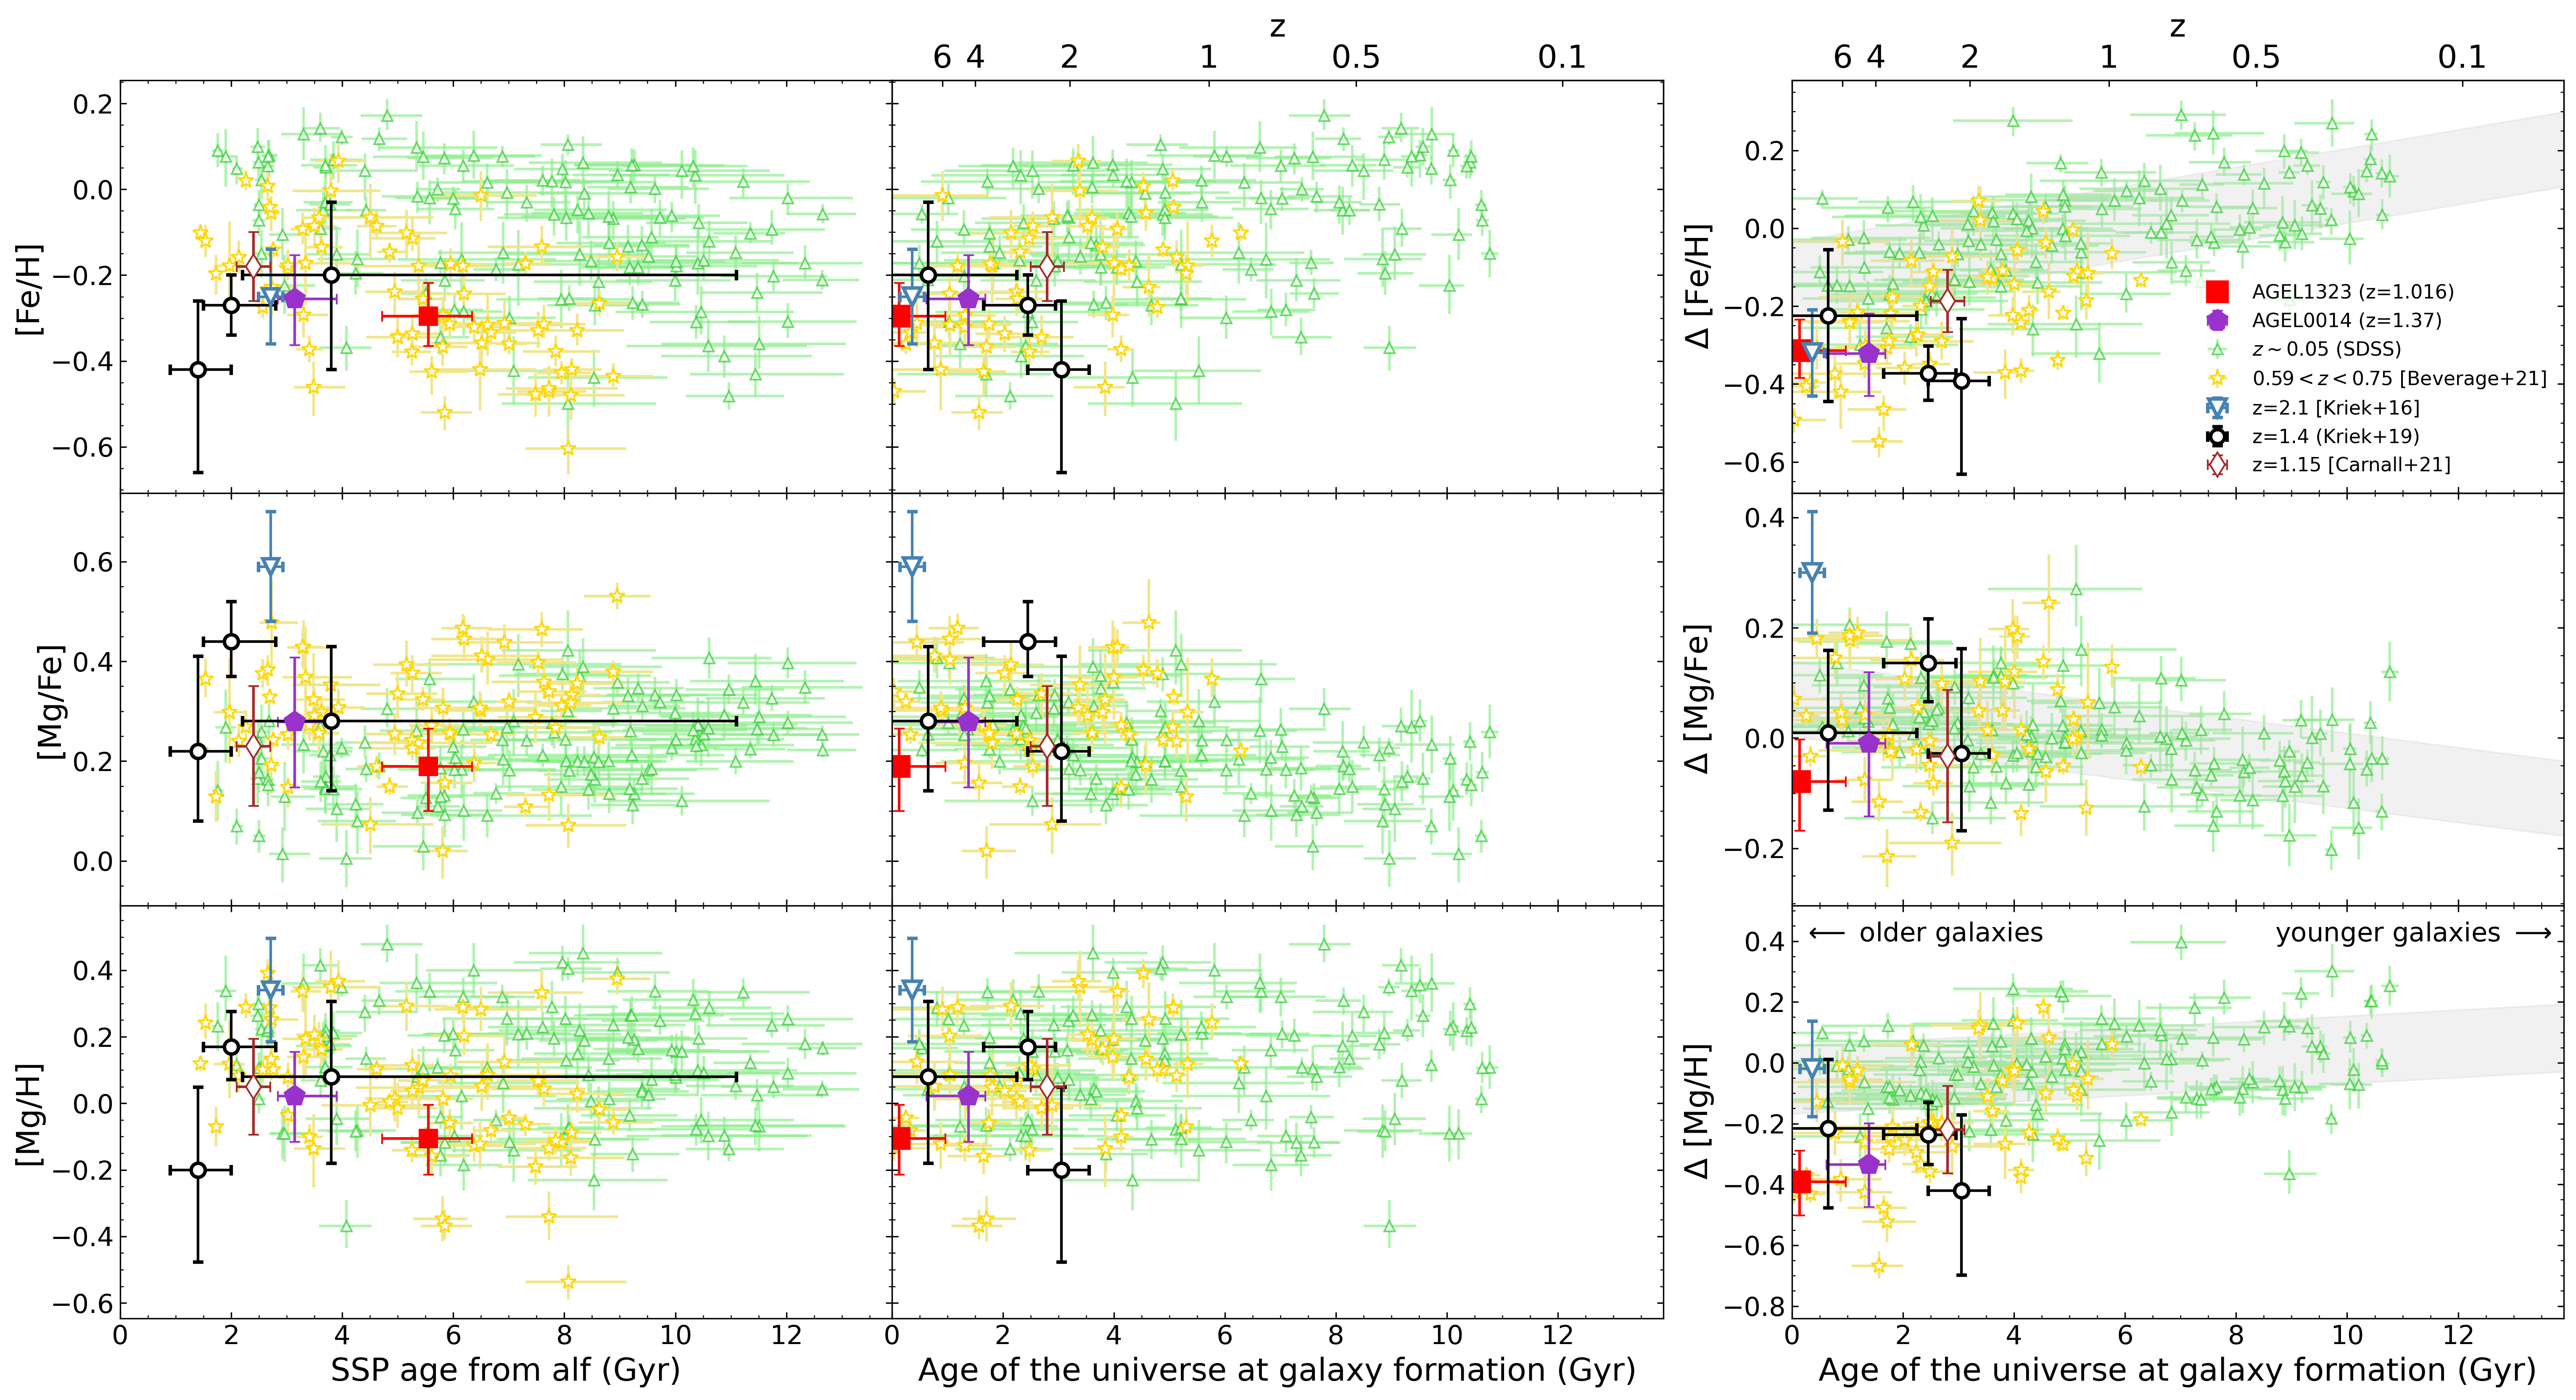
We first examine the measured [Fe/H], [Mg/Fe] and [Mg/H] as a function of SSP age obtained from alf’s simple mode for quiescent galaxies at various redshifts. As shown in Figure 10, [Fe/H] of high- quiescent galaxies are distinct from those of local SDSS quiescent galaxies at a given SSP age, while such significant difference is not seen in [Mg/H]. At a certain SSP age, high- quiescent galaxies are relatively more metal-poor and more -enhanced compared to local counterparts. This scenario is expected as high- galaxies have less time for Type Ia supernova explosion for iron production. The lack of prominent [Mg/H] separation between local and high- populations can be explained by the short recycling timescale of magnesium. The distributions of [Mg/Fe] for high-z and local populations are slightly different, as the production of iron and magnesium both affect this trend.
If high- galaxies evolve passively and remain quenched to , their stellar abundances would not change significantly due to the absence of new star formation. Because high- quiescent galaxies are believed to be the progenitors of local quiescent galaxies, we expect the high- populations to overlap with the local counterparts in age–abundance plots once the age differences are corrected. Here, we approach this problem in a reverse way. If we ignore the small metallicity change as galaxies evolve passively, we can correct the age differences between the high- and local galaxies by tracing back the age of the universe at galaxy formation, which is the difference between the age of the universe at the observed redshift and the measured SSP age for each galaxy. As can be seen in the second column of Figure 10, the differences of [Fe/H] and [Mg/Fe] between high- galaxies and local galaxies are attenuated when we compare them as a function of galaxy formation time rather than SSP age.
We further remove the first-order mass dependence of abundances by subtracting the best-fit MZRs at (Equation 1) from the observed abundances. The deviations in the right panels of Figure 10 demonstrate how galaxy formation time affects the final abundances. At , the evolution in [Fe/H] and [Mg/Fe] with formation time is dex per Gyr and dex per Gyr, respectively. On the contrary, we do not detect a significant dependence of [Mg/H] on galaxy formation time for local galaxies, with the best-fit slope of dex per formation Gyr. The weak evolution of [Mg/H] with formation age is in agreement with the short recycling timescale of magnesium. As can be seen in Figure 10, the LEGA-C and high- galaxies exhibit similar evolution of abundances when the dependence on mass and observed redshift is removed. The tighter relations in [Fe/H] and [Mg/Fe] imply that at a fixed stellar mass, the galaxy formation time since the Big Bang plays more fundamentally determines stellar metallicity and -enhancement than the observed redshift.
Still, [Fe/H] and [Mg/H] of the LEGA-C galaxies and high- galaxies are systematically lower than local galaxies when the dependence on mass and age is removed, although the differences are relatively small. The discrepancy for high- galaxies implies that additional mechanisms are needed to explain the small offset.
One possibility is that not all high- quiescent galaxies evolve passively. There is a chance that some of them may rejuvenate and form younger stars in a later epoch. Recent studies have suggested that accretion of satellite galaxies is important to explain the size growth of massive elliptical galaxies across cosmic time (e.g., Oser et al., 2010; Greene et al., 2013; Oyarzún et al., 2019, and references therein). Such mergers may trigger star formation in originally quenched galaxies. If some of these high- quiescent galaxies were at the temporary quenching phase between two starbursts, they would have a higher [Fe/H] and a younger formation time when reaching . We believe this scenario may be necessary to explain the redshift evolution of the MZR in Figure 8. As high- quiescent galaxies evolve to passively, they would become less massive and slightly more metal-poor. It appears that the most massive galaxies cannot move to the local sequence unless they can get metal-enriched in the later epoch, which would require either new star formation or mergers with much more metal-rich systems. The latter is less likely to happen because massive galaxies tend to accrete more metal-poor satellite galaxies (Oser et al., 2010).
With the few available measurements at , we conclude that galaxy formation time would still be the key factor determining the metal abundances in quiescent galaxies below . At the same time, it is possible that some of the high- galaxies may re-start forming stars at a later epoch. A larger sample of quiescent galaxies at would be necessary to confirm this possible rejuvenation in star formation.
5.2 Enhanced outflows during the star formation
To understand why AGEL1323 and AGEL0014 quenched so early in the universe, we use the measured [Mg/H] to constrain the outflows of the lensed galaxies during their star formation. Leethochawalit et al. (2019) presented a simple analytic chemical evolution model for quiescent galaxies that connects instantaneously recycled metals to the time-averaged mass-loading factor, based on the work of Lu et al. (2015). Readers are encouraged to read Leethochawalit et al. (2019) for the details of the model. To summarize, the mass-loading factor here is defined as the ratio of the mass outflow rate to the SFR, averaged over the entire SFH. They also assume that:
-
1.
The interstellar medium (ISM) where star formation occurs is perfectly mixed.
-
2.
Metals are instantaneously recycled.
-
3.
Outflows and inflows are permitted, but only the outflows can significantly affect the total metal budget in the ISM.
Because magnesium is the product of core-collapse supernovae of short-lived stars, it can be approximated as an instantaneously recycled element and thus fit into the model above. If assuming that no or minimal amount of gas is left in the quiescent galaxies, the abundance of an instantaneously recycled element would be
| (2) |
where is the supernova yield and is the return mass fraction defined to be the fraction of the mass of a stellar generation that returns to the interstellar medium from short-lived massive stars and stellar winds. can be substituted as the absolute Mg abundance of quiescent galaxies. Following Leethochawalit et al. (2019), we adopted the solar abundance of Mg from Asplund et al. (2009) and the yield as three times the solar Mg abundance (Nomoto et al., 2006) to calculate the absolute Mg abundance. The return fraction is set to (Lu et al., 2015) for all galaxies.
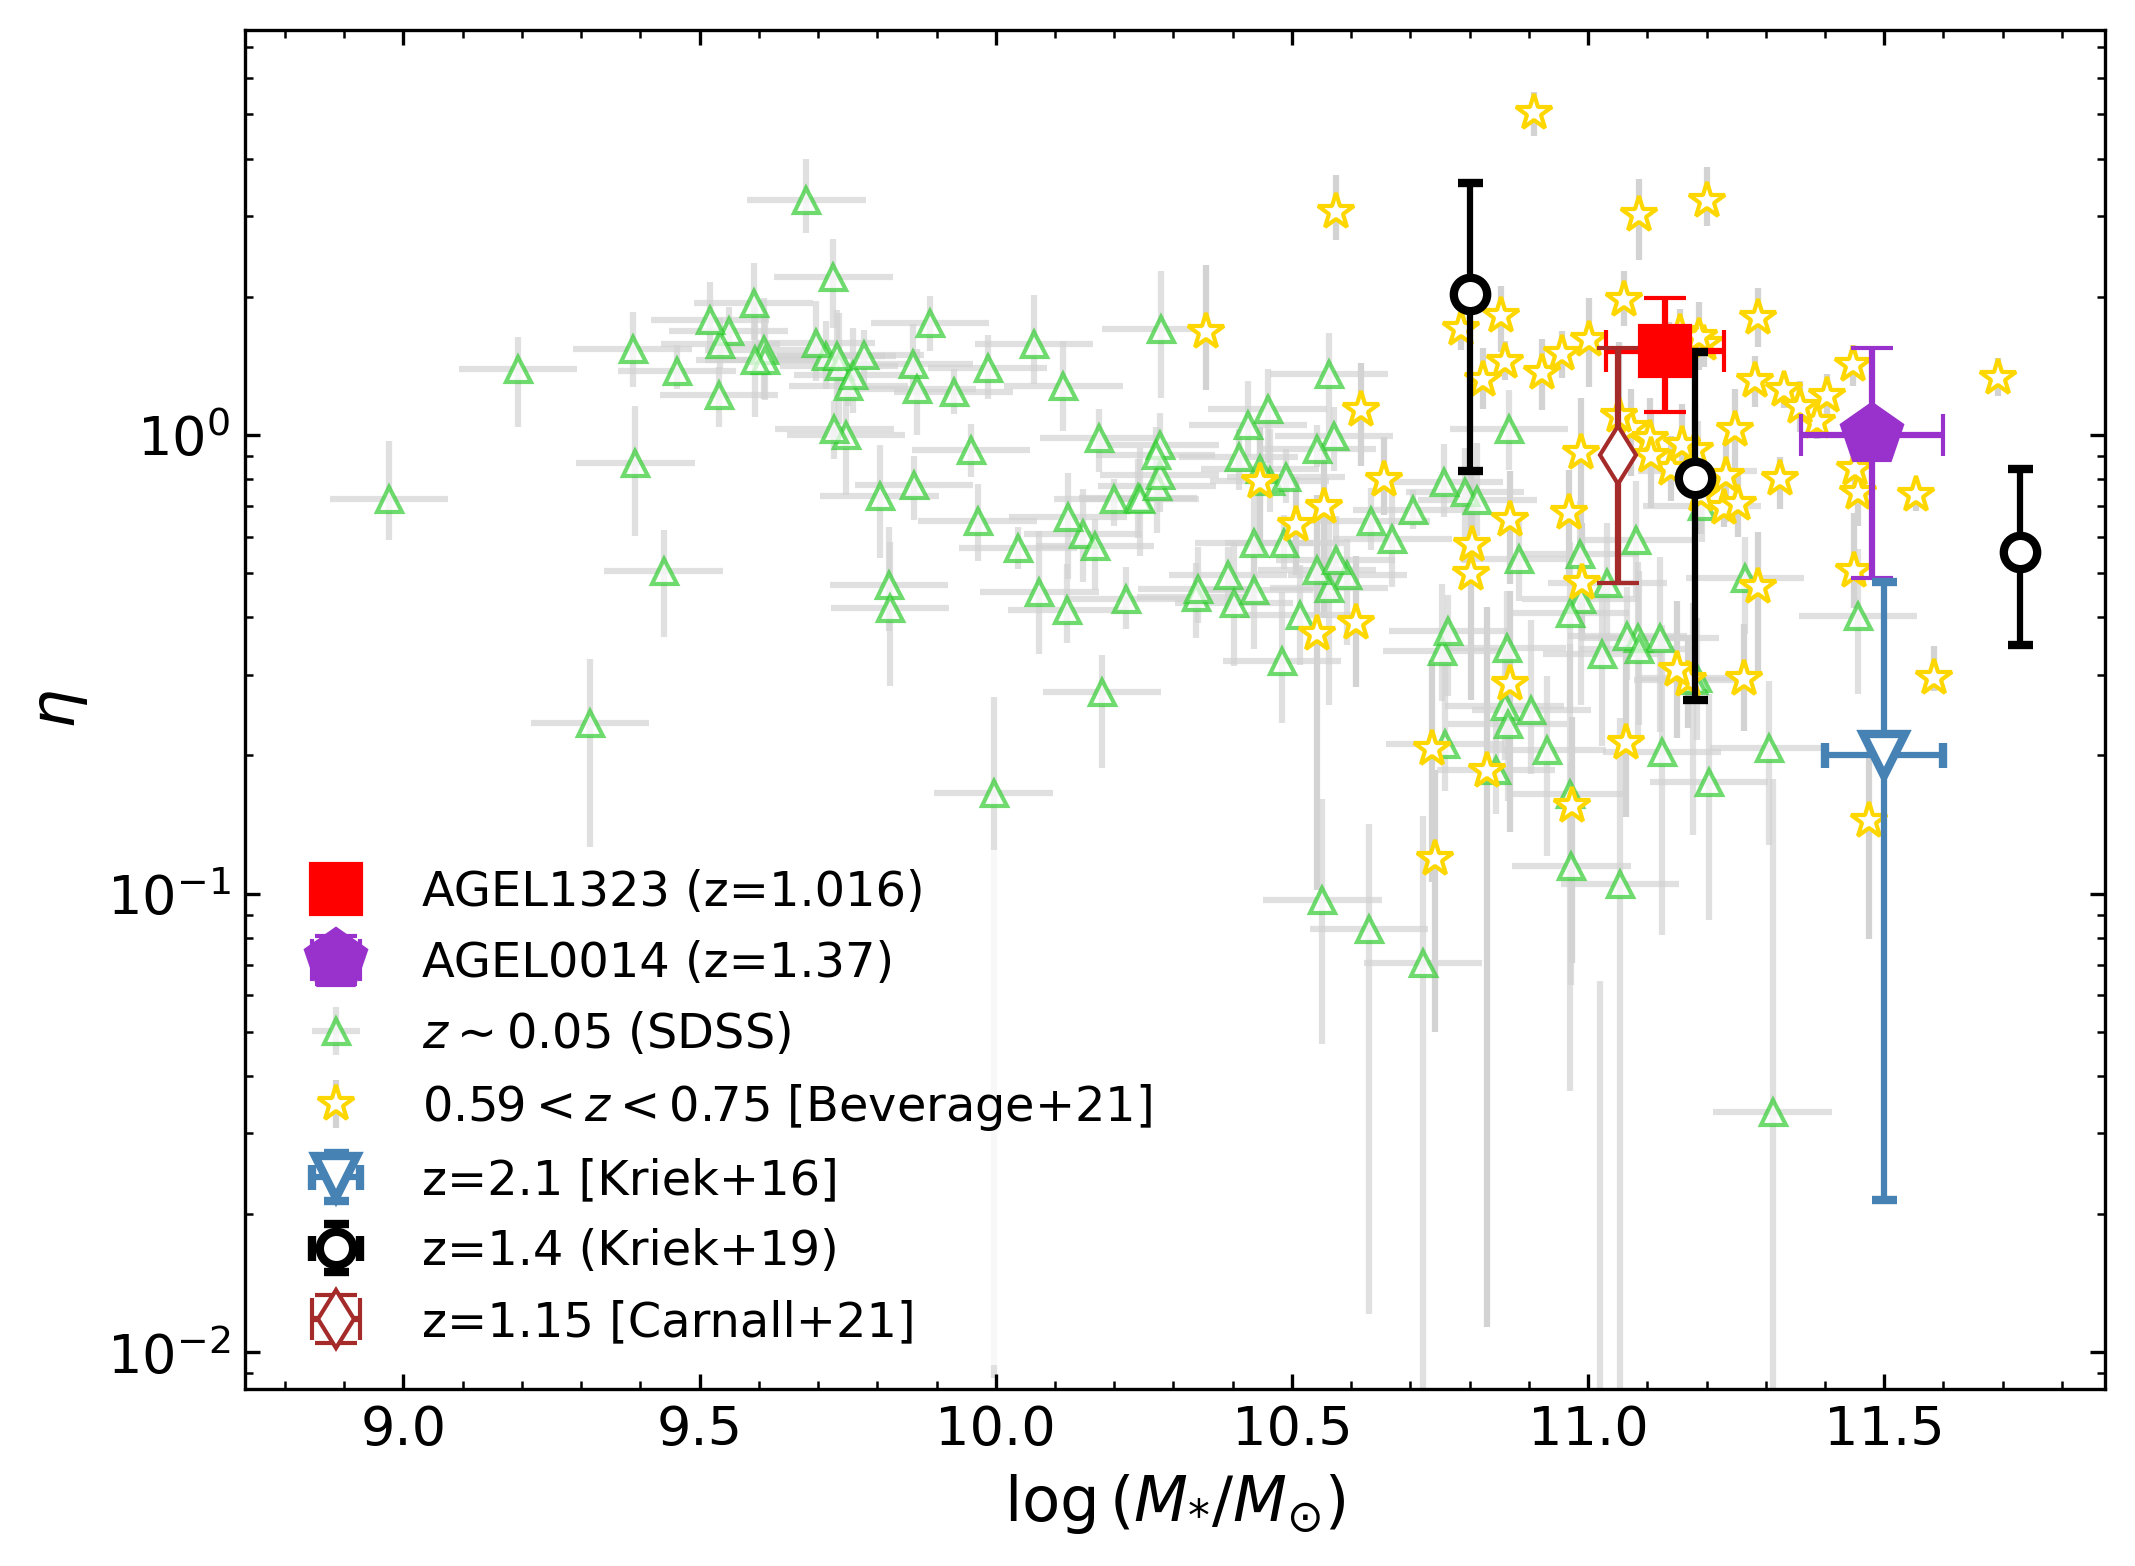
In Figure 11, we show the mass-loading factors inferred from the measured [Mg/H] for quiescent galaxies at various redshifts. The AGEL galaxies—as well as other high- galaxies—appear to have higher mass-loading factors than nearby quiescent galaxies, implying that galaxies may have enhanced outflows when they were forming stars in the early universe. The strong outflows would naturally cause the two galaxies to lose gas quickly and thus can no longer sustain further star formation.
The observational constraints on the mass-loading factors for high- galaxies are qualitatively consistent with the FIRE simulations (Hayward & Hopkins, 2017), which predict that increases significantly as redshift increases at . Therefore, it will be essential to perform similar studies when a larger sample of high- quiescent galaxies at is available in order to further investigate whether there is a redshift evolution in the mass-loading factor as suggested by the FIRE simulations.
5.3 Comparison with Sukay et al. (2022)
Sukay et al. (2022) derived the stellar population properties of AGEL1323 via a joint fit of photometry and spectroscopy with Prospector (Johnson et al., 2021). They adopted a non-parametric SFH model with seven age bins to characterize the stellar population. In this work, we instead measure the stellar population via full-spectrum fitting algorithms alf assuming an SSP or two SSPs (i.e., one or two age bins). Sukay et al. (2022) used the spectrum obtained on Alhambra Faint Object Spectrograph and Camera (ALFOSC) at the 2.56 m Nordic Optical Telescope (NOT) with a total integration time of 80 mintues. The low-resolution spectrum () covers the rest-frame wavelength between 2820 Å and 5030 Å and thus is unable to resolve most of the faint metal absorption lines which is important to robustly constrain the stellar metallicity.
Our new Keck spectra therefore are much deeper and have a much higher resolution. The Keck spectra cover the rest-frame optical between 3600-5500 Å, which includes many more metal absorption lines essential to the determination of [Fe/H] and [Mg/Fe]. We prefer an SSP model over more complicated SFHs because its simplicity reduces the degeneracy among free parameters. Although we adopted a different SFH model, the SSP age in this work is still in qualitatively good agreement with the SFH derived by Sukay et al. (2022). We obtained an SSP age of Gyr, while the SFH derived by Sukay et al. (2022) indicates an absence of prominent star formation activity until 3 Gyr ago. Both results indicate that AGEL1323 is an old system that quenched very early in the universe.
We measured elemental abundances of and . If we convert our measurements to total metallicity as (Thomas et al., 2003), the total metallicity is , which is consistent with Sukay et al.’s best-fit stellar metallicity, .
5.4 Comparison between the ages and metallicities derived from different approaches
While we primarily focus on the ages and the metallicities derived from alf with full-spectrum fitting, we also measured the stellar populations with SED fitting to estimate the stellar masses (Section 3.2). Here we briefly discuss the differences in the measurements from the two approaches.
Since we adopt the delayed- model in the broadband SED fitting, we compare the mass-weighted stellar ages averaged over the SFHs with the SSP ages derived from alf. As shown in Figure 3.2, we obtained a mean stellar age of Gyr for AGEL1323 and Gyr for AGEL0014. Although the ages derived from broadband SED fitting are still consistent with the SSP ages within , they are systematically lower than the values measured with alf. The mean stellar ages vary slightly across different SFH models, but all of them predict ages younger than the SSP ages while remaining consistent with alf’s measurements within . Even if such age differences can be attenuated by conducting a joint fitting of photometry and spectroscopy with BAGPIPES, the measured ages of both galaxies are still lower than those measured from alf.
As for the stellar metallicities, we determine the [Z/H] for AGEL1323 and [Z/H] for AGEL0014 when the red spectrum covering the Mg b triplet and Fe I lines is included for each galaxy. The delayed- SFH with a single metallicity is assumed. The stellar metallicities measured from the joint fitting of photometry and spectroscopy are therefore consistent with the [Fe/H] determined by alf within , although BAGPIPES still yields higher metallicity measurements. The BAGPIPES measurement of [Z/H] of AGEL1323 is also within of the total metallicity when we convert the alf’s measurements of [Fe/H] and [Mg/Fe] into [Z/H] as (Thomas et al., 2003), for consistency with other recent work (e.g., Kriek et al., 2019; Carnall et al., 2019). However, the total metallicities of AGEL0014 are consistent between the two approaches within .
Even though the stellar ages and metallicities measured from SED fitting with BAGPIPES and full-spectrum fitting with alf appear to be consistent with each other, SED fitting systematically recovers younger and more metal-rich populations than full-spectrum fitting does. Several factors may account for the potential systematic effects, such as different SSP templates and the choices of SFH models. The fitted wavelength region may also affect the results. BAGPIPES only allows one spectrum to be included in the fit while alf can analyze two spectra obtained on different instruments/gratings. SED fitting also spans a much wider spectral range than full-spectrum fitting. There is no doubt that different spectral regions are sensitive to stellar populations at different ages. With the current sample of only two galaxies, it is beyond the scope of this work to quantify the possible systematic differences in the stellar population parameters measured with different approaches.
6 Conclusions
We presented the deep rest-frame optical spectra obtained on the Keck I telescope for two gravitationally lensed, massive quiescent galaxies at : AGEL1323 () and AGEL0014 (). The high S/N of the spectra enabled us to robustly characterize the stellar population and elemental abundances of the lensed galaxies via full-spectrum fitting under the SSP assumption. A summary of our findings is as follows:
-
1.
We determined the stellar metallicities as for AGEL1323 () and for AGEL0014 (. Compared with low- galaxies at similar masses, the lensed galaxies in our sample are more metal-poor, consistent with other stellar metallicity measurements of quiescent galaxies at similar redshift Kriek et al. (2019); Carnall et al. (2019). This tentatively indicates that the redshift evolution of the stellar MZR should be in place at . When we remove the mass dependence of metallicity for quiescent galaxies at different redshifts, we find that galaxies of the same masses that formed at the same time have similar metallicities, regardless of their observed redshift. This result implies that the evolution of the stellar MZR is more fundamental with formation redshift than with observed redshift.
-
2.
We also measured the -enhancements for two lensed galaxies as for AGEL1323 and for AGEL0014. The lensed galaxies have comparable [Mg/Fe] as their low- counterparts, despite of their old ages.
-
3.
We obtained SSP-equivalent ages of Gyr for AGEL1323 and Gyr for AGEL0014. Considering the observed redshifts and stellar masses of the lensed galaxies, the old ages show that the majority of the stellar population formed very rapidly in the galaxies (less than 2 Gyr after the Big Bang). Using a simple chemical evolution (Leethochawalit et al., 2019), we inferred mass-loading factors of the galaxies from the measured [Mg/H]. The high mass-loading factors imply that the two galaxies both experienced enhanced outflows during their star formation, which may have led to their early quenching.
This work has demonstrated how gravitational lensing can further our understanding of the chemical evolution of quiescent galaxies in the high-redshift universe. At the moment, there are still just a handful of robust stellar abundance measurements for quiescent galaxies at . Therefore, larger samples would be necessary to systematically investigate the relation between stellar mass, stellar abundances, and the inferred mass-loading factors of high- quiescent galaxies. The early data from JWST have revealed numerous new lens candidates that may be quiescent galaxies from even higher redshifts than those presented in this work. The upcoming bounty of spectroscopic and imaging data will revolutionize our knowledge of chemical enrichment histories of quiescent galaxies in the early universe.
References
- Abbott et al. (2018) Abbott, T. M. C., Abdalla, F. B., Allam, S., et al. 2018, ApJS, 239, 18, doi: 10.3847/1538-4365/aae9f0
- Aihara et al. (2022) Aihara, H., AlSayyad, Y., Ando, M., et al. 2022, PASJ, 74, 247, doi: 10.1093/pasj/psab122
- Asplund et al. (2009) Asplund, M., Grevesse, N., Sauval, A. J., & Scott, P. 2009, ARA&A, 47, 481, doi: 10.1146/annurev.astro.46.060407.145222
- Astropy Collaboration et al. (2013) Astropy Collaboration, Robitaille, T. P., Tollerud, E. J., et al. 2013, A&A, 558, A33, doi: 10.1051/0004-6361/201322068
- Astropy Collaboration et al. (2018) Astropy Collaboration, Price-Whelan, A. M., Sipőcz, B. M., et al. 2018, AJ, 156, 123, doi: 10.3847/1538-3881/aabc4f
- Belli et al. (2014) Belli, S., Newman, A. B., & Ellis, R. S. 2014, ApJ, 783, 117, doi: 10.1088/0004-637X/783/2/117
- Bertin & Arnouts (1996) Bertin, E., & Arnouts, S. 1996, A&AS, 117, 393, doi: 10.1051/aas:1996164
- Beverage et al. (2021) Beverage, A. G., Kriek, M., Conroy, C., et al. 2021, ApJ, 917, L1, doi: 10.3847/2041-8213/ac12cd
- Calura et al. (2009) Calura, F., Pipino, A., Chiappini, C., Matteucci, F., & Maiolino, R. 2009, A&A, 504, 373, doi: 10.1051/0004-6361/200911756
- Calzetti et al. (2000) Calzetti, D., Armus, L., Bohlin, R. C., et al. 2000, ApJ, 533, 682, doi: 10.1086/308692
- Carnall et al. (2019) Carnall, A. C., Leja, J., Johnson, B. D., et al. 2019, ApJ, 873, 44, doi: 10.3847/1538-4357/ab04a2
- Carnall et al. (2018) Carnall, A. C., McLure, R. J., Dunlop, J. S., & Davé, R. 2018, MNRAS, 480, 4379, doi: 10.1093/mnras/sty2169
- Carnall et al. (2022) Carnall, A. C., McLure, R. J., Dunlop, J. S., et al. 2022, ApJ, 929, 131, doi: 10.3847/1538-4357/ac5b62
- Choi et al. (2014) Choi, J., Conroy, C., Moustakas, J., et al. 2014, ApJ, 792, 95, doi: 10.1088/0004-637X/792/2/95
- Choi et al. (2016) Choi, J., Dotter, A., Conroy, C., et al. 2016, ApJ, 823, 102, doi: 10.3847/0004-637X/823/2/102
- Conroy & van Dokkum (2012) Conroy, C., & van Dokkum, P. G. 2012, ApJ, 760, 71, doi: 10.1088/0004-637X/760/1/71
- Conroy et al. (2018) Conroy, C., Villaume, A., van Dokkum, P. G., & Lind, K. 2018, ApJ, 854, 139, doi: 10.3847/1538-4357/aaab49
- de los Reyes et al. (2022) de los Reyes, M. A. C., Kirby, E. N., Ji, A. P., & Nuñez, E. H. 2022, ApJ, 925, 66, doi: 10.3847/1538-4357/ac332b
- Dekel & Silk (1986) Dekel, A., & Silk, J. 1986, ApJ, 303, 39, doi: 10.1086/164050
- Dey et al. (2019) Dey, A., Schlegel, D. J., Lang, D., et al. 2019, AJ, 157, 168, doi: 10.3847/1538-3881/ab089d
- Erb et al. (2006) Erb, D. K., Shapley, A. E., Pettini, M., et al. 2006, ApJ, 644, 813, doi: 10.1086/503623
- Estrada-Carpenter et al. (2019) Estrada-Carpenter, V., Papovich, C., Momcheva, I., et al. 2019, ApJ, 870, 133, doi: 10.3847/1538-4357/aaf22e
- Finlator & Davé (2008) Finlator, K., & Davé, R. 2008, MNRAS, 385, 2181, doi: 10.1111/j.1365-2966.2008.12991.x
- Foreman-Mackey et al. (2013) Foreman-Mackey, D., Hogg, D. W., Lang, D., & Goodman, J. 2013, PASP, 125, 306, doi: 10.1086/670067
- Gallazzi et al. (2014) Gallazzi, A., Bell, E. F., Zibetti, S., Brinchmann, J., & Kelson, D. D. 2014, ApJ, 788, 72, doi: 10.1088/0004-637X/788/1/72
- Gallazzi et al. (2005) Gallazzi, A., Charlot, S., Brinchmann, J., White, S. D. M., & Tremonti, C. A. 2005, MNRAS, 362, 41, doi: 10.1111/j.1365-2966.2005.09321.x
- Greene et al. (2013) Greene, J. E., Murphy, J. D., Graves, G. J., et al. 2013, ApJ, 776, 64, doi: 10.1088/0004-637X/776/2/64
- Harris et al. (2020) Harris, C. R., Millman, K. J., van der Walt, S. J., et al. 2020, Nature, 585, 357–362, doi: 10.1038/s41586-020-2649-2
- Hayward & Hopkins (2017) Hayward, C. C., & Hopkins, P. F. 2017, MNRAS, 465, 1682, doi: 10.1093/mnras/stw2888
- Horne (1986) Horne, K. 1986, PASP, 98, 609, doi: 10.1086/131801
- Jacobs et al. (2019a) Jacobs, C., Collett, T., Glazebrook, K., et al. 2019a, MNRAS, 484, 5330, doi: 10.1093/mnras/stz272
- Jacobs et al. (2019b) —. 2019b, ApJS, 243, 17, doi: 10.3847/1538-4365/ab26b6
- Jafariyazani et al. (2020) Jafariyazani, M., Newman, A. B., Mobasher, B., et al. 2020, ApJ, 897, L42, doi: 10.3847/2041-8213/aba11c
- Johnson et al. (2021) Johnson, B. D., Leja, J., Conroy, C., & Speagle, J. S. 2021, ApJS, 254, 22, doi: 10.3847/1538-4365/abef67
- Jullo et al. (2007) Jullo, E., Kneib, J. P., Limousin, M., et al. 2007, New Journal of Physics, 9, 447, doi: 10.1088/1367-2630/9/12/447
- Kacprzak et al. (2016) Kacprzak, G. G., van de Voort, F., Glazebrook, K., et al. 2016, ApJ, 826, L11, doi: 10.3847/2041-8205/826/1/L11
- Kirby et al. (2013) Kirby, E. N., Cohen, J. G., Guhathakurta, P., et al. 2013, ApJ, 779, 102, doi: 10.1088/0004-637X/779/2/102
- Kriek et al. (2016) Kriek, M., Conroy, C., van Dokkum, P. G., et al. 2016, Nature, 540, 248, doi: 10.1038/nature20570
- Kriek et al. (2019) Kriek, M., Price, S. H., Conroy, C., et al. 2019, ApJ, 880, L31, doi: 10.3847/2041-8213/ab2e75
- Kroupa (2001) Kroupa, P. 2001, MNRAS, 322, 231, doi: 10.1046/j.1365-8711.2001.04022.x
- Leethochawalit et al. (2016) Leethochawalit, N., Jones, T. A., Ellis, R. S., et al. 2016, ApJ, 820, 84, doi: 10.3847/0004-637X/820/2/84
- Leethochawalit et al. (2019) Leethochawalit, N., Kirby, E. N., Ellis, R. S., Moran, S. M., & Treu, T. 2019, ApJ, 885, 100, doi: 10.3847/1538-4357/ab4809
- Leethochawalit et al. (2018) Leethochawalit, N., Kirby, E. N., Moran, S. M., Ellis, R. S., & Treu, T. 2018, ApJ, 856, 15, doi: 10.3847/1538-4357/aab26a
- Lonoce et al. (2015) Lonoce, I., Longhetti, M., Maraston, C., et al. 2015, MNRAS, 454, 3912, doi: 10.1093/mnras/stv2150
- Lu et al. (2015) Lu, Y., Blanc, G. A., & Benson, A. 2015, ApJ, 808, 129, doi: 10.1088/0004-637X/808/2/129
- Ludlow et al. (2016) Ludlow, A. D., Bose, S., Angulo, R. E., et al. 2016, MNRAS, 460, 1214, doi: 10.1093/mnras/stw1046
- Lupton et al. (2004) Lupton, R., Blanton, M. R., Fekete, G., et al. 2004, PASP, 116, 133, doi: 10.1086/382245
- Ma et al. (2016) Ma, X., Hopkins, P. F., Faucher-Giguère, C.-A., et al. 2016, MNRAS, 456, 2140, doi: 10.1093/mnras/stv2659
- Magrini et al. (2012) Magrini, L., Hunt, L., Galli, D., et al. 2012, MNRAS, 427, 1075, doi: 10.1111/j.1365-2966.2012.22055.x
- Man et al. (2021) Man, A. W. S., Zabl, J., Brammer, G. B., et al. 2021, ApJ, 919, 20, doi: 10.3847/1538-4357/ac0ae3
- Mendel et al. (2020) Mendel, J. T., Beifiori, A., Saglia, R. P., et al. 2020, ApJ, 899, 87, doi: 10.3847/1538-4357/ab9ffc
- Morishita et al. (2018) Morishita, T., Abramson, L. E., Treu, T., et al. 2018, ApJ, 856, L4, doi: 10.3847/2041-8213/aab493
- Nanayakkara et al. (2022) Nanayakkara, T., Esdaile, J., Glazebrook, K., et al. 2022, PASA, 39, e002, doi: 10.1017/pasa.2021.61
- Navarro et al. (1997) Navarro, J. F., Frenk, C. S., & White, S. D. M. 1997, ApJ, 490, 493, doi: 10.1086/304888
- Newman et al. (2018) Newman, A. B., Belli, S., Ellis, R. S., & Patel, S. G. 2018, ApJ, 862, 126, doi: 10.3847/1538-4357/aacd4f
- Nightingale & Dye (2015) Nightingale, J. W., & Dye, S. 2015, MNRAS, 452, 2940, doi: 10.1093/mnras/stv1455
- Nightingale et al. (2018) Nightingale, J. W., Dye, S., & Massey, R. J. 2018, MNRAS, 478, 4738, doi: 10.1093/mnras/sty1264
- Nightingale et al. (2021a) Nightingale, J. W., Hayes, R. G., & Griffiths, M. 2021a, Journal of Open Source Software, 6, 2550, doi: 10.21105/joss.02550
- Nightingale et al. (2021b) Nightingale, J. W., Hayes, R. G., Kelly, A., et al. 2021b, Journal of Open Source Software, 6, 2825, doi: 10.21105/joss.02825
- Nomoto et al. (2006) Nomoto, K., Tominaga, N., Umeda, H., Kobayashi, C., & Maeda, K. 2006, Nucl. Phys. A, 777, 424, doi: 10.1016/j.nuclphysa.2006.05.008
- Onodera et al. (2015) Onodera, M., Carollo, C. M., Renzini, A., et al. 2015, ApJ, 808, 161, doi: 10.1088/0004-637X/808/2/161
- Oser et al. (2010) Oser, L., Ostriker, J. P., Naab, T., Johansson, P. H., & Burkert, A. 2010, ApJ, 725, 2312, doi: 10.1088/0004-637X/725/2/2312
- Oyarzún et al. (2019) Oyarzún, G. A., Bundy, K., Westfall, K. B., et al. 2019, ApJ, 880, 111, doi: 10.3847/1538-4357/ab297c
- Prochaska et al. (2020a) Prochaska, J., Hennawi, J., Westfall, K., et al. 2020a, The Journal of Open Source Software, 5, 2308, doi: 10.21105/joss.02308
- Prochaska et al. (2020b) Prochaska, J. X., Hennawi, J., Cooke, R., et al. 2020b, pypeit/PypeIt: Release 1.0.0, v1.0.0, Zenodo, doi: 10.5281/zenodo.3743493
- Sánchez-Blázquez et al. (2006) Sánchez-Blázquez, P., Peletier, R. F., Jiménez-Vicente, J., et al. 2006, MNRAS, 371, 703, doi: 10.1111/j.1365-2966.2006.10699.x
- Schlafly & Finkbeiner (2011) Schlafly, E. F., & Finkbeiner, D. P. 2011, ApJ, 737, 103, doi: 10.1088/0004-637X/737/2/103
- Shajib et al. (2022a) Shajib, A. J., Glazebrook, K., Barone, T., et al. 2022a, ApJ, 938, 141, doi: 10.3847/1538-4357/ac927b
- Shajib et al. (2022b) —. 2022b, LensingETC: Lensing Exposure Time Calculator, Astrophysics Source Code Library, record ascl:2210.027. http://ascl.net/2210.027
- Skrutskie et al. (2006) Skrutskie, M. F., Cutri, R. M., Stiening, R., et al. 2006, AJ, 131, 1163, doi: 10.1086/498708
- Speagle (2020) Speagle, J. S. 2020, MNRAS, 493, 3132, doi: 10.1093/mnras/staa278
- Strom et al. (2017) Strom, A. L., Steidel, C. C., Rudie, G. C., et al. 2017, ApJ, 836, 164, doi: 10.3847/1538-4357/836/2/164
- Sukay et al. (2022) Sukay, E., Khullar, G., Gladders, M. D., et al. 2022, arXiv e-prints, arXiv:2203.11957. https://arxiv.org/abs/2203.11957
- Thomas et al. (2003) Thomas, D., Maraston, C., & Bender, R. 2003, MNRAS, 343, 279, doi: 10.1046/j.1365-8711.2003.06659.x
- Thomas et al. (2005) Thomas, D., Maraston, C., Bender, R., & Mendes de Oliveira, C. 2005, ApJ, 621, 673, doi: 10.1086/426932
- Toft et al. (2012) Toft, S., Gallazzi, A., Zirm, A., et al. 2012, ApJ, 754, 3, doi: 10.1088/0004-637X/754/1/3
- Tran et al. (2022) Tran, K.-V. H., Harshan, A., Glazebrook, K., et al. 2022, AJ, 164, 148, doi: 10.3847/1538-3881/ac7da2
- Tremonti et al. (2004) Tremonti, C. A., Heckman, T. M., Kauffmann, G., et al. 2004, ApJ, 613, 898, doi: 10.1086/423264
- Villaume et al. (2017) Villaume, A., Conroy, C., Johnson, B., et al. 2017, ApJS, 230, 23, doi: 10.3847/1538-4365/aa72ed
- Virtanen et al. (2020) Virtanen, P., Gommers, R., Oliphant, T. E., et al. 2020, Nature Methods, 17, 261, doi: 10.1038/s41592-019-0686-2
- Walcher et al. (2015) Walcher, C. J., Coelho, P. R. T., Gallazzi, A., et al. 2015, A&A, 582, A46, doi: 10.1051/0004-6361/201525924
- Zhuang et al. (2021) Zhuang, Z., Kirby, E. N., Leethochawalit, N., & de los Reyes, M. A. C. 2021, ApJ, 920, 63, doi: 10.3847/1538-4357/ac1340