A strong He ii 1640 emitter with extremely blue UV spectral slope at : presence of Pop III stars?
Abstract
Cosmic hydrogen reionization and cosmic production of first metals are major phase transitions of the Universe occurring during the first billion years after the Big Bang [1, 2, 3, 4], but still poorly explored observationally. Using the JWST NIRSpec prism spectroscopy, we report the discovery of a sub- galaxy at , dubbed RXJ2129-z8HeII, via the detection of a series of strong rest-frame UV/optical nebular emission lines and the clear Lyman break. A strong He ii 1640 emission is present, the highest redshift He ii line currently known. Its high rest-frame equivalent width () and extreme flux ratios with respect to UV metal lines and Balmer lines raise the possibility that part of RXJ2129-z8HeII’s stellar populations could be Pop III-like [5, 6]. RXJ2129-z8HeII also shows a pronounced UV continuum with an extremely steep (i.e. blue) spectral slope of , the steepest amongst all spectroscopically confirmed galaxies at , in support of its very hard ionizing spectrum that could lead to a significant leakage of its ionizing flux [7]. Therefore, RXJ2129-z8HeII is representative of the key galaxy population driving the cosmic reionization. To date, this is also the most compelling case where trace Pop III stars might coexist with more metal-enriched stars.
School of Astronomy and Space Science, University of Chinese Academy of Sciences (UCAS), Beijing 100049, China
National Astronomical Observatories, Chinese Academy of Sciences, Beijing 100101, China
Institute for Frontiers in Astronomy and Astrophysics, Beijing Normal University, Beijing 102206, China
Chinese Academy of Sciences South America Center for Astronomy, National Astronomical Observatories, CAS, Beijing 100101, China
Laboratoire AIM, CEA/DSM-CNRS-Université Paris Diderot, IRFU/Service d’Astrophysique, Bât. 709, CEA Saclay, F-91191 Gif-sur-Yvette Cedex, France
Department of Physics and Astronomy, University of Missouri-Columbia, Columbia, MO 65211, USA
Department of Physics and Astronomy, University of California Davis, 1 Shields Avenue, Davis, CA 95616, USA
Department of Physics and Astronomy, University of California Los Angeles, 430 Portola Plaza, Los Angeles, CA 90095, USA
NSF’s National Optical-Infrared Astronomy Research Laboratory, 950 N. Cherry Ave., Tucson, AZ 85719, USA
Cosmic Dawn Center (DAWN), Denmark
Niels Bohr Institute, University of Copenhagen, Jagtvej 128, DK-2200 Copenhagen N, Denmark
Center for Frontier Science, Chiba University, 1-33 Yayoi-cho, Inage-ku, Chiba 263-8522, Japan
Department of Physics, Chiba University, 1-33 Yayoi-Cho, Inage-Ku, Chiba 263-8522, Japan
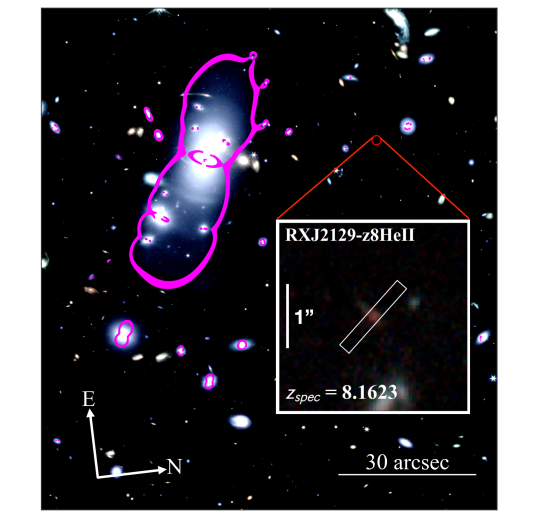
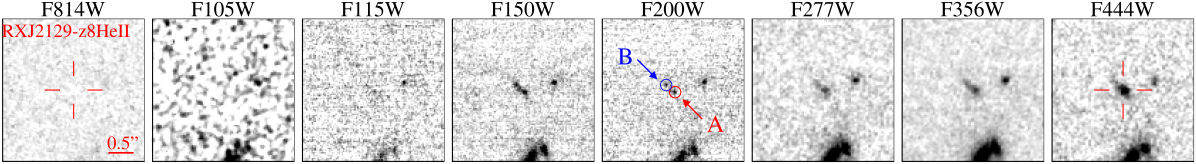
The JWST observations analyzed in this work were acquired by a Director’s Discretionary program (DD-2767; PI: P. Kelly), targeting the field of the galaxy cluster RXJ2129.7+0005 (henceforth RXJ2129) at . These observations consist of an imaging component using the Near-Infrared Camera (NIRCam) and a spectroscopic component using the Near-Infrared Spectrograph (NIRSpec). The imaging exposures were taken on 6 October 2022 (UT dates quoted throughout) using the F115W, F150W, F200W, F277W, F356W, and F444W filters, covering the wavelength range of , with the 5- limiting depth of 29 mag. In Fig. 1, we show a color-composite image produced from these data. We also take advantage of the archival HST imaging obtained by the CLASH HST program (PI: M. Postman; 111https://archive.stsci.edu/prepds/clash/), and compile a photometric catalog combining both the new NIRCam imaging and the existing HST imaging in a self-consistent manner (see the Methods section). The image stamps of our target are displayed in the top row of Fig. 2. This object in fact has two components A and B, with A dominating the total flux in all filters in the NIRCam long wavelength channel. Hereafter unless otherwise specified, we use RXJ2129-z8HeII to stand for its component A, which is targeted by NIRSpec described below.
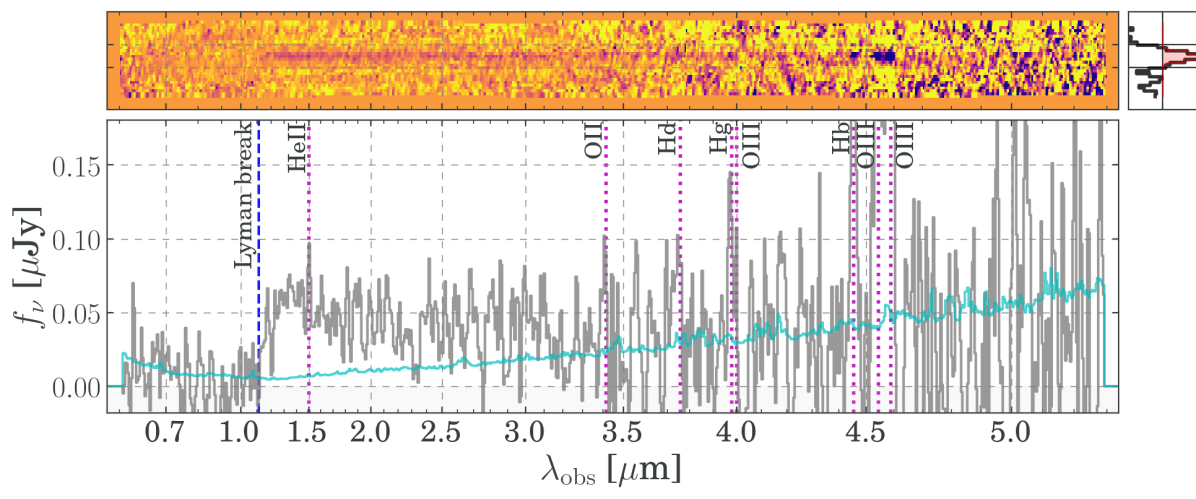
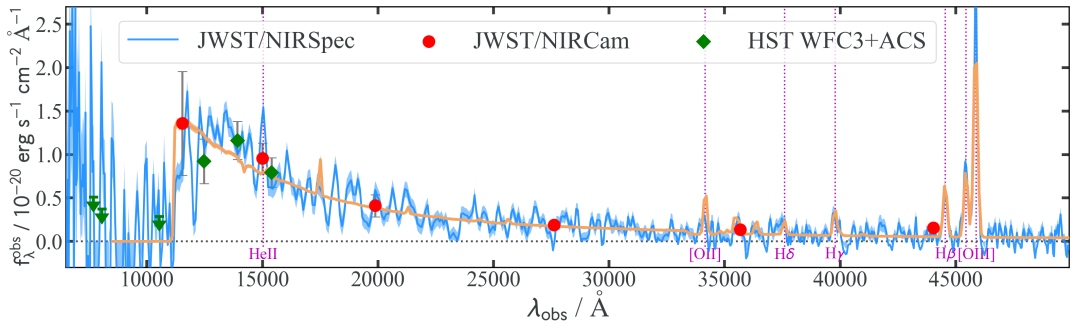
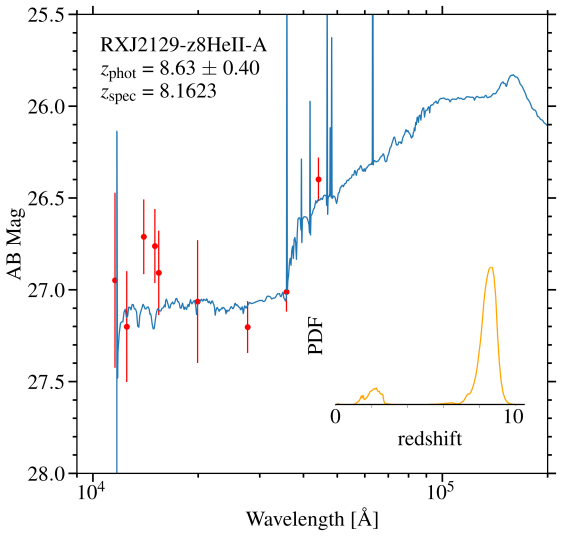
The follow-up JWST spectroscopy was carried out on 22 October 2022, using the NIRSpec instrument in the Multi-Object Spectroscopy (MOS) mode. RXJ2129-z8HeII was among the NIRSpec targets that were pre-selected based on their photometric redshifts [8]. The field was observed using the prism disperser, offering a very wide, continuous wavelength coverage of . In the inset of Fig. 1, we show a zoom-in view of RXJ2129-z8HeII with the position of the MOS slit superposed. We reduce the NIRSpec MOS spectroscopic data following our customized procedures, elaborated in the Methods section. The middle and bottom rows of Fig. 2 show the resultant 2D and 1D prism spectra of RXJ2129-z8HeII. We detect pronounced emission features of the [O iii] doublets and H line complex at , and a clear continuum break at with prominent continuum flux redward of the break. The identification of this continuum break as the Lyman break occurring at the Ly wavelength () is in excellent agreement with both the photometric redshift of RXJ2129-z8HeII measured from broad-band photometry and the strong [O iii] +H lines in the prism spectrum. Fitting simultaneously the entire spectroscopic (continuum + lines) and the photometric data sets, we confirm RXJ2129-z8HeII as an extreme emission line galaxy with strong continuum emission at (see Fig. 3), when the Universe is 613 Myr years old. This puts RXJ2129-z8HeII deep in the epoch of reionization (EoR), when the IGM was mostly neutral hydrogen [3, 4].
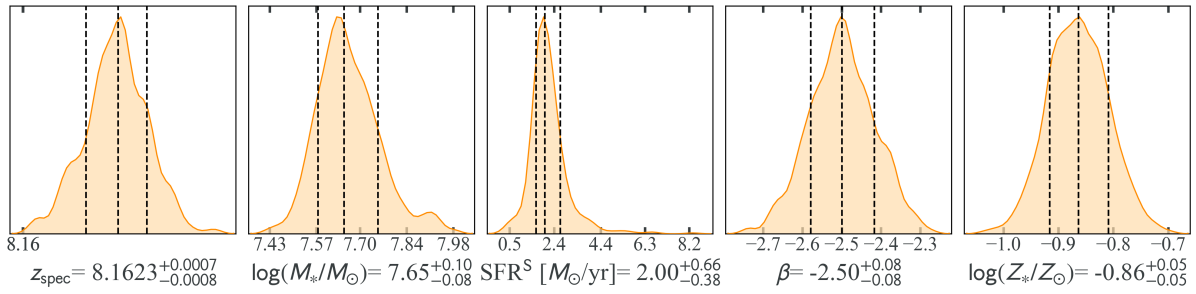
We employ the BAGPIPES software [9] to conduct detailed spectro-photometric analysis of both the broad-band photometry and the full NIRSpec spectrum that we obtained for RXJ2129-z8HeII. Performing full spectrum fitting is highly critical since it is the only appropriate approach to extract the detailed information of stellar population from the low-resolution prism spectroscopy. According to the up-to-date lens model produced by the GLAFIC software [10, 11], we estimate that the magnification for our object is . After correcting for magnification, we obtain the following physical picture of RXJ2129-z8HeII: it is a very low mass (), young () galaxy, actively forming stars () with sub-solar metallicity () and little dust (). Its UV absolute magnitude of places it at the level of 40% at [12]. Importantly, the bulk of the ionizing UV photons that caused the cosmic reionization are thought to come from sub- systems [13, 14].
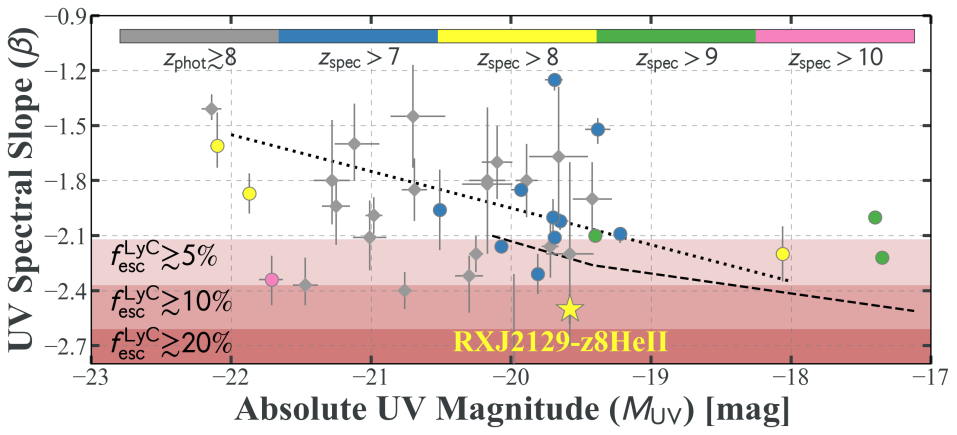
Indeed, from the strong detection of the far UV stellar continuum at , we measure the UV spectral slope using the standard formalism of . This ranks RXJ2129-z8HeII as the spectroscopically confirmed galaxy in the EoR having the steepest UV continuum slope — a strong implication of significant leakage of its ionizing radiation to the IGM [15, 7]. The completion of reionization by requires that the absolute escape fraction of the Lyman continuum (LyC) photons from galaxies should be on average [16, 17]. In the EoR, a negative correlation between and has been seen from photometric analyses, in support of the pivotal roles played by the intrinsically faint systems in dominating the IGM-ionizing photon budget [18, 19]. The lower panel of Fig. 3 summarizes all the current measurements of and of galaxies at , where the spectroscopically confirmed sources are highlighted in color. Using the HST/COS observations of the LyC signals from the Low-redshift Lyman Continuum Survey (LzLCS), Ref. [7] found a strong correlation between and : . We therefore derive the LyC escape fraction estimate of RXJ2129-z8HeII: . We present the detailed measurements of these physical properties in Table 1.
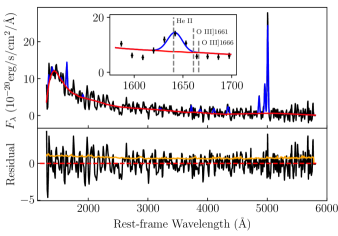
We utilize the pPXF software to perform accurate emission line analyses. The emission line fluxes and equivalent widths222EWs are always measured in rest frame throughout this paper. (EWs) are measured by fitting the stellar continuum and emission lines simultaneously using the BC03 stellar population library [20] and the Gaussian component describing each line (see the left panel of Fig. 4). From the NIRSpec prism data, we detect 5 emission lines — [O iii] 5008,4960, H, H, , and — with signal-to-noise ratios (SNRs) 2. In addition, we give 2- upper limits for other lines in Table 3, including He ii 4686, [O iii] 4363, H, , and . We do not see any signatures of Ly emission and put a 2- upper limits of . The absence of Ly line is likely due to the damping wing opacity caused by the diffuse neutral IGM at and/or dense self-shielding HI gas clouds inside the large ionized HII bubbles [21]. After correcting for dust attenuation, we derive a high intrinsic flux ratio of and [O ii] to be . This high value provides further confirmation of a hard ionizing spectrum and a large LyC escape fraction [22], in accord with our estimate based on . From our measurements of , we estimate the ionizing photon production efficiency to be following Ref. [23], in agreement with the expectation at if sub- galaxies are the major sources of reionization [14].
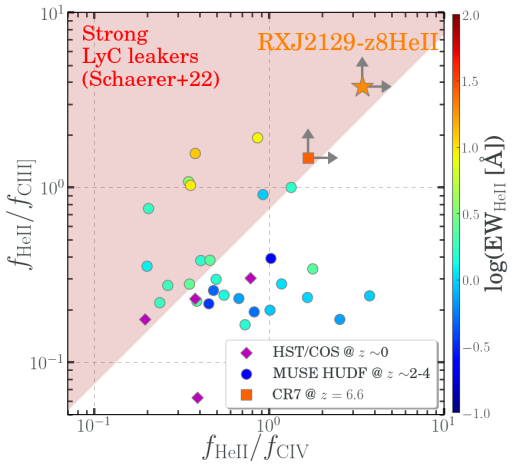
Notably, the He ii emission is the only UV line clearly detected in RXJ2129-z8HeII. This line has the intrinsic (corrected for the magnification) flux and . At , this is the highest redshift at which an He ii line detection has been reported in the literature. The nebular He ii line requires a hard ionizing background radiation, which is usually attributed to Wolf-Rayet stars, stripped stars, X-ray binaries, or active galactic neucli (AGN) [24, 25]. The location of RXJ2129-z8HeII in the mass-excitation diagram [26, 27] and the low limit of (given in Table 1) disfavor a supermassive black hole as the culprit. The lack of variability estimated from archival HST imaging disfavors the possibility of X-ray binaries. In the right panel of Fig. 4, we show the flux ratios of He ii against rest-frame UV carbon lines measured in galaxies at various redshifts with He ii detections at SNR2.5 [28, 29, 30, 24]. As opposed to He ii, these carbon lines of RXJ2129-z8HeII are much weaker. We also do not detect any other rest-frame UV metal lines (e.g. O iii]1661,1666, N iv]1483,1487, N v1240), inconsistent with the signatures of Wolf-Rayet and stripped stars that are frequently seen in local galaxies [31, 32].
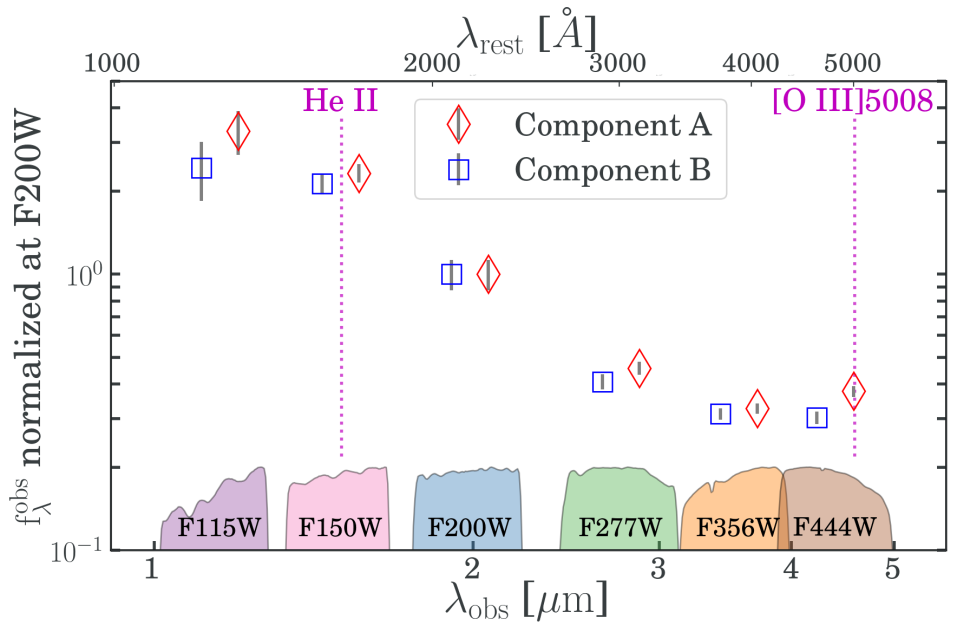
Alternatively, the He ii line could be due to high-mass, metal-free population III (Pop III) stars that have strong He+ ionizing flux [1]. While the interstellar medium (ISM) of RXJ2129-z8HeII is already metal-enriched to roughly one-twelfth solar ( 7.62), its measured flux ratio of is much larger than the fiducial value for metal-poor Hii regions () [1]. All this, together with the large , suggests that RXJ2129-z8HeII likely has a mixture of “normal” and Pop III stars, the latter of which are the energy source of the He ii line emission [5, 6]. The putative popIII contribution might be intermixed to enriched populations, or spatially segregated. Intrinuingly, the prism spectroscopy is taken on component A of RXJ2129-z8HeII only, with component B residing 02 (i.e. 1kpc proper) to the North East. We rederive photometry for A and B separately, and find that they have comparable photometric estimates: and , both in good agreement with the spectroscopic redshift measured for A. Our separate photometry for component B shows a comparably blue UV continuum similar to A’s, but with much smaller ratio of the F444W/F200W flux (see Fig. 5 in the Methods section). Assuming that the different color is driven by , we estimate that B’s is lower by a factor of than A’s, indicating that B’s ISM is more chemically pristine. The SED shape might also allow for an higher EW HeII line in component B. Simulations predict that Pop III stars can continue to form if there exist pockets of primordial gas not yet polluted by metal-enriched outflows from nearby star-forming galaxies [2]. A deep NIRSpec/IFU observation with high spectral resolution covering both components can provide a more comprehensive picture of the origin of this prominent He ii emission observed in RXJ2129-z8HeII.
RXJ2129-z8HeII is an intriguing galaxy in the EoR. It has a sub- , a large flux ratio, and high-EW rest-frame optical lines. In particular, its UV spectral slope () is the steepest amongst all spectroscopically confirmed galaxies at reported to date, implying that it has a large LyC escape fraction , the largest among its cohort. RXJ2129-z8HeII is a promising representative of the predominant galaxy populations that are capable of producing and leaking their extreme UV photons to the IGM, causing the bulk of the neutral hydrogen in the IGM ionized. Importantly, its prominent He ii line and the large flux ratios of He ii versus rest-frame UV metal lines and Balmer lines suggests that it is the best candidate by far to find possible coexistence of Pop III and normal stars in its stellar populations. This work showcases the power of the JWST NIRSpec prism spectroscopy to characterize the stellar continuum as well as nebular emission properties of high- galaxies simultaneously, thanks to its exceedingly wide wavelength coverage and exquisite sensitivity.
| Parameters | Values |
|---|---|
| R.A. [deg] | 322.416266 |
| Decl. [deg] | 0.099675 |
| 8.1623 | |
| Spectro-photometric analyses | |
| 7.65 | |
| SFRS [/yr] | 2.00 |
| [mag] | 0.12 |
| -0.86 | |
| [Myr] | 210.59 |
| [mag] | -19.58 |
| -2.50 | |
| 0.15 | |
| Emission line analyses | |
| EW [Å] | |
| >2.5 (2-) | |
| >3.8 (2-) | |
| 12+log(O/H) | 7.62 |
| SFRN [/yr] | 6.64 |
| [mag] | 0.29 |
| 25.50 | |
This work is based on observations made with the NASA/ESA/CSA James Webb Space Telescope, associated with the program JWST-DD-2767. The specific observations analyzed can be accessed via https://doi:10.17909/2dxj-z303. The data were obtained from the Mikulski Archive for Space Telescopes at the Space Telescope Science Institute, which is operated by the Association of Universities for Research in Astronomy, Inc., under NASA contract NAS 5-03127 for JWST. XW is supported by CAS Project for Young Scientists in Basic Research, Grant No. YSBR-062. JG acknowledges support from the Youth Innovation Promotion Association of the Chinese Academy of Sciences (No. 2022056). MO acknowledges support by JSPS KAKENHI grants JP20H00181, JP20H05856, and JP22H01260.
XW wrote the paper and developed the main interpretation of the results, aided by ED, HY, TJ, and MM. XW also performed the spectro-photometry analyses and NIRSpec data reduction with the help from GB and PAH. CC conducted the NIRCam data reduction and image mosaicing. JG performed the emission line profile fitting. XLM led the photometry and the morphological analyses. MO modeled the galaxy cluster. All authors contribute to the writing and discussion of the main science results.
0.1 Cosmological model.
Throughout this paper, we adopt the standard concordance CDM model with , , km s-1 Mpc-1, and the AB magnitude system [48].
0.2 JWST/NIRCam data reduction and mosaicing.
The NIRCam imaging data were acquired by a Director’s Discretionary program (DD-2767; PI: P. Kelly), whose primary goal is to measure the light curves and spectra of a strongly lensed supernova SN 2022riv at [49, 50] discovered in the RXJ2129 field, by a HST SNAP program (GO-16729; PI P. Kelly). The exposure times are 4982 seconds for the F150W/F356W filters, and are 2061 seconds for the other four NIRCam filters (F115W, F200W, F277W, and F444W). We reduce these NIRCam images using the standard JWST pipeline version 1.8.1 and making use of the jwst_1013.pmap context. We follow the standard three stages of the image data reduction pipeline calwebb_detector1, calwebb_image2 and calwebb_image3 to calibrate each image and build the mosaic image of each band. Furthermore, we remove the “snowball”333https://jwst-docs.stsci.edu/data-artifacts-and-features/snowballs-artifact and 1/f noise are using the scripts from https://github.com/chriswillott/jwst, and the “wisps” 444https://jwst-docs.stsci.edu/jwst-near-infrared-camera/nircam-features-and-caveats/nircam-claws-and-wisps are removed using the default wisps templates555https://stsci.app.box.com/s/1bymvf1lkrqbdn9rnkluzqk30e8o2bne. We produce the imaging mosaics on 60 and 30 mas pixel scales, astrometrically aligned to the GAIA DR2 astrometry frame. The image reduction script is uploaded to https://github.com/chengchengcode/jwst-pipeline-note/blob/main/F150W-snowballflag-wisps-1overf.ipynb. The data doi is 10.17909/2dxj-z303.
0.3 JWST/NIRCam and HST/ACS-WFC3 photometry.
For comprehensive photometry of RXJ2129-z8HeII, we not only use the 6-band imaging mosaics produced above, but also include the publicly released HST imaging mosaics from the Cluster Lensing and Supernova Survey (CLASH; Ref. [51]). CLASH provides the imaging data in 6 bands taken with ACS/WFC (F775W and F814W) and WFC3/IR (F105W, F125W, F140W, and F160W), highly relevant to the work here.
We first transform the CLASH 0.065 imaging mosaics to mosaics on 0.06 plate scale, and then PSF-match the 6 HST ACS/WFC3 filters and 6 JWST/NIRCam filters to the F444W resolution (FWHM = 0.14). We utilize a window function to remove the high-frequency noise in the Fourier domain. We modify the rms images in order to match the F444W resolution for every other filters using , where and are the rms after PSF-matching and the original rms in filter i respectively, is the kernel used to match all PSFs to that of the F444W filter through .
In the JWST NIRCam F200W imaging, RXJ2129-z8HeII displays two components A and B, marked by the arrows in the F200W stamp shown in Fig. 2. The JWST NIRSpec MOS slit falls on component A, which is also predominant in the total flux in the long-wavelength NIRCam filters. For the sake of accurate photometry of the two components, we use the F200W image as the detection filter and rerun our photometry routine to segment them. To maximize the detection SNRs and thus obtain more accurate SED fitting, fluxes in each filter are measured within fixed apertures of 2FWHM of the F444W image () in diameter. Furthermore, the flux is dust corrected for galactic extinction through , where is the extinction in the -th band [52]. The resultant photometric measurements of the two components of RXJ2129-z8HeII is presented in Table 2. For filters with no detections, we report the 2- upper limits. The NIRCam photometry normalized at their individual F200W flux is shown in Fig. 5.
| Imaging Filters | Observed Magnitudes [mag] | |
|---|---|---|
| Component A | Component B | |
| ACS/F775W | <28.14 (2-) | <28.30 (2-) |
| ACS/F814W | <28.38 (2-) | <28.49 (2-) |
| WFC3/F105W | <28.08 (2-) | <27.91 (2-) |
| WFC3/F125W | 27.20 0.30 | 28.45 0.93 |
| WFC3/F140W | 26.71 0.20 | 27.83 0.37 |
| WFC3/F160W | 26.91 0.23 | 27.99 0.42 |
| NIRCam/F115W | 26.95 0.48 | 28.22 0.50 |
| NIRCam/F150W | 26.76 0.20 | 27.79 0.17 |
| NIRCam/F200W | 27.06 0.34 | 28.00 0.26 |
| NIRCam/F277W | 27.20 0.14 | 28.26 0.13 |
| NIRCam/F356W | 27.01 0.11 | 27.99 0.10 |
| NIRCam/F444W | 26.40 0.12 | 27.57 0.11 |
0.4 Photometric redshift estimates.
We use the EAzY software [53] to estimate the photometric redshift from the broad-band photometry presented in Table 2. All together, we use the HST filters ACS/F775W, ACS/F814W, WFC3/F105W, WFC3/F125W, WFC3/F140W, WFC3/F160W, as well as the JWST NIRCam filters F115W, F150W, F200W, F277W, F356W and F444W. We adopt the standard set of galaxy SED templates eazy_v1.1_lines.spectra.param, which includes star-forming galaxies with strong emission lines. The resultant photometric redshifts of RXJ2129-z8HeII component A and B are and respectively (see Fig. 6), in good agreement with the precise spectroscopic redshift we derived from NIRSpec prism spectroscopy.

0.5 JWST/NIRSpec prism spectroscopy and data reduction.
The JWST NIRSpec observation of RXJ2129-z8HeII was carried out on 22 October 2022 using the prism spectroscopy mode with the resolution of . The relative position of the slit to the galaxy is shown in the inset of Fig. 1, primarily covering component A dominating the total flux. The slit is composed of three shutters in the micro-shutter array (MSA), accounting for a total size of 0.2”x1.4”, approximately. The observation adopts the standard 3-point nodding pattern accumulating a total exposure time of 4464.2 seconds, to facilitate background subtraction.
We reduce all the individual exposures with the latest version of the reference files for NIRSpec jwst_1014.pmap. First of all, the level-1 calwebb_detector1 calibration pipeline is employed to reduce the raw exposures (uncal.fits) into count rate maps (rate.fits), during which step the detector artefacts and cosmic rays are removed and flagged. The resultant count rate maps are visually inspected to manually mask any remaining artefacts and bad pixels. We then rely on the custom reduction software msaexp 666https://github.com/gbrammer/msaexp to perform the remaining steps of the reduction. It first preprocesses the rate images to equalize the pedestal of each exposure, identify and correct the “snowball” and 1/f noise features. Then it calls some specific modules from the standard level-2 calwebb_spec2 calibration pipeline to carry out the the bulk of the data reduction. These modules include AssignWcs, Extract2dStep, FlatFieldStep, PathLossStep, PhotomStep, which perform WCS initialization, 2D extraction of spectra, slit-level flat-fielding, path-loss correction, wavelength and flux calibration of each science exposure. msaexp subsequently subtracts background from each exposure using the two associated exposures at the other dithered positions from the nodding sequence, and drizzles the background-subtracted science exposures onto a common wavelength grid via inverse-variance weighting, with outlier rejection and bad pixel masking. We adopt an oversampling rate of 2 for the output wavelength grid, to Nyquist sample the line spread function in order to improve the sampling of the emission line profiles. Finally msaexp obtains the 1D spectrum from the 2D combined spectral traces following an optimal extraction methodology [54], which uses the actual light profile of our target as the optimal aperture for spectral extraction. The object light profile along the cross-dispersion direction is modeled as a Gaussian function fit to the collapsed 2D spectra (summed along the dispersion direction). As a result, we obtain the 2D/1D prism spectra, as shown in in the middle/lower panels in Fig. 2, covering an uninterruptedly wide wavelength range of . For sources, this corresponds to a contiguous coverage of the rest-frame UV and optical galaxy SED at .
We also perform extensive tests to verify the photometric calibration of NIRSpec prism spectra. On one hand, we cross-check the flux levels of our extracted spectra and that of our broad-band photometry from NIRCam imaging in the similar wavelength regime. They show good agreement with each other within 10% (see the upper panel of Fig. 3). On the other hand, we conduct detailed investigation of the wavelength calibration by performing line identifications in low- galaxies showing multiple emission lines across their entire prism spectra, observed in the same MSA setting whose spectra are extracted in the same fashion. We find that the wavelength offset between the best-fit centroid and that expected for the mean redshift shows a scatter <0.004, much smaller than the instrument resolution. So we conclude that our flux and wavelength calibrations are sufficiently accurate.
0.6 Spectro-photometric analyses.
We employ the BAGPIPES software [55] to perform the spectral energy distribution (SED) fitting of both our spectroscopic and photometric observations simultaneously. We adopt a double power law star-formation history model which is in widespread use to describe the evolution of the cosmic star-formation rate (SFR) density [56], and has great flexibility to account for both rising and declining star-formation activities, i.e.,
| (1) |
with a Jeffery’s prior on the exponents: and a flat prior on the peak time of star formation: , where is the age of the Universe at the observed redshift. BAGPIPES relies on the BC03 [20] stellar population synthesis model and the nebular emission model created by the Cloudy photoionization code. For other key assumptions, we choose the Chabrier initial mass function [57], the Calzetti dust attenuation law [46] with , a stellar metallicity range of , and a conservative Gaussian redshift prior of .
BAGPIPES utilizes the nested sampling algorithm to perform efficient Bayesian inference and obtain posterior distribution of parameters. We take the [16th, 50th, 84th] percentiles of the parameter posteriors as the median and 1- CI, and show the 1D posterior distributions of some key parameters in Fig. 7. For each set of sampled parameters, BAGPIPES produces realistic galaxy SED through its model_galaxy module. We thus overlay the median and 1- CI of such model realizations in orange curve and band in the upper panel of Fig. 3, which shows that they are faithful fits to the observations. We also present the median constraints and 1- uncertainties of some key physical parameters in Table 1. Here, stands for the stellar mass of RXJ2129-z8HeII. represents the SFR averaged over a few 100 Myrs time scale. is the mass-weighted age of the stellar populations.
We follow the prescription in Ref. [58] to estimate the absolute UV magnitude,
| (2) |
where is the magnification in magnitudes. At , the WFC3/F140W filter covers the rest-frame and therefore appropriate to use. We follow the methodology in Ref. [7] to derive the UV spectral slope (). We fit in the wavelength range of to the model galaxy SEDs produced by BAGPIPES with all possible emission features properly masked. Note that throughout this work, stands for in the nomenclature used by Ref. [7] without dust correction. After correcting for dust, Ref. [7] finds out that the intrinsic UV spectral slopes () of the LzLCS galaxies observed with HST/COS are clustered in the range of [-2.8, -2.6].
0.7 Emission line fitting and measurements.
We perform the stellar population analysis and emission line fittings to the prism data by using the pPXF code [59] and BC03 stellar population library that generated based on the Chabrier IMF [20], by assuming the CAL reddening curve for dust extinction correction [46]. During the spectral analyses, the range of emission-line intrinsic width is set to [0, 300] km/s. The flux ratio of [O iii] 4959,5007 doublet is fixed to the theoretical value of 0.33. For the weak emission lines in the UV bands, we bound their shift of line centers to those stronger emission lines (e.g. He II) to improve the fitting robustness.
As shown in the left panel of Fig. 4, the residual of the spectral fitting is consistent with the flux error at the wavelength space. The error of emission-line fluxes and EWs are hence obtained from the spectral fitting of 50 mock spectra that generated based on the best-fitting model spectrum and flux error. The measured emission line fluxes and EWs are listed in Table 3. The inset in the left panel of Fig. 4 shows a zoom-in view of our fitting result to the source spectrum at , where He ii and the oxygen auroral lines O iii]1661,1666 are marked in vertical dashed lines. We verify that the detection of the He ii line is robust against negligible contamination from the oxygen auroral lines.
| Emission Line | Observed Flux | Rest-frame Equivalent Width |
|---|---|---|
| [ ] | [Å] | |
| [O III]5008 | 51011 | 85876 |
| [O III]4960 | 1684 | 28928 |
| H | 9913 | 18042 |
| He II4686 | <29 | <72 |
| [O III]4363 | <20 | <70 |
| H | 5714 | 15148 |
| H | <35 | <70 |
| [O II]3726,3729 | 4014 | 4615 |
| C III]1907,1909 | <38 | <8 |
| He II1640 | 14623 | 193 |
| C IV1548,1551 | <57 | <5 |
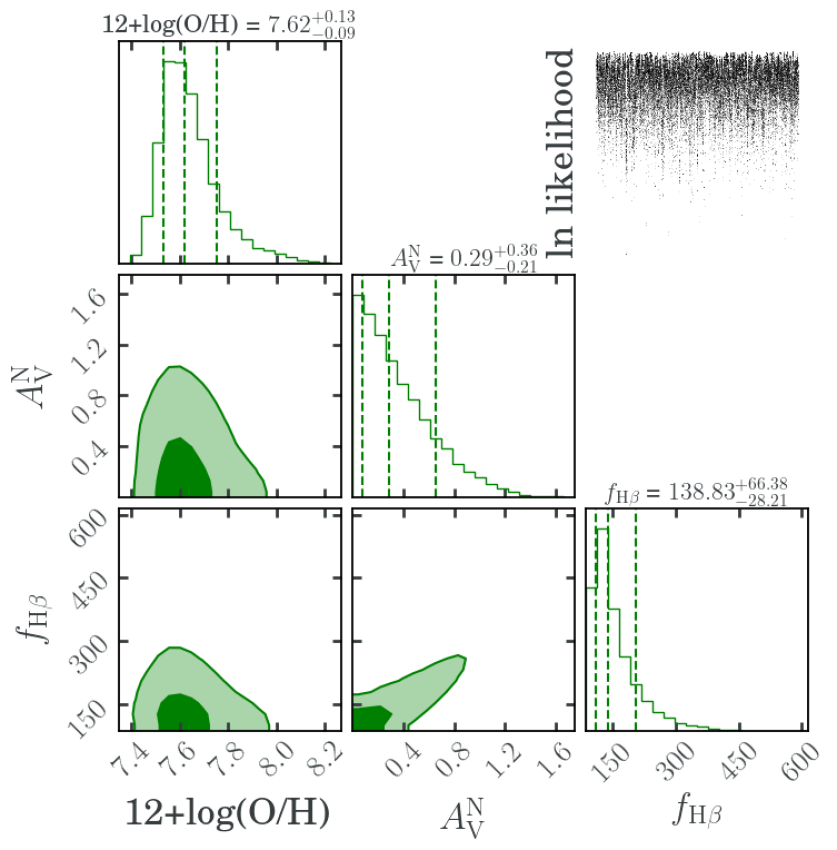
0.8 Bayesian inference of ISM properties.
We apply a well-established Bayesian forward-modeling inference framework to the measured line fluxes derived from our dedicated emission line profile fitting presented in Table 3. We constrain jointly three key ISM properties: gas-phase metallicity (), nebular dust extinction (), and de-reddened H flux (), through the following likelihood function following Refs. [60, 61], i.e.,
| (3) |
Here and correspond to the intrinsic line ([O iii], H, H, H, and [O ii]) flux and uncertainty with extinction corrected using the Cardelli dust attenuation law [52] with following Ref. [62]. is sampled as a free parameter. and represent the expected flux ratio and its intrinsic scatter of each line with respect to H, given by the widely used Maiolino strong line calibrations [63] and the default Balmer decrements assuming case B recombination conditions. We also estimate the instantaneous star formation rate (SFRN) from the Balmer line luminosity with the Kennicutt calibration [64] and the Chabrier IMF [57]: . The value of SFRN for strong emission line galaxies is usually much higher than that of SFRS derived from SED fitting, as the former tightly reflects the burstiness in star formation [65].
We adopt the Emcee software to perform the Markov Chain Monte Carlo Bayesian parameter sampling, with 100 of walkers each sampling 1000 iterations. After a burn-in of 200 for each walker, we have sampled the parameter space 80,000 times. We show the resultant 1D and 2D parameter constraints in Fig. 8. The median constraints and 1- CI are shown in Table 1. To understand the energy source that power the photoionization of the nebular emission observed in RXJ2129-z8HeII, we rely on the mass-excitation diagram [26, 27], which is an empirical relation between stellar mass and the [O iii]/H flux ratio with demarcation schemes separating Hii region and and AGN. We verify that RXJ2129-z8HeII can be safely classified as a star-forming galaxy with negligible contamination from AGN ionization.
0.9 Strong lensing models.
We adopt the cluster lens model of RXJ2129 constructed using the GLAFIC software [10, 11], updated from the initial work of Ref. [66]. In total, 22 individual images of 7 multiply lensed background galaxies spectroscopically confirmed by Ref [67] are used as the strong lensing constraints. The macroscopic mass model consists of one cluster-scale dark matter halo in the elliptical Navarro-Frenk-White profile [68], combined with galaxy-scale halos modeled using the pseudo-Jaffe profile according to the scaling relation of the velocity dispersion and luminosity of cluster member galaxies [69]. The best-fit model is derived using the Markov chain Monte Carlo sampling process with a minimization assuming a positional uncertainty of 0.4. A hundred additional realizations are also created to bootstrap the 1- statistical uncertainties for magnifications. As a consequence, we obtain the best-fit and 1- CI of the magnification estimates of RXJ2129-z8HeII to be 2.26 and [2.12, 2.40]. We also double check with an independent lens model built by the Lenstool software [67], and derive consistent results.
0.10 Source morphology.
As shown in the multiple image stamps displayed in the upper panels of Fig. 2, the entire RXJ2129-z8HeII galaxy consists of two components: A and B, with the former dominating the flux in rest-frame optical probed by the NIRCam long wavelength channels, and the latter clearly manifesting in the rest-frame UV covered by the short wavelength channels, especially F200W. Therefore, our morphology analyses are performed in two NIRCam bands, i.e., F200W and F444W, representing the rest-frame UV and optical light profiles of our galaxy, respectively. We rely on Galfit ([70]) to model both components of RXJ2129-z8HeII observed in F200W. First, two models are chosen to fit component A. One is a Sérsic profile describing the underlying extended structure with a Sérsic index () of 4, an effective radius () of 3 pixels, an axis ratio () of 0.68 and a position angle () of 48 deg. Pure PSF model is adopted to fit the nucleated emission in the center of component A. Component B is well reconstructed with a Sérsic profile (, pixels, , deg) and a pure PSF model. The resultant model residuals removing component A and both components are shown in the lower panels of Fig. 9.
The inset of Fig. 1 shows the relative location of the NIRSpec MOS slit, covering primarily component A of RXJ2129-z8HeII. As implied by the observed prism spectra shown in the upper panel of Fig. 2, the broad-band flux of the NIRCam F444W filter is likely dominated by the high equivalent width [O iii] +H nebular emission lines (also see Table 3). Indeed we observe a more extended light profile in the rest-frame optical than that in the UV. We thus model the image of component A in F444W with an exponential disk and a Sérsic profile. The diffuse and extended structure is well reproduced by an exponential disk model with disk scale-length of 4 pixels, of 0.36 and of 43 deg. The nucleated structure is modeled by a Sérsic profile (=4) with pixels, and deg. Component B in F444W is very faint and can be well fitted by an exponential disk model with disk scale-length of 1.5 pixels, of 0.86 and of 40 deg. The model residuals are shown in the upper panels of Fig. 9.

References
- [1] Schaerer, D. On the properties of massive Population III stars and metal-free stellar populations. Astronomy & Astrophysics 382, 28–42 (2002). astro-ph/0110697.
- [2] Ciardi, B. & Ferrara, A. The First Cosmic Structures and Their Effects. Space Science Reviews 116, 625 – 705 (2005). URL https://link.springer.com/article/10.1007/s11214-005-3592-0.
- [3] Fan, X., Carilli, C. L. & Keating, B. Observational Constraints on Cosmic Reionization. ARA&A 44, 415 – 462 (2006). URL http://adsabs.harvard.edu/abs/2006ARA\%26A..44..415F.
- [4] Stark, D. P. Galaxies in the First Billion Years After the Big Bang. ARA&A 54, 761 – 803 (2016). URL http://adsabs.harvard.edu/abs/2016ARA\%26A..54..761S.
- [5] Katz, H., Kimm, T., Ellis, R. S., Devriendt, J. & Slyz, A. The Challenges of Identifying Population III Stars in the Early Universe. arXiv (2022). 2207.04751.
- [6] Nakajima, K. & Maiolino, R. Diagnostics for PopIII galaxies and direct collapse black holes in the early universe. Monthly Notices of the Royal Astronomical Society 513, 5134–5147 (2022). 2204.11870.
- [7] Chisholm, J. et al. The Far-Ultraviolet Continuum Slope as a Lyman Continuum Escape Estimator at High-redshift. Monthly Notices of the Royal Astronomical Society (2022).
- [8] Williams, H. et al. Spectroscopy from Lyman alpha to [O III] 5007 of a Triply Imaged Magnified Galaxy at Redshift z = 9.5. arXiv e-prints arXiv:2210.15699 (2022). 2210.15699.
- [9] Carnall, A. C. et al. The VANDELS survey: the star-formation histories of massive quiescent galaxies at 1.0 < z < 1.3. eprint arXiv:1903.11082 (2019). URL http://adsabs.harvard.edu/abs/2019arXiv190311082C. 1903.11082.
- [10] Oguri, M. The Mass Distribution of SDSS J1004+4112 Revisited. Publications of the Astronomical Society of Japan 62, 1017 – 1024 (2010). URL http://adsabs.harvard.edu/cgi-bin/nph-data\_query?bibcode=2010PASJ...62.1017O\&link\_type=EJOURNAL.
- [11] Oguri, M. Fast Calculation of Gravitational Lensing Properties of Elliptical Navarro–Frenk–White and Hernquist Density Profiles. Publications of the Astronomical Society of the Pacific 133, 074504 (2021). 2106.11464.
- [12] Bouwens, R. J. et al. UV Luminosity Functions at Redshifts z ˜ 4 to z ˜ 10: 10,000 Galaxies from HST Legacy Fields. ApJ 803, 34 (2015). URL http://adsabs.harvard.edu/abs/2015ApJ...803...34B. Reion UV lumin func, 1403.4295.
- [13] Yan, H. & Windhorst, R. A. The Major Sources of the Cosmic Reionizing Background at z 6. The Astrophysical Journal Letters 600, L1–L5 (2004). astro-ph/0312572.
- [14] Finkelstein, S. L. et al. Conditions for Reionizing the Universe with a Low Galaxy Ionizing Photon Escape Fraction. ApJ 879, 36 (2019). URL https://iopscience.iop.org/article/10.3847/1538-4357/ab1ea8.
- [15] Zackrisson, E., Inoue, A. K. & Jensen, H. THE SPECTRAL EVOLUTION OF THE FIRST GALAXIES. II. SPECTRAL SIGNATURES OF LYMAN CONTINUUM LEAKAGE FROM GALAXIES IN THE REIONIZATION EPOCH. The Astrophysical Journal 777, 39 (2013). 1304.6404.
- [16] Finkelstein, S. L. et al. CANDELS: The Contribution of the Observed Galaxy Population to Cosmic Reionization. ApJ 758, 93 (2012). URL http://adsabs.harvard.edu/abs/2012ApJ...758...93F. 1206.0735.
- [17] Robertson, B. E., Ellis, R. S., Furlanetto, S. R. & Dunlop, J. S. Cosmic Reionization and Early Star-forming Galaxies: A Joint Analysis of New Constraints from Planck and the Hubble Space Telescope. The Astrophysical Journal Letters 802, L19 (2015). URL http://adsabs.harvard.edu/abs/2015ApJ...802L..19R. 1502.02024.
- [18] Bouwens, R. J. et al. A Census of Star-forming Galaxies in the Z 9-10 Universe based on HST+Spitzer Observations over 19 Clash Clusters: Three Candidate Z 9-10 Galaxies and Improved Constraints on the Star Formation Rate Density at Z 9.2. ApJ 795, 126 (2014). URL http://adsabs.harvard.edu/abs/2014ApJ...795..126B. 1211.2230.
- [19] Bhatawdekar, R. & Conselice, C. J. UV Spectral Slopes at z = 6-9 in the Hubble Frontier Fields: Lack of Evidence for Unusual or Population III Stellar Populations. The Astrophysical Journal 909, 144 (2021). 2006.00013.
- [20] Bruzual, G. & Charlot, S. Stellar population synthesis at the resolution of 2003. MNRAS 344, 1000 – 1028 (2003). URL http://adsabs.harvard.edu/abs/2003MNRAS.344.1000B.
- [21] Dijkstra, M. Lya Emitting Galaxies as a Probe of Reionisation. Publications of the Astronomical Society of Australia 31, 53 (2014). URL https://www.cambridge.org/core/product/identifier/S1323358014000332/type/journal\_article.
- [22] Izotov, Y. I., Thuan, T. X. & Guseva, N. G. J1234+3901: an extremely metal-deficient compact star-forming dwarf galaxy at redshift 0.133. Monthly Notices of the Royal Astronomical Society 483, 5491–5498 (2018). 1812.07917.
- [23] Tang, M., Stark, D. P., Chevallard, J. & Charlot, S. MMT/MMIRS spectroscopy of z = 1.3 - 2.4 extreme [O iii] emitters: implications for galaxies in the reionization era. Monthly Notices of the Royal Astronomical Society 489, 2572–2594 (2019). 1809.09637.
- [24] Nanayakkara, T. et al. Exploring HeII 1640 emission line properties at z 2-4. A&A 624, A89 (2019). URL https://www.aanda.org/articles/aa/abs/2019/04/aa34565-18/aa34565-18.html.
- [25] Saxena, A. et al. The properties of HeII 1640 emitters at z 2.5-5 from the VANDELS survey. A&A 636, A47 (2020). URL https://www.aanda.org/articles/aa/abs/2020/04/aa37170-19/aa37170-19.html.
- [26] Juneau, S. et al. Active Galactic Nuclei Emission Line Diagnostics and the Mass-Metallicity Relation up to Redshift z 2: The Impact of Selection Effects and Evolution. ApJ 788, 88 (2014). URL http://adsabs.harvard.edu/abs/2014ApJ...788...88J. 1403.6832.
- [27] Coil, A. L. et al. THE MOSDEF SURVEY: OPTICAL ACTIVE GALACTIC NUCLEUS DIAGNOSTICS AT z 2.3. ApJ 801, 35 (2015). URL http://adsabs.harvard.edu/abs/2015ApJ...801...35C. 1409.6522.
- [28] Berg, D. A., Skillman, E. D., Henry, R. B. C., Erb, D. K. & Carigi, L. Carbon and Oxygen Abundances in Low Metallicity Dwarf Galaxies. ApJ 827, 126 (2016). URL http://adsabs.harvard.edu/abs/2016ApJ...827..126B. 1605.06152.
- [29] Sobral, D. et al. On the nature and physical conditions of the luminous Lya emitter CR7 and its rest-frame UV components. MNRAS 482, 2422 – 2441 (2018). URL https://academic.oup.com/mnras/article/482/2/2422/5144221. 1710.08422.
- [30] Senchyna, P. et al. Extremely metal-poor galaxies with HST/COS: laboratories for models of low-metallicity massive stars and high-redshift galaxies. MNRAS 488, 3492 – 3506 (2019). URL https://academic.oup.com/mnras/article/488/3/3492/5531324. 1904.01615.
- [31] Morris, P. W., Crowther, P. A. & Houck, J. R. Spitzer Space Telescope Infrared Spectrograph (IRS) Spectroscopy of the Prototype Wolf-Rayet Star EZ Canis Majoris (HD 50896). The Astrophysical Journal Supplement Series 154, 413 (2008).
- [32] Leitherer, C. Massive Star Formation in the Ultraviolet Observed with the Hubble Space Telescope. Galaxies 8, 13 (2020).
- [33] Watson, D. et al. A dusty, normal galaxy in the epoch of reionization. Nature 519, 327 – 330 (2015). URL http://adsabs.harvard.edu/abs/2015Natur.519..327W. 1503.00002.
- [34] Zitrin, A. et al. Lya Emission from a Luminous z = 8.68 Galaxy: Implications for Galaxies as Tracers of Cosmic Reionization. The Astrophysical Journal Letters 810, L12 (2015). URL http://adsabs.harvard.edu/cgi-bin/nph-data\_query?bibcode=2015ApJ...810L..12Z\&link\_type=EJOURNAL.
- [35] Oesch, P. A. et al. A Remarkably Luminous Galaxy at z=11.1 Measured with Hubble Space Telescope Grism Spectroscopy (2016). URL http://arxiv.org/abs/1603.00461. 1603.00461.
- [36] Hashimoto, T. et al. The onset of star formation 250 million years after the Big Bang. Nature 557, 392 – 395 (2018). URL http://adsabs.harvard.edu/abs/2018Natur.557..392H. 1805.05966.
- [37] Jiang, L.-H. et al. Evidence for GN-z11 as a luminous galaxy at redshift 10.957. Nature Astronomy 786, 1 – 6 (2020). URL https://www.nature.com/articles/s41550-020-01275-y.
- [38] Roberts-Borsani, G. et al. A shot in the Dark (Ages): a faint galaxy at confirmed with JWST. arXiv e-prints arXiv:2210.15639 (2022). 2210.15639.
- [39] Morishita, T. et al. Early results from GLASS-JWST. XVIII: A spectroscopically confirmed protocluster 650 million years after the Big Bang. arXiv e-prints arXiv:2211.09097 (2022). 2211.09097.
- [40] Schaerer, D. et al. First look with JWST spectroscopy: z 8 galaxies resemble local analogues. arXiv (2022). 2207.10034.
- [41] Tacchella, S. et al. On the Stellar Populations of Galaxies at z = 9-11: The Growth of Metals and Stellar Mass at Early Times. The Astrophysical Journal 927, 170 (2022).
- [42] Castellano, M. et al. Early Results from GLASS-JWST. III. Galaxy Candidates at z 9-15* *Based on observations collected with JWST under the ERS program ID 1324 (PI T. Treu). The Astrophysical Journal Letters 938, L15 (2022).
- [43] Naidu, R. P. et al. Two Remarkably Luminous Galaxy Candidates at z 10-12 Revealed by JWST. The Astrophysical Journal Letters 940, L14 (2022).
- [44] Finkelstein, S. L. et al. CEERS Key Paper I: An Early Look into the First 500 Myr of Galaxy Formation with JWST. arXiv (2022). 2211.05792.
- [45] Topping, M. W. et al. Searching for Extremely Blue UV Continuum Slopes at z=7-11 in JWST/NIRCam Imaging: Implications for Stellar Metallicity and Ionizing Photon Escape in Early Galaxies. arXiv (2022). 2208.01610.
- [46] Calzetti, D. et al. The Dust Content and Opacity of Actively Star-forming Galaxies**Based on observations with ISO, an ESA project with instruments funded by ESA member states (especially the PI countries: France, Germany, the Netherlands, and the United Kingdom) with the participation of ISAS and NASA. The Astrophysical Journal 533, 682–695 (2000). URL http://adsabs.harvard.edu/abs/2000ApJ...533..682C. astro-ph/9911459.
- [47] Schaerer, D. et al. Strong Lyman continuum emitting galaxies show intense C IV 1550 emission. Astronomy & Astrophysics 658, L11 (2022). 2202.07768.
- [48] Oke, J. B. & Gunn, J. E. Secondary standard stars for absolute spectrophotometry. Astrophysical Journal 266, 713 – 717 (1983). URL http://adsabs.harvard.edu/abs/1983ApJ...266..713O.
- [49] Kelly, P. et al. Strongly Lensed SN in MACS 2129 Galaxy-Cluster Field. Transient Name Server AstroNote 169, 1 (2022).
- [50] Kelly, P. L. et al. Flashlights: More than A Dozen High-Significance Microlensing Events of Extremely Magnified Stars in Galaxies at Redshifts z=0.7-1.5. arXiv e-prints arXiv:2211.02670 (2022). 2211.02670.
- [51] Postman, M. et al. The Cluster Lensing and Supernova Survey with Hubble: An Overview. ApJS 199, 25 (2012). 1106.3328.
- [52] Cardelli, J. A., Clayton, G. C. & Mathis, J. S. The relationship between infrared, optical, and ultraviolet extinction. AJ 345, 245 – 256 (1989). URL http://adsabs.harvard.edu/doi/10.1086/167900.
- [53] Brammer, G. B., Dokkum, P. G. v. & Coppi, P. EAZY: A Fast, Public Photometric Redshift Code. ApJ 686, 1503 – 1513 (2008). URL http://adsabs.harvard.edu/abs/2008ApJ...686.1503B. 0807.1533.
- [54] Horne, K. An optimal extraction algorithm for CCD spectroscopy. PASP 98, 609 – 617 (1986). URL http://adsabs.harvard.edu/abs/1986PASP...98..609H.
- [55] Carnall, A. C., McLure, R. J., Dunlop, J. S. & Davé, R. Inferring the star formation histories of massive quiescent galaxies with BAGPIPES: evidence for multiple quenching mechanisms. MNRAS 480, 4379 – 4401 (2018). URL http://adsabs.harvard.edu/abs/2018MNRAS.480.4379C. 1712.04452.
- [56] Madau, P. & Dickinson, M. E. Cosmic Star-Formation History. ARA&A 52, 415 – 486 (2014). URL http://adsabs.harvard.edu/abs/2014ARA\%26A..52..415M. 1403.0007.
- [57] Chabrier, G. Galactic Stellar and Substellar Initial Mass Function. PASP 115, 763 – 795 (2003). URL http://adsabs.harvard.edu/abs/2003PASP..115..763C.
- [58] Alavi, A. et al. ULTRA-FAINT ULTRAVIOLET GALAXIES AT z 2 BEHIND THE LENSING CLUSTER A1689: THE LUMINOSITY FUNCTION, DUST EXTINCTION, AND STAR FORMATION RATE DENSITY**Some of the data presented herein were obtained at the W. M. Keck Observatory, which is operated as a scientific partnership among the California Institute of Technology, the University of California and the National Aeronautics and Space Administration. The Observatory was made possible by the generous financial support of the W. M. Keck Foundation. The Astrophysical Journal 780, 143 (2014). URL http://adsabs.harvard.edu/abs/2014ApJ...780..143A. 1305.2413.
- [59] Cappellari, M. Full spectrum fitting with photometry in ppxf: non-parametric star formation history, metallicity and the quenching boundary from 3200 LEGA-C galaxies at redshift . MNRAS submitted (2022). 2208.14974.
- [60] Wang, X. et al. The Mass–Metallicity Relation at Cosmic Noon in Overdense Environments: First Results from the MAMMOTH-Grism HST Slitless Spectroscopic Survey. The Astrophysical Journal 926, 70 (2022). 2108.06373.
- [61] Wang, X. et al. Early Results from GLASS-JWST. IV. Spatially Resolved Metallicity in a Low-mass z 3 Galaxy with NIRISS* *Based on observations acquired by the JWST under the ERS program ID 1324 (PI T. Treu). The Astrophysical Journal Letters 938, L16 (2022).
- [62] Valentino, F. M. et al. Predicting emission line fluxes and number counts of distant galaxies for cosmological surveys. MNRAS 472, 4878 – 4899 (2017). URL http://adsabs.harvard.edu/abs/2017MNRAS.472.4878V. 1709.01936.
- [63] Maiolino, R. et al. AMAZE. I. The evolution of the mass-metallicity relation at z > 3. A&A 488, 463 – 479 (2008). URL http://adsabs.harvard.edu/cgi-bin/nph-data\_query?bibcode=2008A\%26A...488..463M\&link\_type=EJOURNAL.
- [64] Kennicutt, R. C. J. Star Formation in Galaxies Along the Hubble Sequence. ARA&A 36, 189 – 232 (1998). URL http://adsabs.harvard.edu/abs/1998ARA\%26A..36..189K.
- [65] Mehta, V. et al. A spatially resolved analysis of star-formation burstiness by comparing UV and H in galaxies at z1 with UVCANDELS. arXiv e-prints arXiv:2211.02056 (2022). 2211.02056.
- [66] Okabe, T. et al. Shapes and alignments of dark matter haloes and their brightest cluster galaxies in 39 strong lensing clusters. Monthly Notices of the Royal Astronomical Society 496, 2591–2604 (2020). 2005.11469.
- [67] Caminha, G. B. et al. Strong lensing models of eight CLASH clusters from extensive spectroscopy: accurate total mass reconstructions in the cores. arXiv (2019). 1903.05103.
- [68] Navarro, J. F., Frenk, C. S. & White, S. D. M. A Universal Density Profile from Hierarchical Clustering. ApJ 490, 493 – 508 (1997). URL http://adsabs.harvard.edu/abs/1997ApJ...490..493N. astro-ph/9611107v4.
- [69] Kawamata, R. et al. Size–luminosity relations and UV luminosity functions at $z=6-9$ simultaneously derived from the complete Hubble Frontier Fields data. eprint arXiv:1710.07301 (2017). URL http://adsabs.harvard.edu/abs/2017arXiv171007301K. 1710.07301.
- [70] Peng, C. Y., Ho, L. C., Impey, C. D. & Rix, H.-W. Detailed Structural Decomposition of Galaxy Images. AJ 124, 266–293 (2002). astro-ph/0204182.