Magnetic outbreak associated with exploding granulations
Abstract
Diagnosing the spatial-temporal pattern of magnetic flux on the Sun is vital for understanding the origin of solar magnetism and activity. Here, we report a new form of flux appearance, magnetic outbreak, using observations with an extremely high spatial resolution of 0.16 arcsec from the 1.6-m Goode Solar Telescope (GST) at the Big Bear Solar Observatory. Magnetic outbreak refers to an early growth of unipolar magnetic flux and its later explosion into fragments, in association with plasma upflow and exploding granulations; each individual fragment has flux of 1016-1017 Mx, moving apart with velocity of 0.5-2.2 km/s. The magnetic outbreak takes place in the hecto-Gauss region of pore moats. In this study, we identify six events of magnetic outbreak during 6-hour observations over an approximate 4040 arcsec2 field of view. The newly discovered magnetic outbreak might be the first evidence of the long-anticipated convective blowup.
1 Introduction
The appearance of magnetic flux on the solar surface manifests a fundamental process that energizes solar atmosphere and leads to solar eruptions(e.g., Magara & Longcope 2003; Guglielmino et al. 2010). Flux appearance signifies the physical interaction between plasma motion and generated magnetic fields. For the past century, observations have shown that magnetic flux emerges in a bipolar form on the Sun, from the strong field regime, e.g., in active regions, to the weak field regime and even in internetwork regions (Schrijver & Zwaan 2000; Cheung et al. 2010; Stein et al. 2011; Wang et al. 2012). However, an exception to this is moving magnetic features (MMFs), which have drawn intense attention in the solar physics community (Sheeley 1969; Harvey & Harvey 1973); MMFs do not typically exhibit the evolutionary pattern of an emerging flux region, i.e., the systematic growth and separation of opposite polarities, although Type I MMFs do appear in bipoles (Wilson 1986; Spruit et al. 1987; Thomas et al. 2002; Zhang et al. 2003). Type II and III MMFs, however, are unipolar magnetic features (Shine & Title 2000).
In the past years, a number of small-scale flux emergence events occurring at mesogranular scale and granular scale have been studied. Observations show that the exploding granule (EG) is associated with the flux emergence occurring at mesogranular scale (Goglielmino et al. 2020), and contributes to organize the discrete magnetic field (e.g., Roudier et al. 2016; Malherbe et al. 2018; Roudier et al. 2020). Granule-covering magnetic sheet-like structures in the quiet Sun have been found by the observations (Centeno et al. 2017; Fischer et al. 2019) and the numerical simulations (Moreno-Insertis et al. 2018). Furthermore, the appearance of unipolar features in internetwork (IN) flux has been observed (Goi et al. 2022).
Based on magnetic observations with extremely high-spatial resolution, we find a new magnetic phenomenon with unipolar form: magnetic outbreak. This phenomenon is found in pore moats - the same magnetic environment as MMFs. In this paper, we will present our new findings in detail. Observations and data analysis are presented in Section 2, and in Section 3, we give a detailed description of the magnetic outbreak phenomenon. We discuss our revelation in the context of previous findings and provide some possibilities to explain the new observation in Section 4, and conclusions are made in Section 5.
2 Observations and data analysis
Extremely high spatial resolution observations of NOAA active region (AR) 12579 on 25 August 2016 were achieved by the 1.6-m Goode Solar Telescope (GST; Goode & Cao 2012; Cao et al. 2010). The observations were made with the Near InfraRed Imaging Spectropolarimeter (NIRIS; Cao et al. 2012, 2022) over the 1.56 Fe I line at the Big Bear Solar Observatory (BBSO), and have high spatio-temporal resolution: approximate 57 km/pixel and 41s cadence. NIRIS produces full spectropolarimetric measurements , , , and (Stokes profiles) at a spectral resolution of 0.01 nm, with a typical range of -0.32 nm to +0.31 nm from the line center. Broadband TiO images centralized at 705.7 nm were obtained with a high spatial resolution of 25 km/pixel and temporal resolution of 15 s at BBSO. Images and magnetograms from the Solar Dynamics Observatory (SDO; Pesnell 2012) were also used for coordinative data analysis.
Each NIRIS data sample (pixel) is comprised of Stokes profiles taken at 55 spectral points. The rms fluctuation of the spectral continuum is 0.11% in the Stokes and spectra, and 0.09% in the Stokes spectrum. The NIRIS data undergoes Stokes inversion based on the Milne-Eddington atmospheric model (Ahn et al. 2016), through which several physical parameters, including vector magnetic field and Doppler shift, have been obtained. The magnetic signal as low as 4 G can be detected for the line-of-sight field. The accuracy of the resulted vector field data reaches 10 G for line-of-sight component and 100 G for transverse component (Wang et al. 2017). In addition, the inverted Doppler velocity is calibrated by setting the average Doppler velocity of the very quiet region to be zero.
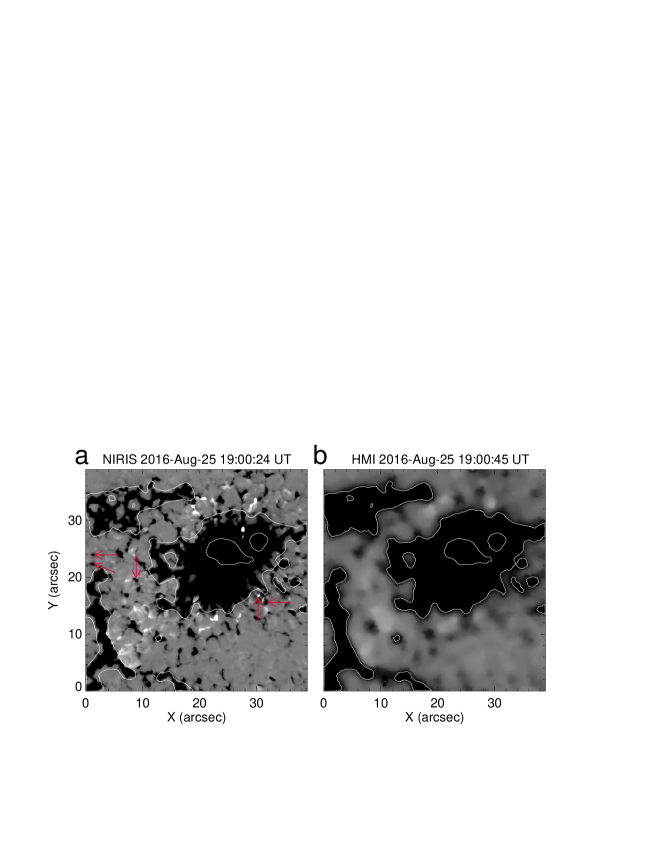
The NIRIS line-of-sight magnetic observations are compared with magnetic measurements from the Helioseismic and Magnetic Imager (HMI; Scherrer et al. 2012) instrument onboard SDO. HMI enables magnetic observations with a pixel size of 362 km and cadence of 45 s. The compared magnetograms are shown in Fig.1. We can see similarity in the larger-scale magnetic structures between the NIRIS and HMI magnetograms, and more fine-scale structures in NIRIS magnetic observations due to higher spatial resolution. We further compare the magnetic flux of the main magnetic structures, which are outlined in white in Fig.1, and obtain a flux measurement ratio of 1.2 between NIRIS and HMI. A few magnetic elements indicated by arrows in the NIRIS magnetogram are completely missing in the HMI magnetogram. This illustrates the advantage of using NIRIS observations for exploring small-scale magnetic evolution on the solar surface (Wang et al. 2017), and small-scale magnetic structures can only be revealed via high spatial resolution (Jin & Wang 2019).
3 Magnetic outbreak phenomenon
Approximately 6-hour continuous observations from 16:36 UT to 22:16 UT were taken of the negative polarity region of AR 12579. The negative magnetic region mainly consists of two pores indicated by the black arrows in Fig. 2b. We identify six events of magnetic outbreak during the observations; the locations of these events are distributed in the moats of pores, which are framed in Fig.2a and 2b. The primary properties of magnetic outbreak are listed in Table 1. In this table, the foreshortening effect may affect the values of line-of-sight magnetic component, because the observation is not acquired at disk center. However, considering the quieter magnetic environment of these outbreak events and the larger errors from the transverse field, the foreshortening effect is not corrected in this study.
| Event | Appearing | Maxflux | Ending | Lifetime | Flux | LOS | Transverse | VelocitybbThe velocity is obtained by two methods, i.e., the time-slit of magnetogram and FLCT. A continuous observation, during which the exploding phase occurs, is adopted to obtain the velocity based on the FLCT method. The used FOVs for FLCT are labeled by square frames in Fig.2 for the six outbreak events. |
|---|---|---|---|---|---|---|---|---|
| No. | time(UT) | time(UT) | time(UT) | (min) | (Mx) | fieldaaBoth LOS field and transverse field mean the magnetic flux density of outbreak events.(G) | fieldaaBoth LOS field and transverse field mean the magnetic flux density of outbreak events.(G) | (km s-1) |
| 1 | 19:50 | 20:04 | 21:16 | 86 | 1.1e19 | 107 | 317 | 1.3/0.7 |
| 2 | 19:30 | 19:43 | 20:27 | 57 | 3.0e18 | 85 | 245 | 0.6/0.8 |
| 3 | 21:27 | 21:54 | after 22:16 | 1.2e19 | 60 | 172 | 1.2/0.5 | |
| 4 | 17:58 | 18:21 | 18:57 | 64 | 5.3e18 | 68 | 180 | 1.1/0.5 |
| 5 | 19:43 | 19:48 | 20:15 | 32 | 1.4e18 | 40 | 151 | 2.2/0.6 |
| 6 | 20:41 | 21:00 | 21:58 | 77 | 3.4e18 | 50 | 199 | 0.5/0.9 |
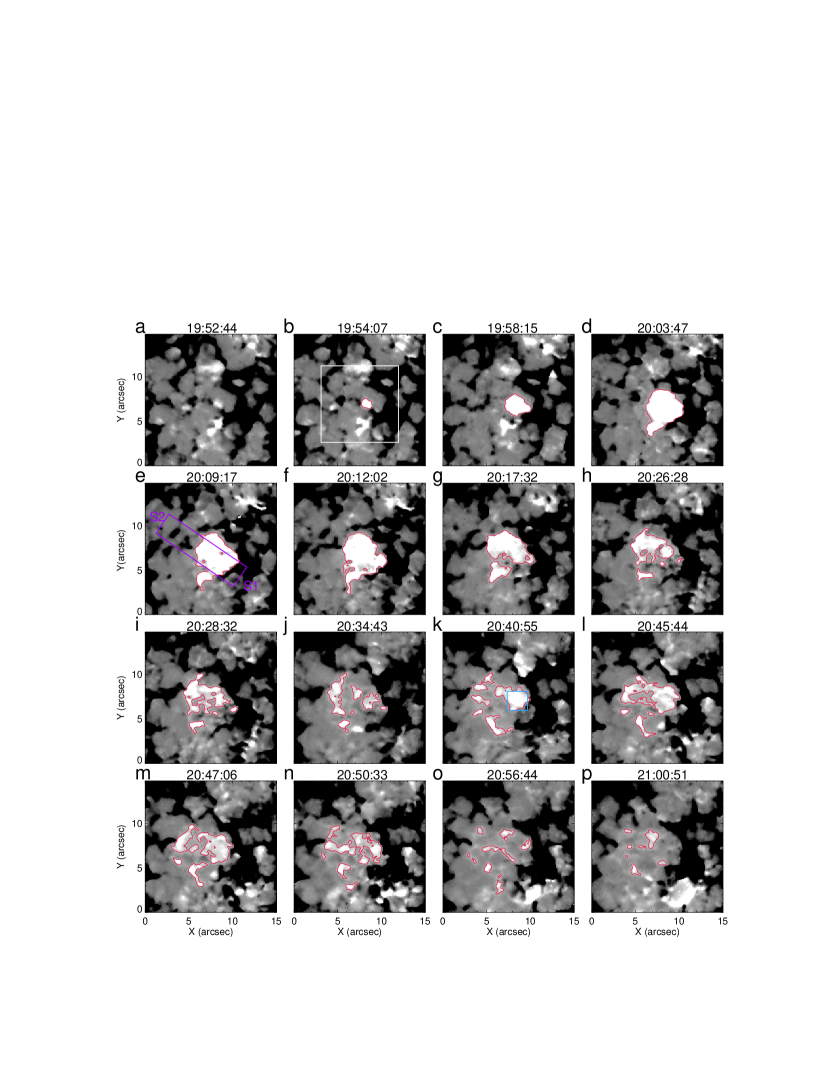
Event 1 (labeled ”1” in Fig.2) is a typical event of magnetic outbreak with relatively longer duration and larger magnetic flux, and thus, is worthy of a detailed discussion. Event 1 takes place in a cell region of mesogranular size (November et al. 1981). The process of magnetic outbreak consists of three phases: the growing phase, the exploding phase, and the fading phase, all of which are shown in Fig.3. The detailed evolution within the three phases is described below.
-
•
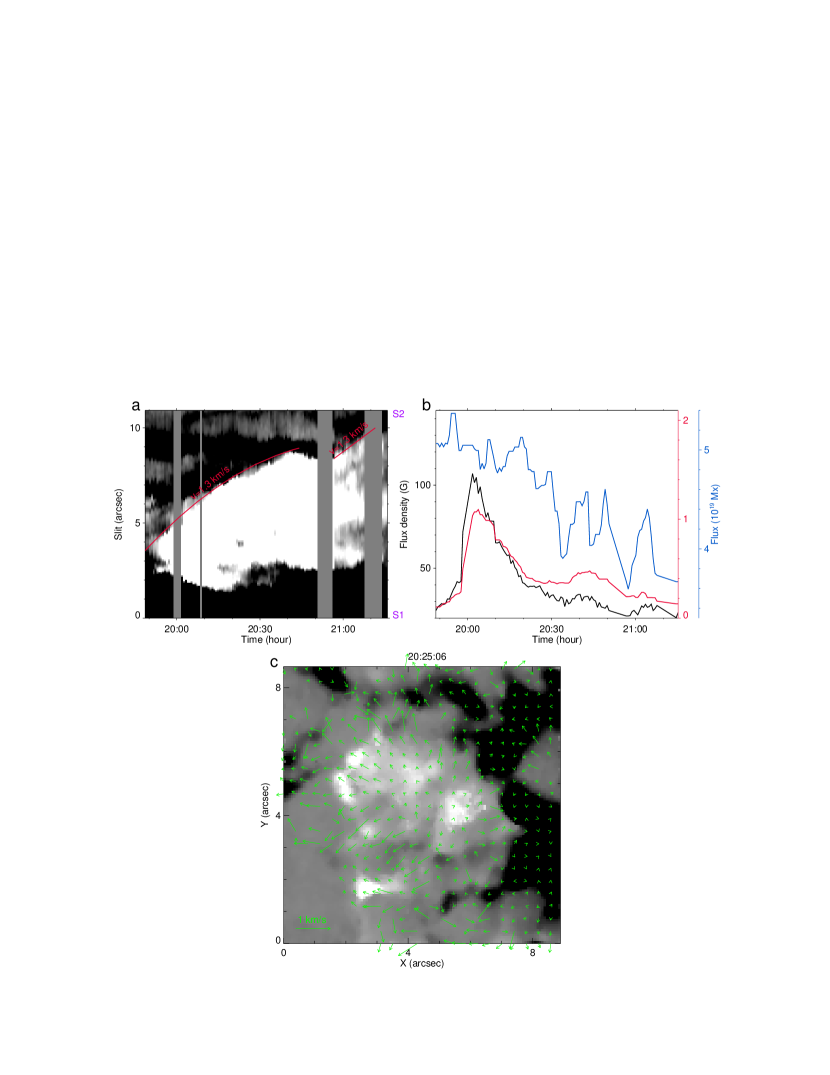
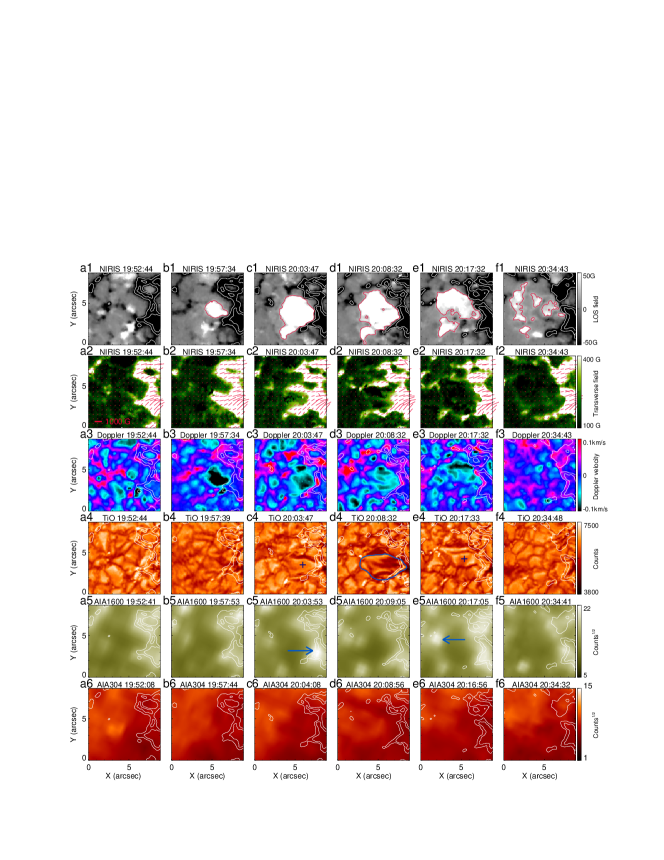
The growing phase. Starting around 19:50 UT, a lump of positive magnetic flux appears and grows, reaching a maximum flux density of 107 G at about 20:02 UT. This growing phase is characterized by the rapid increase of both total flux and flux density (see Fig.4). In this period, the positive flux keeps its center position unchanged (see Fig.3), while its area expanded. The flux gradually increases to 1.1 1019 Mx at about 20:04 UT; meanwhile there is no corresponding increase of negative flux (see Fig.4). Furthermore, the transverse field emerges and develops in this period, and its density reaches 317 G around 20:02 UT, which reveals a highly inclined field of the event (see Fig.5). The growth of positive flux is accompanied by concentrated blue shifts in NIRIS Dopplergrams, indicating an updraft of -0.1 km/s (see Fig.5). Moreover, an EG (Musman 1972; Rempel 2018; Roudier et al. 2020; Guglielmino et al. 2020) appears around 20:00 UT, right after the early flux growth. The EG grows to mesogranulation-scale at approximate 20:08 UT; another EG then appears in the dark notch of the former (shown by the ’+’ in Fig.5). In this growth period, transient brightening is found in the upper photosphere, but there is no obvious response in the chromosphere (see Fig.5).
-
•
The exploding phase. Around 20:12 UT, the positive flux begins to split into many fragments which move apart with an average velocity of 1.3 km/s, looking like an exploding bomb (see Fig.3). Furthermore, the velocity distribution acquired by the Fourier local correlation tracking (FLCT: Fisher & Welsch 2008) method also displays the exploding property, which is shown in the bottom panel of Fig.4. Here, the width of the Gaussian windowing function for FLCT method adopts 15 pixels size, i.e, 1.2 arcsec. At about 20:34 UT, the main explosion completes, and the positive flux fragments can be seen marking the explosion fronts, while we also see ordinary granulations and calming of plasma upflows (see Fig.5). In this process, the flux density and magnetic flux of the positive flux gradually decreases (see Fig.4). Interestingly, a secondary or subsequent outbreak is observed in a subset window (framed in Fig.3k), and its explosion fronts are outlined by exploding fragments of the positive flux. For this secondary outbreak, the total flux reaches a maximum of 1.5 1018 Mx at about 20:43 UT (see Fig.4). The same type of secondary magnetic outbreak is also observed in Event 2.
-
•
The fading phase. The process lasts until 21:16 UT, when all the flux fragments in the primary and secondary outbreaks disappear. These explosion fragments either cancel with the surrounding negative field or diffuse to levels below the magnetic noise.
We refer to the whole process - from the first appearance of unipolar positive flux to the disappearance of the exploding fragments - as ”magnetic outbreak” in this study. We note that the ambient enhanced network is forced to decay and move farther from the pores during magnetic outbreak (see Fig.3).
Only for the third among the six events, observations are truncated due to bad weather during the late fading phase. All of the magnetic outbreak events take place in the moats of pores, and they share a few key properties: 1) appearance of unipolar positive magnetic flux with hecto-G flux density, which is accompanied by plasma upflow; 2) increase in both magnetic flux and flux density during the positive flux growth, without in-phase changes of negative flux; 3) eruption of EGs during the flux growing and exploding phases; and 4) weak transient brightening appearing at the border between the positive flux and the enhanced negative network in the upper photosphere, without chromospheric correspondence in radiation.
4 Discussion
4.1 The resemblances and differences of magnetic outbreak with previous findings
Magnetic outbreak displays many similarities with MMFs, in view of its relation to pore/spot moats, spatial size, flux level, and moving velocity. It is worth noting that the non-uniform magnetic explosion results in an apparent outflow of flux elements in the moat, which can be seen in lower resolution observations. We see Event 1 in the time sequence of 12 arcsec resolution HMI magnetograms (see Fig.3 Movie), which looks like Type III MMFs, i.e., outflowing magnetic features with polarity opposite to the parent pore. On the other hand, in the GST/NIRIS magnetograms many Type III MMFs are observed, but they never exhibit an exploding nature (Li et al. 2019). Therefore, magnetic outbreak seems to unfit the scenario of MMFs.
We carefully checked the magnetic and velocity observations, and considered all the possibilities and, in particular, whether or not the observations fit in an already known ’family’ in published literature, e.g., Moreno-Insertis et al. (2018), Guglielmino et al. (2020), Roudier et al. (2020), etc. The answer is not exactly. First, the magnetic outbreak is not a phenomenon within a granule, but takes place in the interior of the enhanced network at mesogranular scale. Plasma up-flow plays a role in triggering the EGs and the later magnetic explosion (see the Dopplegrams and granule images in Fig.5), similar to that described by Guglielmino et al. (2020). Secondly, the magnetic outbreak is not related to the IN horizontal elements (Lites et al. 2008). Jin et al. (2009) is the first to classify the IN horizontal elements into two classes - one class is associated to a pair of line-of-sight elements, representing a small-scale loop emergence; the other is isolated from line-of-sight elements. However, their studied horizontal IN elements does not show eruptive behavior. Thirdly, the field configuration of magnetic outbreak is not like the horizontal flux sheets covering a whole granule by the simulation (Moreno-Insertis et al. 2018) and the horizontal sheet emergence followed by basically the bipolar appearance in the observation (Fischer et al. 2019). The well-organized inclined fields in outbreak events are manifested by prevailing positive line-of-sight flux and stronger transverse field with connection to the surrounding negative network. Fourthly, our observations demonstrate a convective instability initiated with updraft of plasma, which leads to the explosion in the studied magnetic outbreak. In these events, the enhanced network might play some role in penetrating radiation to heat its interior which was initiating the instability. To our knowledge, the convective instability triggered by plasma upward motion has not been previously described in the existing literature.
4.2 How do we understand the observed magnetic outbreak?
The observed magnetic outbreak raises several interesting questions, such as why we only see the growth of uniform positive flux, what is the basic magnetic topology which serves as the magnetic outbreak, what physics stands behind the observations?
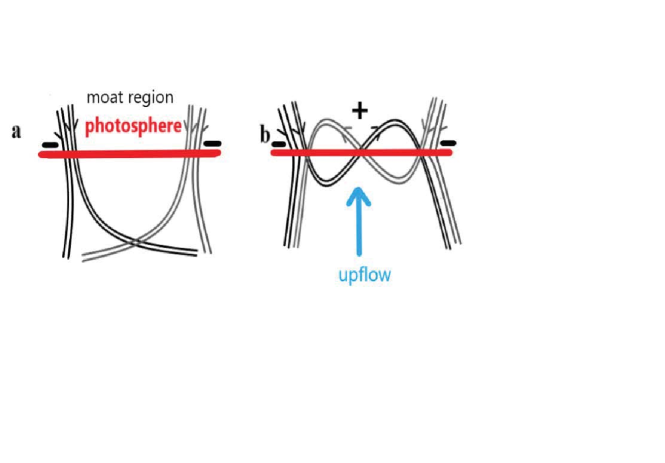
We tentatively propose the magnetic topology gestated the magnetic outbreak, which could be simplified as a U-loop with an open bottom as seen in the sketch in Fig.6. The strong vertical field at the network boundary likely connects a reservoir of horizontal field underneath the solar surface at a depth between the bottoms of mesogranulation and supergranulation(Rempel & Cheung 2014; Cheung et al. 2007). The overall magnetic configuration is quite similar to U-loops in the literature (Wilson 1989), except for its open bottom. Penetration from lateral radiation would result in the temperature rise, causing the plasma to flow upward (see Schrijver & Zwaan 2000), which stretches the horizontal magnetic strands. As a net result of many such up-stretched field lines, we would see the appearance of equivalent unipolar flux with positive polarity. Moreover, by the tension force of stretched field, the emerged magnetic flux should be strongly inclined. In other words, one would see the inclined flux with unipolar positive flux and strong horizontal field component connecting to the negative network.
In contrast to the well-known convective collapse, as soon as a convective instability occurs in the upflow with the field, the initial updraft would be enhanced and the flux tube expands. As a result of this increased instability, the flux tube would be torn to shreds and the plasma returns to a normal convective state (Spruit & Zweibel 1979; Spruit 1979; Schrijver & Zwaan 2000). The convective blowup of magnetic tube was predicted more than 40 years, but it has never been observed. Observations with the extremely high spatial resolution and good polarization sensitivity from GST might enabled us to report the first apparent evidence of convective blowup.
The observed magnetic outbreak has vividly illustrated the generally physical picture of convective blowup. The most striking characteristics in the observed magnetic outbreak are the coinciding plasma upflow and flux explosion. We seem to witness the convective instability in plasma upflow and the real-time blowup of magnetic flux. In addition, the observations have shown how the rapid development of plasma upflow results in EGs. The EGs appear to be involved in convective blowup. It is convective instability that conducts the magnetic outbreak.
The identified magnetic outbreak in this study takes place in the fading phase of AR 12579. The six outbreak events have a total flux of about 3.61019 Mx, which is approximately 11% of the total flux loss in the parent pore region. This is indicative that convective blowup plays a role in the removal of magnetic flux from the pore region. We consider the conjugated convective collapse and blowup to play key role in shaping the spatiotemporal pattern, followed by vigorous flux emergence and cancelation. The former creates various strong field structures, and the latter transforms the magnetic flux from the strong field realm to the weak field reservoir.
5 Conclusion
Based on high spatial resolution observations from the 1.6-m GST at BBSO, we find a new form of flux appearance, i.e., magnetic outbreak, in the hecto-Gauss region of pore moats. Rapid emergence, explosion, and final dissipation constitutes the whole process of magnetic outbreak. Magnetic outbreak is associated with plasma upflows and EGs, and results in weak transient brightening in the upper photosphere, without chromospheric correspondence in radiation. During 6-hour observations, six events of magnetic outbreak were identified in an approximate 40 arcsec field of view in the negative polarity region of AR 12579; their magnetic fluxes ranged from 1018 Mx to 1019 Mx, and their lifetime was around an hour. The velocity of their exploding fragments reached 2.2 km/s. The newly-observed magnetic outbreak vividly describes the physical picture of convective blowup of flux tube, and might provides the first evidence of the long-expected convective blowup.
References
- (1) Ahn, K., Cao, W. D., Shumko, S., & Chae, J. C., 2016, SPD meeting 47
- (2) Cao, W., Gorceix, N., Coulter, R., et al., 2010, Astron. Nachr. 331, 636-639
- (3) Cao, W., Goode, P. R., Ahn, K., et al., 2012, Astron. Soc. P. 463, 291-299
- (4) Cao, W., Yurchyshyn, V., Yang, X., et al. 2022, Proc. SPIE, 12184
- (5) Centeno, R., Blanco Rodrguez, J., Del Toro Iniesta, J. C., et al., 2017, ApJS, 229, 3-14
- (6) Cheung, M. C. M., Rempel, M., Title, A. M., & Schussler, M.,2010, ApJ, 720, 233-244
- (7) Cheung, M. C. M., Schussler, M., & Moreno-Insertis, F., 2007, A&A, 467, 703-719
- (8) Fischer, C. E., Borrero, J. M., Bello Gonzlez, N., & Kaithakkal, A. J., 2019, A&A, 622, L12-16
- (9) Fisher, G. H., & Welsch, B. T., 2008, ASP Conference Series, 383, 373-380
- (10) Goode, P. R., & Cao, W., 2012, in SPIE Proceedings, 8444, id.844403
- (11) Goi, M., Bellot Rubio, L. R., Cheung, M. C. M., et al., 2022, ApJ, 925, 188-199
- (12) Guglielmino, S. L., Bellot Rubio, L. R., Zuccarello, F. et al. 2010, ApJ, 724, 1083-1098
- (13) Guglielmino, S. L., Pillet, V. M., Cobo B. R., et al. 2020, ApJ, 896, 62-80
- (14) Hagennar, H. J., 2001, ApJ, 555, 448-461
- (15) Harvey, K., & Harvey, J.,1973, Sol. Phys., 28, 61-71
- (16) Jin, C. L., Wang, J. X., Song, Q., & Zhao, H., 2011, ApJ, 731, 37-45
- (17) Jin, C. L., Wang, J. X., & Zhao, M., 2009, ApJ,690, 279-287
- (18) Jin, C. L., & Wang, J. X., 2019, RAA, 19, 69-82
- (19) Li, Q., Deng, N., Jing, J., et al. 2019, ApJ, 876, 129-137
- (20) Lites, B. W., Kubo, M., Socas-Navarro, H., et al. 2008, ApJ, 672, 1237-1253
- (21) Liu, Y., Zhao, X. P., & Hoeksema J. T., 2004, Sol. Phys., 219, 39-53
- (22) Magara, T. & Longcope, D. W., 2003, ApJ, 586, 630-649
- (23) Malherbe, J. M., Roudier, T., Stein, R., & Frank, Z., 2018, Sol. Phys., 293, 4-22
- (24) Moreno-Insertis, F., Martinez-Sykora, J., Hansteen, V. H., & Muoz, D., 2018, ApJ, 859,L26-32
- (25) Musman, S., 1972, Sol. Phys., 26, 290-298
- (26) November, L. J., Toomre, J., Gebbie, K. B., & Simon, G. W., 1981, ApJ, 245, L123-L126
- (27) Pesnell, W. D., Thompson, B. J., & Chanberlin, P. C. 2012, Sol. Phys., 275, 3-15
- (28) Rempel, M., 2018, ApJ, 859, 161-177
- (29) Rempel, M., & Cheung, M. C. M., 2014, ApJ, 785, 90-106
- (30) Roudier, T., Malherbe, J. M., Rieutord, M., & Frank, Z., 2016, A&A, 590, 121-131
- (31) Roudier, T., Malherbe, J. M., Gelly, B., et al., 2020, A&A, 641, 50-59
- (32) Scherrer, P. H., Schou, J., Bush, R. I., et al., 2012, Sol. Phys., 275, 207-227
- (33) Schrijver, C., & Zwaan, C., 2000, New York: Cambridge Univiersity Press
- (34) Sheeley, N. R., Jr., 1969, Sol. Phys., 9, 347-357
- (35) Shine, R., & Title, A., 2000, Bristol: Institute of Physics Publishing
- (36) Spruit, H. C., & Zweibel, E. G., 1979, Sol. Phys., 62, 15-22
- (37) Spruit, H. C., 1979, Sol. Phys., 61, 363-378
- (38) Spruit, H. C., Title, A. M., & van Ballegooijen, A. A., 1987, Sol. Phys., 110, 115-128
- (39) Stein, R. F., Lagerfjard, A., Nordlund, A., & Georgobiani, D., 2011, Sol. Phys., 268, 271-282
- (40) Thomas, J. H., Weiss, N. O., Tobias, S. M., & Brummell, N. H., 2002, Nature, 420, 390-393
- (41) Wang, J. X., Zhou, G. P., Jin, C. L., & Li, H., 2012, Sol. Phys., 278, 299-322
- (42) Wang, H. M., Liu, C., Ahn, K., et al. 2017, Nat. Astron. 1, 0085
- (43) Wilson, P. R., 1986, Sol. Phys., 106, 1-28
- (44) Wilson, P. R., 1989. Society of Australia Proce. 8, 32-37
- (45) Zhang, J., Solanki, S. K., & Wang, J. X., 2003, A&A, 399, 755-761