Water Dynamics around T0 vs. R4 of Hemoglobin from Local Hydrophobicity Analysis
Abstract
The local hydration around tetrameric Hb in its T0 and R4 conformational substates is analyzed based on molecular dynamics simulations. Analysis of the local hydrophobicity (LH) for all residues at the and interfaces, responsible for the quaternary TR transition, which is encoded in the MWC model, as well as comparison with earlier computations of the solvent accessible surface area (SASA), makes clear that the two quantities measure different aspects of hydration. Local hydrophobicity quantifies the presence and structure of water molecules at the interface whereas “buried surface” reports on the available space for solvent. For simulations with Hb frozen in its T0 and R4 states the correlation coefficient between LH and buried surface is 0.36 and 0.44, respectively, but it increases considerably if the 95 % confidence interval is used. The LH with Hb frozen and flexible changes little for most residues at the interfaces but is significantly altered for a few select ones, which are Thr41, Tyr42, Tyr140, Trp37, Glu101 (for T0) and Thr38, Tyr42, Tyr140 (for R4). The number of water molecules at the interface is found to increase by % for T0R4 which is consistent with earlier measurements. Since hydration is found to be essential to protein function, it is clear that hydration also plays an essential role in allostery.
1 Introduction
Hydration is important for protein function. It has been reported that
at least one monolayer of water is required for a protein to
function.1 The properties of solvent water near the
protein surface have been characterized experimentally - by nuclear
magnetic resonance (NMR), quasi inelastic neutron
scattering2 and Mössbauer
spectroscopy3 and computationally with molecular
dynamics (MD)
simulations.4, 5, 6, 7, 8, 9
In the crowded cellular environment, the average separation of
macromolecules is of the order of 10 Å, which corresponds to only
layers of water molecules. From the NMR experiments and MD
simulations it was found that the reorientation dynamics of water on
the protein surface is slowed down by a factor of 2 to 3 compared with
water in the bulk. It is notable that although it has been known for
almost 60 years10 that the dynamics of water adjacent
to a macromolecule differs from that in the bulk, as of now only
little is known about the special properties of cellular
water.11
Hemoglobin (Hb), which is physiologically involved in oxygen (O2)
transport, is a widely studied protein for which a broad range of
molecularly resolved studies are available. The tetramer consists of
two homodimers and which are referred to as “subunit 1” (S1) and “subunit
2” (S2) in the following. Functionally most relevant are the two
endpoint structures T0 and R4 which correspond to the
ligand-free and fully ligand-bound proteins, respectively. The
monomer-monomer interfaces ( and )
do not change during the T0R4 transition whereas
the dimer-dimer interface changes appreciably due to what can be
described as a rotation of S1 versus S2, although the
actual transition is more complicated.5 The
quaternary structural transition is accompanied by a change in
exposure to hydration of residues lining the protein/solvent interface
and by a change in the solvent accessible surface area. This change in
solvent exposure is thought to contribute to the difference in
thermodynamic stability of the two conformational substates T0 and
R4.12
The change in solvent exposure is also of interest for the two
unligated forms T0 and R0. Experimentally, the T0 state was
found to be more stable than R0 by kcal/mol when 2,3-DPG
is bound to the tetramers,13 which is reduced to
kcal/mol without 2,3-DPG bound to HbA14.
This is in striking disagreement with a number of all-atom MD
simulations that reported unstable T0 structures on the hundreds of
ns time scale.7, 6 The role of solvent in
stabilizing one conformational substate over another one was already
noted about 50 years ago:15 “A larger surface area is
buried in deoxy- than in methemoglobin as a result of tertiary and
quaternary structure changes. [..] This implies that hydrophobicity
stabilizes the deoxy structure, the free energy spent in keeping the
subunits in a low-affinity conformation being compensated by
hydrophobic free energy due to the smaller surface area accessible to
solvent.” In other words, the “hydrophobic
effect”,15, 12 which arises from the
disruption of the bulk water hydrogen bond network around nonpolar
groups,16, 17 is likely to be a major driving
force underlying differential stabilization of T0 over R0 and
R4. The theoretical analysis of Chandler and
coworkers18, 19 indicated that for
large molecules, there was a "dewetting" phenomenon that stabilizes
compact (T-state) relative to more open (R-state) structures.
Since hydration is required for a protein to function, it is clear
that hydration is essential for the allosteric transition from T0
to R4 to occur. The active role water plays in biological processes
has been discussed previously for protein-ligand binding, in
particular. With its hydrogen bond-donor and acceptor capabilities,
individual water molecules are highly adaptable at interfaces. It has
been found that water can act as an extension to the protein
structure.20 At the host / water interface pronounced
density fluctuations can occur which manifest themselves in
time-varying occupational and orientational water dynamics. More
recently, MD simulations together with machine learning analyses have
been combined for a deeper understanding of water molecules at
protein-ligand interfaces.21, 22 As an example,
six ligands with an octa-acid calixarene host have been considered and
it was found that the relevant collective variables describing the
ligand-bound and the ligand-free state differ.22 For
the unbound state the solvation around the ligand to enter together
with the number of water molecules in the cavity had a large weight in
the machine-learned model. Conversely, for the bound state the number
of water molecules around the cavity entrance are more
important. These findings indicate that it is valuable to analyse
explicit water motion near biological interfaces for a better
understanding of biological function.
2 Results
The present work reports on the local hydrophobicity (LH) around Hb
from simulations of the dimer and tetramer of the T0 and R4 structures. The main
questions quantified more precisely than in our earlier
study9 concern a) the comparison of the local
hydrophobicities for rigid T0 and R4 in the MD simulations and
its relation to the analysis of the solvent accessible surface area
(SASA) by Lesk et al.;12 and b) changes in LH that
arise when the proteins are flexible in the MD simulations; and c) the
changes in LH between isolated dimers S1 and S2 compared with those
for the tetramers in the two conformational substates.
| Residue | Position | Positioned at |
|---|---|---|
| or Interface | ||
| Val1 | N-terminus | |
| Pro37 | 310-helix | ✓ |
| Thr38 | 310-helix | ✓ |
| Lys40 | 310-helix | ✓ |
| Thr41 | 310-helix | ✓ |
| Tyr42 | 310-helix | ✓ |
| Pro44 | Turn | ✓ |
| Thr134 | -helix | |
| Tyr140 | Turn | |
| Arg141 | C-Terminus | |
| Val1 | N-terminus | |
| Trp37 | 310-helix | ✓ |
| Pro100 | -helix | ✓ |
| Glu101 | -helix | ✓ |
| Asn139 | -helix | |
| Tyr145 | Turn | ✓ |
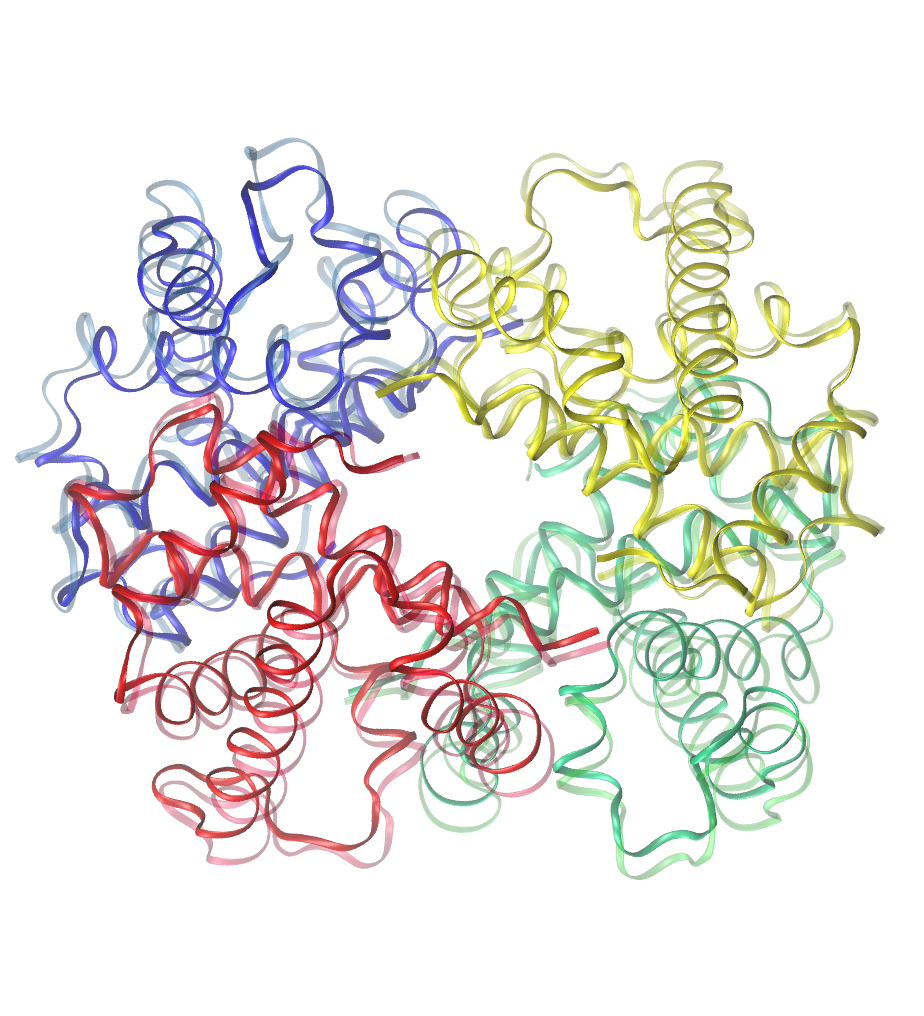
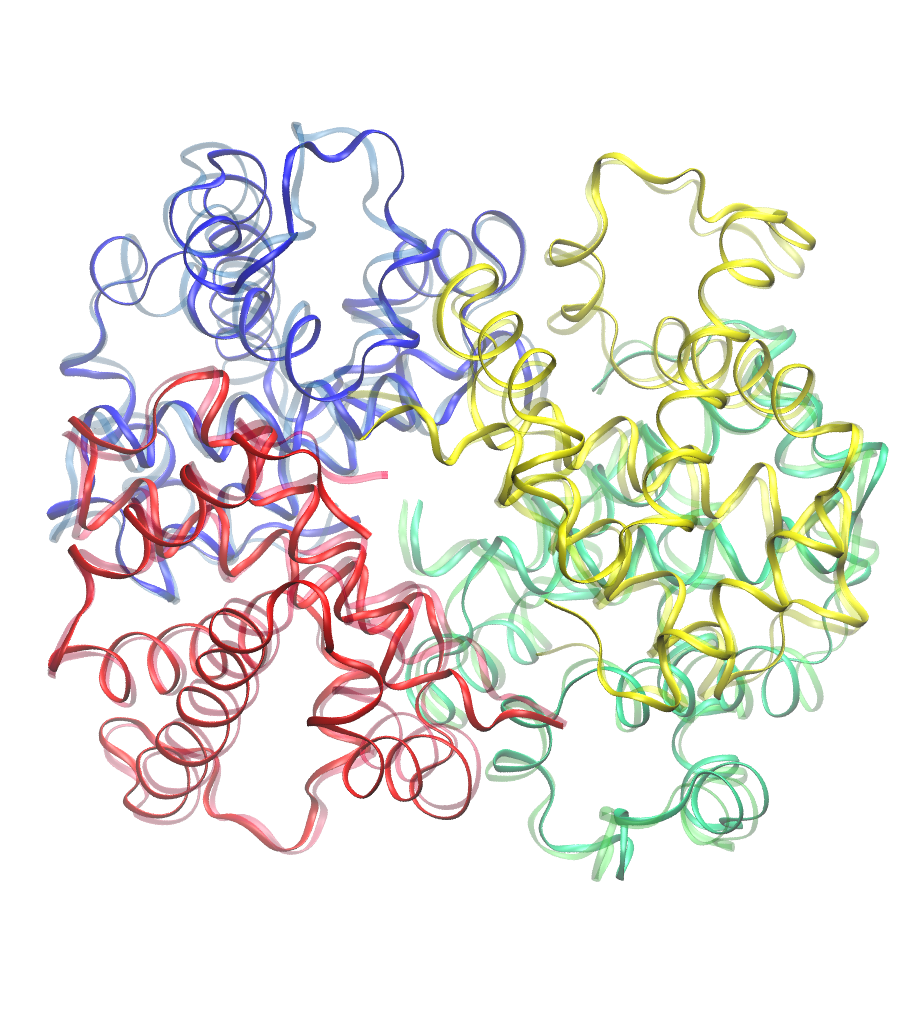
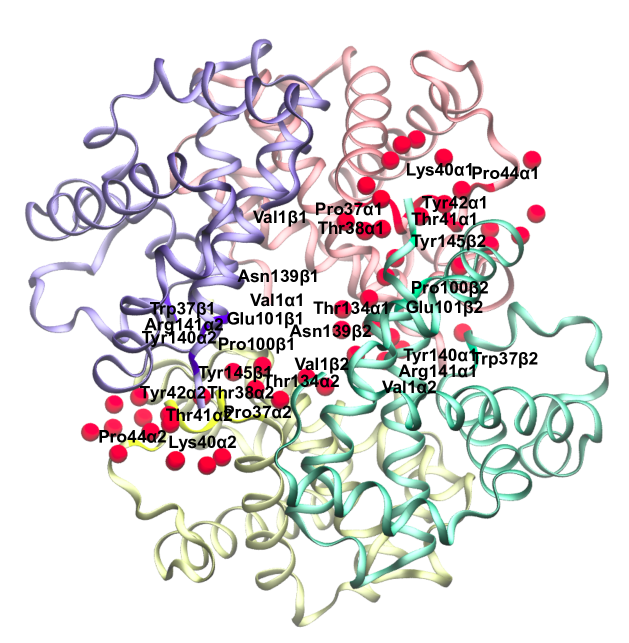
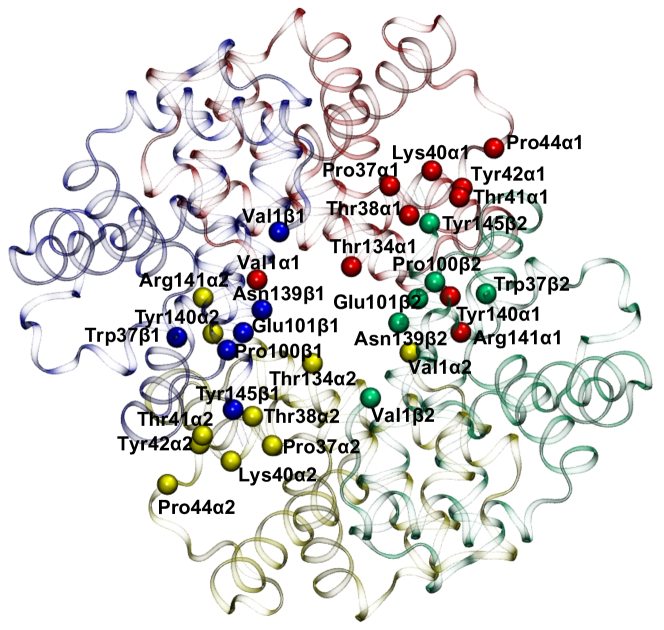
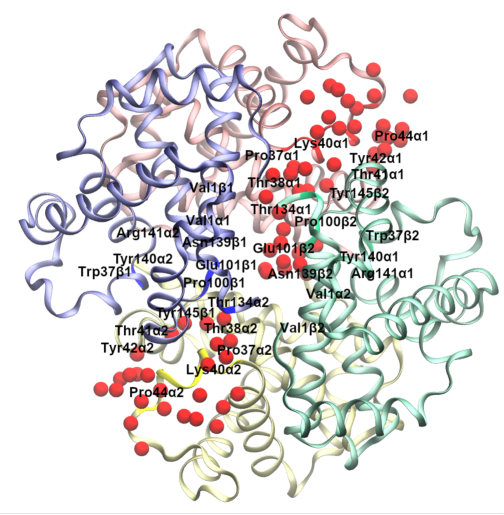
In accord with the analysis of Lesk et al.12 there
are 10 residues (Val1, Pro37, Thr38, Lys40, Thr41, Tyr42, Pro44,
Thr134, Tyr140, Arg141) that change significantly in solvent exposure
from buried to exposed in the subunit interface in the
transition between T and R states, and 6 residues (Val1, Trp37,
Pro100, Glu101, Asn139, Tyr145) in the subunit
interface12; see Figure 1 for the
structure and labelled residues. For these residues a) the buried
surface as per the analysis in the literature12 is
larger than 10 Å2 and b) the difference between the buried
surface for a given residue between the oxy and the deoxy structure
was found to be12 larger than 20 Å2. These
criteria were used to select residues for analysis because for the
present work the change in exposure between the two
conformational substates is of interest. The positions in the protein
of the residues at the and
interfaces are indicated in Table 1. Additional
residues that are of potential interest but were not included in the
analysis are Asp126, Lys139, Lys82,
Tyr145, and His146.
Water dynamics, which can be obtained from MD simulations, is used to
quantitatively determine the role of hydrophobicity in the T0 and
R4 states of Hb. For this purpose, the time-resolved displacements
of water molecules at the protein-solvent interface and the coupling
of these displacements with rearrangements in the protein subunits are
investigated.
Previously, the solvent exposure of buried and exposed interfacial
residues for T0 and R4 was analyzed by computing the solvent
accessible surface area (SASA) for the available X-ray structures and
was reported to correlate with protein stability.12
To probe water dynamics for the native state of the protein, and to
estimate the local hydrophobicity without the influence of the protein
conformational degrees of freedom, simulations in which the protein
degrees were fixed (“frozen”) were performed. Simulations in which
the protein degrees of freedom were not held fixed (“flexible’) were
also carried out; they include entropic contributions to local
hydrophobicity due to water disorder from the displacements of the
amino acids.
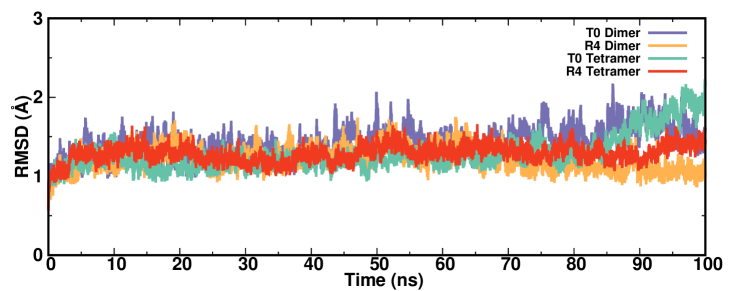
Figure 2 reports the root mean squared deviation (RMSD)
for the Cα atoms for flexible tetrameric T0 (cyan) and
R4 (red) together with that for S1 of T0 (blue) and R4
(orange). For the most part all RMSD values are well below 2 Å
except for occasional, short stochastic fluctuations for S1 of
T0. Overall, the fluctuations for the tetrameric systems are
smaller than those for the dimers, except between 90 and 100 ns, where
the T0 tetramer results are larger than those for the dimer. The
increase in RMSD for the T0 tetramer after ns is
reminiscent of earlier findings that depending on water box size the
T0 structure can become unstable.8 For the isolated
subunits (S1 or S2 in the present case) of human
tetrameric Hb it should be noted that there is no experimental
information on their thermodynamic stability. Simulations for a
separate subunit (S1 or S2) were carried out primarily to be able to
quantify changes between the local hydrophobicity and water exposure
for the subunits vs. the tetramer at the relevant association
interface. For rigid tetrameric and dimeric Hb these simulations are
well-defined whereas for the flexible subunits the
results cannot be independently validated vis-a-vis experiments and
need to be considered with caution. The T0 and R4 tetramer
structures were found to be stable in the Å3 box for
about 500 ns for T0 and no decay was reported for the R4
state.8
2.1 Local Hydrophobicity from Simulations with Rigid and Flexible Proteins
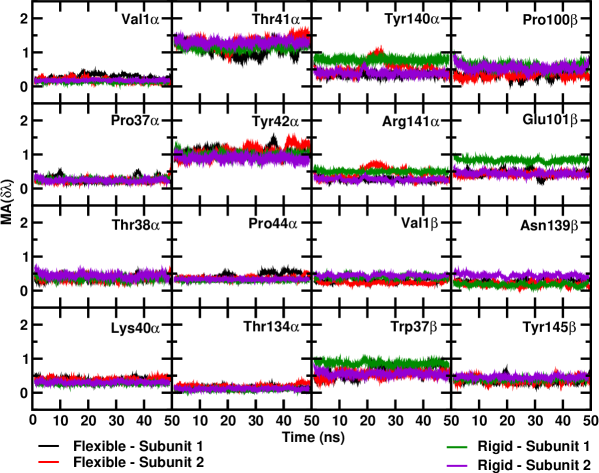
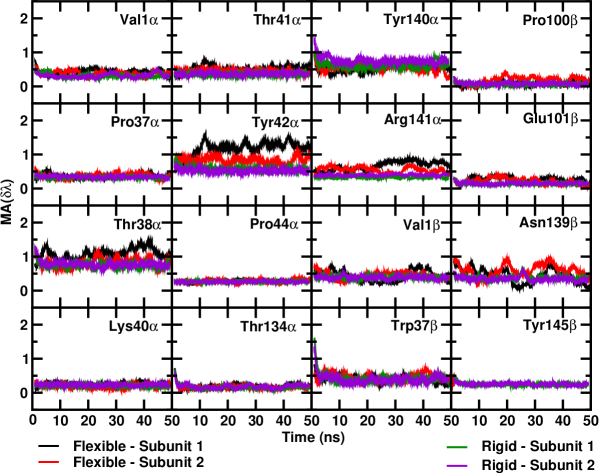
Results for LH of the residues studied for rigid and flexible
tetrameric T0 are reported in Figure 3 for S1
() in (green and black) and S2 ()
in (violet and red) from simulations 50 ns in length. The LH for
rigid and flexible tetrameric R4 are shown in Figure
S1. For the rigid tetramers the time series for many of
the S1 and S2 residues are nearly identical. This is particularly true
for R4 for which the only slight difference occurs for residue
Tyr140. For T0 more differences arise, including
Thr41, Tyr42, Tyr140, Arg141,
Trp37, Pro100, Glu101, and Asn139 which
reflect differences in the experimentally published structure of the
two subunits S1 and S2 for the two tetramers. The RMSD between S1 and
S2 for the Cα atoms is 0.32 Å for T0 (2DN2) and 0.001
Å for R4 (2DN3). For 2DN2 the differences between S1 and S2
arise from the random coils connecting the alpha helices. Hence, for a
symmetric tetramer with superimposing subunits S1 and S2 (R4)
LH and are nearly identical for symmetry-equivalent
residues whereas for slight structural differences between S1 and S2
(T0) some differences are observed.
For the flexible T0 tetramer (black and red traces for S1 and S2 in
Figure 3) it is noted that almost all residues have
near-identical average values for LH. This is even the case even for
residues for which LH differed for the rigid tetramer. Examples
include residues Tyr140, Arg141, Trp37,
Pro100, and Glu101. For these residues the dynamics
essentially “symmetrizes” the two dimers. Two classes of residues
can be distinguished: those for which the average for the
rigid and the flexible tetramer is nearly the same and others for
which the average differs due to the dynamics. Residues for which the
average hydrophobicity for rigid and flexible tetramer is equal,
include Val1, Pro37, Thr38, (Lys40),
Thr134, and Tyr145. For Thr41, Tyr42,
Glu101, and Asn139 the differences between rigid and
flexible tetramers are particularly large. They can reach values of up
to 0.5 units for LH. Typically, including dynamics leads to a shift
towards lower values of LH (less hydrophilic); examples are
Tyr140, Arg141, Trp37, and Glu101.
The differences between rigid and flexible tetramers in the R4
state are in the opposite direction from T0. The dynamics shifts
the LHs to more positive values (more hydrophilic) for Thr38,
Tyr42, Arg141, Asn139; see Figure
S1. For residues Thr38 and Tyr42 the
local hydrophobicities for rigid and flexible tetramer differ
most. Interestingly, in the case of flexible R4 a few residues in
S1 and S2 behave slightly differently from each other. They include
Thr38, Tyr42, Tyr140, and Arg141.
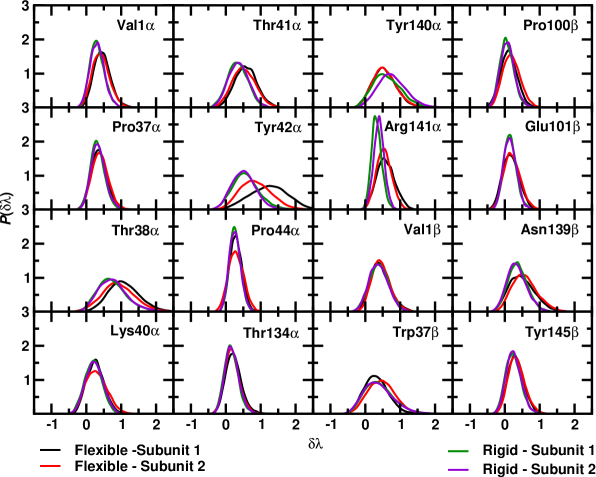
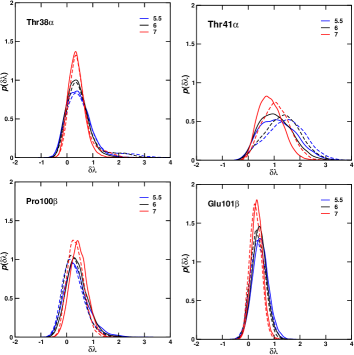
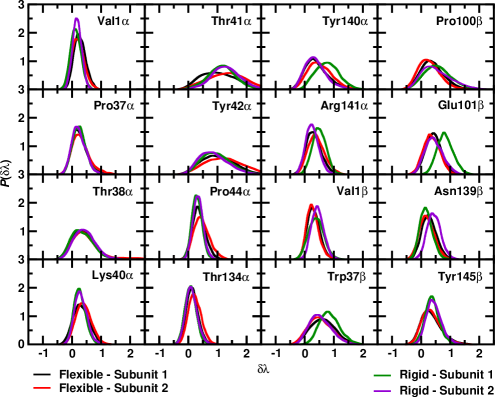
Figure 4 shows the probability distribution functions,
, of the local hydrophobicities for T0 determined from
the time series in Figure 3. The distributions (LH)
display near-Gaussian (e.g. Pro37) to non-Gaussian
(e.g. Tyr42) shapes. For this reason it was decided to
consider the position of the maximum, max(LH), instead of the
arithmetic mean in the following. Similar to what was found for
LH in Figure 3, the distributions overlap for the
majority of residues. For residues Thr41, Tyr42,
Pro44, Tyr140, Trp37, and Pro100 there
are significant differences for the flexible tetramer and for
Tyr140, Arg141, Val1, Trp37,
Glu101, and Asn139 they differ significantly for the
rigid tetramer. The probability distributions for R4, reported in
Figure S2, are overlapping for all residues if the
protein structure is frozen, except for Tyr140 and
Arg141, for which very slight differences are found. In
contrast to that and to the flexible T0 tetramer, dynamics leads to
some differences between symmetry-equivalent residues in R4; they
include residues Tyr42 (pronounced), Tyr140,
Arg141, Trp37, and Glu101.
The total LH for rigid T0 and R4 tetramers changes from
LH(T0) to LH(R4), i.e. from more hydrophilic to
less hydrophilic, see Table 2. This is reversed if the
two tetramers are flexible for which LH(T0) and
LH(R4) as shown in Table 3. Hence, flexibility
of the protein structure influences the magnitude of LH because
structural changes allow water exchange between bulk and the
protein-protein interfaces.
Next, the total LH for frozen dimer and tetramer simulations is
considered. Formation of the tetramer causes some interfacial residues
to become buried compared with the dimers S1 and S2. This changes
their local hydrophobicity due to alterations in solvent access. The
values for max(LH) in Table 2 show that for rigid
T0 the total change between the dimer and the tetramer for all the
residues analyzed here is for S1 and for S2 whereas
for R4 it is and , respectively. A positive number
in the change is associated with increased hydrophilicity. Hence, upon
S1/S2 association both tetramers’ hydrophilicity decreases and the
total effect is larger for R4 () than for T0
(). If only residues at the and interfaces are considered (see Table 1) the
total change between dimer and tetramer is for T0 (if
residue Asn139 is excluded because it points towards the channel, the
actual change is positive.) and –13.5 for R4. Hence, for the
T0 tetramer the contribution of the interface is near-neutral
(LH) but it is significantly hydrophobic (LH ) for
R4.
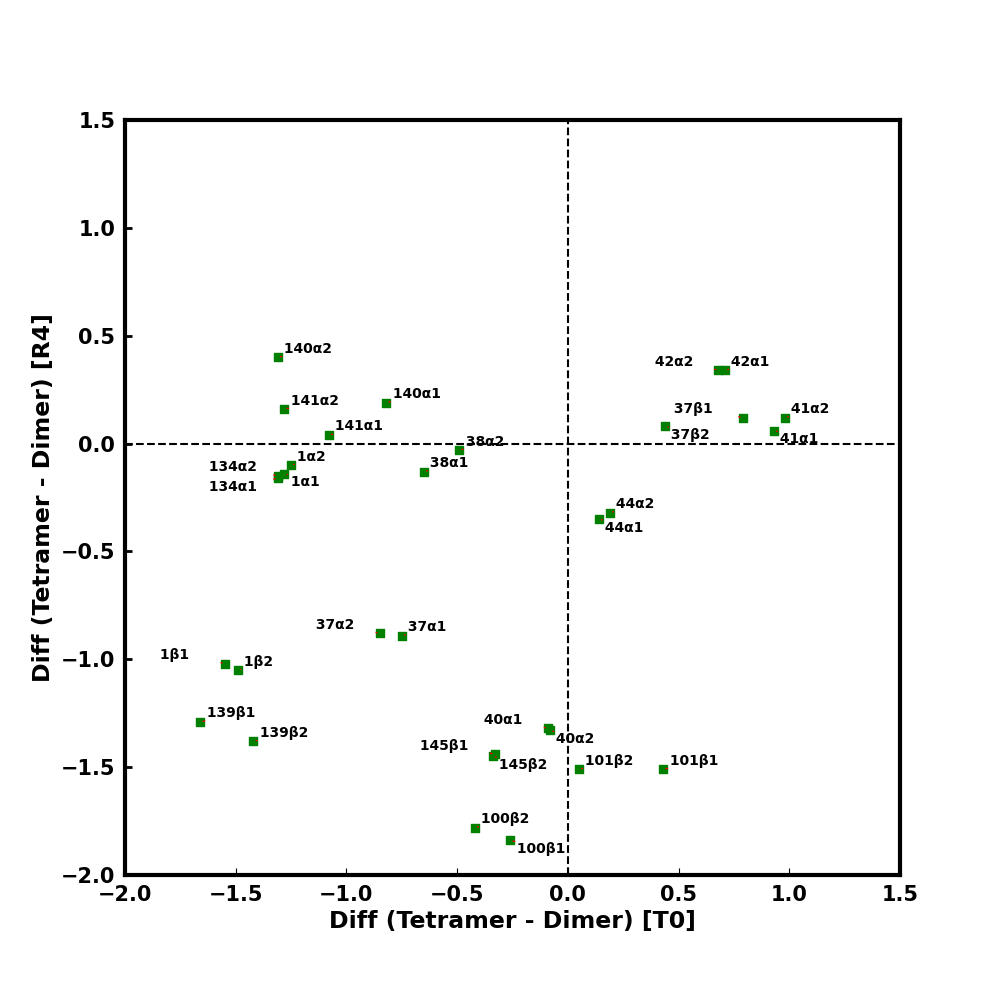
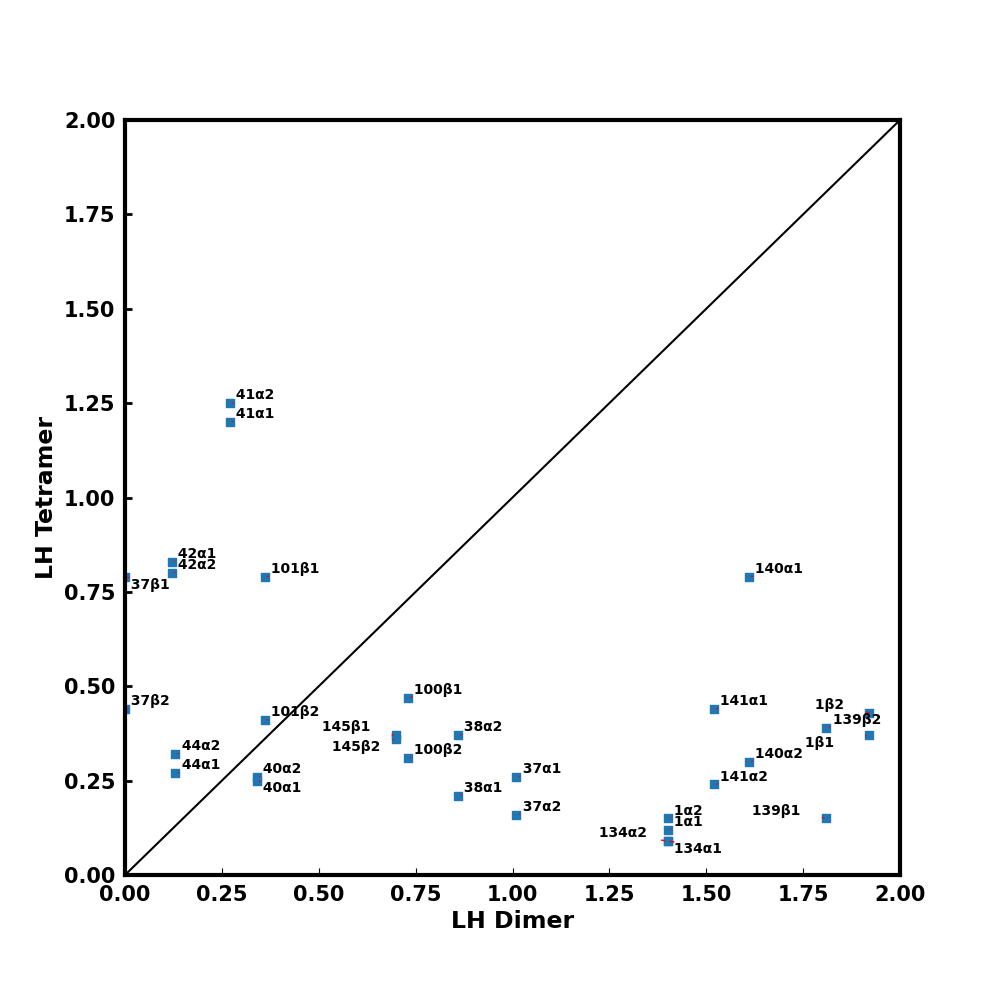
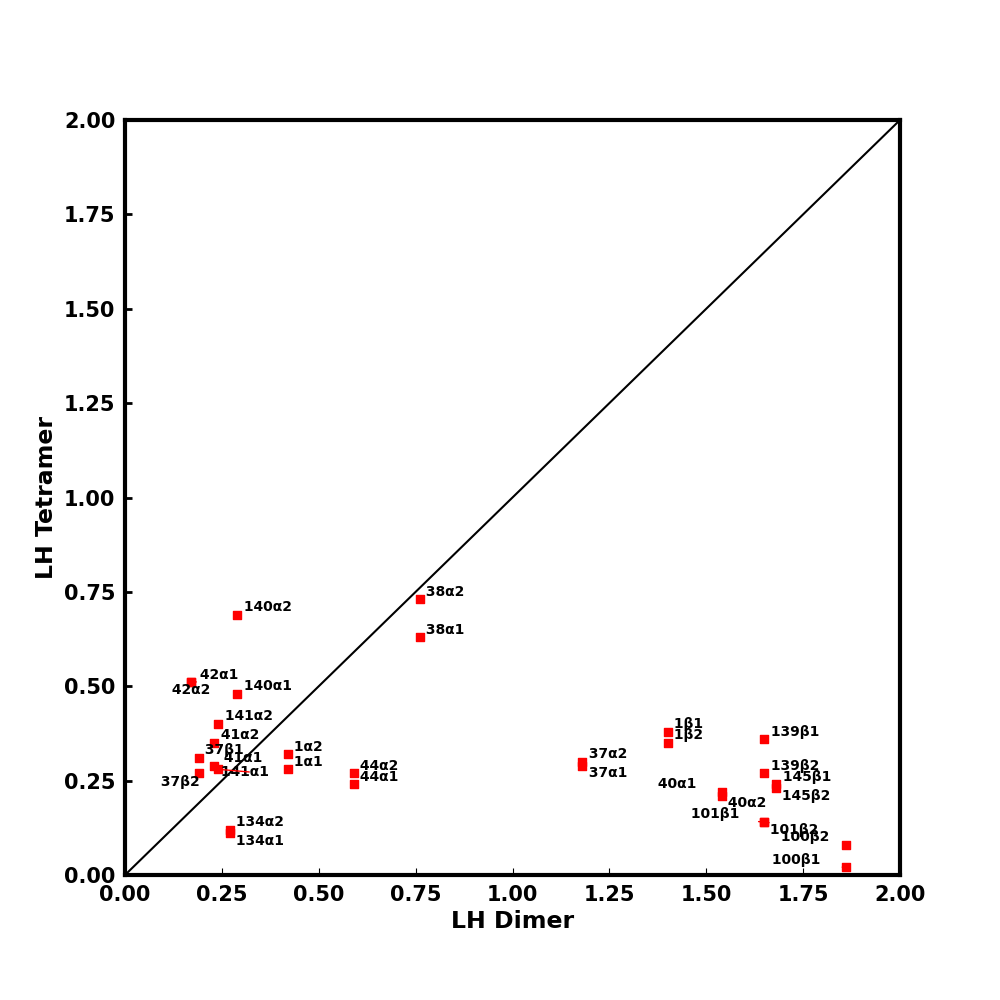
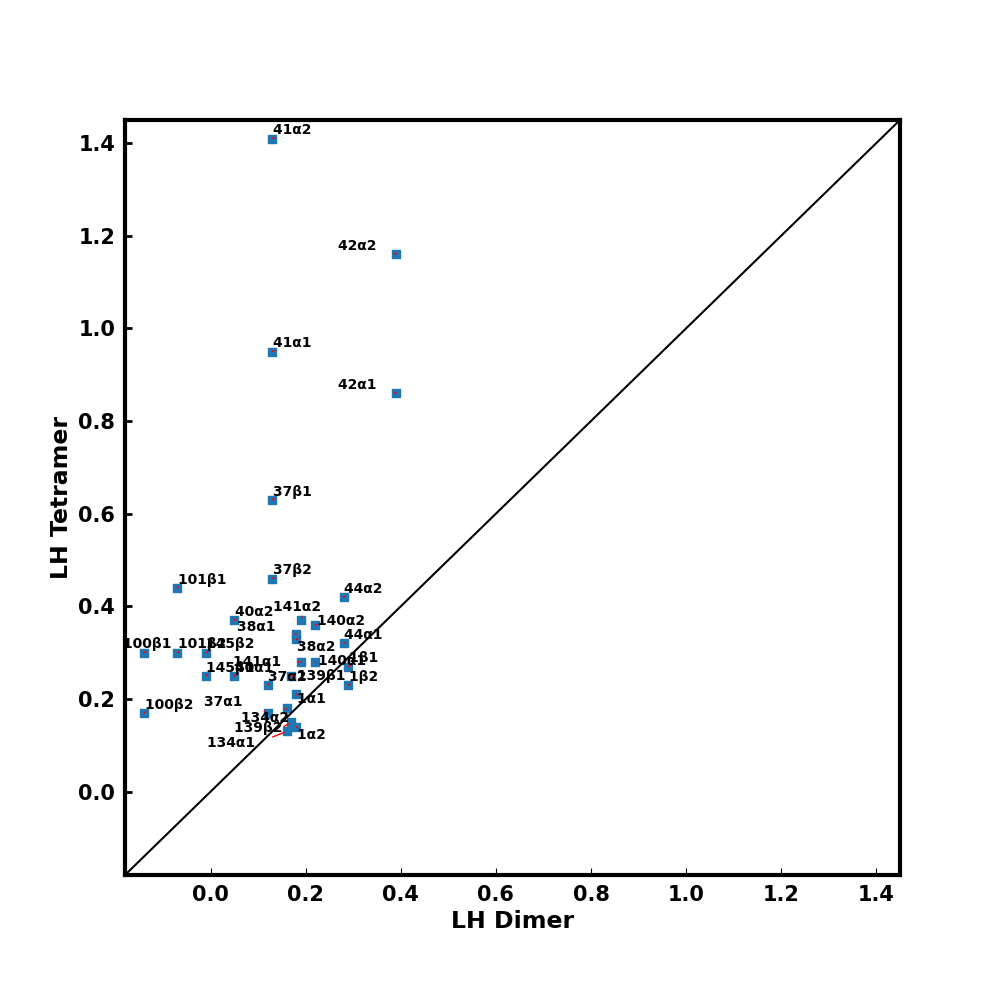
Next, the difference in LH between the tetramer and the dimer for
rigid T0 and R4 for each of the 16 residues is
considered. Figure S3 shows that all residues
appear approximately as pairs, as expected. Upon association,
residues Thr41, Tyr42 and Trp37 become more
hydrophilic for both, T0 and R4 ( quadrant in Figure
S3); residues Pro44 and Glu101
become more hydrophilic for T0 but less hydrophilic for R4
(); Val1, Pro37, Thr38, Lys40,
Thr134, Val1, Pro100, Asn139 and
Tyr145 become less hydrophilic for both T0 and R4
(); and Tyr140 and Arg141 become more hydrophilic
for R4 and less hydrophilic for T0 (). These results change
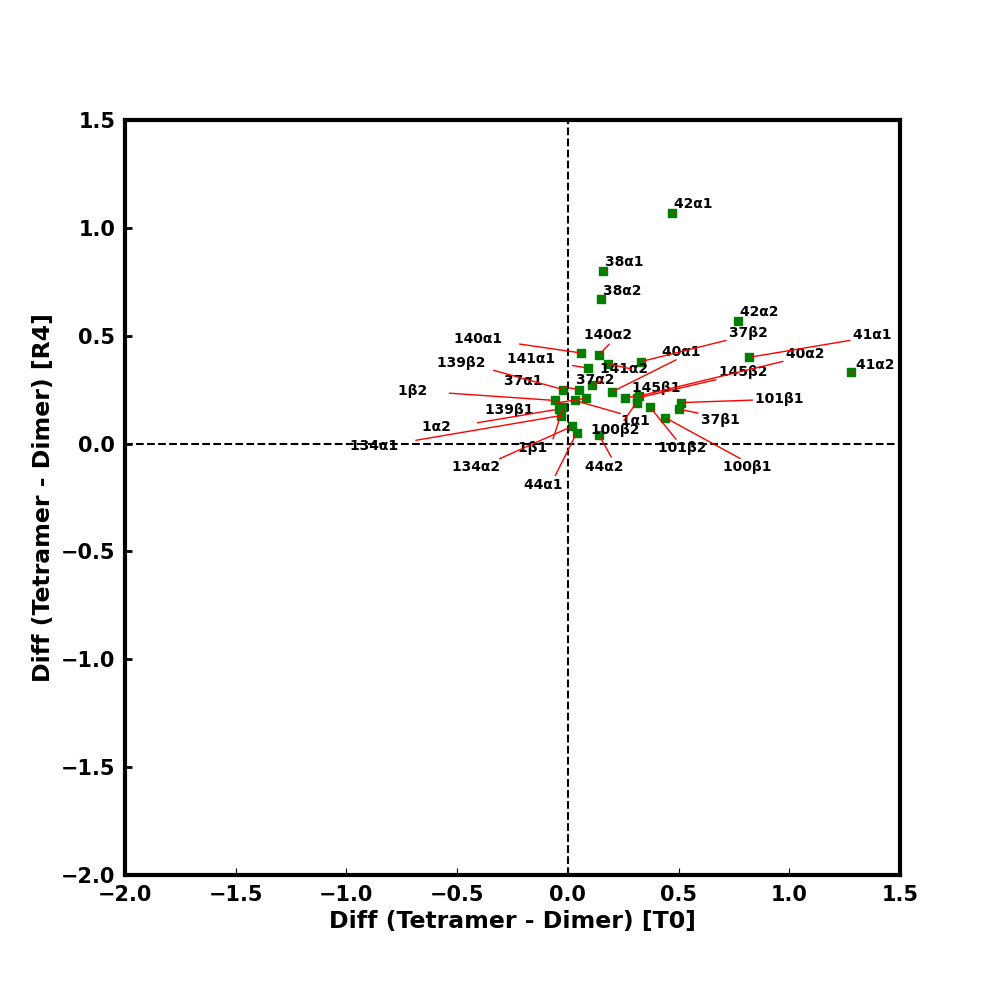
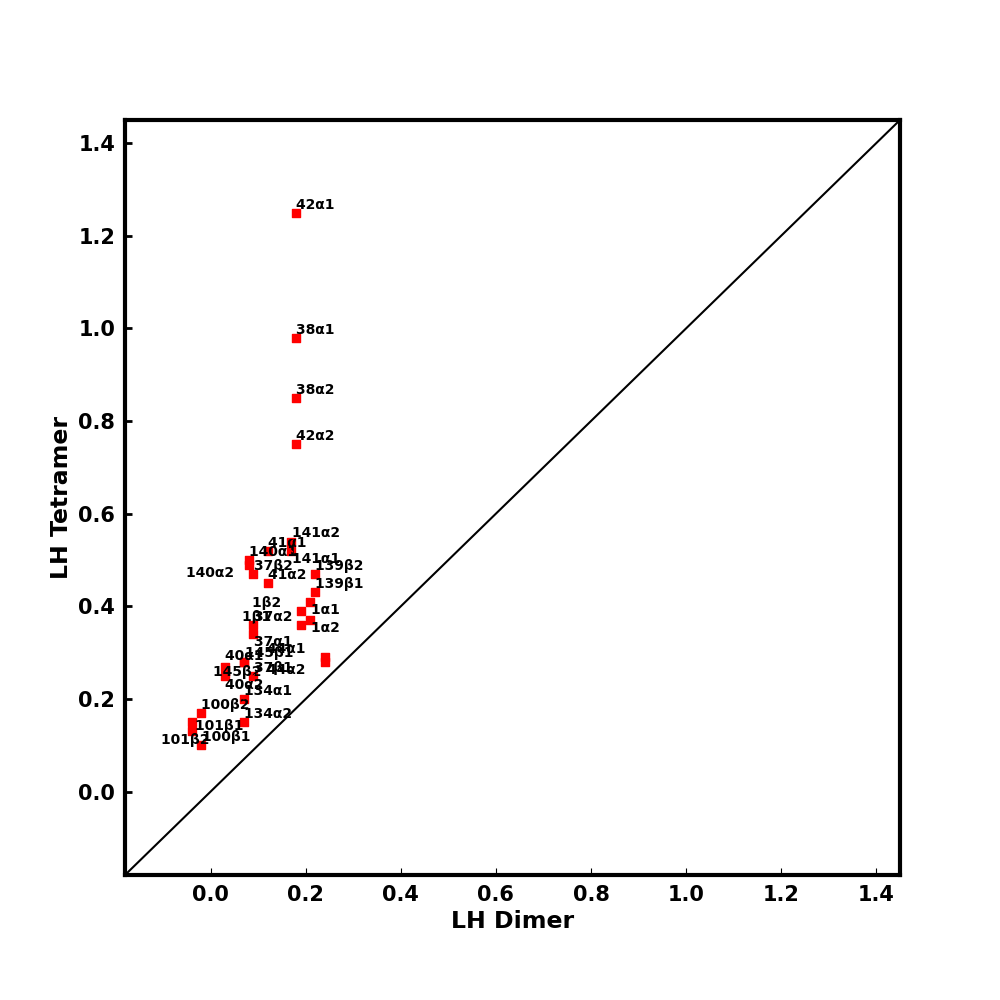
appreciably for the flexible dimer and tetramer simulations, see
Figure S4. In this case, all differences are
in the upper right quadrant (), which indicates that upon
association all residues become more hydrophilic for flexible T0
and R4. Figures S5 and S6 compare
the rigid with dynamically averaged structures for T0 and R4,
respectively; the RMSDs for the averaged structures are 1.65 Å for
T0. and 1.77 Å for R4. The differences are small, but for
both cases, it appears there is a small collapse in the averaged
structures.
The local hydrophobicity for the individual residues in the dimer and
tetramer are compared for rigid and flexible proteins for T0 and
R4 in Figures S7 to
S10. As association of S1 and S2 to form the
tetramer leads to burying water-exposed parts of the protein for which
(), the net effect of association is expected to be
reduced LH-values for residues involved in the association interface
in the tetramer; these are the residues in Table
1. This is largely what is observed for both T0 and
R4 in the rigid systems (Figures S7 and
S8). There are a few exceptions for which the
LH-value in the tetramer is more positive than for the same residue in
S1 and S2. For T0 (Figure S7) they are
residues Thr41, Tyr42, Trp37, Glu101
in S1 and S2 whereas for R4 (Figure S8),
this is true for Tyr140 and Tyr140 and several
other residues in the lower left-hand corner (e.g. Trp37),
though there is no relation to the results in Table
1. For the flexible systems (Figures
S9 and S10), the LH values
are larger for the tetramer than the dimer for all residues in R4
and for T0 with the exception of Thr134, Val,
Val and Asn139. The comparisons involving the
flexible dimer need to be considered with caution because there is no
experimental information on the structure and dynamics for isolated S1
in solution.
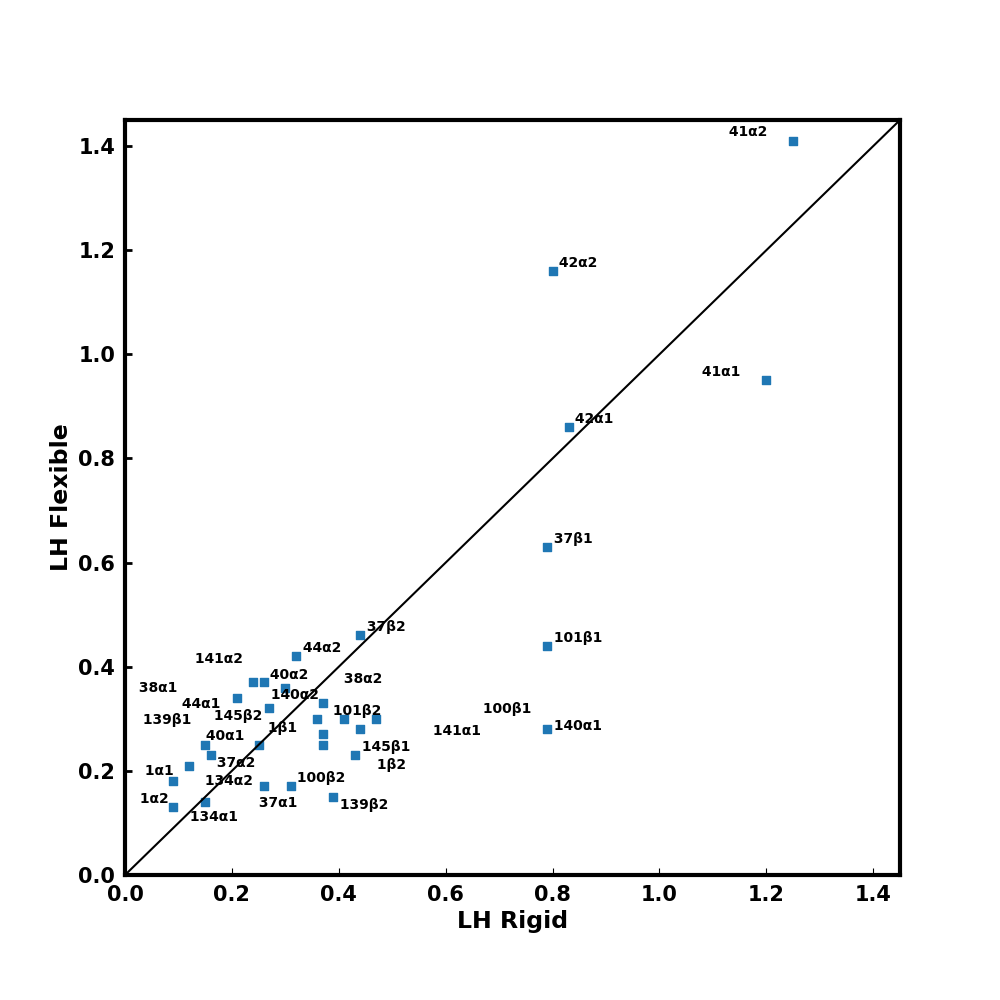
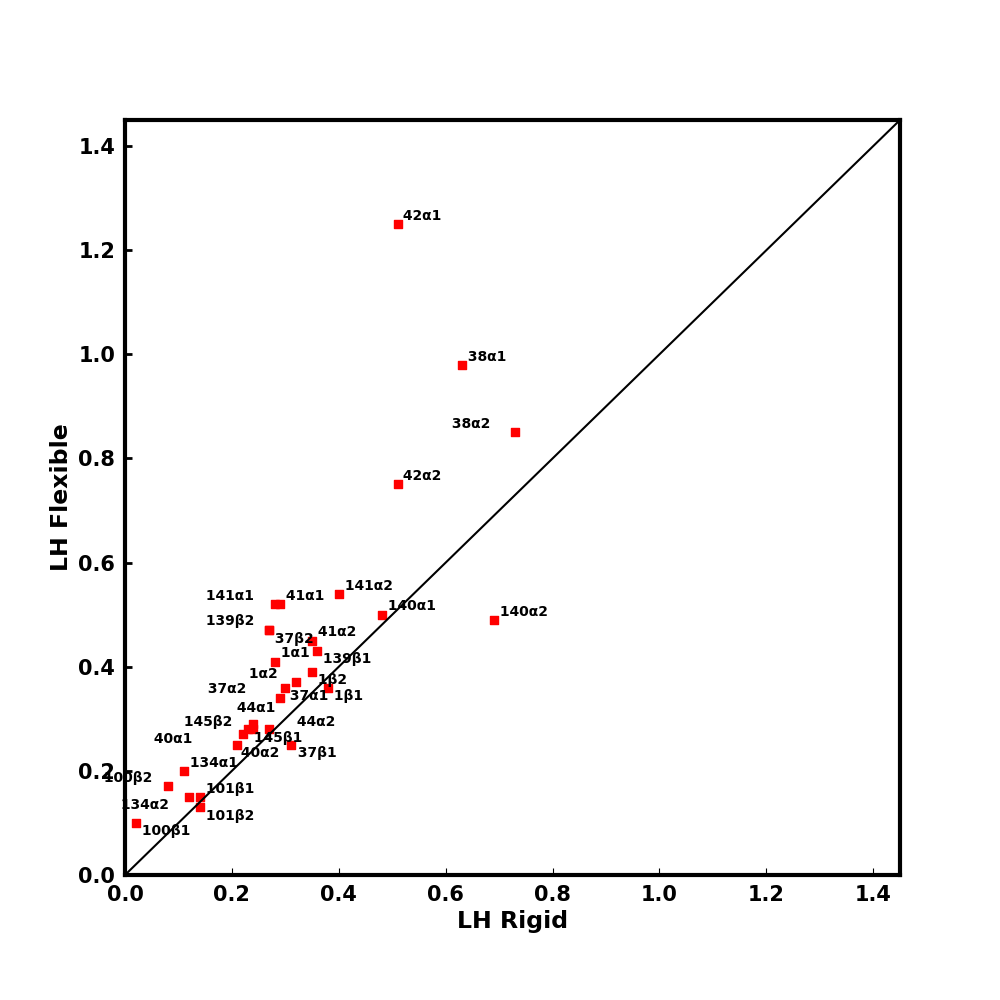
Next, the effect of protein dynamics on the max(LH) in the
tetramers is considered by comparing LH from rigid and flexible
simulations, see Figures S11 and
S12. Overall, the position of the maxima
for all residues are approximately correlated in T0 and highly
correlated in R4. There are some exceptions, namely
Thr41, Tyr140, Trp37, and
Glu101 for T0 and Tyr42, and to a lesser
extent Thr38 and Tyr140 for R4. Residues
below the diagonal are more hydrophilic in the rigid than the flexible
protein whereas for those above the diagonal, protein dynamics
decreases their hydrophilicity. For T0 (Figure
S11) the exceptions are typically less
hydrophilic when dynamics is included whereas for R4 (Figure
S12) the opposite is the case.
| Residue | LH | LH | LH | LH | LH | LH | LH |
| Val11 | 0.12 (0.76) | 1.40 (0.44) | –1.28 | 0.28 (0.68) | 0.42 (0.13) | –0.14 | 0.16 |
| Pro371 | 0.26 (0.58) | 1.01 (0.29) | –0.75 | 0.29 (0.69) | 1.18 (0.21) | –0.89 | 0.03 |
| Thr381 | 0.21 (0.36) | 0.86 (0.31) | –0.65 | 0.63 (0.32) | 0.76 (0.18) | –0.13 | 0.42 |
| Lys401 | 0.25 (0.68) | 0.34 (0.27) | –0.09 | 0.22 (0.55) | 1.54 (0.20) | –1.32 | –0.03 |
| Thr411 | 1.20 (0.29) | 0.27 (0.23) | 0.93 | 0.29 (0.47) | 0.23 (0.18) | 0.06 | –0.91 |
| Tyr421 | 0.83 (0.28) | 0.12 (0.18) | 0.71 | 0.51 (0.36) | 0.17 (0.17) | 0.34 | –0.32 |
| Pro441 | 0.27 (0.80) | 0.13 (0.18) | 0.14 | 0.24 (0.86) | 0.59 (0.12) | –0.35 | –0.03 |
| Thr1341 | 0.09 (0.64) | 1.40 (0.37) | –1.31 | 0.11 (0.54) | 0.27 (0.12) | –0.16 | 0.02 |
| Tyr1401 | 0.79 (0.35) | 1.61 (0.24) | –0.82 | 0.48 (0.35) | 0.29 (0.16) | 0.19 | –0.31 |
| Arg1411 | 0.44 (0.58) | 1.52 (0.53) | –1.08 | 0.28 (0.93) | 0.24 (0.18) | 0.04 | –0.16 |
| Sum: | 4.46 | 8.66 | –4.20 | 3.33 | 5.69 | –2.36 | –1.13 |
| Val11 | 0.37 (0.52) | 1.92 (0.22) | –1.55 | 0.38 (0.50) | 1.40 (0.25) | –1.02 | 0.01 |
| Trp371 | 0.79 (0.40) | 0.00 (0.73) | 0.79 | 0.31 (0.30) | 0.19 (0.14) | 0.12 | –0.48 |
| Pro1001 | 0.47 (0.26) | 0.73 (0.30) | –0.26 | 0.02 (0.57) | 1.86 (0.19) | –1.84 | –0.45 |
| Glu1011 | 0.79 (0.50) | 0.36 (0.51) | 0.43 | 0.14 (0.72) | 1.65 (0.18) | –1.51 | –0.65 |
| Asn1391 | 0.15 (0.63) | 1.81 (0.30) | –1.66 | 0.36 (0.47) | 1.65 (0.26) | –1.29 | 0.21 |
| Tyr1451 | 0.37 (0.56) | 0.70 (0.36) | –0.33 | 0.24 (0.57) | 1.68 (0.25) | –1.44 | –0.13 |
| Sum: | 2.94 | 5.52 | –2.58 | 1.45 | 8.43 | –6.98 | –1.49 |
| Total S1: | 7.40 | 14.18 | –6.78 | 4.78 | 14.12 | –9.34 | –2.62 |
| Val12 | 0.15 (0.87) | 1.40 (0.44) | –1.25 | 0.32 (0.65) | 0.42 (0.13) | –0.10 | 0.17 |
| Pro372 | 0.16 (0.57) | 1.01 (0.29) | –0.85 | 0.30 (0.66) | 1.18 (0.21) | –0.88 | 0.14 |
| Thr382 | 0.37 (0.37) | 0.86 (0.31) | –0.49 | 0.73 (0.32) | 0.76 (0.18) | –0.03 | 0.36 |
| Lys402 | 0.26 (0.64) | 0.34 (0.27) | –0.08 | 0.21 (0.54) | 1.54 (0.20) | –1.33 | –0.05 |
| Thr412 | 1.25 (0.28) | 0.27 (0.23) | 0.98 | 0.35 (0.47) | 0.23 (0.18) | 0.12 | –0.90 |
| Tyr422 | 0.80 (0.28) | 0.12 (0.18) | 0.68 | 0.51 (0.39) | 0.17 (0.17) | 0.34 | –0.29 |
| Pro442 | 0.32 (0.79) | 0.13 (0.18) | 0.19 | 0.27 (0.84) | 0.59 (0.12) | –0.32 | –0.05 |
| Thr1342 | 0.09 (0.63) | 1.40 (0.37) | –1.31 | 0.12 (0.57) | 0.27 (0.12) | –0.15 | 0.03 |
| Tyr1402 | 0.30 (0.38) | 1.61 (0.24) | –1.31 | 0.69 (0.33) | 0.29 (0.16) | 0.40 | 0.39 |
| Arg1412 | 0.24 (0.62) | 1.52 (0.53) | –1.28 | 0.40 (0.90) | 0.24 (0.18) | 0.16 | 0.16 |
| Sum: | 3.94 | 8.66 | –4.72 | 3.90 | 5.69 | –1.79 | –0.04 |
| Val12 | 0.43 (0.65) | 1.92 (0.22) | –1.49 | 0.35 (0.49) | 1.40 (0.25) | –1.05 | –0.08 |
| Trp372 | 0.44 (0.36) | 0.00 (0.73) | 0.44 | 0.27 (0.28) | 0.19 (0.14) | 0.08 | –0.17 |
| Pro1002 | 0.31 (0.28) | 0.73 (0.30) | –0.42 | 0.08 (0.63) | 1.86 (0.19) | –1.78 | –0.23 |
| Glu1012 | 0.41 (0.45) | 0.36 (0.51) | 0.05 | 0.14 (0.70) | 1.65 (0.18) | –1.51 | –0.27 |
| Asn1392 | 0.39 (0.57) | 1.81 (0.30) | –1.42 | 0.27 (0.47) | 1.65 (0.26) | –1.38 | –0.12 |
| Tyr1452 | 0.36 (0.53) | 0.70 (0.36) | –0.34 | 0.23 (0.62) | 1.68 (0.25) | –1.45 | –0.13 |
| Sum: | 2.34 | 5.52 | –3.18 | 1.34 | 8.43 | –7.09 | –1.00 |
| Total S2: | 6.28 | 14.18 | –7.90 | 5.24 | 14.12 | –8.88 | –1.04 |
| Global S1S2: | 13.68 | 28.36 | –14.68 | 10.02 | 28.24 | –18.22 | –3.66 |
| Residue | LH | LH | LH | LH | LH | LH | LH |
| Val11 | 0.21(0.67) | 0.18(0.62) | 0.03 | 0.41(0.57) | 0.21(0.66) | 0.20 | 0.20 |
| Pro371 | 0.17(0.5) | 0.12(0.68) | 0.05 | 0.34(0.61) | 0.09(0.71) | 0.25 | 0.17 |
| Thr381 | 0.34(0.35) | 0.18(0.56) | 0.16 | 0.98(0.31) | 0.18(0.59) | 0.80 | 0.64 |
| Lys401 | 0.25(0.49) | 0.05(0.63) | 0.20 | 0.27(0.55) | 0.03(0.64) | 0.24 | 0.02 |
| Thr411 | 0.95(0.23) | 0.13(0.67) | 0.82 | 0.52(0.43) | 0.12(0.71) | 0.40 | –0.43 |
| Tyr421 | 0.86(0.24) | 0.39(0.5) | 0.47 | 1.25(0.25) | 0.18(0.58) | 1.07 | 0.39 |
| Pro441 | 0.32(0.61) | 0.28(0.62) | 0.04 | 0.29(0.78) | 0.24(0.70) | 0.05 | –0.03 |
| Thr1341 | 0.13(0.69) | 0.16(0.6) | –0.03 | 0.2 (0.55) | 0.07(0.65) | 0.13 | 0.07 |
| Tyr1401 | 0.28(0.36) | 0.22(0.56) | 0.06 | 0.5 (0.38) | 0.08(0.59) | 0.42 | 0.22 |
| Arg1411 | 0.28(0.51) | 0.19(0.69) | 0.09 | 0.52(0.53) | 0.17(0.68) | 0.35 | 0.24 |
| Sum: | 3.79 | 1.90 | 1.89 | 5.28 | 1.37 | 3.91 | 1.49 |
| Val11 | 0.27(0.61) | 0.29(0.60) | –0.02 | 0.36(0.48) | 0.19(0.61) | 0.17 | 0.09 |
| Trp371 | 0.63(0.32) | 0.13(0.71) | 0.50 | 0.25(0.37) | 0.09(0.75) | 0.16 | –0.38 |
| Pro1001 | 0.30(0.35) | –0.14(0.62) | 0.44 | 0.10(0.57) | –0.02(0.61) | 0.12 | –0.20 |
| Glu1011 | 0.44(0.50) | –0.07(0.62) | 0.51 | 0.15(0.58) | –0.04(0.57) | 0.19 | –0.29 |
| Asn1391 | 0.25(0.54) | 0.17(0.54) | 0.08 | 0.43(0.38) | 0.22(0.52) | 0.21 | 0.18 |
| Tyr1451 | 0.25(0.38) | –0.01(0.63) | 0.26 | 0.28(0.56) | 0.07(0.79) | 0.21 | 0.03 |
| Sum: | 2.14 | 0.37 | 1.77 | 1.57 | 0.51 | 1.06 | –0.57 |
| Total S1: | 5.93 | 2.27 | 3.66 | 6.85 | 1.88 | 4.97 | 0.92 |
| Val12 | 0.14(0.64) | 0.18(0.62) | –0.04 | 0.37(0.57) | 0.21(0.66) | 0.16 | 0.23 |
| Pro372 | 0.23(0.47) | 0.12(0.68) | 0.11 | 0.36(0.59) | 0.09(0.71) | 0.27 | 0.13 |
| Thr382 | 0.33(0.29) | 0.18(0.56) | 0.15 | 0.85(0.29) | 0.18(0.59) | 0.67 | 0.52 |
| Lys402 | 0.37(0.52) | 0.05(0.63) | 0.32 | 0.25(0.46) | 0.03(0.64) | 0.22 | –0.12 |
| Thr412 | 1.41(0.21) | 0.13(0.67) | 1.28 | 0.45(0.41) | 0.12(0.71) | 0.33 | –0.96 |
| Tyr422 | 1.16(0.21) | 0.39(0.50) | 0.77 | 0.75(0.30) | 0.18(0.58) | 0.57 | –0.41 |
| Pro442 | 0.42(0.52) | 0.28(0.62) | 0.14 | 0.28(0.63) | 0.24(0.70) | 0.04 | –0.14 |
| Thr1342 | 0.18(0.61) | 0.16(0.60) | 0.02 | 0.15(0.59) | 0.07(0.65) | 0.08 | –0.03 |
| Tyr1402 | 0.36(0.34) | 0.22(0.56) | 0.14 | 0.49(0.38) | 0.08(0.59) | 0.41 | 0.13 |
| Arg1412 | 0.37(0.48) | 0.19(0.69) | 0.18 | 0.54(0.62) | 0.17(0.68) | 0.37 | 0.17 |
| Sum: | 4.97 | 1.90 | 3.07 | 4.49 | 1.37 | 3.12 | –0.48 |
| Val12 | 0.23(0.64) | 0.29(0.60) | –0.06 | 0.39(0.51) | 0.19(0.61) | 0.20 | 0.16 |
| Trp372 | 0.46(0.34) | 0.13(0.71) | 0.33 | 0.47(0.34) | 0.09(0.75) | 0.38 | 0.01 |
| Pro1002 | 0.17(0.36) | –0.14(0.62) | 0.31 | 0.17(0.54) | –0.02(0.61) | 0.19 | 0.00 |
| Glu1012 | 0.30(0.49) | –0.07(0.62) | 0.37 | 0.13(0.57) | –0.04(0.57) | 0.17 | –0.17 |
| Asn1392 | 0.15(0.53) | 0.17(0.54) | –0.02 | 0.47(0.38) | 0.22(0.52) | 0.25 | 0.32 |
| Tyr1452 | 0.30(0.42) | –0.01(0.63) | 0.31 | 0.28(0.57) | 0.07(0.79) | 0.21 | –0.02 |
| Sum: | 1.61 | 0.37 | 1.24 | 1.91 | 0.51 | 1.40 | 0.30 |
| Total S2: | 6.58 | 2.27 | 4.31 | 6.40 | 1.88 | 4.52 | –0.18 |
| Global S1S2: | 12.51 | 4.54 | 7.97 | 13.25 | 3.76 | 9.49 | 0.74 |
2.2 Local Hydrophobicity versus Solvent Accessible Surface Area
The solvent exposure of buried and exposed interfacial residues for
tetrameric T0 and R4 was determined by computing the solvent
accessible surface area (SASA) for the two available high quality
X-ray structures.12 Thus, the most direct and
meaningful comparison in the present context with these results is to
use LH from simulations in which the protein is rigid. The analysis
found that the deoxy state (T0) buries 2620 Å2 of surface,
700 Å2 more than the oxy (R4) state of Hb for the and interfaces.
This decrease in buried surface for the T0R4
transition correlates with the increased stability of the T- versus
the R-state based on the result of Chothia.12 The
comparison between the local hydrophobicities from the rigid protein
tetramer simulations and the buried surface from the
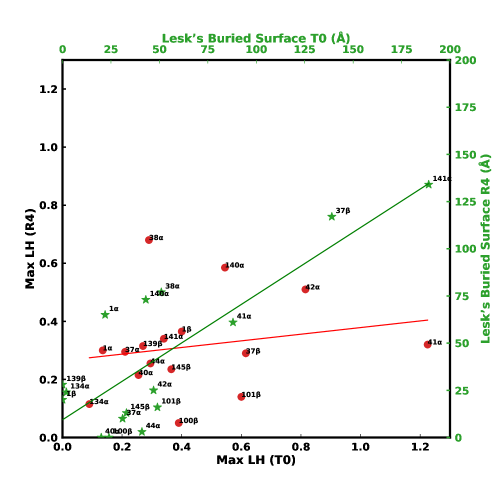
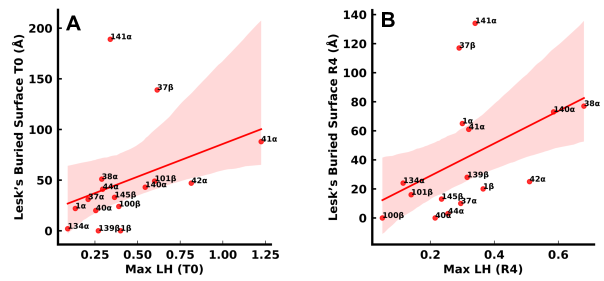
literature12 is reported in Figures 5
and S13. Figure 5 compares the buried
surface and max(LH) for the T0 (panel A) and R4 states (panel
B) whereas Figure S13 provides a comprehensive
view of all available data. In general, increased max(LH)
correlates with larger surface buried for both T0 and R4. For
both, the T- and the R-states there is a mild (for T0, ) to a somewhat stronger (for R4, ) correlation
between max(LH) and the amount of buried surface. Figure
5 indicates that larger values of buried surface
correspond to larger values of LH. Since large values of buried
surface indicate that there is significant hydrophobic
stabilization23 and positive values of LH indicate a
hydrophilic environment, Figure 5 and the results given
above point to a weak anticorrelation between SASA and LH. If large
values of buried surface in a protein is interpreted as “the
probability to find water in these areas is low” then the simulations
as per Figure 6 show that this is not the case: water
can access such areas even for rigid T0 and R4. Figures
6 and S14 show water molecules within
3 Å of any residue at the and association interfaces for rigid R4 (77 waters) and T0
(62 waters), respectively. These water molecules can be quite strongly
bound with lifetimes of several nanoseconds due to the rigidity of the
protein.
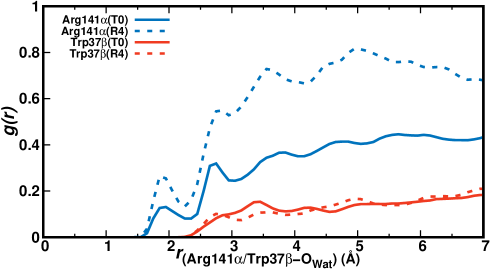
There are two pronounced outliers for both analyses (buried surface
and LH), which are Arg141 and Trp37; see Figure
5. The corresponding radial distribution functions are
reported in Figure S15. For Trp37 the average of the
maxima of LH, P(LH), for Trp37 and Trp37 is 0.62 for
T0 and 0.30 for R4 (Table 2), whereas the are close to
one another (see red traces in Figure S15). Hence, the
difference in the maxima of LH for Trp37 and is
most likely due to water orientation around the two residues, although
the effect is small. This conclusion follows from the fact that the
, which probes only water presence, are similar and the max
(LH), which probes both presence () and orientation,
differ. For Arg141 the average of the maxima of for both T0 and R4 whereas the is much larger for
R4 than for T0 (see blue traces in Figure S15). As
stated above, LH quantifies both the presence and the orientation of
solvent, while only describes the presence of it. Consequently,
the findings that the max P(LH) are the same for Arg141 imply that for
R4 the solvent molecules are unfavourably oriented for effective
protein-solvent interactions.
The analysis based on LH for the rigid tetramers in their T0 and
R4 states shows that for the residues considered here, LH is larger
for T- than for R-Hb (13.7 vs. 10.0); i.e., LH is larger as a
(positive) number which means more hydrophilic. For S1 the total LH
for T0 is 7.40 compared with 4.78 for R4 and for S2 they are
6.28 and 5.24, respectively. If only residues at the and interfaces are considered (see Table
1), the total LH is 10.1 for T0 as compared with 6.0
for R4. Hence, T0 appears to be more hydrophilic than R4 when
measured by LH, again in disagreement with experiment.
3 Discussion and Conclusion
The present work uses local hydrophobicity as a physically based
measure for solvent exposure (and solvent structure) around hemoglobin
(Hb) to determine local hydrophilicity (LH) and local
hydrophobicity (LH). For rigid tetrameric Hb in its T0 and
R4 states it is found that the position of the maximum of the
distribution, (LH), is mildly correlated with the more
conventionally used measure of “buried surface” and therefore mildly
anticorrelated with the solvent accessible surface area, see Figure
5. Large values of buried surface - i.e. hydrophobic
stabilization - for a given residue correlate with large values of LH,
the hydrophilicity; this is the inverse of the correlation that would
indicate that LH and buried surface measure corresponding
quantities.
It was previously concluded23 that larger areas of
buried surface correlate with increased hydrophobicity and
stabilization of the corresponding conformational
substate. Specifically, it was argued for Hb that the larger buried
surfaces for the and association
interfaces for T- versus R-states (2620 Å3 vs. 1920 Å3)
contribute significantly to the experimentally observed thermodynamic
stabilization of the T-state relative to the R-state. The total LH for
the residues at the relevant and
interfaces indicate that these regions are more hydrophilic (max
(LH) = 9.8) for the T-state compared with 5.9 for the R-state.
Several factors may contribute to this result. First, analysis of SASA
delineates hydrophobic regions where water access is expected to be
difficult and rare. However, even for rigid R4 (see Figure
6), water is found to penetrate into such
regions. The existence of ordered water molecules at protein-protein
interfaces is quite general. For example, this has also been reported
for scapharca dimeric Hb.24, 25 For this system,
the interface contains between 15 and 20 water molecules. Furthermore,
hydration of the Hb interface was found to change in the T/R
transition; experiments reported an increase by 60 water molecules in
the transition.26. Moreover, LH is sensitive not only
to the hydrophobic areas between residues forming the interface but
also to water access from the outside. In addition, LH depends on both
the presence and orientation of water molecules. Hence a single,
well-ordered water molecule may lead to values of LH that indicate a
hydrophilic nature (LH ) of the residue if it is
optimally oriented (, see Methods). Similarly,
multiple water molecules may result in a hydrophobic interface,
LH, if they are unfavourably oriented.
For the difference in LH between tetramer and dimer in both
conformational substates it is found that some residues are
surprisingly hydrophilic in the tetramer compared with the dimer, see
Figures S3 and S4.
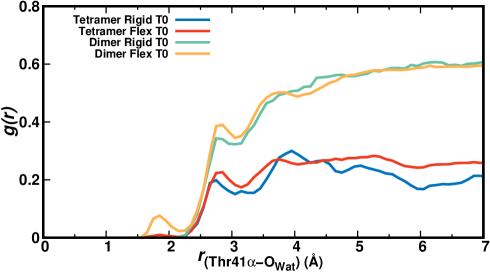
Thr41 is a typical example: for rigid tetramers and dimers the
average difference in Max for T0 is (1.18
for tetramer and 0.13 for dimer, see Table 2) whereas for
R4 it is (0.49 vs. 0.12). For the same residue, the
radial distribution functions for rigid R4 in the dimer and the
tetramer overlap up to a separation of Å and differ
beyond, see green and blue traces in Figure S16. If the
proteins are flexible the Max for the dimers in both
conformational substates only change marginally compared with the
rigid dimers and the values for Max still indicate a
hydrophobic character (all Max). For flexible R4
the average Max increases somewhat (by 0.1) compared with
rigid R4 and the corresponding radial distribution functions
(orange and red traces in Figure S16) show that for both
the dimer and the tetramer water can now penetrate closer to the
residue, for which has a new local maximum for separations
smaller than 2 Å whereas the limiting value is reached at
Å. Since for bulk water corresponds to a limit of one, the
smaller limiting values result from the presence of the protein. For
flexible T0 the average Max remains around 1.25 but
becomes more asymmetric with Max larger for S2 than for
S1. The radial distribution function (Figure S17) for the
flexible tetramer only shows a faint density for separations of 2
Å (red trace) whereas for the flexible dimer water can access 2
Å more readily (orange trace). However, in this case, the limiting
value is reached for shorter separations ( Å) for the
tetramer compared with much larger values (greater than 7 Å) for
the dimer.
Finally, it is of interest to consider the present findings in the
general context of “allostery”. The term - Greek for “other site”
- used in the context of controlling cellular function at a molecular
level, was introduced in 1961 to describe “interaction at a
distance” involving two (or multiple) binding sites in a
protein.27 This model evolved into the celebrated
“Monod-Wyman-Changeux” (MWC) model for allostery.28
Historically, the concept was introduced even earlier, by Pauling, who
had proposed a model to explain positive cooperativity in binding of
molecular oxygen to hemoglobin.29 This model was the
basis for an alternative view of cooperativity, now referred to as the
“Koshland-Nemethy-Filmer” (KNF) model.30 Applied
to Hb, the KNF model involves multiple conformational substates with
varying strengths for subunit interactions and the possibility for
intermediate states whereas the MWC is based on a concerted mechanism
for allostery at the quaternary level. The MWC model and its
elaborations are now accepted as the mechanism of cooperativity in
hemoglobin.31
In conclusion, the present work introduces local hydrophobicity (LH)
as a meaningful and physically motivated measure for water exposure of
conformational substates in proteins. LH is anticorrelated with SASA
when both are measured for rigid Hb. Interestingly for flexible Hb, LH
correlates with the rigid SASA values. Overall, it appears that LH and
SASA measure different aspects of hydration. Since hydration is shown
to be important for protein function, it is essential for
allostery.
4 Methods
4.1 Molecular Dynamics Simulation
Molecular Dynamics (MD) simulations for rigid and flexible T0 and
R4 hemoglobin tetramer and for rigid and flexible subunits S1 were
performed using the CHARMM3632 force field with the
TIP3P water model33 in a cubic box of size
Å3. The initial structures are the 2DN2 (T0) and
2DN3 (R4) structures34 solvated in a Å3
water box. All simulations were carried out for the protein frozen in
its X-ray conformation and for flexible Hb (“regular MD”). The local
hydrophobicity (LH) was analyzed for residues at the dimer-dimer
interface, whose buried surface area changes significantly between
T0 and R4 tetramer as reported by Lesk et al.12
(see their Table 1). The OpenMM implementation35 of C36 was
used together with CMAP corrections36 for these
simulations. Electrostatic interactions were treated with the particle
mesh Ewald method37 with grid size spacing of 1 Å,
characteristic reciprocal length Å-1, and
interpolation order 6. The simulations were run for 100 ns for both
T0 and R4 flexible and rigid dimers and for the flexible
tetramers and for 50 ns for the rigid tetramers. The LH-analysis
reports the maximum of the probability distribution
(i.e. its “mode”) because several of the distributions were found to
be non-Gaussian. For the "rigid" simulations all protein atoms were
frozen at their positions in accord with the PDB structures. With 50
ns of dynamics for the two rigid tetramers the distributions, , were converged. This was verified by separately computing
from the first and second 25 ns of the
simulation. Superimposing these distributions showed that they were
identical.
4.2 Analysis of Aqueous Interfacial Structure
The hydration structure around Hb was characterized by use of a
recently developed computational method.38 It is based on
the concept that deformations in water’s collective interfacial
molecular structure encode information about the details of
surface-water interactions.39 For this, the
probability distribution of molecular configurations, as characterized
by the three-dimensional vector, . Here is the distance of the
oxygen atom position to the nearest point on the instantaneous water
interface, see Ref.40, and and are the angles between the water OH
bonds and the interface normal.
This method is used in the present work to compute the time dependent quantity, , which describes the local hydrophobicity (LH) of residue , at time . More specifically, , where,
| (1) |
The sum over includes the atoms in residue , the summation
over includes water molecules within a cut-off of 6 Å
of atom at time , and denotes the
configuration of the th molecule in this population. The
distribution is the probability to
find configuration at an ideal hydrophobic surface and
is the probability to find that
same configuration in the isotropic environment of the bulk
liquid. These reference distributions were obtained by sampling the
orientational distribution of water at an ideal planar hydrophobic
silica surface and the bulk liquid, respectively, see
Ref. 38. The quantity is the equilibrium value of for
configurational populations sampled from the ideal hydrophobic
reference system. Additional analyses with cutoffs of 5.5 Å and 7
Å were carried out and are reported in Figure S18. The
shapes of are largely independent of this choice, the
mode of the distributions can vary by up to 0.5 units (Thr41)
but are typically smaller than that, and the relative shifts of
for the same residue in S1 and S2 are not affected by
the choice of the cutoff (see e.g. Thr41 in Figure
S18).
Values of close to zero indicate
that water near residue exhibits orientations that are consistent with
those found at an ideal hydrophobic surface. Hydrophilic surfaces
interact with interfacial water molecules and lead to configurational
distributions that differ from those of an ideal hydrophobic surface.
These differences are typically reflected as values of , with larger differences giving rise
to larger positive deviations in .
Values of are indicative
of hydrophilicity. For the number of unique water configurations used
to compute here, fluctuations of
are expected to fall within
(95%
confidence interval) at the hydrophobic reference system. Therefore,
sustained values of are highly
indicative of local hydrophilicity. Fluctuations in as a function of time provide information
about changes in the local solvation environment.
Supplementary Material
The supporting information reports figures for time series of LH, distributions , correlations between the modes of for rigid and flexible T0 and R4, and radial distribution functions between water and specific protein residues.
5 Acknowledgment
Support by the Swiss National Science Foundation through grants
200021-117810, the NCCR MUST (to MM), and the University of Basel is
acknowledged. The support of MK by the CHARMM Development Project is
gratefully acknowledged. The authors thank Marci Karplus and Victor
Ovchinnikov for help with editing the manuscripts.
References
- Teeter 1991 Teeter, M. M. Water-protein interactions: theory and experiment. Ann. Rev. Biophys. Biophys. Chem. 1991, 20, 577–600
- Caronna et al. 2005 Caronna, C.; Natali, F.; Cupane, A. Incoherent elastic and quasi-elastic neutron scattering investigation of hemoglobin dynamics. Biochem. 2005, 116, 219–225
- Achterhold et al. 2002 Achterhold, K.; Keppler, C.; Ostermann, A.; Van Bürck, U.; Sturhahn, W.; Alp, E.; Parak, F. Vibrational dynamics of myoglobin determined by the phonon-assisted Mössbauer effect. Phys. Rep. 2002, 65, 051916
- Mouawad et al. 2005 Mouawad, L.; Maréchal, J.-D.; Perahia, D. Internal cavities and ligand passageways in human hemoglobin characterized by molecular dynamics simulations. Biochimica et Biophysica Acta (BBA)-General Subjects 2005, 1724, 385–393
- Fischer et al. 2011 Fischer, S.; Olsen, K. W.; Nam, K.; Karplus, M. Unsuspected pathway of the allosteric transition in hemoglobin. Proc. Natl. Acad. Sci. 2011, 108, 5608–5613
- Yusuff et al. 2012 Yusuff, O. K.; Babalola, J. O.; Bussi, G.; Raugei, S. Role of the Subunit Interactions in the Conformational Transitions in Adult Human Hemoglobin: An Explicit Solvent Molecular Dynamics Study. J. Phys. Chem. B 2012, 116, 11004–11009
- Hub et al. 2010 Hub, J. S.; Kubitzki, M. B.; de Groot, B. L. Spontaneous Quaternary and Tertiary T-R Transitions of Human Hemoglobin in Molecular Dynamics Simulation. PLoS Comput Biol 2010, 6, e1000774
- El Hage et al. 2018 El Hage, K.; Hedin, F.; Gupta, P. K.; Meuwly, M.; Karplus, M. Valid molecular dynamics simulations of human hemoglobin require a surprisingly large box size. eLife 2018, 7, e35560
- Pezzella et al. 2020 Pezzella, M.; El Hage, K.; Niesen, M. J.; Shin, S.; Willard, A. P.; Meuwly, M.; Karplus, M. Water dynamics around proteins: T-and R-states of hemoglobin and melittin. J. Phys. Chem. B 2020, 124, 6540–6554
- Bernal 1965 Bernal, J. The structure of water and its biological implications. Symposia of the Society for Experimental Biology. 1965; pp 17–32
- Stadler et al. 2008 Stadler, A. M.; Digel, I.; Artmann, G.; Embs, J. P.; Zaccai, G.; Büldt, G. Hemoglobin dynamics in red blood cells: correlation to body temperature. Biophys. J. 2008, 95, 5449–5461
- Lesk et al. 1985 Lesk, A.; Janin, J.; Wodak, S.; Chothia, C. Hemoglobin - The surface buried between the alpha-1-beta-1 and alpha-2-beta-2 dimers in the deoxy and oxy structures. J. Mol. Biol. 1985, 183, 267–270
- Edelstein 1971 Edelstein, S. Extensions of allosteric model for haemoglobin. Nature 1971, 230, 224–227
- Kister et al. 1987 Kister, J.; Poyart, C.; Edelstein, S. J. An expanded two-state allosteric model for interactions of human hemoglobin A with nonsaturating concentrations of 2, 3-diphosphoglycerate. J. Biol. Chem. 1987, 262, 12085–12091
- Chothia et al. 1976 Chothia, C.; Wodak, S.; Janin, J. Role of Subunit Interfaces in Allosteric Mechanism of Hemoglobin. Proc. Natl. Acad. Sci. 1976, 73, 3793–3797
- Rossky et al. 1979 Rossky, P.; Karplus, M.; Rahman, A. Model for the simulation of an aqueous dipeptide solution. Biopolymers 1979, 18, 825–854
- Cheng and Rossky 1998 Cheng, Y.; Rossky, P. Surface topography dependence of biomolecular hydrophobic hydration. Nature 1998, 392, 696–699
- Chandler 2005 Chandler, D. Interfaces and the driving force of hydrophobic assembly. Nature 2005, 437, 640–647
- Chandler and Varilly 2012 Chandler, D.; Varilly, P. Lectures on molecular- and nano-scale fluctuations in water. Complex Materials in Physics and Biology. 2012; pp 75–111, 176th Course of the International School of Physics Enrico Fermi on Complex Materials in Physics and Biology, Varenna, ITALY, JUN 29-JUL 09, 2010
- Ladbury 1996 Ladbury, J. E. Just add water! The effect of water on the specificity of protein-ligand binding sites and its potential application to drug design. Chem. Biol. 1996, 3, 973–980
- Mahmoud et al. 2020 Mahmoud, A. H.; Masters, M. R.; Yang, Y.; Lill, M. A. Elucidating the multiple roles of hydration for accurate protein-ligand binding prediction via deep learning. Comm. Chem. 2020, 3, 1–13
- Rizzi et al. 2021 Rizzi, V.; Bonati, L.; Ansari, N.; Parrinello, M. The role of water in host-guest interaction. Nat. Comm. 2021, 12, 1–7
- Chothia 1974 Chothia, C. Hydrophobic bonding and accessible surface area in proteins. Nature 1974, 248, 338–339
- Zhou et al. 2003 Zhou, Y.; Zhou, H.; Karplus, M. Cooperativity in Scapharca dimeric hemoglobin: simulation of binding intermediates and elucidation of the role of interfacial water. J. Mol. Biol. 2003, 326, 593–606
- Gupta and Meuwly 2016 Gupta, P. K.; Meuwly, M. Ligand and interfacial dynamics in a homodimeric hemoglobin. Struc. Dyn. 2016, 3, 012003
- Colombo et al. 1992 Colombo, M. F.; Rau, D. C.; Parsegian, V. A. Protein solvation in allosteric regulation: a water effect on hemoglobin. Science 1992, 256, 655–659
- Monod and Jacob 1961 Monod, J.; Jacob, F. General conclusions: teleonomic mechanisms in cellular metabolism, growth, and differentiation. Cold Spring Harbor symposia on quantitative biology. 1961; pp 389–401
- Monod et al. 1965 Monod, J.; Wyman, J.; Changeux, J.-P. On the nature of allosteric transitions: a plausible model. J. Mol. Biol. 1965, 12, 88–118
- Pauling 1935 Pauling, L. The oxygen equilibrium of hemoglobin and its structural interpretation. Proc. Natl. Acad. Sci. 1935, 21, 186–191
- Koshland Jr et al. 1966 Koshland Jr, D. E.; Némethy, G.; Filmer, D. Comparison of experimental binding data and theoretical models in proteins containing subunits. Biochem. 1966, 5, 365–385
- Szabo and Karplus 1972 Szabo, A.; Karplus, M. Mathematical model for structure-function relations in hemoglobin. J. Mol. Biol. 1972, 72, 163–197
- Klauda et al. 2010 Klauda, J. B.; Venable, R. M.; Freites, J. A.; O’Connor, J. W.; Tobias, D. J.; Mondragon-Ramirez, C.; Vorobyov, I.; MacKerell, A. D.; Pastor, R. W. Update of the CHARMM All-Atom Additive Force Field for Lipids: Validation on Six Lipid Types. J. Phys. Chem. B 2010, 114, 7830–7843
- Jorgensen et al. 1983 Jorgensen, W. L.; Chandrasekhar, J.; Madura, J. D.; Impey, R. W.; Klein, M. L. Comparison of simple potential functions for simulating liquid water. J. Chem. Phys. 1983, 79, 926–935
- Park et al. 2006 Park, S.-Y.; Yokoyama, T.; Shibayama, N.; Shiro, Y.; Tame, J. R. H. 1.25 angstrom resolution crystal structures of human haemoglobin in the oxy, deoxy and carbonmonoxy forms. J. Mol. Biol. 2006, 360, 690–701
- Eastman et al. 2017 Eastman, P.; Swails, J.; Chodera, J. D.; McGibbon, R. T.; Zhao, Y.; Beauchamp, K. A.; Wang, L.-P.; Simmonett, A. C.; Harrigan, M. P.; Stern, C. D.; Wiewiora, R. P.; Brooks, B. R.; Pande, V. S. OpenMM 7: Rapid development of high performance algorithms for molecular dynamics. PLOS Comp. Biol. 2017, 13
- Buck et al. 2006 Buck, M.; Bouguet-Bonnet, S.; Pastor, R. W.; Alexander D. MacKerell, J. Importance of the CMAP Correction to the CHARMM22 Protein Force Field: Dynamics of Hen Lysozyme. Biophys J. 2006, 90, L36–l38
- Darden et al. 1993 Darden, T.; York, D.; Pedersen, L. Particle Mesh Ewald: An Nlog(N) Method for Ewald Sums in Large Systems. J. Chem. Phys. 1993, 98, 10089–10092
- Shin and Willard 2018 Shin, S.; Willard, A. P. Characterizing Hydration Properties Based on the Orientational Structure of Interfacial Water Molecules. J. Chem. Theor. Comput. 2018, 14, 461–465
- Shin and Willard 2018 Shin, S.; Willard, A. P. Water’s Interfacial Hydrogen Bonding Structure Reveals the Effective Strength of Surface-Water Interactions. J. Phys. Chem. B 2018, 122, 6781–6789
- Willard and Chandler 2010 Willard, A. P.; Chandler, D. Instantaneous Liquid Interfaces. J. Phys. Chem. B 2010, 114, 1954–1958
Supporting Information: Water Dynamics around T0 vs. R4 from Local Hydrophobicity Analysis