Digging into the Galactic Bulge: stellar population and structure of the poorly studied cluster NGC 6316
Abstract
High-resolution Hubble Space Telescope optical observations have been used to analyze the stellar population and the structure of the poorly investigated bulge globular cluster NGC 6316. We constructed the first high-resolution reddening map in the cluster direction, which allowed us to correct the evolutionary sequences in the color magnitude diagram (CMD) for the effects of differential reddening. A comparison between the CMDs of NGC 6316 and 47 Tucanae revealed strikingly similar stellar populations, with the two systems basically sharing the same turn-off, sub-giant branch, and horizontal branch morphologies, indicating comparable ages. The red giant branch in NGC 6316 appears slightly bluer than in 47 Tucanae, suggesting a lower metal content. This has been confirmed by the isochrone fitting of the observed CMD, which provided us with updated values of the cluster age, distance, average color excess, and metallicity. We estimated an absolute age of Gyr, consistent with the age of 47 Tucanae, an average color excess , and a true distance modulus that sets the cluster distance at 11.3 kpc from the Sun. In addition, the photometric estimate of the cluster metallicity suggests [Fe/H], which is dex smaller than that of 47 Tucanae. We also determined the gravitational center and the density profile of the system from resolved stars. The latter is well reproduced by a King model. Our results confirm that NGC 6316 is another extremely old relic of the assembly history of the Galaxy.
1 Introduction
Globular Clusters (GCs) are ancient stellar systems that are ubiquitous in the Milky Way. As such, the study of their structural, kinematic and dynamical properties is of paramount importance if we are to comprehend their connection with the early stages of the Galaxy assembly (see Forbes et al., 2018, for a detailed discussion). In particular, a comprehensive study and characterization of GCs located within the Galactic bulge has been proven to be mandatory to trace the properties of the bulge stellar population in terms of kinematics, chemical abundances, and age (see Bica et al., 2006; Valenti et al., 2007; Barbuy et al., 2018; Pallanca et al., 2019; Ferraro et al., 2009, 2016, 2021). However, these studies present significant challenges since bulge GCs are very dense and distant, and their light is severely absorbed by the presence of dark clouds of dust and gas along the line of sight. Also, their structure can be subjected to strong distortions due to the effects of tidal forces exerted by the bulge (Nordquist et al., 1999; Chun et al., 2015). As a consequence, their main parameters are still poorly constrained, although they seem to share very old ages between and Gyr (e.g. Kerber et al., 2018, 2019; Ortolani et al., 2019; Cadelano et al., 2020b; Ferraro et al., 2021), and a wide range of metallicities [Fe/H] (e.g. Valenti et al., 2007, 2010). They also seem to follow an age-metallicity correlation with the younger GCs being more metal-rich than the older GCs (see Saracino et al., 2019; Pallanca et al., 2021a).
This study is part of a large ongoing program aimed at characterizing the GCs located in the innermost regions of the Galactic bulge (see, e.g., Valenti et al. 2010; Lanzoni et al. 2007, 2010; Ferraro et al. 2009; Origlia et al. 2011, 2013; Massari et al. 2014; Ferraro et al. 2016; Saracino et al. 2016; Cadelano et al. 2018; Saracino et al. 2019; Pallanca et al. 2019, 2021a, 2021b; Ferraro et al. 2021), which can provide us with insights regarding the processes that led to the formation of the central region of the Milky Way (Lee et al., 2018). This paper is focused on the case of NGC 6316, which is a relatively scarcely investigated cluster, with poorly known and still debated properties. For instance, the Harris catalog (Harris, 1996, 2010 edition) quotes [Fe/H] for its metallicity, although values ranging from to are found in the literature (Carretta et al., 2009; Dias et al., 2016; Conroy et al., 2018)). The cluster is located at a distance of 11.6 kpc (Valenti et al., 2007) from the Sun and follows a highly eccentric orbit confined within the bulge, with a perigalactic distance of only 1.45 kpc (Baumgardt et al., 2019). Due to its location within the bulge, its stellar population is highly contaminated by field stars and obscured by the presence of dust clouds along the line of sight (Sandell et al., 1987). The first color-magnitude diagram (CMD) of NGC 6316 was published by Davidge et al. (1992) in the and filters with observations performed at the 3.6 m Canada-France Hawaii Telescope (CFHT). The authors comment on the remarkable resemblance between NGC 6316 and 47 Tucanae (hereafter, 47 Tuc) based on the brightness widths of their horizontal branches, and they suggest that NGC 6316 is slightly more metal-rich than 47 Tuc. Finally, an age of 13.8 0.3 Gyr has been derived by Conroy et al. (2018), on the basis of stellar population models. The goal of this work is to carry out the first high-resolution photometric study of the inner regions of NGC 6316 to characterize its stellar population properties. This paper is structured as follows. In Section 2 we describe the photometric analysis performed on the acquired data set. In Section 3 we describe the differential reddening correction. In Section 4 we discuss the morphology of the CMD of NGC 6316 and its comparison to that of 47 Tuc, describing how we used it to obtain first estimates of the distance modulus and the color excess. In Section 5 we discuss the fitting of the differential reddening corrected CMD by means of three sets of isochrones, which provides us with updated values of the cluster distance, color excess, age, and metallicity. In Section 6 we determine the center of gravity of the cluster, its radial density profile and its structural parameters. Finally, in Section 7 we summarize our results.
2 observations and Data reductions
The present work is based on a proprietary data set obtained with the Wide Field Camera 3 (WFC3) onboard the (GO:15232, PI: Ferraro; Ferraro, 2017). The data set is composed of seven images ( s and 1 656 s exposures) in the F555W filter, and seven images ( s and 643 s exposures) in the F814W filter. To avoid the inter-chip gap of the WFC3, in each pointing the cluster center was positioned in chip 1, while chip 2 samples distances out to 120.
We have performed the photometric analysis using the standard package of DAOPHOT IV (Stetson, 1987) on the -flc images, which are already corrected for dark-subtraction, flat-field, bias, and charge transfer efficiency. We have used a selection of 200 isolated stars in each image to accurately model the shape of the Point Spread Function (PSF). Its FWHM was set to 1.5 pixels () and we used a 20-pixel radius () to sample each of these isolated stars. Based on a test, in each image, the best PSF model was a Moffat function (Moffat, 1969). We thus applied it to all the sources detected above a 5 threshold from the local background level. We then built a master catalog containing the instrumental magnitudes and positions of each stellar source detected in at least 3 images. At the corresponding positions of all these sources, a fit was forced in each image using DAOPHOT/ALLFRAME (Stetson, 1994). The results have been combined together using DAOPHOT/DAOMASTER to finally obtain homogenized magnitudes and their related photometric errors.
The instrumental magnitudes have been calibrated to the VEGAMAG system using the zero points reported at the WFC3 website111https://www.stsci.edu/hst/instrumentation/wfc3/data-analysis/photometric-calibration/uvis-photometric-calibration, namely, ZPF555W1 = 25.735 and ZPF555W2 = 25.720 for stars the detected in chips 1 and 2 in the F555W filter, respectively and ZPF814W1 = 24.598 and ZPF814W2 = 24.574 for the corresponding F814W magnitudes. Finally, we applied independent aperture corrections for each chip and filter.
The instrumental positions of the stars present in our images have been corrected for geometric distortions in both chips, according to the procedure described by Bellini et al. (2011). They were also converted into the absolute system celestial coordinates (RA and Dec) through cross-correlation with the stars in common with the -DR3 catalog (Gaia Collaboration et al., 2016, 2022).
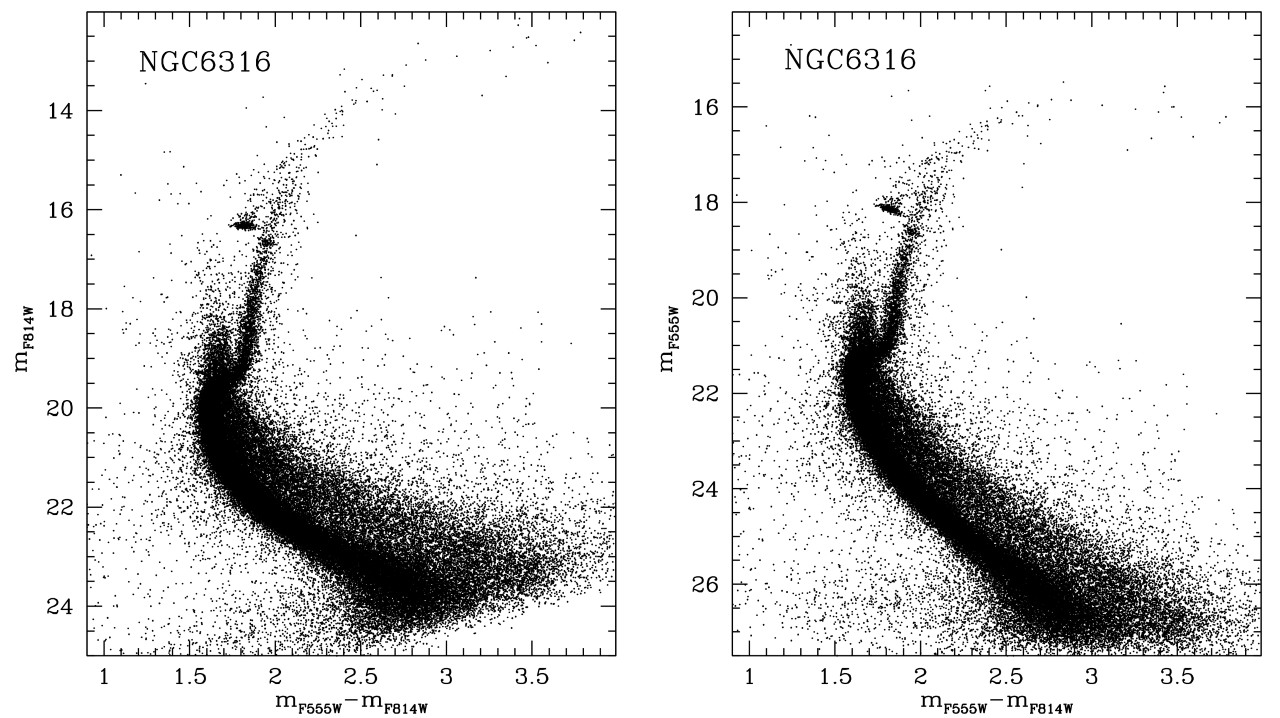
We used this calibrated star catalog to create the first deep CMD of the cluster (Fig. 1). As mentioned in Section 1, NGC 6316 is located within the bulge causing its CMD to suffer from a considerable amount of contamination from field interlopers. Nevertheless, its main features are easily distinguishable. The Main Sequence (MS) spans a range of magnitudes between 20.0 mF814W 24.0 and shows the Turn-Off (TO) point at around mF814W = 19.7. The CMD also shows a densely populated red Horizontal Branch (HB) at about mF814W = 16.3 with no blue extension, a well-defined Sub Giant and Red Giant Branches (SGB and RGB, respectively) with the characteristic bump at mF814W = 16.7, and the Asymptotic Giant Branch (AGB) above the HB.
3 Differential reddening correction
The catalog of GCs compiled by Harris (1996) quotes a reddening value of for NGC 6316. This is caused by dark clouds obstructing our line of sight, as already suggested by Sandell et al. (1987) and Heitsch & Richtler (1999) who showed that there is a small but non-negligible differential reddening in the direction of the cluster.
The presence of differential reddening has the effect of broadening the main evolutionary sequences on the CMD, and needs to be accounted for in order to accurately derive the cluster properties. To correct for this, we made use of the iterative method fully described in Pallanca et al. (2019, 2021b) and Cadelano et al. (2020b) that we briefly summarize in the following. We begin by selecting a reference sample of stars located at from the center of the cluster in order to avoid field interlopers on the CMD, and between magnitudes 16.0 mF555W 24.0, i.e., along the MS, SGB, and RGB. The CMD created from the reference sample was divided vertically into magnitude bins of 0.5 mag, except at 20.0 mF555W 24.5, where we used 0.25 magnitude bins to obtain a finer sampling. We then estimated the sigma-clipped median values of the (mF555W mF814W) color and the mF555W magnitude of each bin. By interpolating these medians we created a Mean Ridge Line (MRL), which we used to estimate the distance along the direction of the reddening vector to all the stellar sources in the reference sample. The reddening vector is defined using the extinction coefficients = 3.227 and = 1.856, appropriate for TO stars (G2V type) and obtained from Cardelli et al. (1989) and Girardi et al. (2002), under the assumption of the standard extinction coefficient 222Several authors have previously suggested that the extinction law in the direction of the Galactic bulge is variable, depending on the line of sight (see (Stasińska et al., 1992), (Udalski, 2003)) with values between 2.5 ((Nataf et al., 2013); (Pallanca et al., 2021b, a)) to 3.2 (Bica et al., 2006). However, since we lack the near-infrared observations necessary to estimate the value of in the direction of NGC 6316, we have adopted the standard extinction coefficient .. Finally, we assigned a value to each source in our catalog as the -clipped median of the values measured for the closest reference stars. Each resulting value of can be then transformed into the relative differential reddening as:
| (1) |
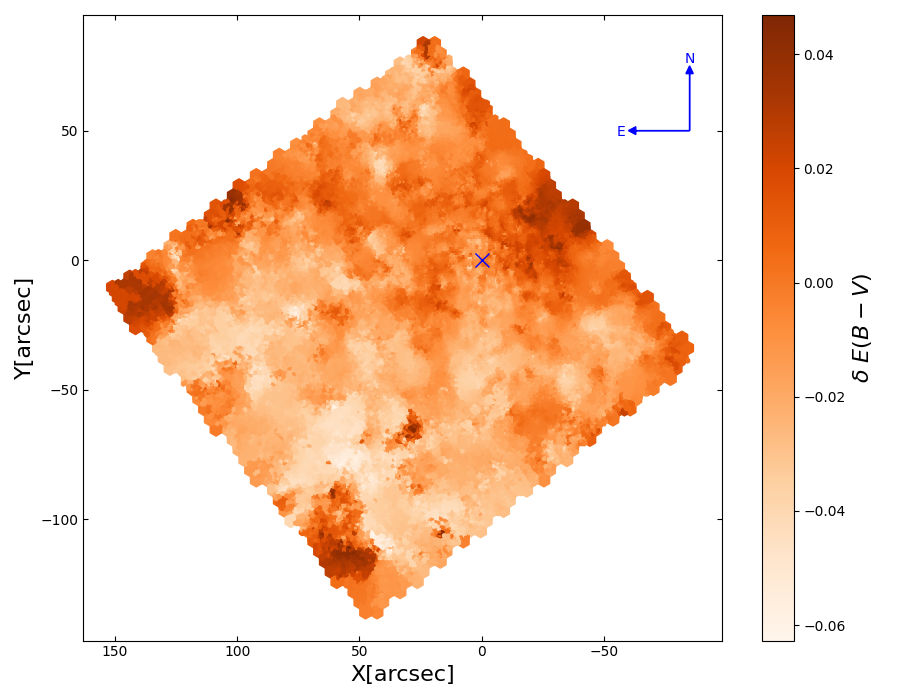
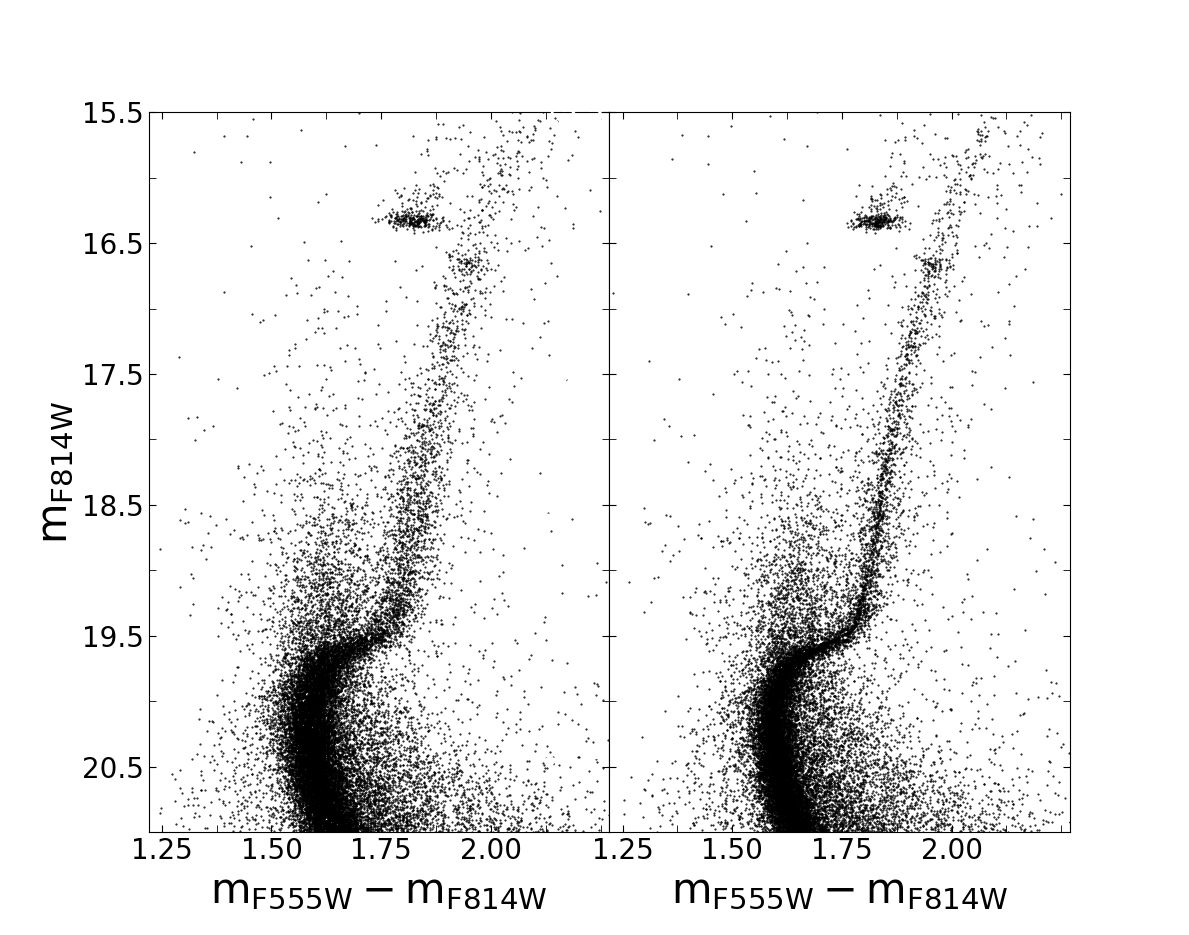
We performed this iteration four times using the 50, 30, 25, and 15 closest stars to increase the spatial resolution in each iteration. The resulting reddening map is presented in Fig. 2. It clearly shows the inhomogeneity of the medium causing the differential reddening across the cluster with a patchy structure and, possibly, a slightly larger average extinction in the Northern hemisphere. We found the differential reddening of the cluster to vary between 0.047, within the sampled field of view. To make more evident the improvement in the definition of the evolutionary sequences in the CMD after the application of the differential reddening correction, in Fig. 3 we show a comparison between the original and the corrected CMDs. After this correction, the main features of the CMD such as the MS, the SGB, the RGB and the HB look significantly sharper.
4 Comparison with 47 Tuc
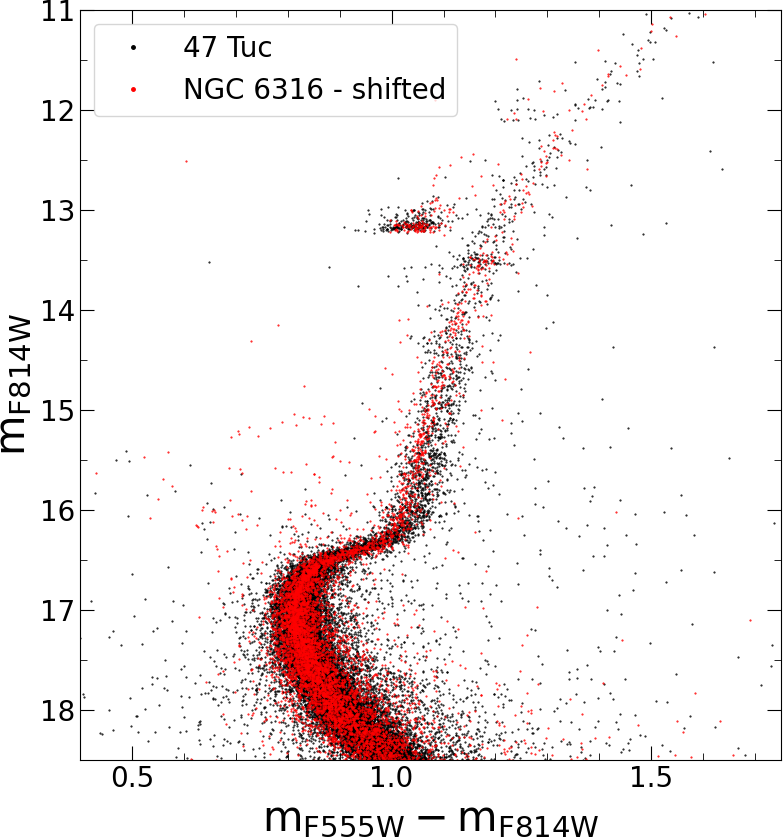
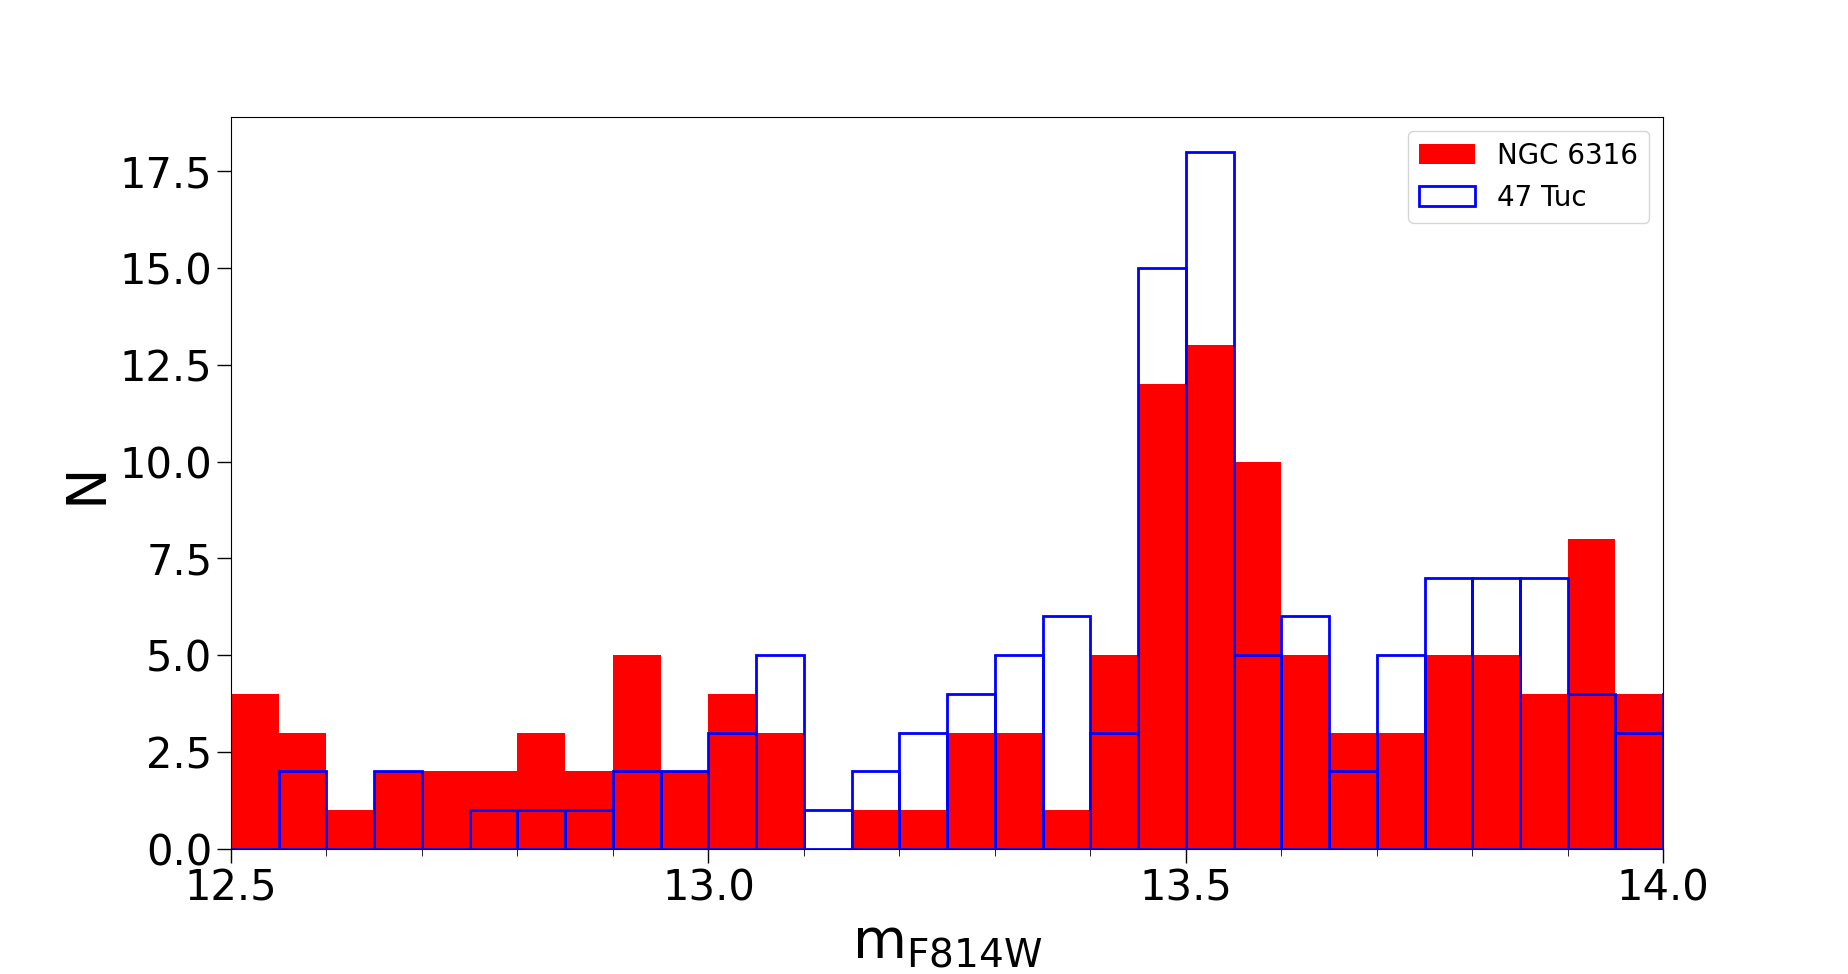
Since 47 Tuc is one of the most studied GCs in the Milky Way and its parameters have been very well constrained by several independent studies, we can use its CMD as a template to perform a detailed comparison with the CMD of NGC 6316 corrected for differential reddening. This will provide a first empirical hint on its basic properties, as the overall morphology of the evolutionary sequences closely resemble those observed in 47 Tuc (Davidge et al., 1992) suggesting similar metallicities and ages ([Fe/H] = -0.76 and t = 12 - 13 Gyr for 47 Tuc; e.g., Carretta et al. (2009), Thompson et al. (2020), and references therein). To do this, we have used 4 images of 47 Tuc in the F555W and F814W filters (30 s and 0.5 s, per filter) acquired with the WFC3 through the GO Proposal 11664 (PI: Thomas Brown). For the photometric analysis, we have followed the exact same procedure described in Section 2, thus obtaining a CMD in the same photometric bands of NGC 6316. This allowed us to perform a direct comparison of the two CMDs. To best highlight the evolutionary sequence populated by likely cluster members, in the comparison we considered only stars populating the inner portion of both clusters ( i.e., stars at r 20 from their respective centers) and with a high-quality photometry (0.05sharpness0.05). We found that shifts in magnitude and color equal to m and (m m, respectively, are required to make the sequences of NGC 6316 matching those of 47 Tuc. The result is shown in Fig. 4: indeed, the resemblance between the two CMDs is remarkable. In fact, the level and the morphology of both HBs is basically the same, as well as the luminosity and morphology of the TO and SGB regions, thus suggesting that the two clusters are essentially coeval. Moreover, the RGB bump is located exactly at the same luminosity in both clusters (mF814W 13.5 in the figure). This is further confirmed by the comparison between the RGB luminosity functions in the magnitude range 12.5 mF814W 14.0 (Fig. 5), where the highest peaks correspond to the RGB bumps in the two systems. On the other hand, it is worth noticing that the RGB branch of NGC 6316 is slightly but systematically bluer than that of 47 Tuc, possibly suggesting a small difference in terms of , with NGC 6316 being slightly metal poorer than 47 Tuc. The relative shifts needed to match the evolutionary sequences of the two clusters also provided us with first estimates of NGC 6316 distance and average color excess. By adopting the coefficients and from Section 3 and assuming for 47 Tuc a color excess of 0.03 0.01 and a distance modulus of 13.21 0.06 (random, 0.03 systematic; Brogaard et al. 2017), NGC 6316 turns out to have an average color excess and a distance modulus .
5 Isochrone fitting
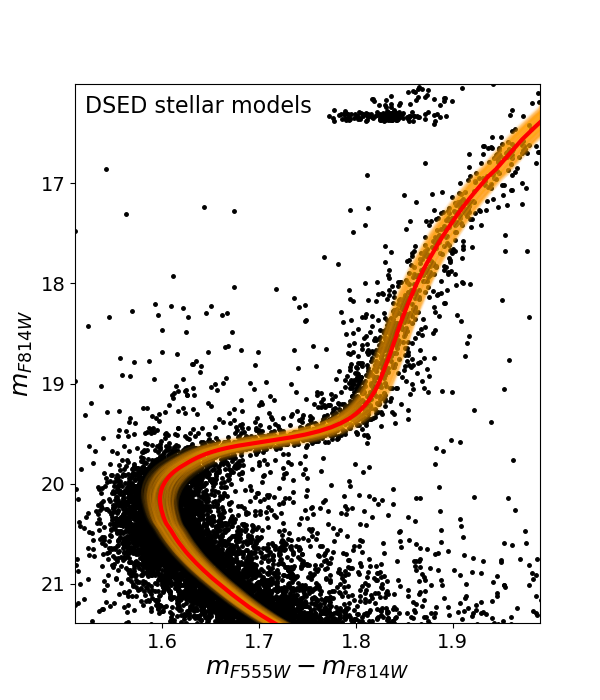
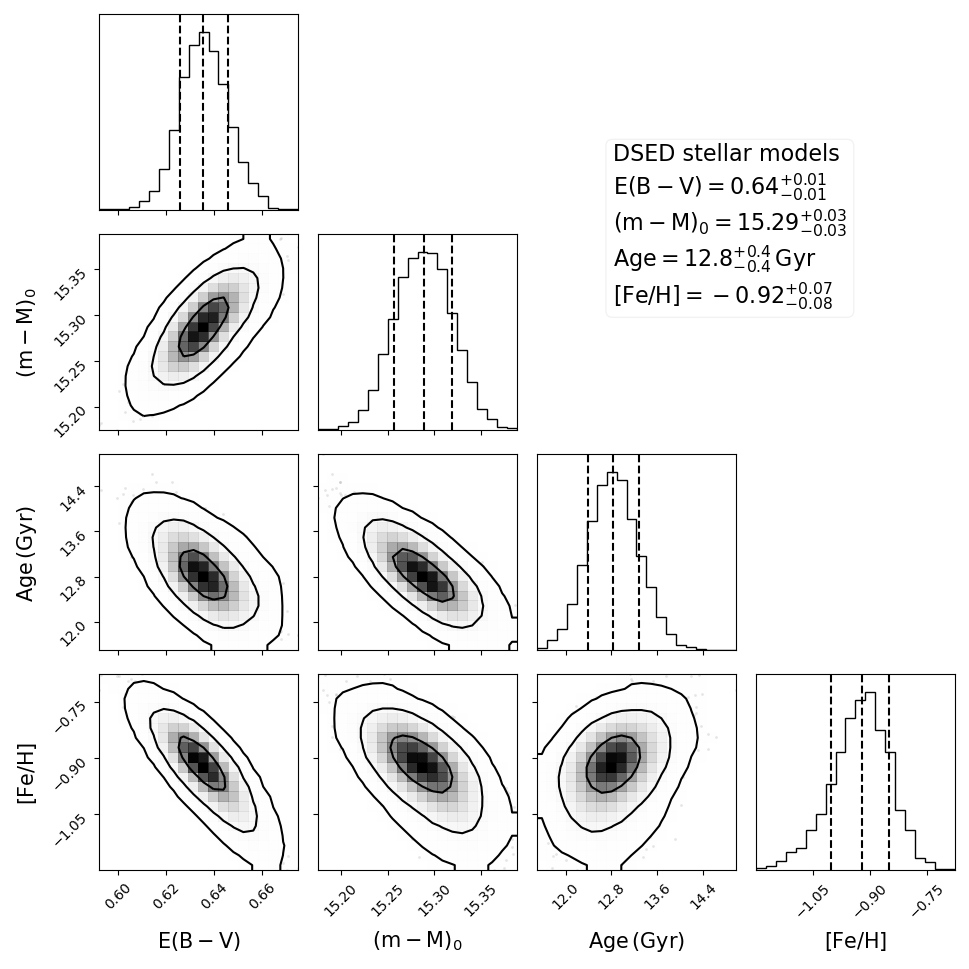
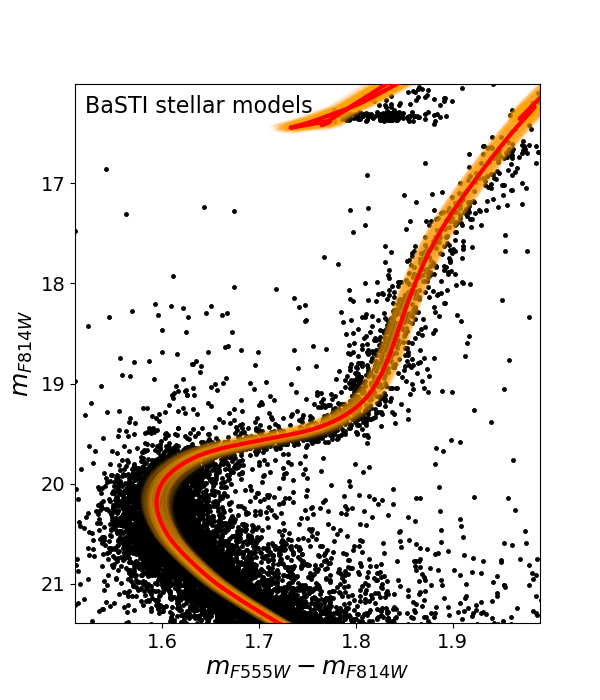
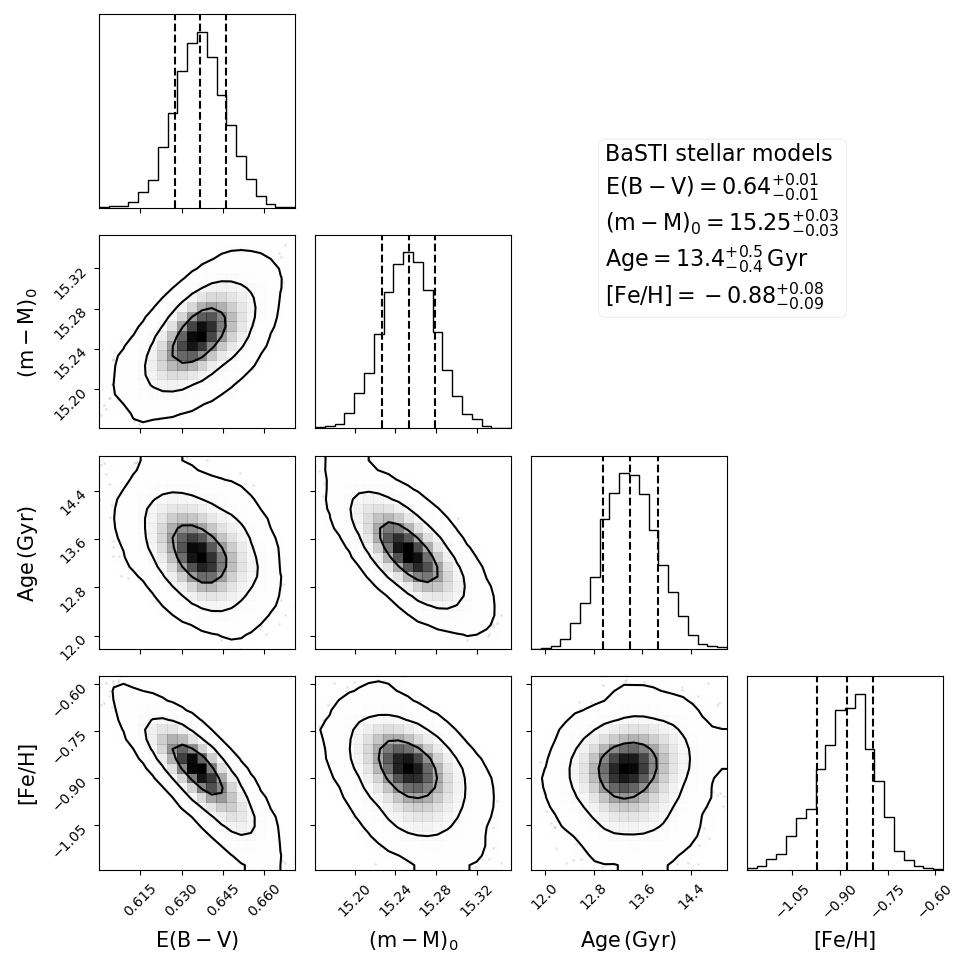
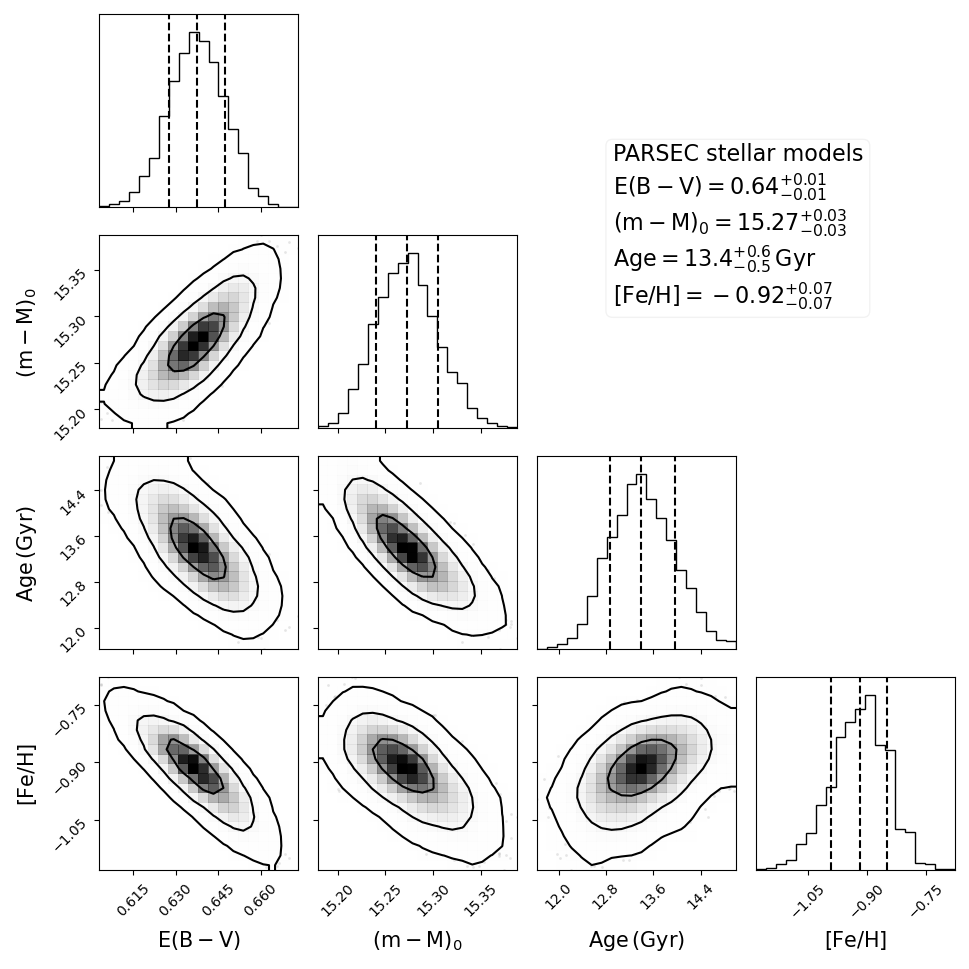
In order to confirm these preliminary hints, we have applied a Bayesian procedure similar to that used by Cadelano et al. (2020b, see also , ) that allows to derive a “photometric” determination of the age, distance, color excess and metallicity performing an isochrone fitting of the observed CMD. To this end, the CMD of NGC 6316 has been compared to a grid of different isochrone sets computed in a suitable range of different ages and metallicities, distance moduli and color excesses. We extracted the isochrones from three different databases, namely, DSED (Dotter et al., 2008), BaSTI (Pietrinferni et al., 2021), and PARSEC (Marigo et al., 2017). For each isochrone, we assumed a standard He content = 0.25 and = +0.4, as typically measured for bulge GCs. Following the same computational approach described in Cadelano et al. (2020b, see their Section 4.2), we compared the observed CMD of the cluster with each family of stellar models adopting a Markov Chain Monte Carlo (MCMC) sampling technique. In doing this, we assumed a Gaussian likelihood function (see equations 2 and 3 in Cadelano et al. 2020b). To sample the posterior probability distribution in the n-dimensional parameter space, we used the emcee code (Foreman-Mackey et al., 2013, 2019). We explored a wide range of ages from 10 to 15 Gyr, in steps of 0.2 Gyr, assuming a flat prior within this range. As quoted in the Introduction, the metallicity of this cluster is not well defined through spectroscopy, since literature works show a large spread in the derived [Fe/H] values (see Section 1 and 3). Therefore, we explored the metallicity space using a flat prior in a range from to , in steps of 0.05 dex. The isochrones absolute magnitudes were converted to the observed frame using color excesses and distance moduli following Gaussian prior distributions peaked at the previously determined values, i.e., and , respectively (see Section 3). We used temperature-dependent extinction coefficients from Casagrande & VandenBerg (2014). In order to minimize the contamination from field interlopers and maximize the accuracy of the result, we performed the fit only on stars within from the center (see Section 6), with a high-quality photometry (i.e. sharpness parameter ) and in the magnitude range , corresponding to the CMD region most sensitive to stellar age and metallicity333In the central regions of this bulge GC, the -DR3 data (Gaia Collaboration et al., 2016, 2022) sample only a small fraction of bright stars, thus not substantially improving in the selection of cluster members for building the necessary CMDs..
The results obtained in terms of age, metallicity, distance modulus and color excess, are shown in Figure 6 for the three adopted sets of theoretical models. The left-hand panels show the CMD and the best-fit isochrones. The one- and two-dimensional posterior probabilities for all of the parameter combinations are presented in the right-hand panels as corner plots. The best-fit values and their uncertainties (based on the , , percentiles) are also summarized in Table 1. As apparent, the resulting values of color excess and distance modulus are in good agreement with those obtained from the direct comparison with the CMD of 47 Tuc. We also verified that the results remain unchanged within the uncertanties if a uniform prior spanning of a larger interval of values for both the and is assumed. The best-fit age turns out to be 12.8 Gyr if the DSED models are assumed, and 13.4 Gyr with the two other sets of isochrones. These results are in agreement within the uncertainties and the differences can be explained by the fact that each model uses slightly different values for the same parameters (like, the solar abundances, reaction rates, electron conduction opacities, mixing length, etc…). Finally, as expected from the CMD comparison, the isochrone fitting results suggest that NGC 6316 hosts a stellar population slightly metal poorer than that of 47 Tuc, with [Fe/H].
| Model | Age | |||
|---|---|---|---|---|
| [Gyr] | dex | [mag] | [mag] | |
| DSED | ||||
| BaSTI | ||||
| PARSEC | ||||
| average |

6 the density profile of ngc 6316
6.1 Center of gravity
In order to derive the structural parameters of NGC 6316, we need a reliable measurement of the cluster gravitational center (). To this aim, we applied a procedure that, starting from a first-guess value, iteratively computes the average of the projected x- and y-positions of a selected sample of stars, and reaches convergence when the difference between two consecutive iterations is negligible (see, e.g., Montegriffo et al., 1995; Lanzoni et al., 2007, 2019; Raso et al., 2020). As a first-guess center, we adopted the coordinates reported in the catalog of Orbital Parameters of Galactic Globular Clusters (Baumgardt & Hilker, 2018). The sample of stars used in the computation has been selected adopting different magnitude limits (20.5 mF555W 22.3 in steps of 0.5 mag) and different distances from the cluster center (from 15 to 35 in steps of 5). In order to mitigate the contamination due to field interlopers, we considered only stars with colors between 1.5 mF555W-mF814W 2.0. The final position of is the average of the centers determined for each combination of magnitude and distance limits: R.A. = 17h 16m 37s.2 and Dec = -28∘ 08 23.42 with an uncertainty of 0.2. Our estimate is located 1.6 north-west from the initial first-guess center reported by Baumgardt & Hilker (2018).
6.2 Stellar density profile
The WFC3 field of view covers a region of and thus only partially samples the cluster radial extension. Therefore, in order to determine the entire density profile we need a complementary wide-field catalog of stars, extending up to the outskirts of the cluster and beyond. We used a star catalog covering a circular area around NGC 6316 with a radius extracted from -DR3. The magnitudes have been corrected for the effects of differential reddening using the publicly available maps by Schlafly & Finkbeiner (2011). These maps show strong reddening variations within the field of view sampled by the adopted catalog, with ranging from 0.25 to 2.05. Such a correction is therefore mandatory since, as demonstrated by Cadelano et al. (2017), reddening variations across the wide-fields used to sample the cluster external regions can lead to severe deviations from the intrinsic density profile of the system.
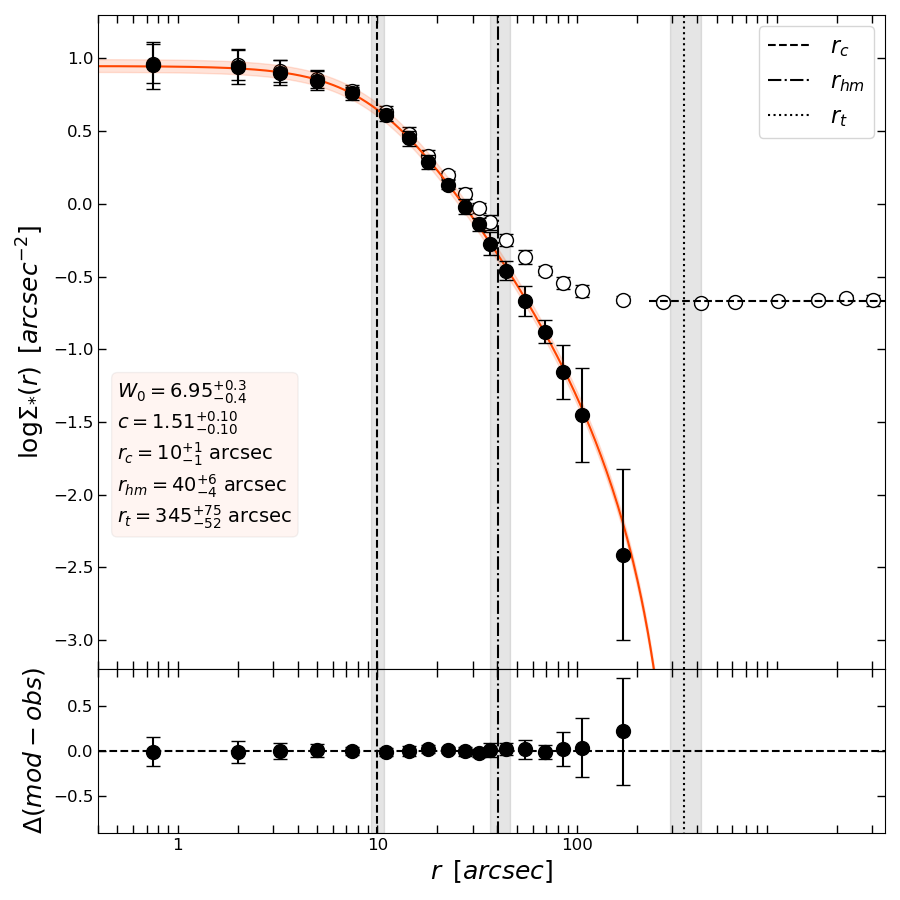
To estimate the density profile, we used the procedure described, e.g., in Miocchi et al. (2013); Lanzoni et al. (2019); Raso et al. (2020). Briefly, in both the catalogs, we selected the stars brighter than the MS-TO applying a cut parallel to the reddening vector in order to mitigate possible residual effects of differential reddening. Such a selection naturally includes only stars with approximately the same mass. For the WFC3 data set we selected 17 concentric rings around with radii up to . This allowed us to sample the density profile of the cluster inner regions. In the case of the -DR3 data, we selected 12 concentric rings with radii between 60 and 3600 in order to sample the outermost regions of the cluster, as well as the Galactic background density. Each ring is divided into four subsectors and the average and standard deviation of the different density measurements in each sub-sector have been chosen as the resulting density value of the ring and its related uncertainty. The profile was then vertically rescaled to match that of the WFC3 using 4 common points in the radial range between 60 and 120. This provided us with a full stellar density profile of the cluster from the central region and well beyond its outskirts (see the empty circles in Fig. 7). The profile shows a flat behavior out to , indicating that this is likely not a post core-collapsed system, then it steadily decreases out to 200 from the center. At distances larger than the stellar background becomes dominant over the cluster population. This is clearly illustrated by the well-defined plateau present in the outermost portion of the density profile. Indeed, the spatial distribution of background stars is expected to be approximately uniform on the considered radial scale. In order to obtain the intrinsic density profile of the system, the background contribution must be removed from the observed profile.
For this reason, the level of Galactic field contamination has been estimated by averaging the seven outermost points aligned in the plateau (see the horizontal dashed line in Fig. 7), and then subtracted from the observed distribution (empty circles in Fig. 7), thus obtaining the background-decontaminated star density profile of NGC 6316 (filled circles in Fig. 7). It is apparent that after the field subtraction, the profile remains almost unchanged at small radii, which are dominated by the cluster population, while it significantly decreases in the most external regions, where it turns out to be below the Galactic background. This clearly indicates that an accurate measurement of the background level is crucial for the reliable determination of the outermost portion of the density profile.
The cluster’s structural parameters have been derived by fitting the background-decontaminated profile with a single-mass King model (King, 1966), assuming spherical symmetry and orbital isotropy. Following Raso et al. (2020), we performed the fit using a MCMC approach implemented by the emcee package (Foreman-Mackey et al., 2013, 2019). We assumed uniform priors on the parameters of the fit (i.e. the King concentration parameter , the core radius , and the value of the central density). Therefore, the posterior probability distribution functions are proportional to the likelihood , where the statistic is calculated between the measured density values and those predicted by the whole family of adopted models. The best-fit model is shown as a red line in Fig. 7, and the resulting structural parameters are also labeled. The density profile is nicely reproduced by a King model with an intermediate concentration of about , and a small core and tidal radii of about and , respectively. As shown by the residuals of the fit (bottom panel of Fig. 7), no signs of deviations from the King distribution are observed neither in the internal, nor in the external regions, thus confirming that the cluster is not in a core-collapse phase and it is not subjected to a severe tidal stripping in the outer regions due to its motion in the bulge potential field.
For the sake of completeness, we have also estimated the central and half-mass relaxation times as log(/yr) = 8.11 and log(/yr) = 9.09, following Equation (10) and Equation (11) in Djorgovski (1993), respectively. The complete list of the basic parameters estimated for NGC 6316 is summarized in Table 2.
7 summary and conclusions
We used high-resolution observations to characterize the stellar population of the poorly studied GC NGC 6316 located in the Galactic bulge. We obtained the first high-quality CMD of the system extending down to mag below its MS-TO, and we corrected it for the effects of differential reddening. The comparison between the CMD of NGC 6316 and that of 47 Tuc in the same filter combination showed a remarkable similarity between the respective stellar evolutionary sequences, apart from a slightly bluer color of the RGB in the former system, suggesting a slightly lower metallicity. This comparison provided us with the first-guess values for the average color excess and the cluster distance, which we then adopted in the isochrone fitting of the CMD. This has been performed by using three different sets of models (DSED, BaSTI and PARSEC) and the weighted averages of the obtained results provided us with updated estimates of the cluster paramaters (see the last row of Table 1). The average color excess in the direction of NGC 6316 turns out to be , which is in rather good agreement with the value of 0.61 estimated by Davidge et al. (1992). The distance modulus translates into a distance kpc from the Sun, which is in agreement with the values previously estimated by both Valenti et al. (2007), and Baumgardt & Vasiliev (2021, kpc). Note that the Harris (1996) catalog reports instead, a kpc shorter distance (10.4 kpc), and a 0.1 mag lower reddening (0.54). The best-fit age is Gyr, which is in good agreement, as expected from the CMD comparison, with the age of 47 Tuc determined by different authors (e.g., Gyr by Zoccali et al., 2001; 12.75 0.50 Gyr by Dotter et al., 2010; 11.8 1.6 Gyr by Brogaard et al., 2017; and 12.0 0.5 Gyr by Thompson et al., 2020). Previous estimates of the age of NGC 6316 include 10.0 Gyr (Santos & Piatti, 2004) and 10.73 Gyr (Zhang et al., 2010), which are noticeably smaller than the ones obtained in this work.
Finally, all the three models suggest a metallicity below , with an average value [Fe/H]. This is dex smaller than that measured for 47 Tuc (Harris, 1996), as expected from the comparison of the RGB color in the two clusters. Although accurate measurements of the cluster metallicity from high-resolution spectroscopy are needed to properly assess the metal content of NGC 6316, this result suggests that values as large as (e.g. Harris, 1996; Dias et al., 2016) are likely to be excluded.
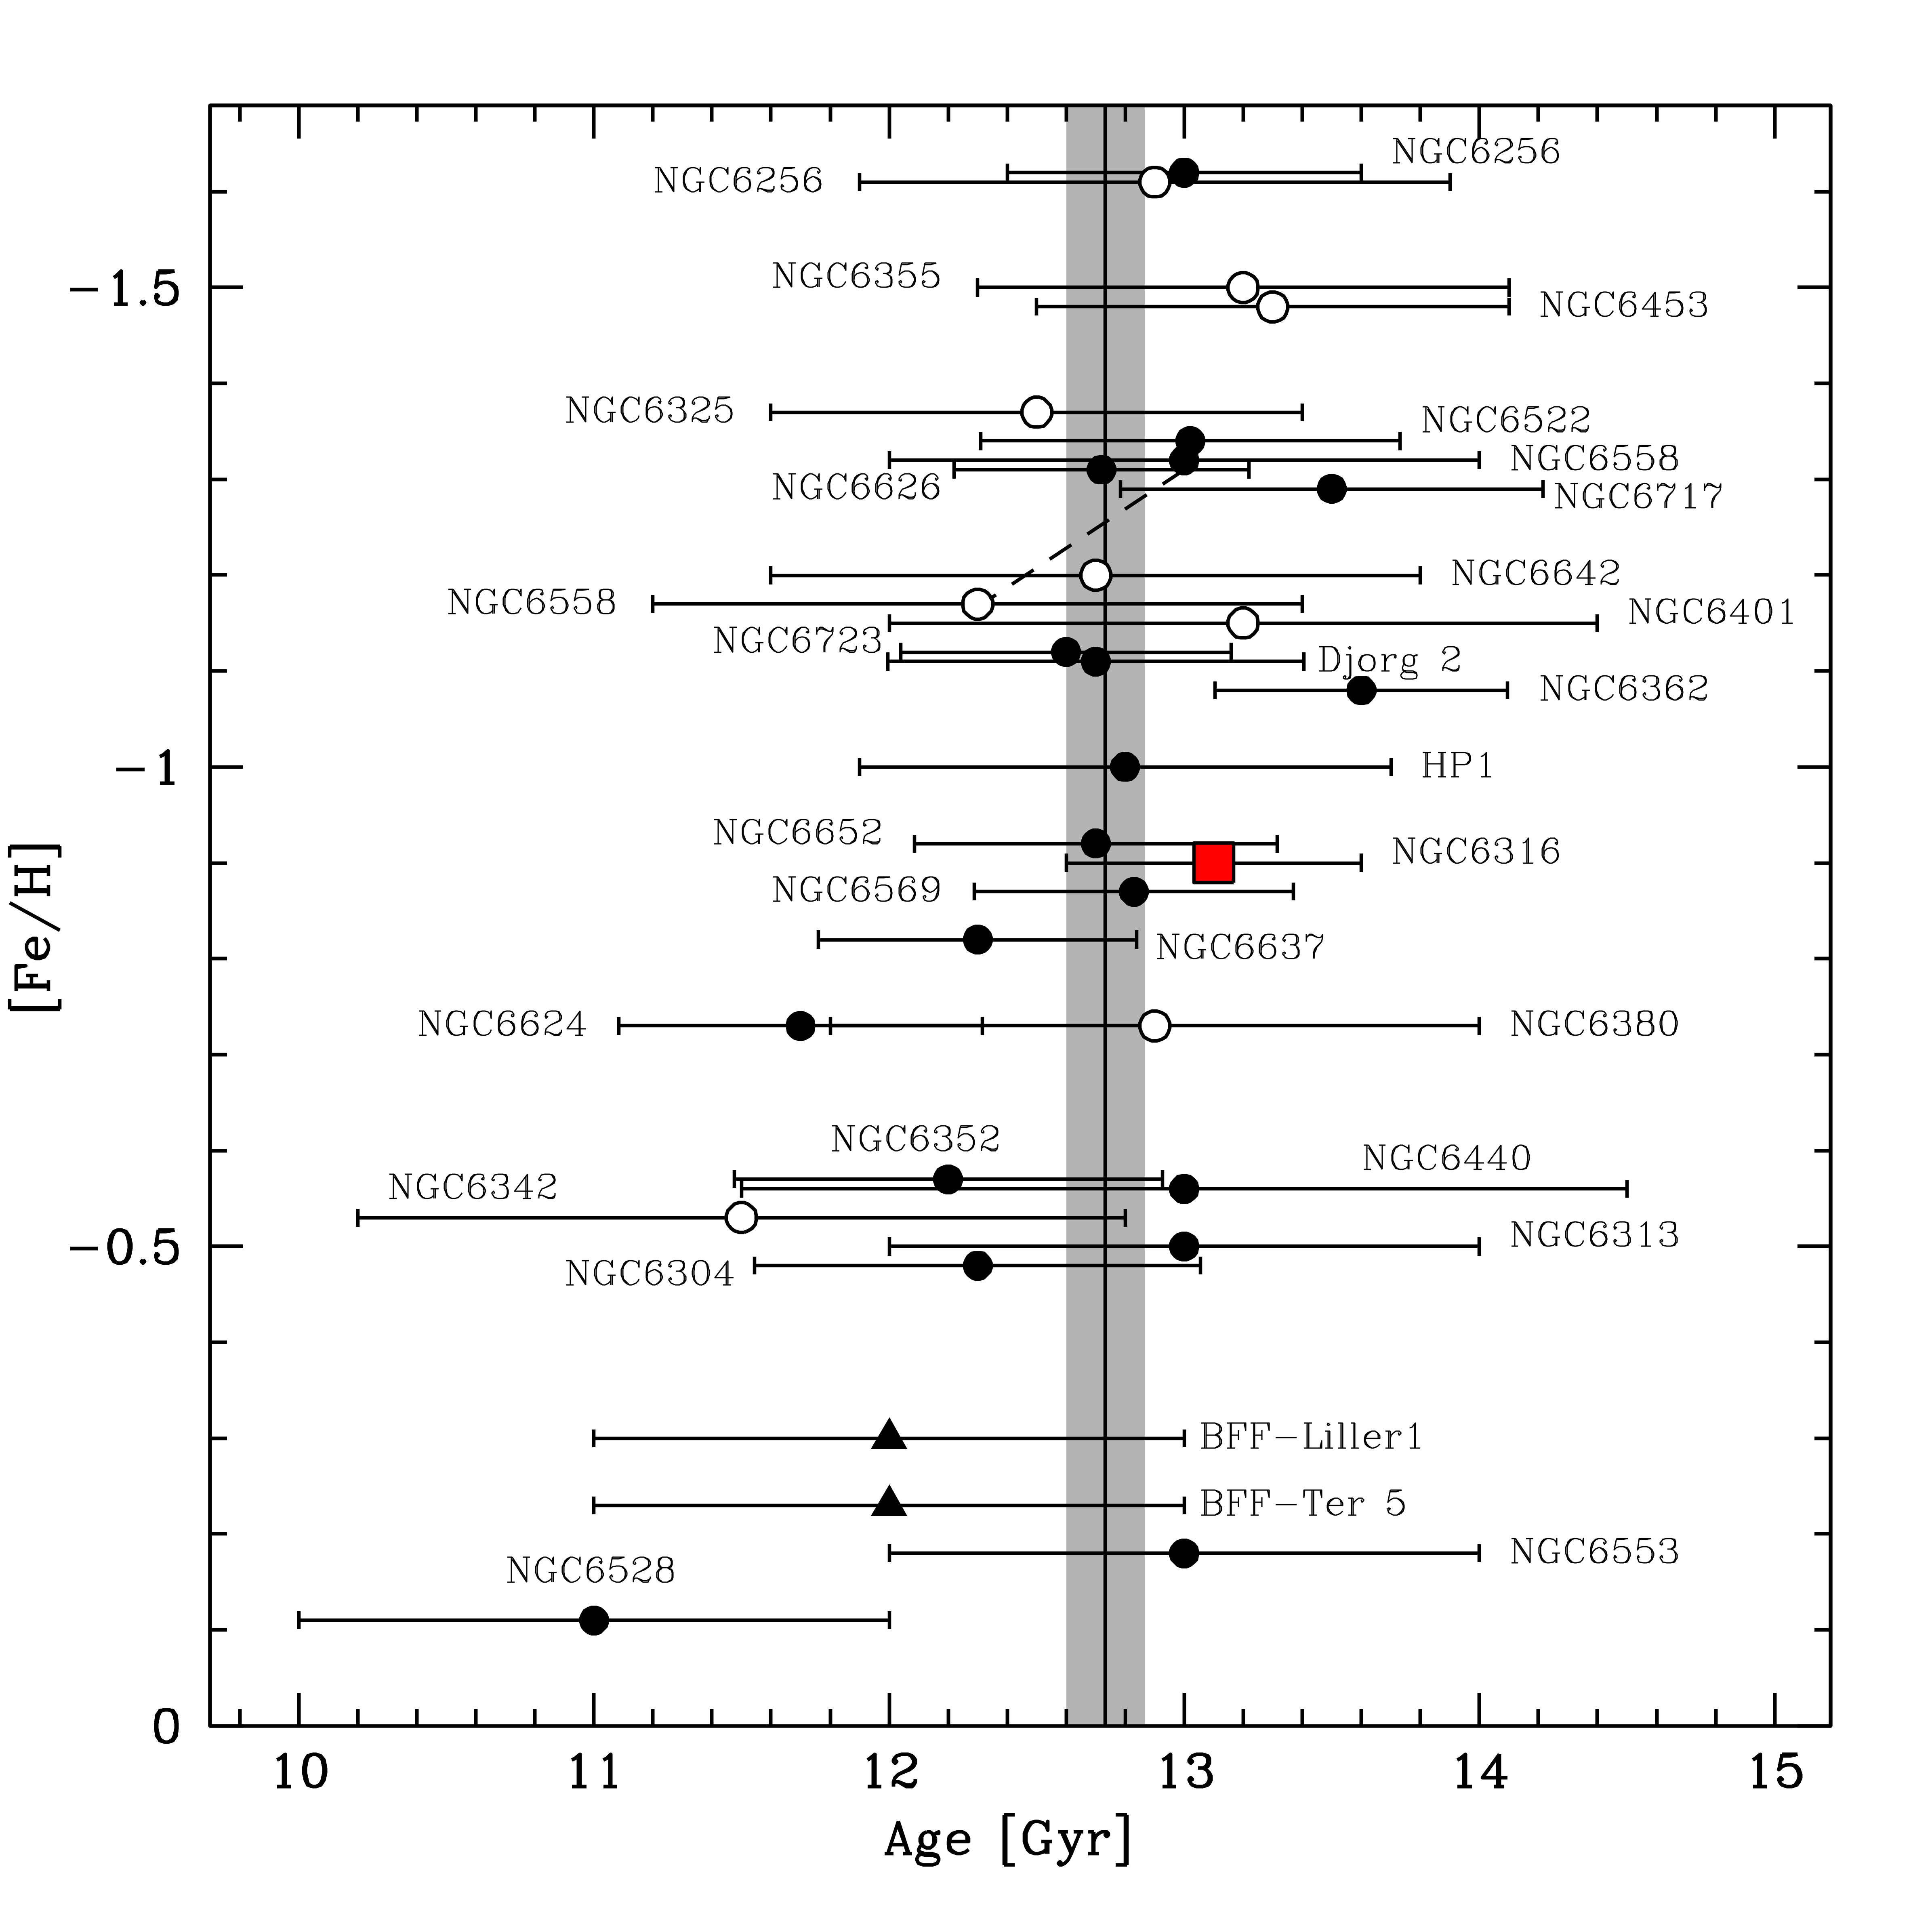
By assuming our photometric estimates, NGC 6316 well fits in the age-metallicity distribution drawn by the bulge GCs with available age estimates (see Fig. 8). Here we also included the two Bulge Fossil Fragments (Liller 1 and Terzan 5) identified so far (Ferraro et al., 2009, 2016, 2021). These are peculiar stellar systems that, despite their appearance as genuine GCs, host multi-age stellar populations and could be the remnants of massive clumps that contributed to form the bulge at the epoch of the Galaxy assembly. From the comparison, it is apparent that also these peculiar systems share very old ages with the majority of GCs and Galactic field stars located in the bulge (Zoccali et al., 2003; Clarkson et al., 2011; Valenti et al., 2013). The weighted mean age of the entire sample (27 GCs + 2 bulge fossil fragments) is Gyr. The values of age and metallicity estimated in this work, together with the orbital parameters (e.g., Baumgardt et al. (2019)) and results from the analysis of the integrals of motion (Massari et al., 2019), are consistent with NGC 6316 being formed within the Galactic bulge.
Finally, by combining the observations with the wide-field, publicly available -DR3 catalog, we built the cluster stellar density profile from resolved stars. This is very well reproduced by a King model with an intermediate concentration of about 1.51, a compact core of 0.55 pc () and an effective radius (i.e., the radius including half of the total light in projection) pc (). For comparison, the Harris (1996) catalog quotes a larger concentration (), the same , and a larger effective radius (). Our updated estimates of the central and half-mass relaxation times are also slightly larger than those in Harris (1996). The value of ( yr) compared with the cluster chronological age ( yr) suggests that NGC 6316 is a dynamically old stellar system. Following Ferraro et al. (2012, 2018, 2019, 2020); Lanzoni et al. (2016) the level of central segregation of blue straggler stars (see their definition in Sandage 1953) within a GC is a powerful empirical diagnostic of the dynamical age of the host system, and it has been found to scale with the number of relaxation times suffered by the cluster since its formation. A future paper will be devoted to the accurate selection of the blue straggler population in NGC 6316, the determination of their radial distribution, and the measure of their level of central segregation. We also plan to measure the values of the three dynamical indicators recently proposed by Bhat et al. (2022). This will provide independent and empirical estimates of the dynamical age of the cluster, and allow its comparison with that of the other GCs in the Galactic system.
| Parameter | Estimated value |
|---|---|
| Center of gravity | |
| Dimensionless central potential | |
| Concentration parameter | |
| Core radius | arcsec |
| Half-mass radius | arcsec |
| Effective radius | arcsec |
| Truncation radius | arcsec |
| Central relaxation time | |
| Half-mass relaxation time |
References
- Astropy Collaboration et al. (2013) Astropy Collaboration, Robitaille, T. P., Tollerud, E. J., et al. 2013, A&A, 558, A33, doi: 10.1051/0004-6361/201322068
- Astropy Collaboration et al. (2018) Astropy Collaboration, Price-Whelan, A. M., Sipőcz, B. M., et al. 2018, AJ, 156, 123, doi: 10.3847/1538-3881/aabc4f
- Barbuy et al. (2018) Barbuy, B., Chiappini, C., & Gerhard, O. 2018, ARA&A, 56, 223, doi: 10.1146/annurev-astro-081817-051826
- Baumgardt & Hilker (2018) Baumgardt, H., & Hilker, M. 2018, MNRAS, 478, 1520, doi: 10.1093/mnras/sty1057
- Baumgardt et al. (2019) Baumgardt, H., Hilker, M., Sollima, A., & Bellini, A. 2019, MNRAS, 482, 5138, doi: 10.1093/mnras/sty2997
- Baumgardt & Vasiliev (2021) Baumgardt, H., & Vasiliev, E. 2021, MNRAS, 505, 5957, doi: 10.1093/mnras/stab1474
- Bellini et al. (2011) Bellini, A., Anderson, J., & Bedin, L. R. 2011, PASP, 123, 622, doi: 10.1086/659878
- Bertin & Arnouts (1996) Bertin, E., & Arnouts, S. 1996, A&AS, 117, 393, doi: 10.1051/aas:1996164
- Bhat et al. (2022) Bhat, B., Lanzoni, B., Ferraro, F. R., & Vesperini, E. 2022, ApJ, 926, 118, doi: 10.3847/1538-4357/ac43bf
- Bica et al. (2006) Bica, E., Bonatto, C., Barbuy, B., & Ortolani, S. 2006, A&A, 450, 105, doi: 10.1051/0004-6361:20054351
- Brogaard et al. (2017) Brogaard, K., VandenBerg, D. A., Bedin, L. R., et al. 2017, MNRAS, 468, 645, doi: 10.1093/mnras/stx378
- Cadelano et al. (2020a) Cadelano, M., Chen, J., Pallanca, C., et al. 2020a, ApJ, 905, 63, doi: 10.3847/1538-4357/abc345
- Cadelano et al. (2017) Cadelano, M., Dalessandro, E., Ferraro, F. R., et al. 2017, ApJ, 836, 170, doi: 10.3847/1538-4357/aa5ca5
- Cadelano et al. (2019) Cadelano, M., Ferraro, F. R., Istrate, A. G., et al. 2019, ApJ, 875, 25, doi: 10.3847/1538-4357/ab0e6b
- Cadelano et al. (2018) Cadelano, M., Ransom, S. M., Freire, P. C. C., et al. 2018, ApJ, 855, 125, doi: 10.3847/1538-4357/aaac2a
- Cadelano et al. (2020b) Cadelano, M., Saracino, S., Dalessandro, E., et al. 2020b, ApJ, 895, 54, doi: 10.3847/1538-4357/ab88b3
- Cardelli et al. (1989) Cardelli, J. A., Clayton, G. C., & Mathis, J. S. 1989, ApJ, 345, 245, doi: 10.1086/167900
- Carretta et al. (2009) Carretta, E., Bragaglia, A., Gratton, R., D’Orazi, V., & Lucatello, S. 2009, A&A, 508, 695, doi: 10.1051/0004-6361/200913003
- Casagrande & VandenBerg (2014) Casagrande, L., & VandenBerg, D. A. 2014, MNRAS, 444, 392, doi: 10.1093/mnras/stu1476
- Chun et al. (2015) Chun, S.-H., Kang, M., Jung, D., & Sohn, Y.-J. 2015, AJ, 149, 29, doi: 10.1088/0004-6256/149/1/29
- Clarkson et al. (2011) Clarkson, W. I., Sahu, K. C., Anderson, J., et al. 2011, ApJ, 735, 37, doi: 10.1088/0004-637X/735/1/37
- Cohen et al. (2021) Cohen, R. E., Bellini, A., Casagrande, L., et al. 2021, AJ, 162, 228, doi: 10.3847/1538-3881/ac281f
- Conroy et al. (2018) Conroy, C., Villaume, A., van Dokkum, P. G., & Lind, K. 2018, ApJ, 854, 139, doi: 10.3847/1538-4357/aaab49
- Davidge et al. (1992) Davidge, T. J., Harris, W. E., Bridges, T. J., & Hanes, D. A. 1992, ApJS, 81, 251, doi: 10.1086/191692
- Dias et al. (2016) Dias, B., Barbuy, B., Saviane, I., et al. 2016, A&A, 590, A9, doi: 10.1051/0004-6361/201526765
- Djorgovski (1993) Djorgovski, S. 1993, in Astronomical Society of the Pacific Conference Series, Vol. 50, Structure and Dynamics of Globular Clusters, ed. S. G. Djorgovski & G. Meylan, 373
- Dotter et al. (2008) Dotter, A., Chaboyer, B., Jevremović, D., et al. 2008, ApJS, 178, 89, doi: 10.1086/589654
- Dotter et al. (2010) Dotter, A., Sarajedini, A., Anderson, J., et al. 2010, ApJ, 708, 698, doi: 10.1088/0004-637X/708/1/698
- Ferraro (2017) Ferraro, F. 2017, Pushing ahead the frontier of the Globular Cluster dynamics: the 3D view of the velocity space, HST Proposal
- Ferraro et al. (2020) Ferraro, F. R., Lanzoni, B., & Dalessandro, E. 2020, Rendiconti Lincei. Scienze Fisiche e Naturali, 31, 19, doi: 10.1007/s12210-020-00873-2
- Ferraro et al. (2019) Ferraro, F. R., Lanzoni, B., Dalessandro, E., et al. 2019, Nature Astronomy, 3, 1149, doi: 10.1038/s41550-019-0865-1
- Ferraro et al. (2016) Ferraro, F. R., Massari, D., Dalessandro, E., et al. 2016, ApJ, 828, 75, doi: 10.3847/0004-637X/828/2/75
- Ferraro et al. (2009) Ferraro, F. R., Dalessandro, E., Mucciarelli, A., et al. 2009, Nature, 462, 483, doi: 10.1038/nature08581
- Ferraro et al. (2012) Ferraro, F. R., Lanzoni, B., Dalessandro, E., et al. 2012, Nature, 492, 393, doi: 10.1038/nature11686
- Ferraro et al. (2018) Ferraro, F. R., Lanzoni, B., Raso, S., et al. 2018, ApJ, 860, 36, doi: 10.3847/1538-4357/aac01c
- Ferraro et al. (2021) Ferraro, F. R., Pallanca, C., Lanzoni, B., et al. 2021, Nature Astronomy, 5, 311, doi: 10.1038/s41550-020-01267-y
- Forbes et al. (2018) Forbes, D. A., Bastian, N., Gieles, M., et al. 2018, Proceedings of the Royal Society of London Series A, 474, 20170616, doi: 10.1098/rspa.2017.0616
- Foreman-Mackey et al. (2013) Foreman-Mackey, D., Hogg, D. W., Lang, D., & Goodman, J. 2013, PASP, 125, 306, doi: 10.1086/670067
- Foreman-Mackey et al. (2019) Foreman-Mackey, D., Farr, W., Sinha, M., et al. 2019, The Journal of Open Source Software, 4, 1864, doi: 10.21105/joss.01864
- Gaia Collaboration et al. (2016) Gaia Collaboration, Prusti, T., de Bruijne, J. H. J., et al. 2016, A&A, 595, A1, doi: 10.1051/0004-6361/201629272
- Gaia Collaboration et al. (2022) Gaia Collaboration, Vallenari, A., Brown, A. G. A., et al. 2022, arXiv e-prints, arXiv:2208.00211. https://arxiv.org/abs/2208.00211
- Girardi et al. (2002) Girardi, L., Bertelli, G., Bressan, A., et al. 2002, A&A, 391, 195, doi: 10.1051/0004-6361:20020612
- Harris (1996) Harris, W. E. 1996, AJ, 112, 1487
- Heitsch & Richtler (1999) Heitsch, F., & Richtler, T. 1999, A&A, 347, 455. https://arxiv.org/abs/astro-ph/9904404
- Kerber et al. (2018) Kerber, L. O., Nardiello, D., Ortolani, S., et al. 2018, ApJ, 853, 15, doi: 10.3847/1538-4357/aaa3fc
- Kerber et al. (2019) Kerber, L. O., Libralato, M., Souza, S. O., et al. 2019, MNRAS, 484, 5530, doi: 10.1093/mnras/stz003
- King (1966) King, I. R. 1966, AJ, 71, 64, doi: 10.1086/109857
- Lanzoni et al. (2007) Lanzoni, B., Dalessandro, E., Ferraro, F. R., et al. 2007, ApJ, 668, L139, doi: 10.1086/522927
- Lanzoni et al. (2016) Lanzoni, B., Ferraro, F. R., Alessandrini, E., et al. 2016, ApJ, 833, L29, doi: 10.3847/2041-8213/833/2/L29
- Lanzoni et al. (2010) Lanzoni, B., Ferraro, F. R., Dalessandro, E., et al. 2010, ApJ, 717, 653, doi: 10.1088/0004-637X/717/2/653
- Lanzoni et al. (2019) —. 2019, ApJ, 887, 176, doi: 10.3847/1538-4357/ab54c2
- Lee et al. (2018) Lee, Y.-W., Hong, S., Lim, D., et al. 2018, ApJ, 862, L8, doi: 10.3847/2041-8213/aad192
- Marigo et al. (2017) Marigo, P., Girardi, L., Bressan, A., et al. 2017, ApJ, 835, 77, doi: 10.3847/1538-4357/835/1/77
- Massari et al. (2019) Massari, D., Koppelman, H. H., & Helmi, A. 2019, A&A, 630, L4, doi: 10.1051/0004-6361/201936135
- Massari et al. (2014) Massari, D., Mucciarelli, A., Ferraro, F. R., et al. 2014, ApJ, 795, 22, doi: 10.1088/0004-637X/795/1/22
- Miocchi et al. (2013) Miocchi, P., Lanzoni, B., Ferraro, F. R., et al. 2013, ApJ, 774, 151, doi: 10.1088/0004-637X/774/2/151
- Moffat (1969) Moffat, A. F. J. 1969, A&A, 3, 455
- Montegriffo et al. (1995) Montegriffo, P., Ferraro, F. R., Fusi Pecci, F., & Origlia, L. 1995, MNRAS, 276, 739, doi: 10.1093/mnras/276.3.739
- Nataf et al. (2013) Nataf, D. M., Gould, A., Fouqué, P., et al. 2013, ApJ, 769, 88, doi: 10.1088/0004-637X/769/2/88
- Nordquist et al. (1999) Nordquist, H. K., Klinger, R. J., Laguna, P., & Charlton, J. C. 1999, MNRAS, 304, 288, doi: 10.1046/j.1365-8711.1999.02293.x
- Oliveira et al. (2020) Oliveira, R. A. P., Souza, S. O., Kerber, L. O., et al. 2020, ApJ, 891, 37, doi: 10.3847/1538-4357/ab6f76
- Origlia et al. (2013) Origlia, L., Massari, D., Rich, R. M., et al. 2013, ApJ, 779, L5, doi: 10.1088/2041-8205/779/1/L5
- Origlia et al. (2011) Origlia, L., Rich, R. M., Ferraro, F. R., et al. 2011, ApJ, 726, L20, doi: 10.1088/2041-8205/726/2/L20
- Ortolani et al. (2019) Ortolani, S., Held, E. V., Nardiello, D., et al. 2019, A&A, 627, A145, doi: 10.1051/0004-6361/201935726
- Pallanca et al. (2019) Pallanca, C., Ferraro, F. R., Lanzoni, B., et al. 2019, ApJ, 882, 159, doi: 10.3847/1538-4357/ab35db
- Pallanca et al. (2021a) Pallanca, C., Lanzoni, B., Ferraro, F. R., et al. 2021a, ApJ, 913, 137, doi: 10.3847/1538-4357/abf938
- Pallanca et al. (2021b) Pallanca, C., Ferraro, F. R., Lanzoni, B., et al. 2021b, ApJ, 917, 92, doi: 10.3847/1538-4357/ac0889
- Pietrinferni et al. (2021) Pietrinferni, A., Hidalgo, S., Cassisi, S., et al. 2021, ApJ, 908, 102, doi: 10.3847/1538-4357/abd4d5
- Raso et al. (2020) Raso, S., Libralato, M., Bellini, A., et al. 2020, ApJ, 895, 15, doi: 10.3847/1538-4357/ab8ae7
- Sandage (1953) Sandage, A. R. 1953, AJ, 58, 61, doi: 10.1086/106822
- Sandell et al. (1987) Sandell, G., Stevens, M. A., & Heiles, C. 1987, A&A, 179, 255
- Santos & Piatti (2004) Santos, J. F. C., J., & Piatti, A. E. 2004, A&A, 428, 79, doi: 10.1051/0004-6361:20041560
- Saracino et al. (2016) Saracino, S., Dalessandro, E., Ferraro, F. R., et al. 2016, ApJ, 832, 48, doi: 10.3847/0004-637X/832/1/48
- Saracino et al. (2019) —. 2019, ApJ, 874, 86, doi: 10.3847/1538-4357/ab07c4
- Schlafly & Finkbeiner (2011) Schlafly, E. F., & Finkbeiner, D. P. 2011, ApJ, 737, 103, doi: 10.1088/0004-637X/737/2/103
- Stasińska et al. (1992) Stasińska, G., Tylenda, R., Acker, A., & Stenholm, B. 1992, A&A, 266, 486
- Stetson (1987) Stetson, P. B. 1987, PASP, 99, 191, doi: 10.1086/131977
- Stetson (1994) —. 1994, PASP, 106, 250, doi: 10.1086/133378
- Thompson et al. (2020) Thompson, I. B., Udalski, A., Dotter, A., et al. 2020, MNRAS, 492, 4254, doi: 10.1093/mnras/staa032
- Udalski (2003) Udalski, A. 2003, ApJ, 590, 284, doi: 10.1086/374861
- Valenti et al. (2007) Valenti, E., Ferraro, F. R., & Origlia, L. 2007, AJ, 133, 1287, doi: 10.1086/511271
- Valenti et al. (2010) —. 2010, MNRAS, 402, 1729, doi: 10.1111/j.1365-2966.2009.15991.x
- Valenti et al. (2013) Valenti, E., Zoccali, M., Renzini, A., et al. 2013, A&A, 559, A98, doi: 10.1051/0004-6361/201321962
- Zhang et al. (2010) Zhang, Y., Zhang, F., Han, Z., & Liu, J. 2010, Ap&SS, 329, 255, doi: 10.1007/s10509-010-0309-y
- Zoccali et al. (2001) Zoccali, M., Renzini, A., Ortolani, S., et al. 2001, ApJ, 553, 733, doi: 10.1086/320980
- Zoccali et al. (2003) —. 2003, A&A, 399, 931, doi: 10.1051/0004-6361:20021604