A novel energy reconstruction method for the MAGIC stereoscopic observation
Abstract
We present a new gamma ray energy reconstruction method based on Random Forest to be commonly used for the data analysis of the MAGIC Telescopes, a system of two Imaging Atmospheric Cherenkov Telescopes.
The energy resolution with the new energy reconstruction improves compared to the one obtained with the LUTs method. For standard observations i.e. dark conditions with pointing zenith (Zd) less than 35 deg for a point-like source, the energy resolution goes from at 100 GeV to at a few TeV.
In addition, the new method suppresses the outlier population in the energy error distribution, which is thus better described by a Gaussian distribution. The new energy reconstruction method enhances the reliability especially for the sources with steep spectra, in higher energies and/or in observations at higher Zd pointings.
We validate the new method in different ways and demonstrate some cases of its remarkable benefit in spectral analysis with simulated observation data.
keywords:
Very High Energy gamma ray , Cherenkov Telescopes , Energy reconstruction , Random Forest1 Introduction
MAGIC is a system of two 17 m-diameter Imaging Atmospheric Cherenkov Telescopes (IACTs) located at the Roque de los Muchachos Observatory on the Canary Island of La Palma, Spain, at an altitude of 2200 m a.s.l.(Aleksić et al., 2016a, b). The main target of the system is to observe very-high-energy (VHE, energy 100 GeV) gamma rays, and it was designed to reach the low energy threshold by optimizing various specifications. The achieved energy threshold is as low as 50 GeV at the trigger level for observations at zenith distance angles below 30 deg in dark conditions (without moon) (Aleksić et al., 2016b). Using the so-called sum-trigger, it is possible to reach an even lower energy threshold (Dazzi et al., 2021). The detection method of IACTs is to take images of Cherenkov radiation from an extensive air shower (EAS), which is a cascade of secondary particles initiated by a high energy particle such as a gamma-ray photon, when it enters the atmosphere. By analysing the images, the properties of primary particles, namely the particle species, incoming direction and energy, can be reconstructed.
In this paper we will present a new gamma ray energy reconstruction method for the MAGIC telescopes. In early times of MAGIC when there was only one telescope, the algorithm of the energy estimator was based on RF (Albert et al., 2008a). When the second telescope was introduced and the system started stereo observations (Aleksić et al., 2012), the data enabled the stereo reconstruction of shower geometry. This improved significantly the estimation of the distance to the shower maximum, thus the correspondent upgrade was needed also for the data analysis including the energy estimator. At that time, the Look Up Tables method (LUTs-Erec) , based on a simplified shower model, was introduced and it has been used over the last decade in the MAGIC standard analysis (Aleksić et al., 2016b).
2 Energy estimation methods
The gamma ray energy is one of the three properties of the primary particle together with the particle species and incoming direction, that we reconstruct in an event observed with MAGIC. The reconstruction for each event starts from a pair of two images, which are the charge and the timing distributions over the pixels, taken by the two telescopes. The background noise in the images is removed by image cleaning techniques (Aleksić et al., 2016b), and the remaining region of interest is characterized in different aspects via parametrization. Then the estimators are generated by supervised learning of the relation between the parameters and the target property, adopting simulated events as the training samples. In the following, we explain the parameters, the simulation and a general view for energy reconstruction, mentioning the previous method and the strategies in the other IACTs.
Let us firstly list the image parameters, namely the ones calculated directly from the charge and the timing distributions. The main and classic parameters are the so-called “Hillas parameters”(Hillas, 1985), as: Width, Length, Center of Gravity position (CoG) and Size (image brightness or intensity, in units of photoelectrons), which are under interpretation of the charge distribution as an elliptical shape. As an auxiliary parameter, Leakage characterises the truncation of the image, by quantifying the fraction of total charge at the pixels on the edge of camera with respect to Size. There are two kinds of Leakage defined; Leakage1 is for the outmost row on the edge, and Leakage2 is for the second row. As for the arrival time distribution, the most important parameter is TimeGradient, which is the gradient of the arrival time distribution with respect to the projected location of the pixels along the major axis. This parameter has a close relation to the geometrical configuration of the EAS (Aliu et al., 2009).
We can also extract the geometrical parameters, namely the geometry of the EAS with respect to the telescopes, once the incoming direction of the primary particle is determined. There are two ways to estimate the incoming direction, which are the classic method as the intersection of the shower axes (Daum et al., 1997) and the so-called Disp method (see fig. 5 in Aleksić et al., 2012). The Disp- geometry performs considerably better than Classic- geometry. On the other hand, the true incoming direction is accessible in a simulated data, as the direction of primary particle injection. Dependent on these incoming directions, the reconstructed shower geometry is different.In this paper, we discriminate these geometries by adding the prefixes Classic-, Disp- and True- to the geometrical parameters respectively. And we describe a geometrical parameter with two prefixes when different kinds of geometries are used between the training and applying the estimator. For example, we will describe a geometrical parameter with the prefix True-Disp-, when ”True-” parameter is used for training an estimator, and then ”Disp-” parameter is applied for energy estimation.
The most important geometrical parameters are Impact as the lateral distance of a telescope from the shower axis and MaxHeight as the height of the maximum Cherenkov emission. Also the Disp parameter itself is important and can be regarded as a part of geometrical parameters, as it is correlated with Impact and MaxHeight. The Disp parameters for individual camera field of views (FoVs) are the basis for the Disp method, each of which is the angular distance from the CoG to the incoming direction of the primary gamma ray. The Disp is estimated from the image parameters. There are other geometrical parameters used for the standard analysis from the MaxHeight and Zd combined with the location specific information such as atmosphere density and geomagnetic field. CherenkovDensity and CherenkovRadius are the auxiliary parameters to indicate the longitudinal and lateral information respectively111 They are to characterise the distance to the shower maximum in terms of the Cherenkov radiation, by a typical 86 MeV electron at the shower maximum. CherenkovRadius is the radius of illumination on the plane perpendicular to the pointing direction at the center of the two telescopes, and CherenkovDensity is the photon density of illumination on the plane. , and CosBSangle is the angular distance of the incoming direction from the geomagnetic field direction, to account the deflection of the secondary particles hence of the Cherenkov radiation (Commichau et al., 2008).
The relation between the event parameters and the gamma-ray properties is extracted from the train samples generated by the standard MAGIC simulation package (Majumdar et al., 2005; Carmona et al., 2007), with the gamma-ray showers generated using the Corsika code (Heck et al., 1998). Enormous number of Monte Carlo (MC) simulated gamma rays are generated, in order to realize a smooth distributions of events in energy, in pointing direction, in incoming direction and in arrival location on the ground. The most standard setting is for the case a point like source is observed on its presence in the sky at Low Zd (5 deg to 35 deg) with wobbling observation (Fomin et al., 1994a), with 0.4 deg of wobble angle. Roughly events are generated for the dataset. To be generally used for any observation of this kind, the pointing directions are equally distributed in Az and given Zd range, and the source direction with respect to the FoV is also equally distributed in the ring-like region with a radius of the wobble angle around the center of the FoV. The arrival locations on the ground are chosen in uniform distribution within a circular region with a radius of 350 m around the center of the telescopes system in the plane perpendicular to the shower axis. The energy distribution range from 10 GeV to 30 TeV distributed in power law of index -1.6.
The above mentioned parameters can be viewed for an energy estimator in the following way. The most fundamental view is that a primary particle with higher energy creates more secondary particles, thus the emission is intrinsically brighter. Therefore Size plays the main role in energy estimation, with the auxiliary parameters for corrections. The corrections take into account the truncation of the image due to the limited FoV of the camera, the distance to the shower maximum, and the deflection of secondary particles by the geomagnetic field. The energy estimators in the MAGIC analysis have been following this principle.
The LUTs-Erec stands on two telescope-wise estimators. Each estimator takes the image parameters for the correspondent telescope and the geometrical parameters. The procedure consists of two stages. In the first stage, the Size parameter is modified via empirical formulae using the following parameters: The correction factor for image truncation is based on Leakage2. The one for geomagnetic field effect uses True-Disp-CosBSangle. The ones using Zd and the Classic-Disp-CherenkovDensity are to normalize the brightness in terms of the longitudinal component of the distance to the EAS. In the second stage, the conversion factor from the corrected Size to energy is retrieved by searching through a two-dimensional LUT, which has the corrected-Size as one dimension, and the Impact parameter as the other dimension. The corrected size is expressed as in order to optimize the binning, while the Impact is expressed in the unit of Classic-Disp-CherenkovRadius so that it can take into account that the light pool radius changes according to the longitudinal distance. After the telescope-wise estimations are obtained, they are averaged weighted with uncertainties.
These days, deep convolutional neural networks (CNNs) are being explored as a promising method for IACT full-event reconstruction. There have been some remarkable attempts (Nieto et al., 2021a; De et al., 2022; Jacquemont et al., 2021), based on a technique to interpret a hexagonal pixel layout into cartesian coordinate (Nieto et al., 2021b). In the latest research for the MAGIC (Miener et al., 2021), the pixel-wise image information is fed to the estimator after the image cleaning. The performance reaches competitive level (see also Figure 6 for the performance), however a drawback is the demand of expensive computational resource. The production of an estimator is required not only for the observation settings like pointing directions, but also when there is a change in performance of the telescopes. Therefore an estimator with lighter weight will play an important role to enable a swift action in analysis.
Along with MAGIC, the other major ground-based observatories at present with a system of more than one imaging Cherenkov telescopes (Funk, 2015) are H.E.S.S. (High Energy Stereoscopic System) (Aharonian et al., 2006) and VERITAS (Very Energetic Radiation Imaging Telescope Array System) (Meagher, 2015). Both of them have the same basis of detection that the multiple telescopes view the shower from different angles. In the energy reconstruction, they adopt different strategies.
Standard analyses for VERITAS use look-up tables derived from simulated events to reconstruct the energy of incident air showers based on the strength of the signal and the distance of the air shower from the telescope (Park, 2015). The energy bias is close to zero above around 200 to 500 GeV depending on the cut condition, and below a few tens of TeV. The energy resolution is about 15 % - 20 %, with increase for energies larger than 10 TeV (Park, 2015).
The standard analysis for H.E.S.S. is called Image Pixel-wise fit for Atmospheric Cherenkov Telescopes (ImPACT), which is based on the likelihood fitting of camera pixel amplitudes to an expected image template, directly generated from Monte Carlo simulations (Parsons and Hinton, 2014; Parsons et al., 2015). For the events with standard ImPACT method standard cuts, the energy bias is close to zero above 500 GeV, and the resolution is better than 10 % above 1 TeV (Parsons and Hinton, 2014; Parsons et al., 2015).
Note that the definitions of energy bias and resolution are different by articles, in both the event selections and the computation.
3 The new energy estimator
The new energy reconstruction method (RF-Erec) adopts Random Forest (RF)(Breiman, 2001). It was originally developed for the single telescope data (Albert et al., 2008a), and we have adjusted it for the stereo observation data by investigating the necessary parameters for the input variables.
Although it is possible to almost automatically search for the event parameters for the energy from their importance scores obtained from training of RF, we selected the parameters based on the insights on the EAS and the telescopes system in order to avoid unknown systematic effects. The selection resulted in the different set of parameters from the ones for the previous method, the LUTs-Erec. We listed 21 parameters, of which 16 are the ones from individual telescopes, shown in the Table 1. Compared to the LUTs-Erec, we have found 11 additional parameters for better corrections of the Size.
| Event parameter | RF-Erec | LUTs-Erec | |
| Size | (tel.1/2) | • | • |
| Leakage1 | (tel.1/2) | • | |
| Leakage2 | (tel.1/2) | • | • |
| Time Gradient | (tel.1/2) | • | |
| Width | (tel.1/2) | • | |
| Length | (tel.1/2) | • | |
| Disp | (tel.1/2) | • | |
| Disp-Impact | (tel.1/2) | • | |
| True-Disp-Impact | (tel.1/2) | • | |
| Disp-MaxHeight | • | ||
| Disp-CosBSangle | • | ||
| True-Disp-CosBSangle | • | ||
| Disp-CherenkovDensity | • | ||
| Classic-Disp-CherenkovDensity | • | ||
| Disp-CherenkovRadius | • | ||
| Classic-Disp-CherenkovRadius | • | ||
| Zd of telescope pointing | • | • | |
The list of the event parameters used as input variables for the energy estimators, RF-Erec and LUTs-Erec. The geometrical parameters are indicated with the basis direction reconstruction methods as prefixes; Classic-, Disp- and True- (see the main text for the details). The ones with two prefixes indicate that the different reconstruction bases are used in the construction and the application of estimators, represented by the first and the second prefixes.
For taking into account the truncation of the image, both Leakage1 and Leakage2 are selected, while the LUTs-Erec uses only Leakage2. For the distance corrections, the LUTs-Erec used only Impact, CherenkovDensity, CherenkovRadius and Zd, while the additional parameters for the RF-Erec are Disp, MaxHeight, TimeGradient, Width and Length.
And the geometrical parameters are chosen from different reconstruction methods. The LUTs-Erec adopted True-Disp- values for Impact and CosBSangle, and Classic-Disp- values for CherenkovDensity and CherenkovRadius. In the RF-Erec, all the geometrical parameters use Disp- values. The True-Disp- parameters in LUTs-Erec are intended to use in the training process the True- values, namely the geometry based on the injection direction of the simulated gamma ray. By learning the relation between the true geometry of the shower and the target value, the estimator was expected to avoid the smearing of the estimator response by these geometrical variable error. The replacement of geometrical parameters by True- values has been adopted also in some other cases (H. E. S. S. Collaboration et al., 2018). However this strategy is vulnerable to noise and biases because the accuracy of an estimated geometrical parameter is always limited. A systematic effect will appear when the estimated value fluctuates significantly more than the noise level of true values in train samples. In the study for the RF-Erec, such systematic effect was found and this strategy was cancelled (we discuss the effect further in Section 5.1). For simplicity of the analysis procedure, CherenkovRadius and CherenkovDensity were used as Classic-Disp- in the LUTs-Erec, and they are changed to Disp- in the RF-Erec for a slightly better performance.
In addition, the target value, namely the energy, is set to logarithmic form, as it ranges over multiple decades and the train samples distribute in a power law.
The event selection for train samples was also modified. As RF is robust owing to the averaging process in calculating the estimand, the cut condition is relaxed, and the remaining cut only rejects the events with inconsistency of reconstructed arrival directions by the two telescopes in the Disp method. In contrast, the LUTs-Erec rejected the given train samples with a large direction reconstruction error, a reconstructed Classical MaxHeight lower than typical gamma ray event, and a truncated shower image. The relaxed cut results in a better performance, especially with obvious improvement at high energies by accepting all the events of truncated images. 222 Alternative plan…. In contrast, the LUTs-Erec rejected the given train samples with a squared error of direction reconstruction larger than 0.1 deg2, a reconstructed Classical MaxHeight lower than typical gamma ray event that resulted in the CherenkovRadius larger than 40m, and a shower image truncated larger than Leakage 0.2. The relaxed cut results in a better performance, especially with obvious improvement at high energies by removal of the Leakage cut.
The parameters for the forest generation, namely the number of trials for a split, the minimum samples at the last node and the number of trees, are set to 5, 3 and 100 respectively. These values are selected by balancing the computational cost and performance, however the performance does not change significantly.
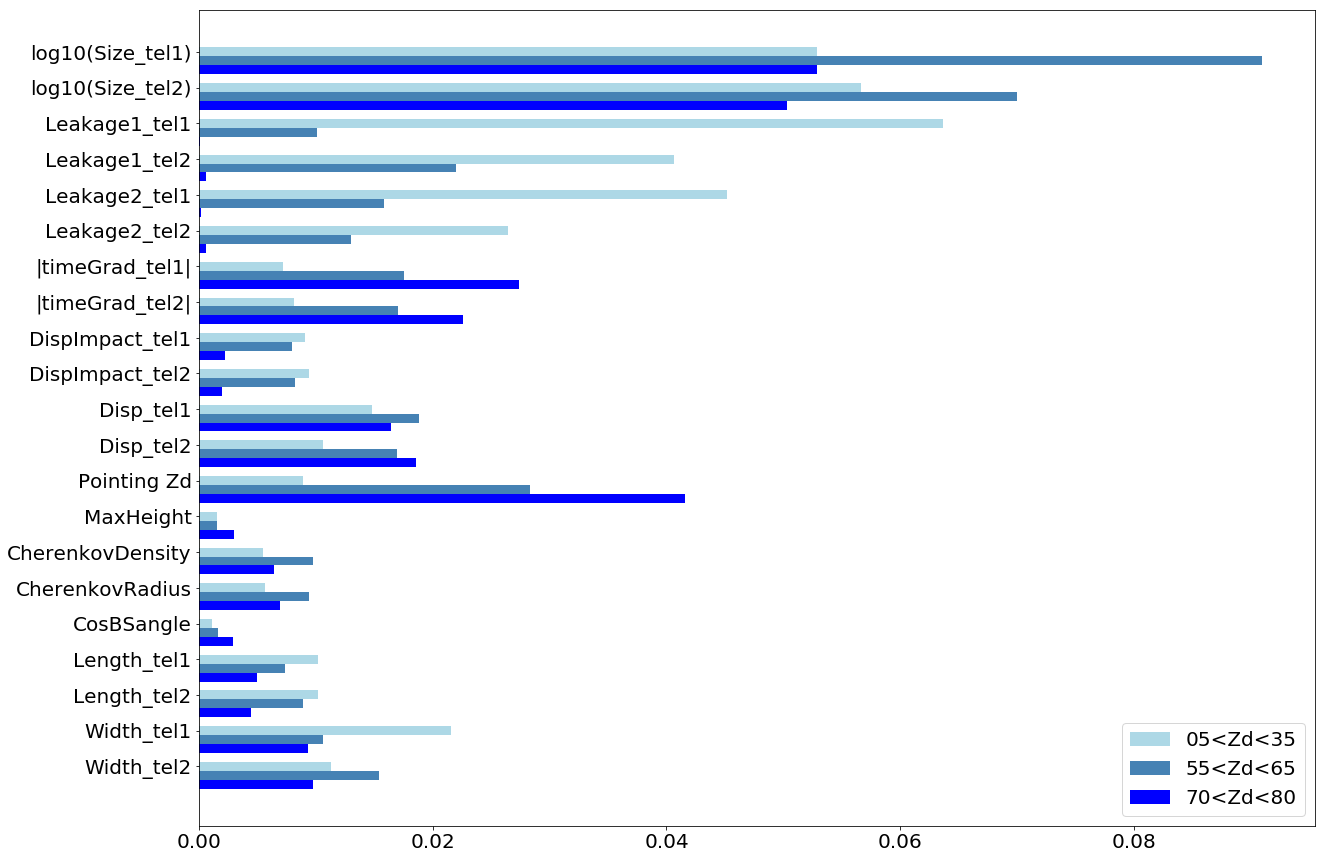
The importance scores of the input variable in the forest generation change dependent on the pointing direction. Figure 1 shows the importance scores in different Zd ranges. For example, in the lower Zd range, the images of high energy events tend to be larger and sometimes they get truncated, thus the Leakages have greater importance scores, on the other hand, the distance to the shower increases with the Zenith angle which therefore gains greater importance.
4 Verification
There is no way to evaluate the energy reconstruction in a controlled way as there is no robust calibration source of gamma ray energy. Instead we perform three indirect ways to validate the energy reconstruction.
4.1 Parameter distribution
The distribution of a parameter, for example the Size, depends on energy, and this is how the energies can be reconstructed. However, the estimator is trained with MC events, not the real events. Therefore it is a reasonable check to see if the parameters distribute consistently between MC and real gamma rays in a given energy.
To this end, we adopted the observation data of the large flaring activity of the blazar Mrk421 in April 2013, which delivered the highest VHE gamma ray fluxes (during hour and day timescales) recorded by MAGIC to date (Acciari et al., 2020). The flux was highest during the first four days, April 12, 13, 14 and 15 in 2013. The integrated flux GeV varied from to cm-2s-1, corresponding to around 5 to 10 times the photon flux of the Crab Nebula. This resulted in of excess events in total for this validation study, which amounts to a total observation time of 20 hours, after the selection of the Zd range from 5 deg to 35 deg and very good weather conditions. The observation was performed in ”wobble mode”(Fomin et al., 1994b), with the source direction offset by 0.4 deg from the camera center. The parameter distributions of the real gamma rays are constructed from the events with their reconstructed incoming directions around the object (”ON” direction), subtracted by the ones around the counterpart direction, which is at the same distance from the camera center but in the opposite direction (”OFF” direction) 333 This background estimation is based on the instrument response well approximated to radial symmetry. Therefore it is possible to select multiple OFF regions at the same radial distance and area as long as they don’t overlap. .
For a reasonable comparison, the population of MC data was aligned to the real data by introducing two weights on individual events. One is the weight for aligning pointing history, which is constructed from the difference of Zd distributions. The Az direction is not considered because of negligible contribution at low Zd. The other is for the energy spectrum. Since the true energy is not accessible in real data, the comparison is possible only in estimated energy, although the distribution is distorted by the statistical process of the estimation error, dependent on the intrinsic energy spectrum. Therefore the spectral shape of MC gamma rays, generated in a power law distribution with the index of -1.6 was adjusted to the observation data. The spectral analysis on the observation data with the MAGIC standard analysis, with the forward unfolding method using the power law with semi-exponential cutoff, gave the best fit result among the usual assumptions with the reasonable probability, /n.d.f. = 13.2/16 (p-value = 0.66).
Based on the above mentioned adjustments, the parameter distributions are compared in the dimension of estimated energy, focusing on those with the highest contributions to energy reconstruction. The distribution separated in estimated energies suffers from deformation due to energy migration, however they should still show the consistency, since the deformation should happen in the same way for both real data and MCs.
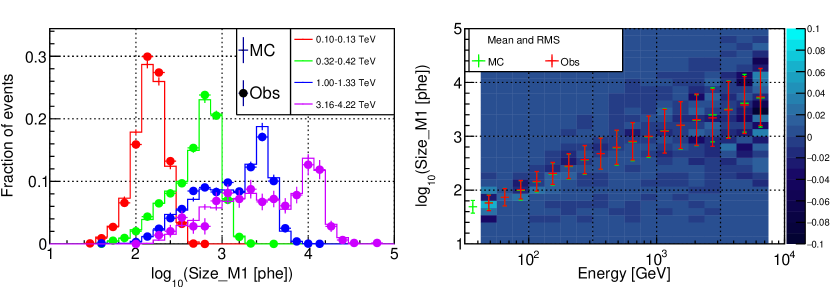
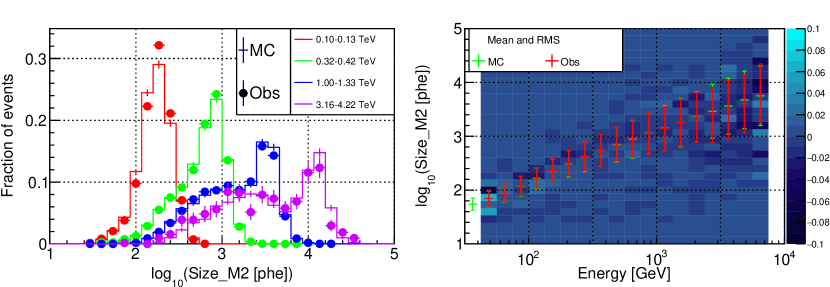
The results are shown in Figure 2. The left panels show the distributions of the parameters in four selected estimated energy ranges, 0.10 - 0.13 TeV, 0.32 - 0.42 TeV, 1.0 - 1.3 TeV and 3.2 - 4.2 TeV; they are separated at equal distances in logarithmic energy to the next ranges, and the width of range is chosen to contain enough number of events. The shapes are different among the energies however the MC and the real data mostly agree with each other. The right panels show the mean and RMS of the distribution in the energy bins, overlaid on top of the residuals of the two dimensional histograms of the parameter values and the estimated energies. In the residual histograms, the distribution of real data is subtracted from that of MC data, and is shown as the ratio to the total number of events in the real data integrated over each energy bin. All the grids with good statistics are within few percent of the total events in the estimated energy bin.
In this comparison, we see a good agreement of the parameter distributions between the MC and the real gamma rays.
![[Uncaptioned image]](/html/2212.03592/assets/x3.png)
![[Uncaptioned image]](/html/2212.03592/assets/x4.png)
![[Uncaptioned image]](/html/2212.03592/assets/x5.png)
![[Uncaptioned image]](/html/2212.03592/assets/x6.png)
![[Uncaptioned image]](/html/2212.03592/assets/x7.png)
![[Uncaptioned image]](/html/2212.03592/assets/x8.png)
![[Uncaptioned image]](/html/2212.03592/assets/x9.png)
![[Uncaptioned image]](/html/2212.03592/assets/x10.png)
4.2 Crab spectrum
Another way to compare different energy reconstruction methods is to check in each case the resulting spectrum for the Crab Nebula, the ”standard candle” in VHE gamma ray astronomy. We performed this test in four Zenith distance ranges; LZd, MZd, HZd and VHZd, which are Zd=[5,35]deg, Zd=[35,50]deg, Zd=[55,65]deg, and Zd=[70,80]deg. All the observations were performed during astronomical night, with no moon in the sky or near the horizon, and in good weather, to avoid any other systematic effects. The total exposure is 11.5 hours, 5.8 hours, 3.7 hours and 20.5 hours for LZd, MZd, HZd and VHZd respectively.
The process followed the MAGIC standard analysis including the event selection. The events with the Size above 50 photoelectrons are selected, then they are processed in the two more efficiency-based event selections in the given estimated energy bins: one is for the angular distance to the ON or OFF directions within the 75% collection efficiency of point-like source, and the other is for the hadronness, which is the measure of how likely to a background event (Albert et al., 2008b), within the 90% collection efficiency of the gamma-ray events.
The number of excess events and background events, from the ON region and three OFF regions available by the wobble pointing, are fitted using the forward unfolding method with a curved power-law fit function:
| (1) |
where , and are the amplitude, the power-law index and the curvature, and all the fit results in the considered Zd ranges were consistent with the observed number of events, showing at least 10 % of the probability.
The result is shown in Figure 3. For clarity, the spectrum is presented in the form of spectral energy distribution, i.e. . The curves of the fitted spectral functions from RF-Erec and LUTs-Erec are drawn, together with those from the two latest studies with MAGIC (MAGIC Collaboration et al., 2015; Aleksić et al., 2016b). The flux points, shown together, are calculated taking into account the energy migration and the fitted spectral shape in the collection area derived in estimated energy.
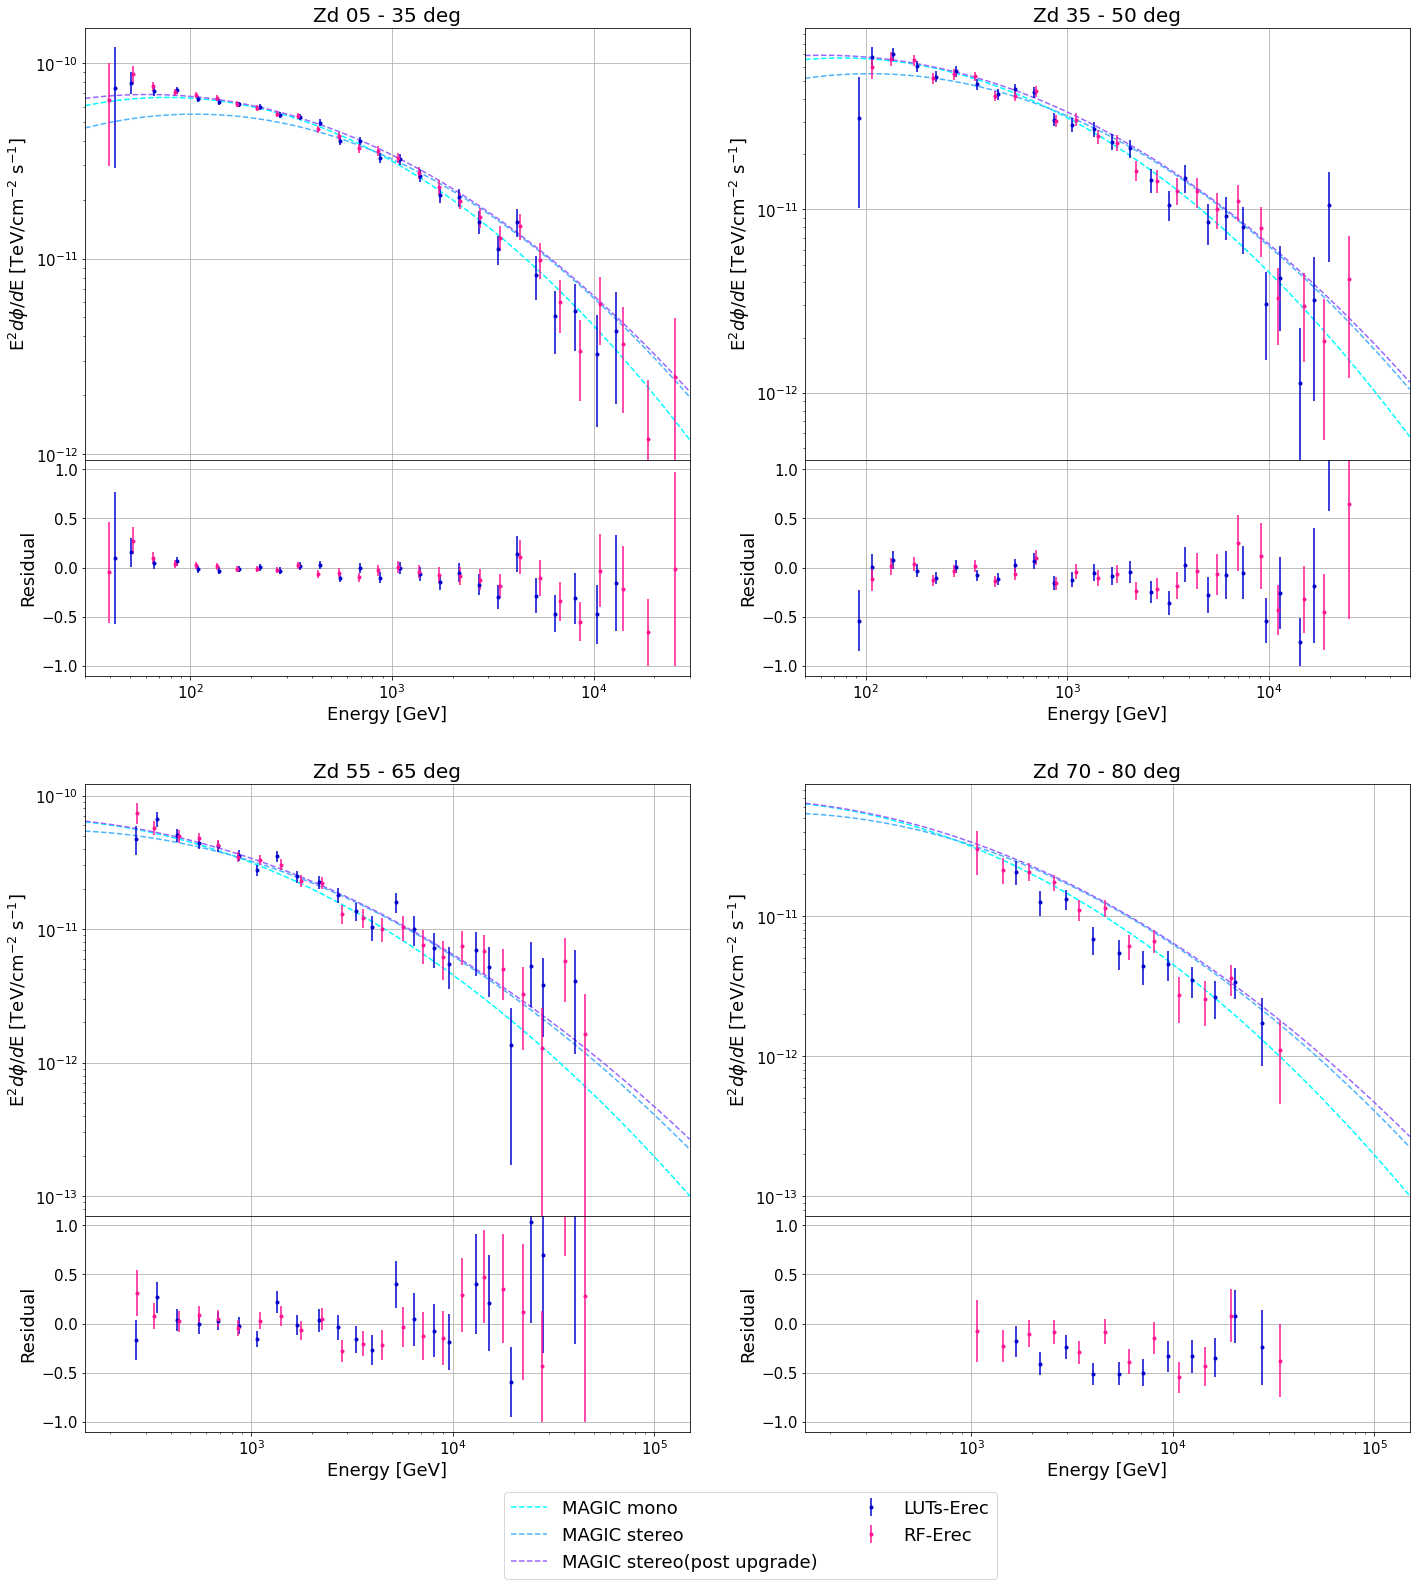
In the lower panels, the residual of spectral points with respect to Aleksić et al. (2016b) is drawn. All the data points are well aligned with the reference spectra especially in the lower Zd ranges, and the deviations can be explained within expected statistic and systematic uncertainties.
4.3 Consistency in both telescopes
The response of the two telescopes is different, due to multiple effects mainly from the different populations of telescope elements such as the mirrors and PMTs (Aleksić et al., 2016a, 2012). The MC simulations are fine tuned to take into account this inter-telescope calibration. In addition, the LUTs-Erec consists of the telescope-wise estimators in which the energy is reconstructed from the geometrical parameters and the image parameters of either one telescope. Therefore, the LUTs-Erec had been validated in the consistency between the estimated energies obtained independently from both telescopes (Aleksić et al., 2016b).
We perform here a similar test for the RF-Erec. Unlike the LUTs-Erec, the RF-Erec is based on single estimator. In order to make the telescope-wise estimators like the ones in the LUTs-Erec, the two RF-based estimators were separately constructed by removing the image parameters of either one telescope. We also perform the same evaluation on the real data as described in Section 4.1. To be able to compare the results between the MC and real data, the weights are applied in the same way.
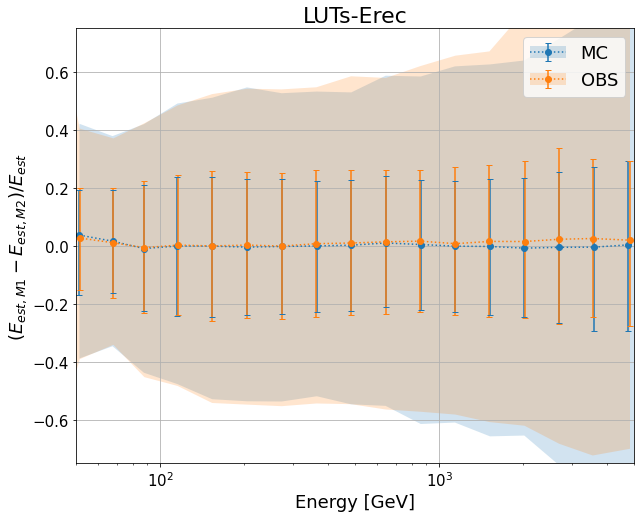
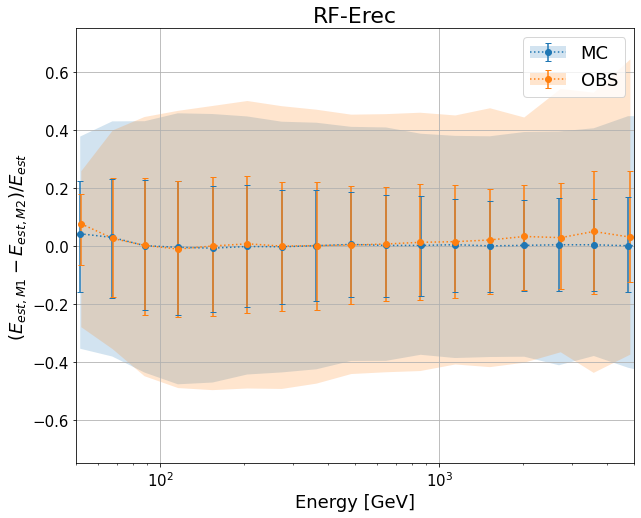
Figure 4 shows the result for the RF-Erec and LUTs-Erec separately. In each panel, the distributions of the difference between M1 based estimated energy and M2 based one, normalized by the stereo estimated energy, are drawn for the MC data and the observation data. Binned in estimated energies, the mean of the distributions, obtained as the peak of Gaussian fit, is shown, together with the 68 % containment and 95 % containment of the population represented by the error bars and the shaded regions.
All the distributions are centered around zero, indicating that the inter-telescope calibration in the MC data is properly done. In both RF-Erec and LUTs-Erec, the mean and the 68 % containment are consistent between the MC and real data within a few percent accuracy, and the 95 % containment ranges are within 10 % difference. These differences are sufficiently small considering the overall systematic uncertainty expected to be around 10 %.
5 Performance
We compare the performance of the new energy estimator, RF-Erec, with the previous strategy, LUTs-Erec. First we show the migration matrix, not only because it is the simplest way to compare, but also because it plays the main role in a spectral analysis. The quantification of the generalization error is also important, and we show it in bias and resolution.
However, the energy reconstruction is used mainly for spectral analyses and the actual impact on it needs to be evaluated over the accumulation of statistics. To this end, we also discuss the distortion of the energy histogram due to energy migration from the aspect of the reliability of a bin.
5.1 The migration matrix
A migration matrix is a matrix containing the probabilities for given true energies of gamma rays to be reconstructed into a given bin in estimated energy. It is constructed based on the test samples, namely an additional set of MC gamma rays dedicated for evaluations of the estimators and the instrument response function. To this end, the test samples are processed in the same event reconstruction and event selection as the standard analysis. Also, the weight for Zd and energy distribution are applied to depict the specific Crab Nebula observation data. The result is shown in Figure 5, separately drawn in the four Zd ranges.
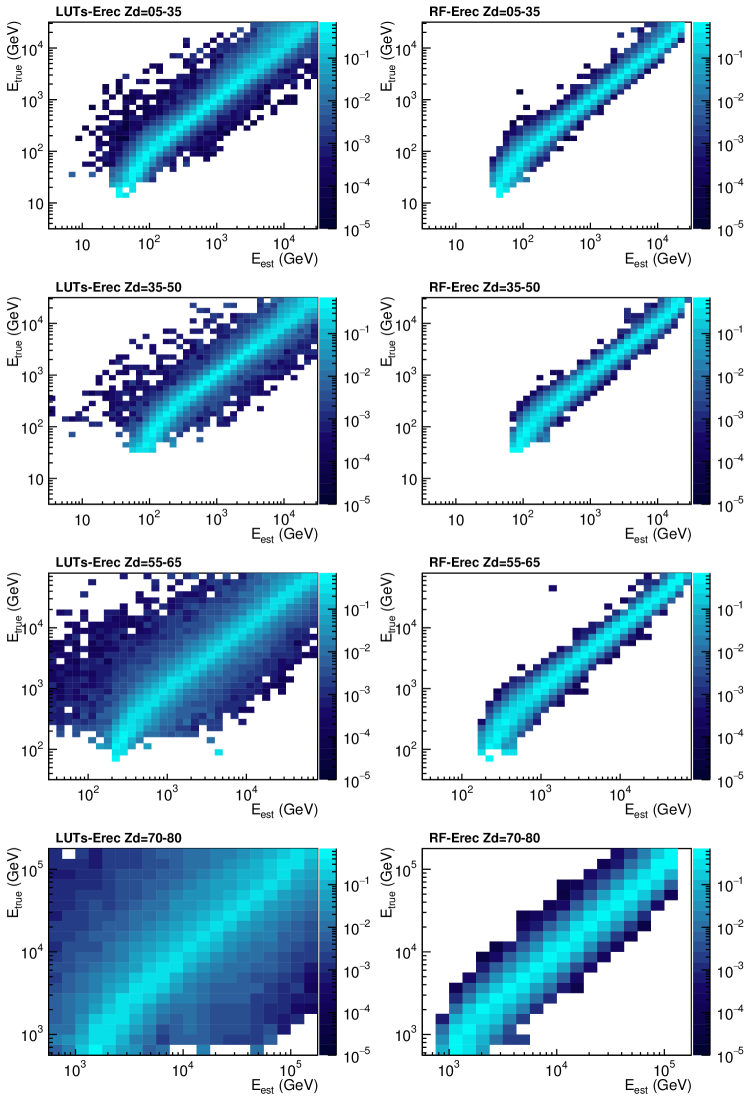
In a better energy reconstruction, the probability of the reconstructed energy should be concentrated close to the true energy. The migration matrices obtained with LUTs-Erec show a wide spread of migration probabilities while the ones from RF-Erec have a tight band of bins along the diagonal line, indicating a better energy resolution, which will be discussed in the next section.
In the example shown here, the LUTs-Erec migration matrix for Zd=[55,65] deg has a cell, which tells that events of the true energy 100 GeV have a probability above 20 to migrate to estimated energy of about 5 TeV. The high probability in an isolated bin is due to the low statistics nature of lowest energies close to the threshold, however, the bin is placed at such high energy bin due to the swap strategy for Impact. Because the true value of Impact was given in the construction of estimator in LUTs-Erec, the estimators did not learn the error on Impact. Since the Impact point is derived tracing the shower axis from incoming direction through the shower maximum to the ground, the error on the incoming direction affects the direction of the vector towards the Impact point and results in the error of the Impact point, thus that of Impact. In case of low Zd, this error would be small enough that it would not introduce a visible systematic effect 444 Assuming a case with typical maximum error of the direction reconstruction in lowest energies as deg and typical MaxHeight as km in low Zd, the error of Impact point would be m. . However, the error increases with Zd because the distance to the shower from the telescopes becomes longer, and the larger error will eventually result in an estimated Impact significantly larger than the possible Impact range for the energy. Since a larger Impact is always possible for a higher energy event, the up-scatter of the estimated energy occurs.
Such large estimation error in the low statistic energy range close to the trigger threshold brings difficulty in precisely compensate the energy migration by unfolding in an energy spectrum. Therefore this issue can cause a visible systematic effect in an unfolded spectrum, especially when the spectrum is steep.
We emphasize that the above-mentioned systematic effect is not visible anymore in RF-Erec, after the cancellation of the use of the True- values in the training process.
5.2 The generalization error
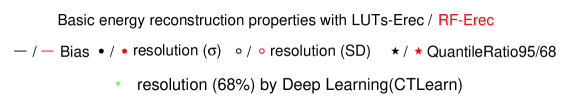
We evaluate here the generalization error as the bias and resolution in energy, again separately in the four Zd ranges. The bias is the averaged difference of the prediction of our model from the correct value, and the resolution is the spread of the model prediction. These general trends are investigated for the distributions of the normalised error, in the test samples, divided into bins of true energy 555 The events are selected in the same way as the standard analysis. Note that the energy resolution can be easily improved in the multi-TeV range with tighter quality cuts, however at the price of lowering the collection area. . In a practical point of view to characterize the majority of the gamma-ray events for an unfolding process in a spectral analysis, we obtain the bias and resolution through a Gaussian fit 666 The fit is applied to the samples after standard cuts, and the fit range is determined from the average and the standard deviation (SD) of the population, where the lowest/highest edge of the range is the average the SD. ; the bias and the resolution are the peak position and the standard deviation of the fitted Gaussian respectively. This resolution, which we call resolution (), does not take into account the tail of the distribution outside the standard deviation of the fitted Gaussian, and we also investigate the standard deviation (SD) of the population and call it ”resolution (SD)”.
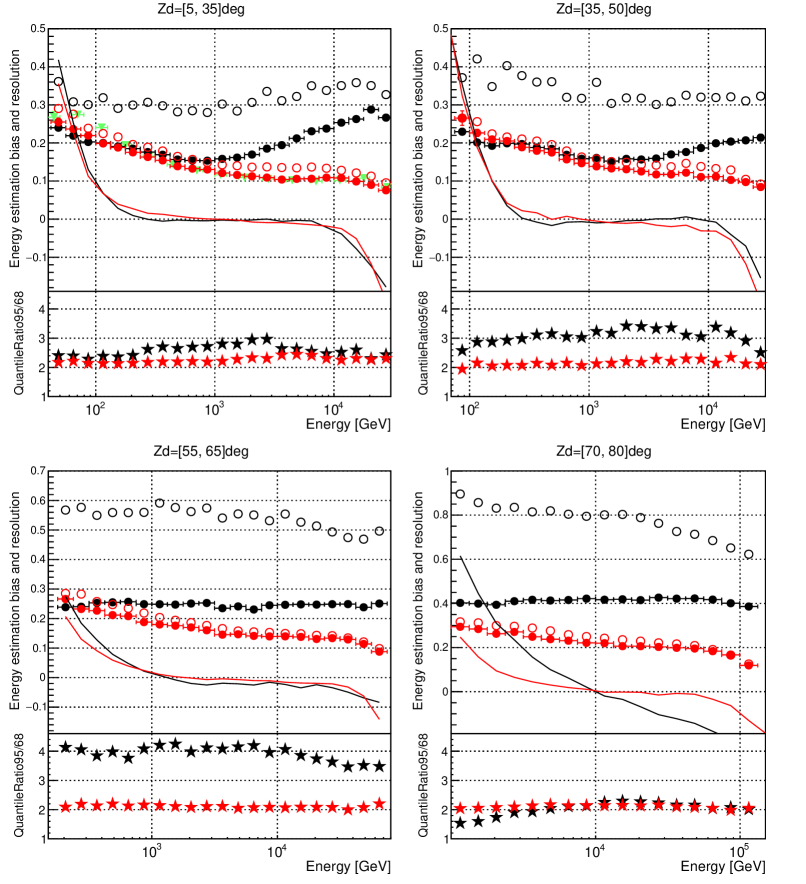
The results are shown in the upper panels of Figure 6. RF-Erec shows significant improvement of resolution compared to LUTs-Erec in all Zd ranges. In the low Zd range, the improvement of resolution () is significant above 1 TeV, where the resolution () by RF-Erec reaches around 10 % at a few TeV, while the one by LUTs-Erec never goes below % and becomes worse ( %) as energy increases. In the low energy side, the resolution () are comparable at mostly . Moreover, the resolution (SD) by RF-Erec almost always outperforms the LUTs-Erec, with a reduction from % at 100 GeV to more than % in the TeV range. The large discrepancy between the resolution () and the resolution (SD) in the LUTs-Erec indicates the large amount of outliers.
In the other Zd ranges, the improvement is more significant. RF-Erec keeps the resolution () and the resolution (SD) close to each other regardless of the Zd range. On the other hand the discrepancy is very large in LUTs-Erec, indicating that the fitted Gaussian shape does not describe the distribution well any more.
A larger resolution (SD) than a resolution () comes from the wider tails, and we quantify it by introducing the quantile ratio 95/68, which is the ratio of the quantile widths of 95 % containment around the peak of the distribution to that of 68 %. For a Gaussian distribution, this value is 2. The results are in the lower panels of Figure 6. In RF-Erec the quantile ratio is always around 2, while in the LUTs-Erec it is always larger and it reaches even 4 in Zd range from 55 to 65. In the Zd range from 70 to 80, the quantile ratio in LUTs-Erec is small, just because the error distribution is already too wide that the edges of the distribution are already truncated by the limited energy range of the training.
Common features between RF-Erec and LUTs-Erec are the resolution worsening at low energies, and the deviations of biases at lowest and highest edges. The degraded resolution at low energies is due to the dimmer and smaller shower images, which affect the reconstruction by higher fluctuations in estimating the total light content and the distance to the shower. The bias rapidly increases at low energies due to the threshold effect. For the high energy, the bias decreases due to the limited energy range of the simulation, which also gives superficially reduced resolution, thus it can be relaxed by extension of the train samples’ energy range at a cost of computation.
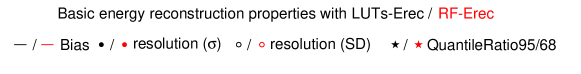
5.2.1 In a morphology study
We evaluate the generalization error also for the events from the outer region in the field of view, for a morphology study or a study with an extended source. The estimator is constructed and evaluated with the MC gamma rays with incoming directions homogeneously distributed in a region with 1.5deg angular diameter around the center of the field of view. The majority of possible events to trigger is sufficiently included in this region, as the trigger region is 1 deg in the central region of the camera. The data set was produced with a pointing direction between 5 and 35 degrees in Zenith angle.
The regions of reconstructed incoming directions are grouped by the offset angle from the center of the camera, into below 0.4 degree, 0.6 to 0.8 degree, and above 1.0 degree. Figure 7 shows the performances for the three offset ranges. The performances are consistent within a few percent accuracy. The small bias can be seen in the inner region in the FoV in both methods 777 The bias seems to act on both RF-Erec and LUTs-Erec as dragging the error distribution of the events in the inner region, in the negative direction: In case of LUTs-Erec, the high bias with its peak at around several TeV looks relaxed in the inner region, while in case of RF-Erec, the estimations starts to be negatively biased in the inner region. Note that the direction reconstructions are the same. , due to the mixture of the training events in the different incoming angles. However the effect of the offset angle is sufficiently small and the performance is good in both bias and resolution for RF-Erec, in all the energy ranges.
5.3 Bin reliability
Here we try to quantify the performance of both methods for different cases of the source spectrum. The error in estimated energy is inevitable, and the major outcome when the statistics is accumulated is a deformation of the estimated energy distribution from the true energy distribution. The deformation is not negligible in gamma ray observations because of the power-law-like nature of the spectra 888 The energy distribution of observed events is also power-law-like because of relatively flat collection area far from the threshold. In such distribution, lower energy events are always more abundant than in the higher energy ones, thereby the tiny fraction of spillover to an estimated energy bin from the lower energy side results in a considerable amount. Such contamination can overwhelm the genuine events and cause a systematic difference of the slope in the reconstructed energy spectrum. , so that we must correct it using the migration matrix via either forward unfolding or unfolding (Albert et al., 2007). However the correction leaves uncertainty from the ambiguity given by the irreducible background events as well as by the limited precision in producing the migration matrix from MC data. This ambiguity is the major drawback in a spectral analysis and we assess it by quantifying the reliability of a bin in the estimated energy distribution. The assessment requires a selection of a pointing direction, which changes the performance of the energy estimator, and also a spectral shape, whose spectral slope significantly changes the influence to the higher energy bins. We select two different ranges of the pointing direction and two slopes of spectrum; low/high Zd (Zd ranges of from 5 to 35 degrees and 55 to 65 degrees), and hard/soft spectrum (spectral indices of 2.5/ 5.0). Based on these selected Zd ranges and spectra, the relations between the true energy and estimated energy distributions are generated in the following way.
For a given Zd range, an example pointing history of observation is determined, which is used for generating the collection area and the migration matrix from the MC events. For a given source with the given observation, the expected true energy distribution per unit time of the acquired gamma-ray events can be expressed as the source spectrum multiplied by the collection area. The expected distribution over the estimated energies per unit time is obtained by multiplying the energy migration matrix to the true energy distribution. The errors are calculated from those of the collection area and the migration matrix. We choose the binning to be 7 bins per decade in both to that of , so that they can be compared bin by bin and a bin should contain a sufficient quantile in the range of estimated energy for the median energy event assuming a resolution of 999 For the steep source, the evaluation was done separately for low energy and high energy, because the number of events are enormously different. The low energy and high energy evaluation has the overlap region so that the purity continues smoothly. . Based on them, we discuss the reliability in two ways, the bin purity and the spillover ratio.
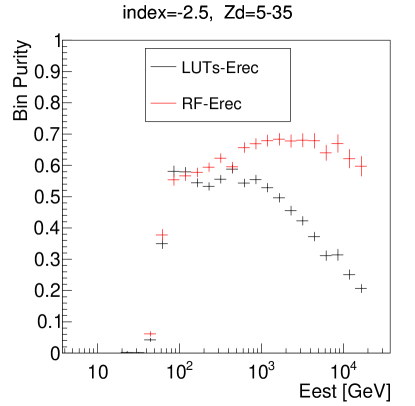
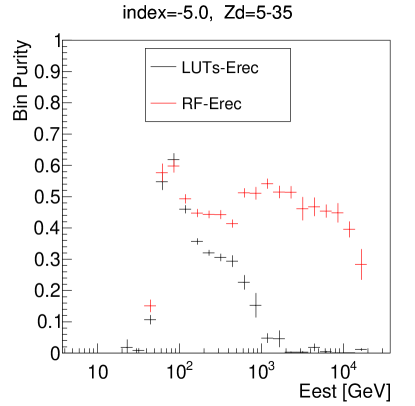
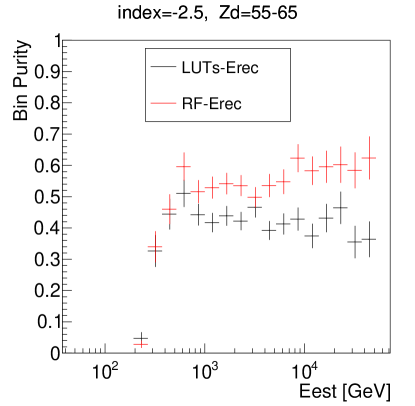
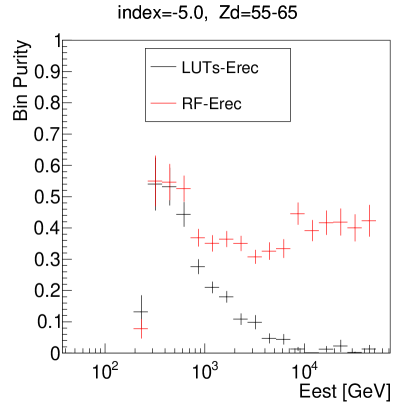
5.3.1 Bin purity
We define bin purity for a given estimated energy bin, as the expected fraction of events whose estimated remained in the same energy bin as their true energies. The result, shown in Figure 8, has significant difference between RF-Erec and LUTs-Erec, especially in the range above a few hundreds of GeV. The improvement is more dramatic in a steeper spectrum or a higher Zd observation. Note that the bin purity depends strongly on the size of the bin. LUTs-Erec has larger energy resolution thus it adopted wider bins to keep the performance. This comparison shows that RF-Erec gives possibility to study source spectra with finer binning (which is in agreement with the shown earlier improvement of the energy resolution).
5.3.2 Spillover ratio
The spillover ratio focuses on the risk of having fake signal events appearing in an estimated energy bin without a real signal in the corresponding true energy bin. This is the case when the original spectrum has a cutoff however the energies of some observed events are reconstructed to be beyond the cutoff. Having such confusing signal, an analyzer is forced to consider the possibility of its existence even after the distribution correction, which can lead to different physics implications.
To investigate this risk, we add a hard cutoff at energy of 1 TeV in the aforementioned power-law spectra for the simulated observation data. Due to the different conditions around the cutoff, we define the spillover ratio in a bin in two ways. Below 1TeV, the spillover ratio is the ratio of the number of events in , denoted as , to that in , denoted as . Above the cutoff energy of 1 TeV, there is no event in , thus the denominator is set to the number of events (in ) at the last bin below 1 TeV. The lowest energy side is treated similarly101010 The lowest energy bin of continuous positive excess bins is chosen as the reference bin. Below the bin, the ratio of the excess events of in each bin to that of in the reference bin is calculated. . Figure 9 shows the result. We begin the discussion on the range above 1TeV, and continue also on the other energies.
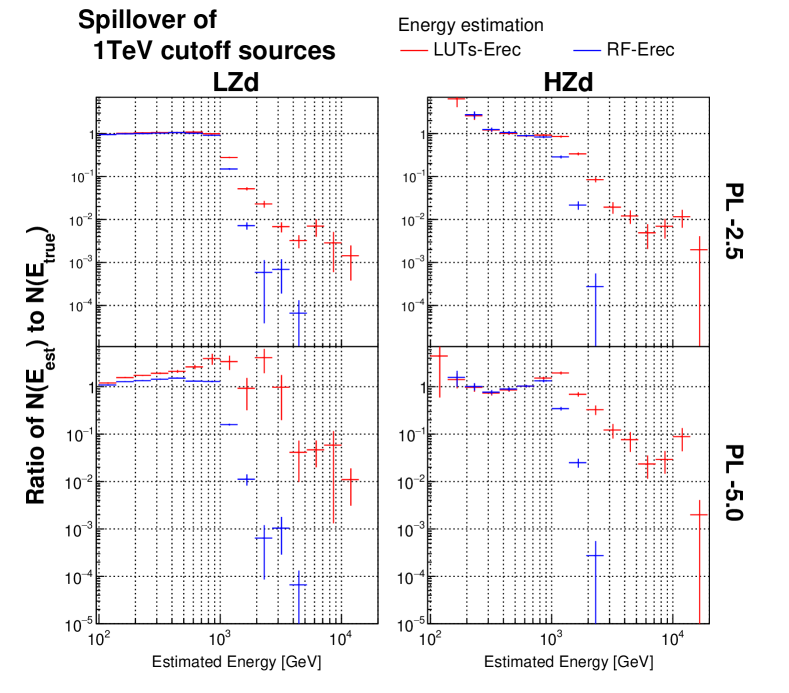
Above 1 TeV, while the ideal spillover ratio is 0 because of no signal above the cutoff energy, the energy estimation error brings spillover events in distribution there, resulting in a positive value. In all the investigated conditions, RF-Erec shows good performances; the ratio quickly falls down above 1 TeV and disappears already at 2 TeV. On the other hand, LUTs-Erec shows a long tail continuing even above 10 TeV with several % of the events with true energies at the last bin below 1 TeV. These events exist in this range by their energy estimation errors much higher than usual events. Therefore the correction of the distribution is doomed to face the very low statistics of MC events in characterising the migration.
Below 1 TeV, the ratio should ideally be 1, but in general it shifts positively because of the higher spillover amount from lower energy. Nonetheless the ratio is mostly close to 1 for both RF-Erec and LUTs-Erec for the hard spectrum in Low Zd. The difference is significant in high energies in the steep spectrum. Despite the higher spillover due to the steep spectrum, the spillover ratio in RF-Erec approaches 1 for higher energy by better energy resolution, on the other hand the ratio by LUTs-Erec does not improve for higher energy, and it shows a rising trend to above 2 in the case of a steep spectrum in low Zd. It indicates that the bins are already dominated by the contamination from different energies of , and it is consistent with the drop of bin purity shown in Figure 8.
6 Conclusions
We presented the RF-Erec, the new method of gamma ray energy reconstruction for the MAGIC observation data. With the remarkable improvement, we update the standard analysis method, previously adopted for the last decade of the stereo observations in the MAGIC collaboration. We have validated the RF-Erec in different point of views, including the consistency with the LUTs-Erec, the previous method, by comparing the Crab spectrum in all the pointing zenith (Zd) ranges.
We have shown the performance of the RF-Erec. For standard observations i.e. dark conditions with Zd less than 35 deg for a point-like source, the energy resolution goes from at 100 GeV to at a few TeV. This is a significant improvement with respect to the LUTs-Erec method in the high energies over several hundreds of GeV, which reaches even more than double. At the higher Zd ranges, the RF-Erec keeps the energy resolution around throughout the target energy range, while the LUTs-Erec worsens as large as .
In addition, the new method suppresses the outlier population in the energy error distribution, which is thus better described by a Gaussian distribution. We quantify the spread of outliers by the ratio of the 95 to the 68 containment width. Such quantile ratio in RF-Erec reaches down to 2, indicating that the error distribution is as narrow as a Gaussian, while LUTs-Erec always has larger tails especially in the medium to high Zd ranges. By this improvement, the RF-Erec enhances the reliability especially for the sources with steep spectra, in higher energies and/or in observations at higher Zd pointings.
We have demonstrated its remarkable benefit in some example spectral analyses with simulated observation data. RF-Erec always keeps the bin purity (assuming 7 bins per decade) around 0.6 to 0.7 in case of a hard spectral index of 2.5 observed in a low Zd range, and around 0.4 in case of a soft spectral index of 5 observed in a high Zd range. This is greatly better than LUTs-Erec especially in high energies, where LUTs-Erec shows the bin purity far less than 0.1 especially above a few hundred GeV in the soft spectrum case. The outlier events with overestimated energies can dominate the higher energy bins. This means that the correction of the deformed estimated energy distribution to the expected true energy distribution is difficult (suffers from large uncertainty). We also focused on the case where the spectrum has a cutoff at 1 TeV, and investigated its spillover ratio in order to see if the events with the estimated energy above 1 TeV are sufficiently low. In RF-Erec the ratio quickly falls down above 1 TeV and disappears already at 2 TeV. On the other hand, LUTs-Erec shows a long tail continuing even above 10 TeV with several per cent of the events with true energies at the last bin below 1 TeV. In this case the deformation of the energy distribution smears out the cutoff and it would be challenging to strongly claim the significance of the existence of the cutoff.
7 Acknowledgements
We would like to thank the MAGIC collaboration for allowing us the usage of software tools, the standard MC data and the observation data, that were needed to perform this study. We would especially like to thank Masahiro Teshima and Thomas Kuhr for supervising the work externally, Koji Noda, Abelardo Molarejo and Darko Zaric for discussions important for initial directions, Chai Yating for many discussions and extensive studies towards better understanding of systematic uncertainties and Julian Sitarek for many discussions towards publication and careful reading of the manuscript. The work is supported by the Polish Ministry Of Education and Science grant No.2021/WK/08.
References
- Aleksić et al. (2016a) J. Aleksić, S. Ansoldi, L.A. Antonelli, P. Antoranz, A. Babic, P. Bangale, M. Barceló, J.A. Barrio, J. Becerra González, W. Bednarek, E. Bernardini, B. Biasuzzi, A. Biland, M. Bitossi, O. Blanch, S. Bonnefoy, G. Bonnoli, F. Borracci, T. Bretz, E. Carmona, A. Carosi, R. Cecchi, P. Colin, E. Colombo, J.L. Contreras, D. Corti, J. Cortina, S. Covino, P. Da Vela, F. Dazzi, A. DeAngelis, G. De Caneva, B. De Lotto, E. de Oña Wilhelmi, C. Delgado Mendez, A. Dettlaff, D. Dominis Prester, D. Dorner, M. Doro, S. Einecke, D. Eisenacher, D. Elsaesser, D. Fidalgo, D. Fink, M.V. Fonseca, L. Font, K. Frantzen, C. Fruck, D. Galindo, R.J. García López, M. Garczarczyk, D. Garrido Terrats, M. Gaug, G. Giavitto, N. Godinović, A. González Muñoz, S.R. Gozzini, W. Haberer, D. Hadasch, Y. Hanabata, M. Hayashida, J. Herrera, D. Hildebrand, J. Hose, D. Hrupec, W. Idec, J.M. Illa, V. Kadenius, H. Kellermann, M.L. Knoetig, K. Kodani, Y. Konno, J. Krause, H. Kubo, J. Kushida, A. La Barbera, D. Lelas, J.L. Lemus, N. Lewandowska, E. Lindfors, S. Lombardi, F. Longo, M. López, R. López-Coto, A. López-Oramas, A. Lorca, E. Lorenz, I. Lozano, M. Makariev, K. Mallot, G. Maneva, N. Mankuzhiyil, K. Mannheim, L. Maraschi, B. Marcote, M. Mariotti, M. Martínez, D. Mazin, U. Menzel, J.M. Miranda, R. Mirzoyan, A. Moralejo, P. Munar-Adrover, D. Nakajima, M. Negrello, V. Neustroev, A. Niedzwiecki, K. Nilsson, K. Nishijima, K. Noda, R. Orito, A. Overkemping, S. Paiano, M. Palatiello, D. Paneque, R. Paoletti, J.M. Paredes, X. Paredes-Fortuny, M. Persic, J. Poutanen, P.G. Prada Moroni, E. Prandini, I. Puljak, R. Reinthal, W. Rhode, M. Ribó, J. Rico, J. Rodriguez Garcia, S. Rügamer, T. Saito, K. Saito, K. Satalecka, V. Scalzotto, V. Scapin, C. Schultz, J. Schlammer, S. Schmidl, T. Schweizer, A. Sillanpää, J. Sitarek, I. Snidaric, D. Sobczynska, F. Spanier, A. Stamerra, T. Steinbring, J. Storz, M. Strzys, L. Takalo, H. Takami, F. Tavecchio, L.A. Tejedor, P. Temnikov, T. Terzić, D. Tescaro, M. Teshima, J. Thaele, O. Tibolla, D.F. Torres, T. Toyama, A. Treves, P. Vogler, H. Wetteskind, M. Will, and R. Zanin. The major upgrade of the MAGIC telescopes, Part I: The hardware improvements and the commissioning of the system. Astropart. Phys., 72:61–75, jan 2016a. ISSN 09276505. doi: 10.1016/j.astropartphys.2015.04.004. URL https://linkinghub.elsevier.com/retrieve/pii/S0927650515000663.
- Aleksić et al. (2016b) J. Aleksić, S. Ansoldi, L.A. Antonelli, P. Antoranz, A. Babic, P. Bangale, M. Barceló, J.A. Barrio, J. Becerra González, W. Bednarek, E. Bernardini, B. Biasuzzi, A. Biland, M. Bitossi, O. Blanch, S. Bonnefoy, G. Bonnoli, F. Borracci, T. Bretz, E. Carmona, A. Carosi, R. Cecchi, P. Colin, E. Colombo, J.L. Contreras, D. Corti, J. Cortina, S. Covino, P. Da Vela, F. Dazzi, A. De Angelis, G. De Caneva, B. De Lotto, E. de Oña Wilhelmi, C. Delgado Mendez, A. Dettlaff, D. Dominis Prester, D. Dorner, M. Doro, S. Einecke, D. Eisenacher, D. Elsaesser, D. Fidalgo, D. Fink, M.V. Fonseca, L. Font, K. Frantzen, C. Fruck, D. Galindo, R.J. García López, M. Garczarczyk, D. Garrido Terrats, M. Gaug, G. Giavitto, N. Godinović, A. González Muñoz, S.R. Gozzini, W. Haberer, D. Hadasch, Y. Hanabata, M. Hayashida, J. Herrera, D. Hildebrand, J. Hose, D. Hrupec, W. Idec, J.M. Illa, V. Kadenius, H. Kellermann, M.L. Knoetig, K. Kodani, Y. Konno, J. Krause, H. Kubo, J. Kushida, A. La Barbera, D. Lelas, J.L. Lemus, N. Lewandowska, E. Lindfors, S. Lombardi, F. Longo, M. López, R. López-Coto, A. López-Oramas, A. Lorca, E. Lorenz, I. Lozano, M. Makariev, K. Mallot, G. Maneva, N. Mankuzhiyil, K. Mannheim, L. Maraschi, B. Marcote, M. Mariotti, M. Martínez, D. Mazin, U. Menzel, J.M. Miranda, R. Mirzoyan, A. Moralejo, P. Munar-Adrover, D. Nakajima, M. Negrello, V. Neustroev, A. Niedzwiecki, K. Nilsson, K. Nishijima, K. Noda, R. Orito, A. Overkemping, S. Paiano, M. Palatiello, D. Paneque, R. Paoletti, J.M. Paredes, X. Paredes-Fortuny, M. Persic, J. Poutanen, P.G. Prada Moroni, E. Prandini, I. Puljak, R. Reinthal, W. Rhode, M. Ribó, J. Rico, J. Rodriguez Garcia, S. Rügamer, T. Saito, K. Saito, K. Satalecka, V. Scalzotto, V. Scapin, C. Schultz, J. Schlammer, S. Schmidl, T. Schweizer, S.N. Shore, A. Sillanpää, J. Sitarek, I. Snidaric, D. Sobczynska, F. Spanier, A. Stamerra, T. Steinbring, J. Storz, M. Strzys, L. Takalo, H. Takami, F. Tavecchio, L.A. Tejedor, P. Temnikov, T. Terzić, D. Tescaro, M. Teshima, J. Thaele, O. Tibolla, D.F. Torres, T. Toyama, A. Treves, P. Vogler, H. Wetteskind, M. Will, and R. Zanin. The major upgrade of the MAGIC telescopes, Part II: A performance study using observations of the Crab Nebula. Astropart. Phys., 72:76–94, jan 2016b. ISSN 09276505. doi: 10.1016/j.astropartphys.2015.02.005. URL https://linkinghub.elsevier.com/retrieve/pii/S0927650515000316.
- Dazzi et al. (2021) F. Dazzi, T. Schweizer, G. Ceribella, D. Corti, A. Dettlaff, J. R. Garcia, D. Hafner, D. Herranz, M. Lopez-Moya, M. Mariotti, R. Maier, S. Metz, R. Mirzoyan, D. Nakajima, T. Saito, M. Shayduk, J. Sitarek, D. Strom, M. Teshima, S. Tran, and M. Will. The Stereoscopic Analog Trigger of the MAGIC Telescopes. IEEE Trans. Nucl. Sci., 68(7):1473–1486, jul 2021. ISSN 15581578. doi: 10.1109/TNS.2021.3079262.
- Albert et al. (2008a) J. Albert, E. Aliu, H. Anderhub, P. Antoranz, A. Armada, M. Asensio, C. Baixeras, J. A. Barrio, H. Bartko, D. Bastieri, J. Becker, W. Bednarek, K. Berger, C. Bigongiari, A. Biland, R. K. Bock, P. Bordas, V. Bosch-Ramon, T. Bretz, I. Britvitch, M. Camara, E. Carmona, A. Chilingarian, S. Ciprini, J. A. Coarasa, S. Commichau, J. L. Contreras, J. Cortina, M. T. Costado, V. Curtef, V. Danielyan, F. Dazzi, A. De Angelis, C. Delgado, R. de los Reyes, B. De Lotto, E. Domingo-Santamaría, D. Dorner, M. Doro, M. Errando, M. Fagiolini, D. Ferenc, E. Fernández, R. Firpo, J. Flix, M. V. Fonseca, L. Font, M. Fuchs, N. Galante, R. J. García-López, M. Garczarczyk, M. Gaug, M. Giller, F. Goebel, D. Hakobyan, M. Hayashida, T. Hengstebeck, A. Herrero, D. Höhne, J. Hose, S. Huber, C. C. Hsu, P. Jacon, T. Jogler, R. Kosyra, D. Kranich, R. Kritzer, A. Laille, E. Lindfors, S. Lombardi, F. Longo, J. López, M. López, E. Lorenz, P. Majumdar, G. Maneva, K. Mannheim, M. Mariotti, M. Martínez, D. Mazin, C. Merck, M. Meucci, M. Meyer, J. M. Miranda, R. Mirzoyan, S. Mizobuchi, A. Moralejo, D. Nieto, K. Nilsson, J. Ninkovic, E. Oña-Wilhelmi, N. Otte, I. Oya, M. Panniello, R. Paoletti, J. M. Paredes, M. Pasanen, D. Pascoli, F. Pauss, R. Pegna, M. Persic, L. Peruzzo, A. Piccioli, N. Puchades, E. Prandini, A. Raymers, W. Rhode, M. Ribó, J. Rico, M. Rissi, A. Robert, S. Rügamer, A. Saggion, T. Y. Saito, A. Sánchez, P. Sartori, V. Scalzotto, V. Scapin, R. Schmitt, T. Schweizer, M. Shayduk, K. Shinozaki, S. N. Shore, N. Sidro, A. Sillanpää, D. Sobczynska, F. Spanier, A. Stamerra, L. S. Stark, L. Takalo, P. Temnikov, D. Tescaro, M. Teshima, D. F. Torres, N. Turini, H. Vankov, A. Venturini, V. Vitale, R. M. Wagner, T. Wibig, W. Wittek, F. Zandanel, R. Zanin, and J. Zapatero. Implementation of the Random Forest method for the Imaging Atmospheric Cherenkov Telescope MAGIC. Nucl. Instruments Methods Phys. Res. Sect. A Accel. Spectrometers, Detect. Assoc. Equip., 588(3):424–432, sep 2008a. ISSN 01689002. doi: 10.1016/j.nima.2007.11.068. URL http://arxiv.org/abs/0709.3719http://dx.doi.org/10.1016/j.nima.2007.11.068.
- Aleksić et al. (2012) J. Aleksić, E.A. Alvarez, L.A. Antonelli, P. Antoranz, M. Asensio, M. Backes, J.A. Barrio, D. Bastieri, J. Becerra González, W. Bednarek, A. Berdyugin, K. Berger, E. Bernardini, A. Biland, O. Blanch, R.K. Bock, A. Boller, G. Bonnoli, D. Borla Tridon, I. Braun, T. Bretz, A. Cañellas, E. Carmona, A. Carosi, P. Colin, E. Colombo, J.L. Contreras, J. Cortina, L. Cossio, S. Covino, F. Dazzi, A. De Angelis, G. De Caneva, E. De Cea del Pozo, B. De Lotto, C. Delgado Mendez, A. Diago Ortega, M. Doert, A. Domı´nguez, D. Dominis Prester, D. Dorner, M. Doro, D. Elsaesser, D. Ferenc, M.V. Fonseca, L. Font, C. Fruck, R.J. Garcı´a López, M. Garczarczyk, D. Garrido, G. Giavitto, N. Godinović, D. Hadasch, D. Häfner, A. Herrero, D. Hildebrand, D. Höhne-Mönch, J. Hose, D. Hrupec, B. Huber, T. Jogler, H. Kellermann, S. Klepser, T. Krähenbühl, J. Krause, A. La Barbera, D. Lelas, E. Leonardo, E. Lindfors, S. Lombardi, M. López, A. López-Oramas, E. Lorenz, M. Makariev, G. Maneva, N. Mankuzhiyil, K. Mannheim, L. Maraschi, M. Mariotti, M. Martı´nez, D. Mazin, M. Meucci, J.M. Miranda, R. Mirzoyan, H. Miyamoto, J. Moldón, A. Moralejo, P. Munar-Adrover, D. Nieto, K. Nilsson, R. Orito, I. Oya, D. Paneque, R. Paoletti, S. Pardo, J.M. Paredes, S. Partini, M. Pasanen, F. Pauss, M.A. Perez-Torres, M. Persic, L. Peruzzo, M. Pilia, J. Pochon, F. Prada, P.G. Prada Moroni, E. Prandini, I. Puljak, I. Reichardt, R. Reinthal, W. Rhode, M. Ribó, J. Rico, S. Rügamer, A. Saggion, K. Saito, T.Y. Saito, M. Salvati, K. Satalecka, V. Scalzotto, V. Scapin, C. Schultz, T. Schweizer, M. Shayduk, S.N. Shore, A. Sillanpää, J. Sitarek, I. Snidaric, D. Sobczynska, F. Spanier, S. Spiro, V. Stamatescu, A. Stamerra, B. Steinke, J. Storz, N. Strah, T. Surić, L. Takalo, H. Takami, F. Tavecchio, P. Temnikov, T. Terzić, D. Tescaro, M. Teshima, O. Tibolla, D.F. Torres, A. Treves, M. Uellenbeck, H. Vankov, P. Vogler, R.M. Wagner, Q. Weitzel, V. Zabalza, F. Zandanel, and R. Zanin. Performance of the MAGIC stereo system obtained with Crab Nebula data. Astropart. Phys., 35(7):435–448, feb 2012. ISSN 0927-6505. doi: 10.1016/J.ASTROPARTPHYS.2011.11.007. URL https://www.sciencedirect.com/science/article/pii/S0927650511002064?via{%}3Dihub.
- Hillas (1985) A. M. Hillas. Cerenkov light images of EAS produced by primary gamma. NASA. Goddard Sp. Flight Cent. 19th Intern. Cosm. Ray Conf., Vol. 3 p 445-448 (SEE N85-34862 23-93), 3, 1985.
- Aliu et al. (2009) E. Aliu, H. Anderhub, L.A. Antonelli, P. Antoranz, M. Backes, C. Baixeras, J.A. Barrio, H. Bartko, D. Bastieri, J.K. Becker, W. Bednarek, K. Berger, E. Bernardini, A. Biland, R.K. Bock, G. Bonnoli, P. Bordas, D. Borla Tridon, V. Bosch-Ramon, T. Bretz, I. Britvitch, M. Camara, E. Carmona, A. Chilingarian, S. Commichau, J.L. Contreras, J. Cortina, M.T. Costado, S. Covino, V. Curtef, F. Dazzi, A. De Angelis, E. De Cea del Pozo, R. de los Reyes, B. De Lotto, M. De Maria, F. De Sabata, C. Delgado Mendez, A. Dominguez, D. Dorner, M. Doro, D. Elsässer, M. Errando, M. Fagiolini, D. Ferenc, E. Fernández, R. Firpo, M.V. Fonseca, L. Font, N. Galante, R.J. García López, M. Garczarczyk, M. Gaug, F. Goebel, D. Hadasch, M. Hayashida, A. Herrero, D. Höhne, J. Hose, C.C. Hsu, S. Huber, T. Jogler, D. Kranich, A. La Barbera, A. Laille, E. Leonardo, E. Lindfors, S. Lombardi, F. Longo, M. López, E. Lorenz, P. Majumdar, G. Maneva, N. Mankuzhiyil, K. Mannheim, L. Maraschi, M. Mariotti, M. Martínez, D. Mazin, M. Meucci, M. Meyer, J.M. Miranda, R. Mirzoyan, M. Moles, A. Moralejo, D. Nieto, K. Nilsson, J. Ninkovic, N. Otte, I. Oya, R. Paoletti, J.M. Paredes, M. Pasanen, D. Pascoli, F. Pauss, R.G. Pegna, M.A. Perez-Torres, M. Persic, L. Peruzzo, A. Piccioli, F. Prada, E. Prandini, N. Puchades, A. Raymers, W. Rhode, M. Ribó, J. Rico, M. Rissi, A. Robert, S. Rügamer, A. Saggion, T.Y. Saito, M. Salvati, M. Sanchez-Conde, P. Sartori, K. Satalecka, V. Scalzotto, V. Scapin, T. Schweizer, M. Shayduk, K. Shinozaki, S.N. Shore, N. Sidro, A. Sierpowska-Bartosik, A. Sillanpää, J. Sitarek, D. Sobczynska, F. Spanier, A. Stamerra, L.S. Stark, L. Takalo, F. Tavecchio, P. Temnikov, D. Tescaro, M. Teshima, M. Tluczykont, D.F. Torres, N. Turini, H. Vankov, A. Venturini, V. Vitale, R.M. Wagner, W. Wittek, V. Zabalza, F. Zandanel, R. Zanin, and J. Zapatero. Improving the performance of the single-dish Cherenkov telescope MAGIC through the use of signal timing. Astropart. Phys., 30(6):293–305, 2009. ISSN 09276505. doi: 10.1016/j.astropartphys.2008.10.003.
- Daum et al. (1997) A. Daum, G. Hermann, M. Heß, W. Hofmann, H. Lampeitl, G. Pühlhofer, F. Aharonian, A. G. Akhperjanian, J. A. Barrio, A. S. Beglarian, K. Bernlöhr, J. J.G. Beteta, S. M. Bradbury, J. L. Contreras, J. Cortina, T. Deckers, E. Feigl, J. Fernandez, V. Fonseca, A. Fraß, B. Funk, J. C. Gonzalez, G. Heinzelmann, M. Hemberger, A. Heusler, I. Holl, D. Horns, R. Kankanyan, O. Kirstein, C. Köhler, A. Konopelko, D. Kranich, H. Krawczynski, H. Kornmayer, A. Lindner, E. Lorenz, N. Magnussen, H. Meyer, R. Mirzoyan, H. Möller, A. Moralejo, L. Padilla, M. Panter, D. Petry, R. Plaga, J. Prahl, C. Prosch, G. Rauterberg, W. Rhode, A. Röhring, V. Sahakian, M. Samorski, J. A. Sanchez, D. Schmele, W. Stamm, M. Ulrich, H. J. Völk, S. Westerhoff, B. Wiebel-Sooth, C. A. Wiedner, M. Willmer, and H. Wirth. First results on the performance of the HEGRA IACT array. Astropart. Phys., 8(1-2):1–11, apr 1997. ISSN 09276505. doi: 10.1016/S0927-6505(97)00031-5. URL https://arxiv.org/abs/astro-ph/9704098v1.
- Commichau et al. (2008) S.C. C. Commichau, A. Biland, J.L. L. Contreras, R. de los Reyes, A. Moralejo, J. Sitarek, and D. Sobczyńska. Monte Carlo studies of geomagnetic field effects on the imaging air Cherenkov technique for the MAGIC telescope site. Nucl. Instruments Methods Phys. Res. Sect. A Accel. Spectrometers, Detect. Assoc. Equip., 595(3):572–586, oct 2008. ISSN 01689002. doi: 10.1016/j.nima.2008.07.144. URL https://linkinghub.elsevier.com/retrieve/pii/S0168900208010978https://www.sciencedirect.com/science/article/pii/S0168900208010978?via{%}3Dihub.
- Majumdar et al. (2005) P. Majumdar, A. Moralejo, C. Bigongiari, O. Blanch, and D. Sobczynska. Monte carlo simulation for the MAGIC telescope. In 29th Int. Cosm. Ray Conf. ICRC 2005, volume 5, pages 203–206. Tata Institute of Fundamental Research, 2005.
- Carmona et al. (2007) E. Carmona, P. Majumdar, A. Moralejo, V. Vitale, D. Sobczynska, M. Haffke, C. Bigongiari, G. Cabras, M. De Maria, and F. De Sabata. Monte Carlo simulation for the MAGIC-II system. In Proc. 30th Int. Cosm. Ray Conf. ICRC 2007, volume 3, pages 1373–1376. Universidad Nacional Autonoma de Mexico, sep 2007. URL https://arxiv.org/abs/0709.2959v1.
- Heck et al. (1998) D Heck, J Knapp, J N Capdevielle, G Schatz, and T Thouw. CORSIKA: A Monte Carlo Code to Simulate Extensive Air Showers. Forschungszentrum Karlsruhe, FZKA 6019:1–90, 1998. URL http://www-ik.fzk.de/corsika/physics{_}description/corsika{_}phys.html.
- Fomin et al. (1994a) V.P. Fomin, A.A. Stepanian, R.C. Lamb, D.A. Lewis, M. Punch, and T.C. Weekes. New methods of atmospheric Cherenkov imaging for gamma-ray astronomy. I. The false source method. Astropart. Phys., 2(2):137–150, 1994a. ISSN 09276505. doi: 10.1016/0927-6505(94)90036-1.
- Nieto et al. (2021a) D. Nieto, A. Brill, Q. Feng, T. B. Humensky, B. Kim, T. Miener, R. Mukherjee, and J. Sevilla. CTLearn: Deep Learning for Gamma-ray Astronomy. In Proc. Sci., volume 358. Sissa Medialab Srl, dec 2021a. doi: 10.22323/1.358.0752. URL https://arxiv.org/abs/1912.09877v1.
- De et al. (2022) Songshaptak De, Writasree Maitra, Vikram Rentala, and Arun M. Thalapillil. Deep learning techniques for Imaging Air Cherenkov Telescopes. J. Cosmol. Astropart. Phys., jun 2022. doi: 10.48550/arxiv.2206.05296. URL https://arxiv.org/abs/2206.05296v1http://arxiv.org/abs/2206.05296.
- Jacquemont et al. (2021) Mikael Jacquemont, Thomas Vuillaume, Alexandre Benoit, Gilles Maurin, Patrick Lambert, and Giovanni Lamanna. First Full-Event Reconstruction from Imaging Atmospheric Cherenkov Telescope Real Data with Deep Learning. In Proc. - Int. Work. Content-Based Multimed. Index., volume 2021-June. IEEE Computer Society, jun 2021. ISBN 9781665442206. doi: 10.1109/CBMI50038.2021.9461918.
- Nieto et al. (2021b) D. Nieto, A. Brill, Q. Feng, M. Jacquemont, B. Kim, T. Miener, and T. Vuillaume. Studying deep convolutional neural networks with hexagonal lattices for imaging atmospheric Cherenkov telescope event reconstruction. In Proc. Sci., volume 358. Sissa Medialab Srl, dec 2021b. doi: 10.22323/1.358.0753. URL https://arxiv.org/abs/1912.09898v1.
- Miener et al. (2021) T. Miener, R. López-Coto, J. L. Contreras, J. G. Green, D. Green, E. Mariotti, D. Nieto, L. Romanato, and S. Yadav. IACT event analysis with the MAGIC telescopes using deep convolutional neural networks with CTLearn. Proc. XXXI Astron. Data Anal. Softw. Syst. Conf., dec 2021. doi: 10.48550/arxiv.2112.01828. URL https://arxiv.org/abs/2112.01828v1.
- Funk (2015) Stefan Funk. Ground-and Space-Based Gamma-Ray Astronomy. Annu. Rev. Nucl. Part. Sci, 65:245–77, 2015. doi: 10.1146/annurev-nucl-102014-022036. URL www.annualreviews.org.
- Aharonian et al. (2006) F. Aharonian, A. G. Akhperjanian, A. R. Bazer-Bachi, M. Beilicke, W. Benbow, D. Berge, K. Bernlöhr, C. Boisson, O. Bolz, V. Borrel, I. Braun, F. Breitling, A. M. Brown, R. Bühler, I. Büsching, S. Carrigan, P. M. Chadwick, L. M. Chounet, R. Cornils, L. Costamante, B. Degrange, H. J. Dickinson, A. Djannati-Ataï, L. O.C. Drury, G. Dubus, K. Egberts, D. Emmanoulopoulos, P. Espigat, F. Feinstein, E. Ferrero, A. Fiasson, G. Fontaine, S. Funk, S. Funk, Y. A. Gallant, B. Giebels, J. F. Glicenstein, P. Goret, C. Hadjichristidis, D. Hauser, M. Hauser, G. Heinzelmann, G. Henri, G. Hermann, J. A. Hinton, W. Hofmann, M. Holleran, D. Horns, A. Jacholkowska, O. C. de Jager, B. Khélifi, N. Komin, A. Konopelko, K. Kosack, I. J. Latham, R. le Gallou, A. Lemière, M. Lemoine-Goumard, T. Lohse, J. M. Martin, O. Martineau-Huynh, A. Marcowith, C. Masterson, T. J.L. McComb, M. de Naurois, D. Nedbal, S. J. Nolan, A. Noutsos, K. J. Orford, J. L. Osborne, M. Ouchrif, M. Panter, G. Pelletier, S. Pita, G. Pühlhofer, M. Punch, B. C. Raubenheimer, M. Raue, S. M. Rayner, A. Reimer, O. Reimer, J. Ripken, L. Rob, L. Rolland, G. Rowell, V. Sahakian, L. Saugé, S. Schlenker, R. Schlickeiser, U. Schwanke, H. Sol, D. Spangler, F. Spanier, R. Steenkamp, C. Stegmann, G. Superina, J. P. Tavernet, R. Terrier, C. G. Théoret, M. Tluczykont, C. van Eldik, G. Vasileiadis, C. Venter, P. Vincent, H. J. Völk, S. J. Wagner, and M. Ward. Observations of the Crab nebula with HESS. Astron. Astrophys., 457(3):899–915, jul 2006. ISSN 00046361. doi: 10.1051/0004-6361:20065351. URL http://arxiv.org/abs/astro-ph/0607333http://dx.doi.org/10.1051/0004-6361:20065351.
- Meagher (2015) Kevin Meagher. Six years of VERITAS observations of the Crab nebula. In Proc. Sci., volume 30-July-20. Proceedings of Science (PoS), aug 2015. doi: 10.22323/1.236.0792. URL https://arxiv.org/abs/1508.06442v1.
- Park (2015) Nahee Park. Performance of the VERITAS experiment. In Proc. Sci., volume 30-July-20, 2015. doi: 10.22323/1.236.0771. URL http://pos.sissa.it/.
- Parsons and Hinton (2014) R. D. Parsons and J. A. Hinton. A Monte Carlo template based analysis for air-Cherenkov arrays. Astropart. Phys., 56:26–34, apr 2014. ISSN 09276505. doi: 10.1016/j.astropartphys.2014.03.002.
- Parsons et al. (2015) R. D. Parsons, M. Gajdus, and T. Murach. HESS II data analysis with ImPACT. Proc. Sci., 30-July-20, 2015. ISSN 18248039. doi: 10.22323/1.236.0826.
- Breiman (2001) Leo Breiman. Random Forests. Technical report, 2001. URL https://link.springer.com/content/pdf/10.1023{%}2FA{%}3A1010933404324.pdf.
- H. E. S. S. Collaboration et al. (2018) H. E. S. S. Collaboration, H. Abdalla, F. Aharonian, F. Ait Benkhali, E. O. Angüner, M. Arakawa, C. Arcaro, C. Arm, M. Arrieta, M. Backes, M. Barnard, Y. Becherini, J. Becker Tjus, D. Berge, S. Bernhard, K. Bernlöhr, R. Blackwell, M. Böttcher, C. Boisson, J. Bolmont, S. Bonnefoy, P. Bordas, J. Bregeon, F. Brun, P. Brun, M. Bryan, M. Büchele, T. Bulik, T. Bylund, M. Capasso, S. Caroff, A. Carosi, S. Casanova, M. Cerruti, N. Chakraborty, S. Ch, R. C. G. Chaves, A. Chen, S. Colafrancesco, B. Condon, I. D. Davids, C. Deil, J. Devin, P. DeWilt, L. Dirson, A. Djannati-Ataï, A. Dmytriiev, A. Donath, V. Doroshenko, L. O’C. Drury, J. Dyks, K. Egberts, G. Emery, J. P. Ernenwein, S. Eschbach, S. Fegan, A. Fiasson, G. Fontaine, S. Funk, M. Füßling, S. Gabici, Y. A. Gallant, F. Gaté, G. Giavitto, D. Glawion, J. F. Glicenstein, D. Gottschall, M. H. Grondin, J. Hahn, M. Haupt, G. Heinzelmann, G. Henri, G. Hermann, J. A. Hinton, W. Hofmann, C. Hoischen, T. L. Holch, M. Holler, D. Horns, D. Huber, H. Iwasaki, A. Jacholkowska, M. Jamrozy, D. Jankowsky, F. Jankowsky, L. Jouvin, I. Jung-Richardt, M. A. Kastendieck, K. Katarzyński, M. Katsuragawa, U. Katz, D. Kerszberg, D. Khangulyan, B. Khélifi, J. King, S. Klepser, W. Kluźniak, Nu. Komin, K. Kosack, S. Krakau, M. Kraus, P. P. Krüger, G. Lamanna, J. Lau, J. Lefaucheur, A. Lemière, M. Lemoine-Goumard, J. P. Lenain, E. Leser, T. Lohse, M. Lorentz, R. López-Coto, I. Lypova, D. Malyshev, V. Mar, A. Marcowith, C. Mariaud, G. Martí-Devesa, R. Marx, G. Maurin, P. J. Meintjes, A. M. W. Mitchell, R. Moderski, M. Mohamed, L. Mohrmann, E. Moulin, T. Murach, S. Nakashima, M. de Naurois, H. Ndiyavala, F. Niederwanger, J. Niemiec, L. Oakes, P. O’Brien, H. Odaka, S. Ohm, M. Ostrowski, I. Oya, M. Padovani, M. Panter, R. D. Parsons, C. Perennes, P. O. Petrucci, B. Peyaud, Q. Piel, S. Pita, V. Poireau, A. Priyana Noel, D. A. Prokhorov, H. Prokoph, G. Pühlhofer, M. Punch, A. Quirrenbach, S. Raab, R. Rauth, A. Reimer, O. Reimer, M. Renaud, F. Rieger, L. Rinchiuso, C. Romoli, G. Rowell, B. Rudak, E. Ruiz-Velasco, V. Sahakian, S. Saito, D. A. Sanchez, A. Santangelo, M. Sasaki, R. Schlickeiser, F. Schüssler, A. Schulz, U. Schwanke, S. Schwemmer, M. Seglar-Arroyo, M. Senniappan, A. S. Seyffert, N. Shafi, I. Shilon, K. Shiningayamwe, R. Simoni, A. Sinha, H. Sol, F. Spanier, A. Specovius, M. Spir-Jacob, Ł. Stawarz, R. Steenkamp, C. Stegmann, C. Steppa, T. Takahashi, J. P. Tavernet, T. Tavernier, A. M. Taylor, R. Terrier, L. Tibaldo, D. Tiziani, M. Tluczykont, C. Trichard, M. Tsirou, N. Tsuji, R. Tuffs, Y. Uchiyama, D. J. van der Walt, C. van Eldik, C. van Rensburg, B. van Soelen, G. Vasileiadis, J. Veh, C. Venter, P. Vincent, J. Vink, F. Voisin, H. J. Völk, T. Vuillaume, Z. Wadiasingh, S. J. Wagner, R. M. Wagner, R. White, A. Wierzcholska, R. Yang, D. Zaborov, M. Zacharias, R. Zanin, A. A. Zdziarski, A. Zech, F. Zefi, A. Ziegler, J. Zorn, N. Żywucka, M. Kerr, S. Johnston, and R. M. Shannon. First Ground-based Measurement of Sub-20 GeV to 100 GeV gamma-rays from the Vela Pulsar with H.E.S.S. II. Astron. Astrophys., jul 2018. doi: 10.1051/0004-6361/201732153. URL http://arxiv.org/abs/1807.01302http://dx.doi.org/10.1051/0004-6361/201732153.
- Acciari et al. (2020) V. A. Acciari, S. Ansoldi, L. A. Antonelli, A. Arbet Engels, D. Baack, A. Babić, B. Banerjee, U. Barres de Almeida, J. A. Barrio, J. Becerra González, W. Bednarek, L. K. Bellizzi, E. Bernardini, A. Berti, J. Besenrieder, W. Bhattacharyya, C. Bigongiari, A. Biland, O. Blanch, G. Bonnoli, Ž. Bošnjak, G. Busetto, R. Carosi, G. Ceribella, M. Cerruti, Y. Chai, A. Chilingarian, S. Cikota, S. M. Colak, U. Colin, E. Colombo, J. L. Contreras, J. Cortina, S. Covino, V. D’Elia, P. Da Vela, F. Dazzi, A. De Angelis, B. De Lotto, F. Del Puppo, M. Delfino, J. Delgado, D. Depaoli, F. Di Pierro, L. Di Venere, E. Do Souto Espiñeira, D. Dominis Prester, A. Donini, D. Dorner, M. Doro, D. Elsaesser, V. Fallah Ramazani, A. Fattorini, G. Ferrara, L. Foffano, M. V. Fonseca, L. Font, C. Fruck, S. Fukami, R. J. García López, M. Garczarczyk, S. Gasparyan, M. Gaug, N. Giglietto, F. Giordano, P. Gliwny, N. Godinović, D. Green, D. Hadasch, A. Hahn, T. Hassan, J. Herrera, J. Hoang, D. Hrupec, M. Hütten, T. Inada, S. Inoue, K. Ishio, Y. Iwamura, L. Jouvin, Y. Kajiwara, D. Kerszberg, Y. Kobayashi, H. Kubo, J. Kushida, A. Lamastra, D. Lelas, F. Leone, E. Lindfors, S. Lombardi, F. Longo, M. López, R. López-Coto, A. López-Oramas, S. Loporchio, B. Machado de Oliveira Fraga, C. Maggio, P. Majumdar, M. Makariev, M. Mallamaci, G. Maneva, M. Manganaro, K. Mannheim, L. Maraschi, M. Mariotti, M. Martínez, D. Mazin, S. Mender, S. Mićanović, D. Miceli, T. Miener, M. Minev, J. M. Miranda, R. Mirzoyan, E. Molina, A. Moralejo, D. Morcuende, V. Moreno, E. Moretti, P. Munar-Adrover, V. Neustroev, C. Nigro, K. Nilsson, D. Ninci, K. Nishijima, K. Noda, L. Nogués, S. Nozaki, Y. Ohtani, T. Oka, J. Otero-Santos, M. Palatiello, D. Paneque, R. Paoletti, J. M. Paredes, L. Pavletić, P. Peñil, M. Peresano, M. Persic, P. G. Prada Moroni, E. Prandini, I. Puljak, W. Rhode, M. Ribó, J. Rico, C. Righi, A. Rugliancich, L. Saha, N. Sahakyan, T. Saito, S. Sakurai, K. Satalecka, B. Schleicher, K. Schmidt, T. Schweizer, J. Sitarek, I. Šnidarić, D. Sobczynska, A. Spolon, A. Stamerra, D. Strom, M. Strzys, Y. Suda, T. Surić, M. Takahashi, F. Tavecchio, P. Temnikov, T. Terzić, M. Teshima, N. Torres-Albà, L. Tosti, J. van Scherpenberg, G. Vanzo, M. Vazquez Acosta, S. Ventura, V. Verguilov, C. F. Vigorito, V. Vitale, I. Vovk, M. Will, D. Zarić, (MAGIC Collaboration), M. Petropoulou, J. Finke, F. D’Ammando, M. Baloković, G. Madejski, K. Mori, Simonetta Puccetti, C. Leto, M. Perri, F. Verrecchia, M. Villata, C. M. Raiteri, I. Agudo, R. Bachev, A. Berdyugin, D. A. Blinov, R. Chanishvili, W. P. Chen, R. Chigladze, G. Damljanovic, C. Eswaraiah, T. S. Grishina, S. Ibryamov, B. Jordan, S. G. Jorstad, M. Joshi, E. N. Kopatskaya, O. M. Kurtanidze, S. O. Kurtanidze, E. G. Larionova, L. V. Larionova, V. M. Larionov, G. Latev, H. C. Lin, A. P. Marscher, A. A. Mokrushina, D. A. Morozova, M. G. Nikolashvili, E. Semkov, P. S. Smith, A. Strigachev, Yu. V. Troitskaya, I. S. Troitsky, O. Vince, J. Barnes, T. Güver, J. W. Moody, A. C. Sadun, T. Hovatta, J. L. Richards, W. Max-Moerbeck, A. C. S. Readhead, A. Lähteenmäki, M. Tornikoski, J. Tammi, V. Ramakrishnan, R. Reinthal, and R. Reinthal. Unraveling the Complex Behavior of Mrk 421 with Simultaneous X-Ray and VHE Observations during an Extreme Flaring Activity in 2013 April*. Astrophys. J. Suppl. Ser., 248(2):29, jun 2020. ISSN 0067-0049. doi: 10.3847/1538-4365/AB89B5. URL https://iopscience.iop.org/article/10.3847/1538-4365/ab89b5https://iopscience.iop.org/article/10.3847/1538-4365/ab89b5/meta.
- Fomin et al. (1994b) V. P. Fomin, A. A. Stepanian, R. C. Lamb, D. A. Lewis, M. Punch, and T. C. Weekes. New methods of atmospheric Cherenkov imaging for gamma-ray astronomy. I. The false source method. Astropart. Phys., 2(2):137–150, may 1994b. ISSN 0927-6505. doi: 10.1016/0927-6505(94)90036-1.
- Albert et al. (2008b) J. Albert, E. Aliu, H. Anderhub, P. Antoranz, A. Armada, M. Asensio, C. Baixeras, J. A. Barrio, H. Bartko, D. Bastieri, J. Becker, W. Bednarek, K. Berger, C. Bigongiari, A. Biland, R. K. Bock, P. Bordas, V. Bosch-Ramon, T. Bretz, I. Britvitch, M. Camara, E. Carmona, A. Chilingarian, S. Ciprini, J. A. Coarasa, S. Commichau, J. L. Contreras, J. Cortina, M. T. Costado, V. Curtef, V. Danielyan, F. Dazzi, A. De Angelis, C. Delgado, R. de los Reyes, B. De Lotto, E. Domingo-Santamaría, D. Dorner, M. Doro, M. Errando, M. Fagiolini, D. Ferenc, E. Fernández, R. Firpo, J. Flix, M. V. Fonseca, L. Font, M. Fuchs, N. Galante, R. J. García-López, M. Garczarczyk, M. Gaug, M. Giller, F. Goebel, D. Hakobyan, M. Hayashida, T. Hengstebeck, A. Herrero, D. Höhne, J. Hose, S. Huber, C. C. Hsu, P. Jacon, T. Jogler, R. Kosyra, D. Kranich, R. Kritzer, A. Laille, E. Lindfors, S. Lombardi, F. Longo, J. López, M. López, E. Lorenz, P. Majumdar, G. Maneva, K. Mannheim, M. Mariotti, M. Martínez, D. Mazin, C. Merck, M. Meucci, M. Meyer, J. M. Miranda, R. Mirzoyan, S. Mizobuchi, A. Moralejo, D. Nieto, K. Nilsson, J. Ninkovic, E. Oña-Wilhelmi, N. Otte, I. Oya, M. Panniello, R. Paoletti, J. M. Paredes, M. Pasanen, D. Pascoli, F. Pauss, R. Pegna, M. Persic, L. Peruzzo, A. Piccioli, N. Puchades, E. Prandini, A. Raymers, W. Rhode, M. Ribó, J. Rico, M. Rissi, A. Robert, S. Rügamer, A. Saggion, T. Y. Saito, A. Sánchez, P. Sartori, V. Scalzotto, V. Scapin, R. Schmitt, T. Schweizer, M. Shayduk, K. Shinozaki, S. N. Shore, N. Sidro, A. Sillanpää, D. Sobczynska, F. Spanier, A. Stamerra, L. S. Stark, L. Takalo, P. Temnikov, D. Tescaro, M. Teshima, D. F. Torres, N. Turini, H. Vankov, A. Venturini, V. Vitale, R. M. Wagner, T. Wibig, W. Wittek, F. Zandanel, R. Zanin, and J. Zapatero. Implementation of the Random Forest method for the Imaging Atmospheric Cherenkov Telescope MAGIC. Nucl. Instruments Methods Phys. Res. Sect. A Accel. Spectrometers, Detect. Assoc. Equip., 588(3):424–432, apr 2008b. ISSN 0168-9002. doi: 10.1016/J.NIMA.2007.11.068.
- MAGIC Collaboration et al. (2015) MAGIC Collaboration, J. Aleksić, S. Ansoldi, L. A. Antonelli, P. Antoranz, A. Babic, P. Bangale, J. A. Barrio, J. Becerra González, W. Bednarek, E. Bernardini, B. Biasuzzi, A. Biland, O. Blanch, S. Bonnefoy, G. Bonnoli, F. Borracci, T. Bretz, E. Carmona, A. Carosi, P. Colin, E. Colombo, J. L. Contreras, J. Cortina, S. Covino, P. Da Vela, F. Dazzi, A. De Angelis, G. De Caneva, B. De Lotto, E. de Oña Wilhelmi, C. Delgado Mendez, D. Dominis Prester, D. Dorner, M. Doro, S. Einecke, D. Eisenacher, D. Elsaesser, D. Fidalgo, M. V. Fonseca, L. Font, K. Frantzen, C. Fruck, D. Galindo, R. J. García López, M. Garczarczyk, D. Garrido Terrats, M. Gaug, N. Godinović, A. González Muñoz, S. R. Gozzini, D. Hadasch, Y. Hanabata, M. Hayashida, J. Herrera, D. Hildebrand, J. Hose, D. Hrupec, W. Idec, V. Kadenius, H. Kellermann, M. L. Knoetig, K. Kodani, Y. Konno, J. Krause, H. Kubo, J. Kushida, A. La Barbera, D. Lelas, N. Lewandowska, E. Lindfors, S. Lombardi, F. Longo, M. López, R. López-Coto, A. López-Oramas, E. Lorenz, I. Lozano, M. Makariev, K. Mallot, G. Maneva, N. Mankuzhiyil, K. Mannheim, L. Maraschi, B. Marcote, M. Mariotti, M. Martínez, D. Mazin, U. Menzel, J. M. Miranda, R. Mirzoyan, A. Moralejo, P. Munar-Adrover, D. Nakajima, V. Neustroev, A. Niedzwiecki, K. Nilsson, K. Nishijima, K. Noda, R. Orito, A. Overkemping, S. Paiano, M. Palatiello, D. Paneque, R. Paoletti, J. M. Paredes, X. Paredes-Fortuny, M. Persic, J. Poutanen, P. G. Prada Moroni, E. Prandini, I. Puljak, R. Reinthal, W. Rhode, M. Ribó, J. Rico, J. Rodriguez Garcia, S. Rügamer, T. Saito, K. Saito, K. Satalecka, V. Scalzotto, V. Scapin, C. Schultz, T. Schweizer, S. N. Shore, A. Sillanpää, J. Sitarek, I. Snidaric, D. Sobczynska, F. Spanier, A. Stamerra, T. Steinbring, J. Storz, M. Strzys, L. Takalo, H. Takami, F. Tavecchio, P. Temnikov, T. Terzić, D. Tescaro, M. Teshima, J. Thaele, O. Tibolla, D. F. Torres, T. Toyama, A. Treves, P. Vogler, M. Will, R. Zanin, D. Horns, J. Martin, M. Meyer, J. Becerra González, W. Bednarek, E. Bernardini, B. Biasuzzi, A. Biland, O. Blanch, S. Bonnefoy, G. Bonnoli, F. Borracci, T. Bretz, E. Carmona, A. Carosi, P. Colin, E. Colombo, J. L. Contreras, J. Cortina, S. Covino, P. Da Vela, F. Dazzi, A. De Angelis, G. De Caneva, B. De Lotto, E. de Oña Wilhelmi, C. Delgado Mendez, M. Doert, D. Dominis Prester, D. Dorner, M. Doro, S. Einecke, D. Eisenacher, D. Elsaesser, M. V. Fonseca, L. Font, K. Frantzen, C. Fruck, D. Galindo, R. J. García López, M. Garczarczyk, D. Garrido Terrats, M. Gaug, N. Godinović, A. González Muñoz, S. R. Gozzini, D. Hadasch, Y. Hanabata, M. Hayashida, J. Herrera, D. Hildebrand, J. Hose, D. Hrupec, W. Idec, V. Kadenius, H. Kellermann, K. Kodani, Y. Konno, J. Krause, H. Kubo, J. Kushida, A. La Barbera, D. Lelas, N. Lewandowska, E. Lindfors, S. Lombardi, M. López, R. López-Coto, A. López-Oramas, E. Lorenz, I. Lozano, M. Makariev, K. Mallot, G. Maneva, N. Mankuzhiyil, K. Mannheim, L. Maraschi, B. Marcote, M. Mariotti, M. Martínez, D. Mazin, U. Menzel, J. M. Miranda, R. Mirzoyan, A. Moralejo, P. Munar-Adrover, D. Nakajima, A. Niedzwiecki, K. Nilsson, K. Nishijima, K. Noda, N. Nowak, R. Orito, A. Overkemping, S. Paiano, M. Palatiello, D. Paneque, R. Paoletti, J. M. Paredes, X. Paredes-Fortuny, M. Persic, P. G. Prada Moroni, E. Prandini, S. Preziuso, I. Puljak, R. Reinthal, W. Rhode, M. Ribó, J. Rico, J. Rodriguez Garcia, S. Rügamer, A. Saggion, T. Saito, K. Saito, K. Satalecka, V. Scalzotto, V. Scapin, C. Schultz, T. Schweizer, S. N. Shore, A. Sillanpää, J. Sitarek, I. Snidaric, D. Sobczynska, F. Spanier, V. Stamatescu, A. Stamerra, T. Steinbring, J. Storz, M. Strzys, L. Takalo, H. Takami, F. Tavecchio, P. Temnikov, T. Terzić, D. Tescaro, M. Teshima, J. Thaele, O. Tibolla, D. F. Torres, T. Toyama, A. Treves, M. Uellenbeck, P. Vogler, R. M. Wagner, R. Zanin, D. Horns, J. Martín, and M. Meyer. Measurement of the Crab Nebula spectrum over three decades in energy with the MAGIC telescopes. J. High Energy Astrophys., 5-6:30–38, mar 2015. ISSN 2214-4048. doi: 10.1016/J.JHEAP.2015.01.002. URL http://arxiv.org/abs/1406.6892http://dx.doi.org/10.1016/j.jheap.2015.01.002.
- Albert et al. (2007) J. Albert, E. Aliu, H. Anderhub, P. Antoranz, A. Armada, M. Asensio, C. Baixeras, J. A. Barrio, H. Bartko, D. Bastieri, J. Becker, W. Bednarek, K. Berger, C. Bigongiari, A. Biland, R. K. Bock, P. Bordas, V. Bosch-Ramon, T. Bretz, I. Britvitch, M. Camara, E. Carmona, A. Chilingarian, S. Ciprini, J. A. Coarasa, S. Commichau, J. L. Contreras, J. Cortina, M. T. Costado, V. Curtef, V. Danielyan, F. Dazzi, A. De Angelis, C. Delgado, R. de los Reyes, B. De Lotto, E. Domingo-Santamaría, D. Dorner, M. Doro, M. Errando, M. Fagiolini, D. Ferenc, E. Fernández, R. Firpo, J. Flix, M. V. Fonseca, L. Font, M. Fuchs, N. Galante, R. J. García-López, M. Garczarczyk, M. Gaug, M. Giller, F. Goebel, D. Hakobyan, M. Hayashida, T. Hengstebeck, A. Herrero, D. Höhne, J. Hose, C. C. Hsu, P. Jacon, T. Jogler, R. Kosyra, D. Kranich, R. Kritzer, A. Laille, E. Lindfors, S. Lombardi, F. Longo, J. López, M. López, E. Lorenz, P. Majumdar, G. Maneva, K. Mannheim, O. Mansutti, M. Mariotti, M. Martínez, D. Mazin, C. Merck, M. Meucci, M. Meyer, J. M. Miranda, R. Mirzoyan, S. Mizobuchi, A. Moralejo, D. Nieto, K. Nilsson, J. Ninkovic, E. Oña-Wilhelmi, N. Otte, I. Oya, M. Panniello, R. Paoletti, J. M. Paredes, M. Pasanen, D. Pascoli, F. Pauss, R. Pegna, M. Persic, L. Peruzzo, A. Piccioli, N. Puchades, E. Prandini, A. Raymers, W. Rhode, M. Ribó, J. Rico, M. Rissi, A. Robert, S. Rügamer, A. Saggion, T. Saito, A. Sánchez, P. Sartori, V. Scalzotto, V. Scapin, R. Schmitt, T. Schweizer, M. Shayduk, K. Shinozaki, S. N. Shore, N. Sidro, A. Sillanpää, D. Sobczynska, A. Stamerra, L. S. Stark, L. Takalo, P. Temnikov, D. Tescaro, M. Teshima, D. F. Torres, N. Turini, H. Vankov, V. Vitale, R. M. Wagner, T. Wibig, W. Wittek, F. Zandanel, R. Zanin, and J. Zapatero. Unfolding of differential energy spectra in the MAGIC experiment. Nucl. Instruments Methods Phys. Res. Sect. A Accel. Spectrometers, Detect. Assoc. Equip., 583(2-3):494–506, dec 2007. ISSN 01689002. doi: 10.1016/j.nima.2007.09.048.