Hemispheric asymmetry in the sunspot cycle as a nonextensive phenomenon
keywords:
Solar activity, Solar cycle variations, statistical physics, nonlinear dynamical systems1 Introduction
intro Among the various solar phenomena studied by humanity, the observation of sunspots is undoubtedly one of the oldest in the history of astronomy. The first sunspot observation data dates back more than 2000 years in China (Clark and Stephenson, 1978; Wittmann and Xu, 1987). However, it was only at the beginning of the 17th century that the first observations were made using a telescope, in which Galileo Galilei demonstrated that it was not a planetary transit. Later, Schwabe (1844) deduced the spottedness of the Sun waxed and waned over an 11-year cyclic period. More recently, several studies (e.g., Norton, Charbonneau, and Passos, 2014; Deng et al., 2016; El-Borie, Abdel-halim, and El-Monier, 2016; Badalyan and Obridko, 2017; El-Borie et al., 2021) showed that various solar magnetic activity indicators, such as sunspots, faculae, and flares, typically are distributed unevenly between the northern and southern hemisphere of the Sun a.k.a solar hemispheric asymmetry.
In this context, our work aims to investigate the physical origin of solar cyclic activity to account for the varying configuration of the sun’s magnetic field since it has not yet been understood completely (Hiremath, 2006). In particular, we will explore the dynamics of North-South (hereafter N-S) hemispheric asymmetry as a process predominantly originated from nonlinearity in the solar dynamo (Das, Ghosh, and Karak, 2022).
1.1 The problem of solar hemispheric asymmetry
Sunspots are the windows into the Sun’s complex interior phenomena which emerge on its surface. They rise as temporary dark spots because they are cooler than their surrounding areas (Forgács-Dajka, Dobos, and Ballai, 2021). In fact, this behavior is due to the strong magnetic activity associated with the differential rotation, in which the plasma flow that accompanies the field lines is compressed to the point of breaking. Mass and energy are then released in a chaotic way, thus generating regions with temperatures around 3700 K. This explains the darkening of these regions on the Sun’s surface, comparing the average temperature of 5700 K in the solar photosphere (Li et al., 2013).
Amateur astronomer Richard Carrington revealed an important aspect of sunspots. As reported by Hudson (2021), Carrington detected from observations made between 1853 and 1861 that the sunspots at different latitudes do not move as a rigid body, but differently as a fluid. This observation paved the way to understand the behavior of spot distributions at different latitudes (Hudson, 2021). In this same scenario, Bell (1962) found an N-S asymmetry in the solar area data during Cycles 8 to 18. Generally speaking, N-S asymmetry is a present phenomenon and alternates according to the level of magnetic activity in each hemisphere as described by Cowling’s Theorem (Cowling, 1933). This behavior has been investigated in terms of several indicators of solar activity, such as the number and area of sunspots, group of sunspots, flares index data, differential rotation, filaments, coronal mass ejection, and photospheric magnetic flux (Carbonell, Oliver, and Ballester, 1993).
In line with this reasoning, Newton and Milsom (1955) studied the N-S asymmetry with the annual values of the sunspot areas from 1874 to 1954. They concluded that the fluctuation in the asymmetry values is not a statistical artifact and that the relative behavior of the two hemispheres is maintained in successive cycles without any indication of change related to the 22-year cycles that refer to the magnetic polarity of the spots. Waldmeier (1957, 1971) investigated the N-S asymmetry between 1955-1969. His works demonstrated that asymmetry is strengthened by a phase difference between the hemispheres that is associated with the eleven-year magnetic cycle. Already Roy (1977) studied N-S asymmetry and areas of large sunspots in the period 1955-1974 and concluded that asymmetry is more evident in patches with a complex magnetic configuration. In addition, Vizoso and Ballester (1989) found that the asymmetry for the northern hemisphere is less evident for extensive spots than that observed in large solar flares, just as the degree of asymmetry does not depend on the area of the spot groups for between 1874 and 1976.
In general, the N-S asymmetry of solar activity has seen mainly investigated by the absolute or normalized difference between the two hemispheres using values of different properties, such as mean sunspot numbers and areas (Zou et al., 2014; Schüssler and Cameron, 2018). Several statistical methods and techniques have been applied to extract information related to the complex behavior of the solar activity cycle, such as multifractal analysis, visibility graphs, and wavelet transform, calling for replacing canonical linear statistical approaches with methods originated in the field of nonlinear dynamics (cf. Carbonell, Oliver, and Ballester, 1993; Donner and Thiel, 2007; Zou et al., 2014; Ravindra, Chowdhury, and Javaraiah, 2021; Xu et al., 2021). However, these methods perform best when the time series obeys a Gaussian-type probability distribution. In this sense, they do not allow an explicit study of long-range correlations found in fat-tailed distributions. A very interesting framework that explains the physical origin of fat tails of probability distributions is grounded on a generalization of Boltzmann-Gibbs entropy also known as Tsallis’ nonextensive statistical mechanics (Tsallis, 1988; de Freitas and De Medeiros, 2013). In this context, we chose the nonextensive approach to study the long-term changes in the asymmetry of dynamical characteristics observed at both solar hemispheres’ time series (Javaraiah, 2022).
In the present paper, we study the behavior of the distribution of sunspot areas from cycles 12 to 24 using the non-extensive statistical mechanics to investigate the N-S asymmetry. As highlighted above, the advantages of this statistical approach can be observed by its robustness to quantify the tail of probability distribution, where the effects of gaussianity deviations occur. These effects are related to rare events that emerge the solar magnetic activity and whose behavior controls the dynamics of sunspots. Thus, the aim of our work is to make a detailed study of N-S asymmetry based on the premise that hemispheric asymmetry is a non-extensive phenomenon and that the entropic index can be a promising parameter to understand the behavior of this asymmetry.
1.2 Structure of the paper
This paper is structured as follows. A detailed description of the nonextensive framework and its properties are shown in Section 2. In Section 3, we describe the sample and how we selected 13 solar cycles, as well as their physical implications for the present analyses. Section 4 brings the main results and discussions. Finally, concluding remarks are presented in the last section.
2 Nonextensive formalism
sec:formalism An interesting way to investigate the problem of hemispheric asymmetry is to understand how the distribution of the solar indicator, such as sunspot number and sunspot area, behave as a function of the magnetic cycle of 11 years. In literature, the distributions used for explaining the complex behavior of this problem are based on a usual (boltzmannian) exponential (cf. de Freitas et al., 2015; de Freitas and Viana, 2020; de Freitas, 2021). Characterizing the complex behavior of the sunspot dynamics, specifically, in the case of the distribution of the sunspot area, is fundamental to perceive the physical origin of the tail of distributions. Such distributions have an entropy at their core. Among several types of out-of-equilibrium Boltzmann-Gibbs (B-G) entropy that can be found in literature, we can mention the entropies of Druyvesteyn (1930, 1934), Rényi (1961), Sharma and Mittal (1975), Abe (1997), Papa (1998), Borges and Roditi (1998), Landsberg and Vedral (1998), Anteneodo and Plastino (1999), Frank and Daffertshofer (1999), Kaniadakis (2002) and, finally, the Tsallis non-extensive entropy.
In Tsallis’ -entropy the classical statistical formulation is not followed, and entropy additivity does not occur. The new entropic approach is given by , where the last term exhibits the interaction between systems and that does not exist in the extensive formalism (Tsallis, 1988, 1995, 1994). In the nonextensive context, entropy is redefined as
| (1) |
where is the entropic index that characterizes generalization, is Boltzmann’s constant, and represents the number of microstates in the system. The extra term denotes the interaction between systems A and B.For and , B-G entropy, defined as , is recovered.
The Tsallis generalized entropy maximization process is responsible for generating the distributions defined as -Gaussians. For this purpose, entropy is written in a continuous form as
| (2) |
where is the dependent variable and denotes the characteristic length of the problem in question.
For optimizing entropy , i.e., maximize if and minimize if , the following constraints are used
| (3) |
that corresponds to normalization, as well as
| (4) |
which corresponds to the variance of . In this way, we obtain, starting from the variational problem using the entropic form defined by eq. \irefg7 plus the links indicated above, Probability Distribution Functions (PDFs) given by
| (5) |
where the normalization constant is obtained for two distinct intervals of ,
| (6) |
and,
| (7) |
where
| (8) |
and
| (9) |
where means the generalized standard deviation as a function of , whereas is the canonical one.
Before proceeding with entropy optimization, let’s take note of the terminology impulse. Impulse is defined as the difference between two neighboring points a time apart. Considering a time series that represents the variability of any parameter , the impulse is given by
| (10) |
If the interest in question are the fluctuations due to the nearest neighbors, i.e., the level of multifractal noise (where we could find a greater randomness of the studied system), we choose (de Freitas, 2021). The -timescale has a unit corresponding to the cadence of the data, that is, if the time series is obtained with data measured day by day, the unit of this parameter is day. The advantage of this procedure is to have the distribution centered at zero. With this, we can also see whether or not there is symmetry between the “hemispheres” conjuring up the distributions.
We understand that the behavior of the -index as a function of is very relevant to study the small and large scale fluctuations present in the time series. However, this analysis is outside the scope of our work, since our main interest is to investigate dynamic differences between the solar hemispheres to the noise level. This issue will be addressed in a future communication.
| Cycle | Start Date | End Date | Duration | ||||||
|---|---|---|---|---|---|---|---|---|---|
| (years) | |||||||||
| 12 | Dez 1878 | Mar 1890 | 11.3 | 212.2 | 304.7 | 2.150.09 | 2.240.04 | 5.741.25 | 10.420.51 |
| 13 | Mar 1890 | Fev 1902 | 11.9 | 271.4 | 331.8 | 2.130.08 | 2.070.11 | 8.482.84 | 10.493.16 |
| 14 | Fev 1902 | Ago 1913 | 11.5 | 253.8 | 340.1 | 2.110.10 | 1.950.10 | 9.093.12 | 6.991.61 |
| 15 | Ago 1913 | Ago 1923 | 10 | 361.6 | 297.4 | 2.320.06 | 2.050.09 | 14.671.08 | 8.561.70 |
| 16 | Ago 1923 | Set 1933 | 10.1 | 384.4 | 322.2 | 2.030.11 | 2.080.10 | 8.622.23 | 7.992.38 |
| 17 | Set 1933 | Fev 1944 | 10.4 | 480.4 | 477 | 2.030.12 | 1.960.11 | 7.031.44 | 4.891.04 |
| 18 | Fev 1944 | Abr 1954 | 10.2 | 608.4 | 575.4 | 2.090.10 | 2.010.10 | 7.742.87 | 6.851.53 |
| 19 | Abr 1954 | Out 1964 | 10.5 | 838.3 | 586.7 | 2.320.07 | 2.190.10 | 10.470.84 | 9.622.86 |
| 20 | Out 1964 | Mar 1976 | 11.7 | 495.4 | 350.8 | 2.280.06 | 2.190.08 | 12.320.86 | 8.390.74 |
| 21 | Mar 1976 | Set 1986 | 10.3 | 607.8 | 629.9 | 2.080.05 | 2.090.06 | 7.740.69 | 8.570.96 |
| 22 | Set 1986 | Aug 1996 | 9.7 | 549.5 | 624.4 | 2.020.04 | 1.980.03 | 7.440.46 | 6.760.37 |
| 23 | Aug 1996 | Dec 2008 | 12.6 | 372.5 | 428.9 | 2.280.07 | 2.000.07 | 7.800.70 | 3.820.37 |
| 24 | Dec 2008 | May 2020 | 11.5 | 297.0 | 313.9 | 2.260.09 | 2.300.10 | 7.340.77 | 8.481.72 |
3 Working sample and asymmetry parameters
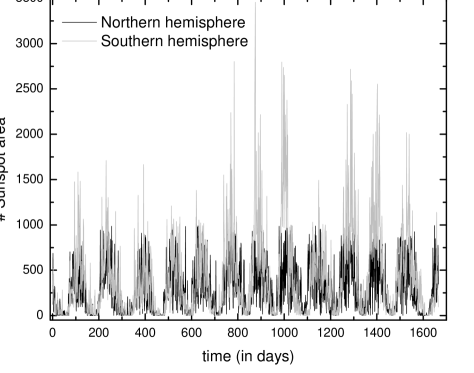
Daily sunspot data from the entire solar disk for each northern and southern hemisphere (NS) were extracted from NASA’s Marshall Space Flight Center (MSFC) and compiled by the Royal Greenwich Observatory (RGO) from 1874 to 2016111The catalog can be downloaded via from the website: https://solarscience.msfc.nasa.gov/greenwch/dailyarea.txt. The data used refers to Cycles 12 to 24. We consider from Cycle 12 onwards simply because the previous cycles had “gaps” and “covers” in the data, thus avoiding any kind of data interpolation process to homogenize with the other cycles (Usoskin and Mursula, 2003). Figure \ireffig0 shows the time series of the sunspot areas for each cycle separated by hemisphere. In Table \ireftable2, we insert the main characteristics of this data as the beginning, finish, and duration of the cycle, and total daily sunspot areas by hemisphere.
For the performance of the statistical analysis proposed in the present work, we used the canonical definition of asymmetry as the following relationship (Das, Ghosh, and Karak, 2022):
| (11) |
where and respectively are averages of solar magnetic indicators (e.g., sunspot areas, rotation rate, etc.) in the northern and southern hemispheres per cycle.
In the present paper, we incorporate a new and unique parameter named -Asymmetry Index (hereafter ) to mathematically measure the N-S hemispheric asymmetry in sunspots areas defined as:
| (12) |
where represents the nonextensive index of northern hemisphere and as that of southern hemisphere. In this way, -index is a measure of the extension of the tail of the distribution, that is, a measure of the deviation from gaussinity. Furthermore, the values of are calculated for each cycle and hemisphere. With this, as we will see in the next section, we will obtain the profile of as a function of the solar cycle.
4 Results and discussions
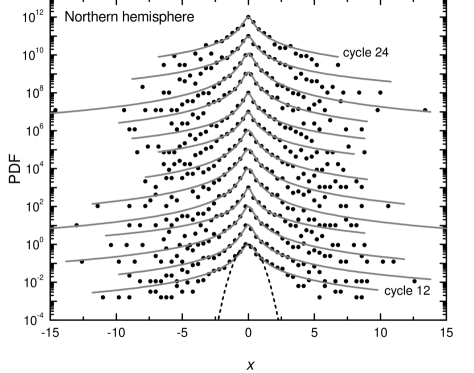
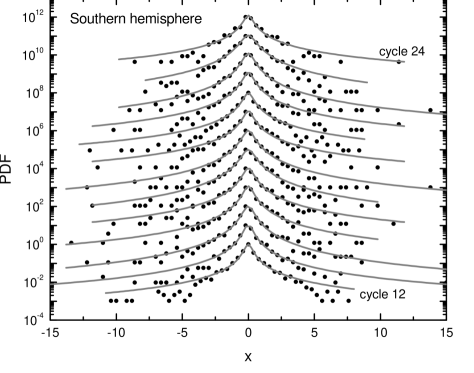
We award in Figures \ireffig1 to \ireffig2 the distributions of the observational data confronting the fit model through the -Gaussians described by the set of equations \irefg12 to \irefg16. The results of -index and the parameter as a function of solar cycle are cited in table \ireftable2. These indexes have seen derived from the empirical distribution functions of daily sunspot areas (black circles) as highlighted in Figs. \ireffig1 and \ireffig2 for northern and southern hemispheres, respectively. The values of and , and their errors at 0.05 confidence limit, were obtained by a non-linear least-squares minimization using the Levenberg-Marquardt (L-M) algorithm (Levenberg, 1944; Marquardt, 1963), and using the -Gaussian with symmetric Tsallis distribution from eq. \irefg12. The measured values of the parameter strongly suggest that the distribution of sunspot area is far from being in agreement with a standard Gaussian (as an example, see the gaussian distribution highlighted at the bottom from Fig. \ireffig1) since the values of differ significantly from unity in all situations (see also Table \ireftable2).
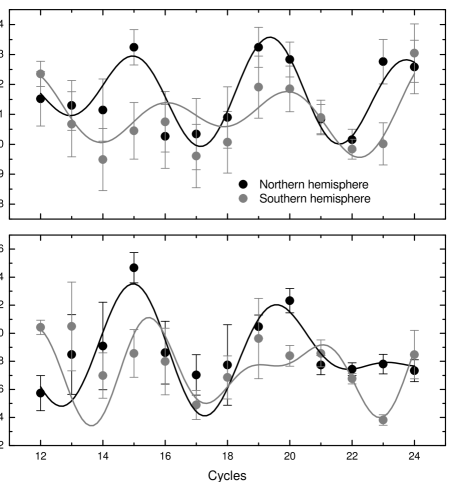
According to Figure \ireffig3 (top panel) the index is dominant over . The same behavior can be verified when referring to the -index as shown in the lower panel of the same figure. In particular, Chowdhury, Choudhary, and Gosain (2013) points out that the asymmetry of cycle 23 and the asymmetry phase of cycle 24 is predominantly dominated by the northern hemisphere. Vizoso and Ballester (1990) mention that during the period from 1957 to 1970 the northern hemisphere is clearly dominant, but after 1970 this behavior is reversed. Our work extends this analysis by comparing the periods of rise and fall of the hemispheres considering the last 13 solar cycles. It is worth noting that the curves in Figure \ireffig3 denote a possible phase transition that may be associated with the process of inversion of the solar magnetic dipole that occurs during the passage of each cycle.
The curves highlighted in Fig. \ireffig3 were obtained from a semi-sinusoidal fit also using the L-M algorithm. This adjustment was then used to obtain a harmonic best fit with the cyclic series of indexes and as follows:
| (13) |
where and are amplitudes, and are periods, and are phase shifts and is the background level. The best-fitting parameters for the cycle–() relationship using equation \irefss are depicted in Table \ireftable1.
| Parameters | ||||
|---|---|---|---|---|
| a | 0.070.05 | -1.460.08 | 2.830.55 | 1.720.52 |
| b | 0.120.09 | 1.590.10 | 2.040.79 | 2.320.57 |
| -4.800.6 | 9.310.03 | -2.810.20 | 14.500.42 | |
| -5.390.4 | 0.690.03 | 3.140.90 | 6.800.45 | |
| 2.850.74 | 2.530.41 | 2.720.3 | 1.580.11 | |
| 2.060.24 | 2.490.50 | 1.990.14 | 2.240.07 | |
| 2.170.02 | 2.110.02 | 8.710.38 | 7.390.39 | |
| 0.82 | 0.76 | 0.75 | 0.86 |
We can explain the semi-sinusoidal variability of the -index based on the area occupied by sunspots. In this perspective, the higher values denote a wide spectrum of variety about the size of the area, causing an extension in the tail of the distribution and, therefore, raising the value of the -index. On the other hand, a smaller diversity in the spots’ size reduces the tail’s width, generating the lowest values of this index. Consequently, the periodic cycle is a manifestation of the complex dynamics that govern the life of the spots and the drop in photometric magnitude (directly proportional to the occupied area) caused by them. This result is corroborated by the parameters which follows the same trend as the index . It is important to emphasize that during the 13 cycles, the index does not approach unity () in both hemispheres.
In both hemispheres, we find that the periods and are approximately twice the duration of the sunspot cycle (see also Table \ireftable1). These periods are very close to the long-term magnetic field variation known as the 22-year Hale cycle. This behavior can be verified for both the and indexes (Kotov, 2015) (see Fig. \ireffig3). It is noteworthy that this cycle cannot be explained by the canonical dynamo theory and its origin is associated with cosmic ray flux (Thomas, Owens, and Lockwood, 2014). In this way, the physical implications for the cyclical behavior of the entropic index can be linked to modulation by the heliospheric magnetic field and, consequently, it is also associated with the polarity-dependent effect of the solar magnetic field (Kotov, 2015; Thomas, Owens, and Lockwood, 2014). This issue deserves special attention and we will dedicate efforts in a forthcoming communication.
On this wise, it is possible to highlight the cyclical trend of each index and, therefore, the asymmetric inversion in a given cycle. Vizoso and Ballester (1990) mention that the asymmetry inversion is found when the Sun’s magnetic dipole inverts. This implication reinforces the idea that the index has a close correlation with the mechanisms that control the long-term variation of the solar dynamo. In other words, the preference of one hemisphere over the other suggests that the process of creating spots in the solar photosphere is notoriously non-ergodic following the rules of out-of-equilibrium statistical mechanics.
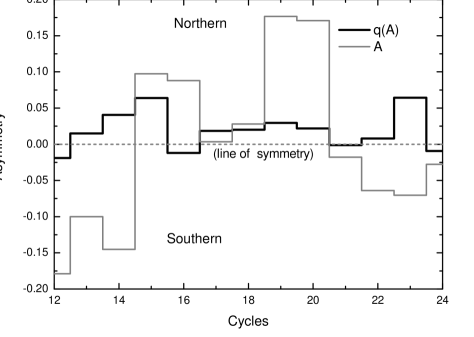
As reported by Chowdhury, Choudhary, and Gosain (2013), on small timescales of the order of a few months and a year or two, that is, for periodic fluctuations controlled by differential rotation and the meridional circulation, solar activity is generated independently in the two hemispheres. However, our results indicate that for long-term periodic fluctuations, such as the 11-year cycle, the conclusion of Chowdhury, Choudhary, and Gosain (2013) is not valid, i.e., the hemispheres appear to work together and not independently. A result in favor of this statement is given by the behavior of the index . According to Figure \ireffig4, the asymmetry also varies approximately cyclically, which may be a strong indication that the conclusion of Chowdhury, Choudhary, and Gosain (2013) is valid only for regimes that go from the period of solar rotation to the seasonal cycle of 1 year.
Also according to Figure \ireffig4, the asymmetry indexes and are more discrepant between cycles 12 to 14 and 22 to 24 because the preference between cycles is reversed. In the other cycles, the correlation trend follows, but with different amplitudes, mainly in cycles 19 and 20. In general terms, the difference can be explained by the fact that the asymmetry values take into account the tail of the distribution, while the index takes only the average values of the sunspot area. This means that a complete view of the canonical index would depend on a more careful evaluation of the behavior of the standard deviation of the time series in each cycle. This requirement can be neglected in the case of because it already provides information about how far the distribution is from the gaussian one. In this way, the index brings us a new approach to the solar hemispheric asymmetry, indicating that the cyclicity does not depend only on the maximum and minimum values, but, above all, on the deviation of the Gaussianity that measures the presence of temporal autocorrelations (or memory effects) in the dynamics of the solar cycle.
In summary, our results reveal that a non-extensive interpretation for this context is necessary. Overall, the strength of the present study lies in the fact that the behavior of the asymmetric index places the northern hemisphere as the dominant one in most solar cycles.
5 Concluding remarks
Our work aimed to investigate how the nonextensive formalism can explain the N-S hemispheric asymmetry, especially why the asymmetry phase is mostly dominated by the northern hemisphere. To this end, we used a sample of 13 solar cycles divided by hemisphere extracted from the MSFC survey.
The main conclusions drawn from this study are presented below, in the form of topics:
-
•
The main conclusion obtained from the present dissertation refers to the entropic parameter as an efficient measure to diagnose long-term variations of the solar dynamo;
-
•
The and parameters vary similarly. Both indicate that the northern hemisphere is dominant over the southern hemisphere;
-
•
As indicated by Fig. \ireffig3, the cyclic variation of -asymmetry may be associated with the process of inversion of the solar magnetic dipole that occurs during the 22-year Hale cycle;
-
•
The preference of one hemisphere over the other shows that the process of creating spots in the solar photosphere is non-ergodic;
-
•
Our results indicate that the conclusion mentioned by Chowdhury, Choudhary, and Gosain (2013) for short-term periodic variations is not valid for long-term ones;
-
•
All the results found in the present study correspond to fluctuations between the nearest neighbors. For other scales, for example, of the order of the solar rotation period (2334 days) or the lifetime of the flares (156 days), the behavior of the index for the present problem may be different. However, our results confirm that at the multifractal noise level ( day) there are strongly non-extensive processes. A deeper analysis at different scales is necessary to verify if the behavior of is a function of the adopted scale and, even more, if there is a scale in which the regime drops to gaussianity as predicted by the Central Limit Theorem.
-
•
Lastly, our study opens a new way to investigate the Sun from the perspective of out-of-equilibrium statistical models.
In addition, it is worth mentioning that the entropic index can also be used to investigate other possible sources for the hemispheric asymmetry. In this sense, a deeper analysis must be done on solar indicators such as magnetic field and Total Solar Irradiance (TSI) from Virgo/SoHO data and X-ray flux. This issue will be addressed in a forthcoming communication.
Acknowledgements
DBdeF acknowledges financial support
from the Brazilian agency
CNPq-PQ2 (Grant No. 305566/2021-0). Research activities of STELLAR TEAM of Federal University of Ceará are supported by continuous grants from the Brazilian agency CNPq. This paper includes data collected by the NASA’s Marshall Space Flight Center (MSFC). Supporting for this database is provided by the NASA Science Mission directorate. Funding for this database terminated in FY2005 (last update 2017/03/23). All data presented in this paper were obtained from the Royal Observatory, Greenwich - USAF/NOAA Sunspot Data. Data of our analyses presented in this paper will be shared on reasonable request to the corresponding author.
References
- Abe (1997) Abe, S.: 1997, A note on the q-deformation-theoretic aspect of the generalized entropies in nonextensive physics. Phys. Lett. A 224, 326. DOI.
- Anteneodo and Plastino (1999) Anteneodo, C., Plastino, A.R.: 1999, Maximum entropy approach to stretched exponential probability distributions. J. of Phys. A: Math. and Gen. 32, 1089. DOI.
- Badalyan and Obridko (2017) Badalyan, O.G., Obridko, V.N.: 2017, North-south asymmetry of solar activity as a superposition of two realizations - the sign and absolute value. Astron. Astrophys. 603, A109. DOI. ADS.
- Bell (1962) Bell, B.: 1962, A Long-Term North-South Asymmetry in the Location of Solar Sources of Great Geomagnetic Storms. Smithsonian Contr. to Astrophys. 5, 187. ADS.
- Borges and Roditi (1998) Borges, E.P., Roditi, I.: 1998, A family of nonextensive entropies. Phys. Lett. A 246, 399. DOI.
- Carbonell, Oliver, and Ballester (1993) Carbonell, M., Oliver, R., Ballester, J.L.: 1993, On the asymmetry of solar activity. Astron. Astrophys. 274, 497. ADS.
- Chowdhury, Choudhary, and Gosain (2013) Chowdhury, P., Choudhary, D.P., Gosain, S.: 2013, A study of the hemispheric asymmetry of sunspot area during solar cycles 23 and 24. Astrophys. J. 768, 188. DOI.
- Clark and Stephenson (1978) Clark, D.H., Stephenson, F.R.: 1978, An Interpretation of the Pre-Telescopic Sunspot Records from the Orient. Quart. J. R. Astron. Soc. 19, 387. ADS.
- Cowling (1933) Cowling, T.G.: 1933, The magnetic field of sunspots. Mon. Not. Roy. Astron. Soc. 94, 39. DOI. ADS.
- Das, Ghosh, and Karak (2022) Das, R., Ghosh, A., Karak, B.B.: 2022, Is the hemispheric asymmetry of sunspot cycle caused by an irregular process with long-term memory? Monthly Notices of the Royal Astronomical Society 511, 472. DOI. https://doi.org/10.1093/mnras/stac035.
- de Freitas (2021) de Freitas, D.B.: 2021, Stellar age dependence of the nonextensive magnetic braking index: A test for the open cluster Per. Europhys. Lett. 135, 19001. DOI.
- de Freitas and De Medeiros (2013) de Freitas, D.B., De Medeiros, J.R.: 2013, A non-extensive approach to the stellar rotational evolution – I. F- and G-type stars. Mon. Not. Roy. Astron. Soc. 433, 1789. DOI.
- de Freitas and Viana (2020) de Freitas, D.B., Viana, C.A.P.: 2020, Non-extensive processes associated with heating of the Galactic disc. Europhys. Lett. 131, 69002. DOI.
- de Freitas et al. (2015) de Freitas, D.B., Cavalcante, F.J., Soares, B.B., Silva, J.R.P.: 2015, A nonextensive view of the stellar braking indices. Europhys. Lett. 111, 39003. DOI.
- Deng et al. (2016) Deng, L.H., Xiang, Y.Y., Qu, Z.N., An, J.M.: 2016, Systematic regularity of hemispheric sunspot areas over the past 140 years. AJ 151, 70. DOI.
- Donner and Thiel (2007) Donner, R., Thiel, M.: 2007, Scale-resolved phase coherence analysis of hemispheric sunspot activity: a new look at the north-south asymmetry. Astron. Astrophys. 475, L33. DOI.
- Druyvesteyn (1930) Druyvesteyn, M.: 1930, Influence of energy loss by elastic collisions in the theory of electron diffusion. Physica 10, 61.
- Druyvesteyn (1934) Druyvesteyn, v.M.J.: 1934, Bemerkungen zu zwei früheren arbeiten über die elektronendiffusion. Physica 1, 1003. DOI.
- El-Borie, Abdel-halim, and El-Monier (2016) El-Borie, M.A., Abdel-halim, A.A., El-Monier, S.Y.: 2016, North-South asymmetry of the solar parameters during the different solar cycles. J. of Taibah Univ. for Sci. 10, 311. The First International Conference on Radiation Physics and Its Applications. DOI.
- El-Borie et al. (2021) El-Borie, M.A., El-Taher, A.M., Thabet, A.A., Ibrahim, S.F., Bishara, A.A.: 2021, North-South asymmetry of some solar parameters: A study based on the dominance of hemispheric sunspot activity during the solar cycles 18–24. Chinese J. of Phys. 72, 1. DOI.
- Forgács-Dajka, Dobos, and Ballai (2021) Forgács-Dajka, E., Dobos, L., Ballai, I.: 2021, Time-dependent properties of sunspot groups - I. Lifetime and asymmetric evolution. Astron. Astrophys. 653, A50. DOI.
- Frank and Daffertshofer (1999) Frank, T.D., Daffertshofer, A.: 1999, Nonlinear Fokker–Planck equations whose stationary solutions make entropy-like functionals stationary. Phys. A: Stat. Mech. and its Applications 272, 497. DOI.
- Hiremath (2006) Hiremath, K.M.: 2006, The solar cycle as a forced and damped harmonic oscillator: long-term variations of the amplitudes, frequencies and phases. Astron. Astrophys. 452, 591. DOI. ADS.
- Hudson (2021) Hudson, H.S.: 2021, Carrington Events. Annu. Rev. of Astron. and Astrophys. 59, 445. DOI.
- Javaraiah (2022) Javaraiah, J.: 2022, Long-Term Variations in Solar Activity: Predictions for Amplitude and North–South Asymmetry of Solar Cycle 25. Solar Phys. 297.
- Kaniadakis (2002) Kaniadakis, G.: 2002, Statistical mechanics in the context of special relativity. Phys. Rev. E 66, 056125. DOI.
- Kotov (2015) Kotov, V.A.: 2015, On the origin of the 22years solar cycle. Advances in Space Research 55, 979. Cosmic Magnetic Fields. DOI.
- Landsberg and Vedral (1998) Landsberg, P.T., Vedral, V.: 1998, Distributions and channel capacities in generalized statistical mechanics. Phys. Lett. A 247, 211. DOI.
- Levenberg (1944) Levenberg, K.: 1944, A method for the solution of certain non-linear problems in least squares. Quart. Appl. Math. 2, 164. DOI.
- Li et al. (2013) Li, K.J., Shi, X.J., Xie, J.L., Gao, P.X., Liang, H.F., Zhan, L.S., Feng, W.: 2013, Solar-cycle-related variation of solar differential rotation. Mon. Not. Roy. Astron. Soc. 433, 521. DOI.
- Marquardt (1963) Marquardt, D.W.: 1963, An Algorithm for Least-Squares Estimation of Nonlinear Parameters. J. of the Soc. for Industrial and Applied Math. 11, 431. http://www.jstor.org/stable/2098941.
- Newton and Milsom (1955) Newton, H.W., Milsom, A.S.: 1955, Note on the Observed Differences in Spottedness of the Sun’s Northern and Southern Hemispheres. Mon. Not. Roy. Astron. Soc. 115, 398. DOI.
- Norton, Charbonneau, and Passos (2014) Norton, A.A., Charbonneau, P., Passos, D.: 2014, Hemispheric Coupling: Comparing Dynamo Simulations and Observations. Space Sci. Rev. 186, 251. DOI. ADS.
- Papa (1998) Papa, A.R.R.: 1998, On one-parameter-dependent generalizations of Boltzmann-Gibbs statistical mechanics. J. of Phys. A: Math. and Gen. 31, 5271. DOI. https://doi.org/10.1088/0305-4470/31/23/009.
- Ravindra, Chowdhury, and Javaraiah (2021) Ravindra, B., Chowdhury, P., Javaraiah, J.: 2021, Solar-Cycle Characteristics in Kodaikanal Sunspot Area: North–South Asymmetry, Phase Distribution and Gnevyshev Gap. Solar Phys. 296.
- Roy (1977) Roy, J.-R.: 1977, The north-south distribution of major solar flare events, sunspot magnetic classes and sunspot areas (1955–1974). Solar Phys. 52, 53. DOI.
- Rényi (1961) Rényi, A.: 1961, On measures of entropy and information. In: Neyman, J. (ed.) 4th Berkeley Symposium on Mathematics, Statistics and Probability 42, University of California Press, Berkeley, CA, USA, 547.
- Schüssler and Cameron (2018) Schüssler, M., Cameron, R.H.: 2018, Origin of the hemispheric asymmetry of solar activity. Astron. Astrophys. 618, A89. DOI.
- Schwabe (1844) Schwabe, H.: 1844, Sonnenbeobachtungen im Jahre 1843. Von Herrn Hofrath Schwabe in Dessau. Astron. Nachrichten 21, 233. DOI. ADS.
- Sharma and Mittal (1975) Sharma, B.D., Mittal, D.P.: 1975, New nonadditive measures of entropy for discrete probability distributions. J. Math. Sci. 10, 28.
- Thomas, Owens, and Lockwood (2014) Thomas, S.R., Owens, M.J., Lockwood, M.: 2014, The 22-Year Hale Cycle in Cosmic Ray Flux: Evidence for Direct Heliospheric Modulation. Solar Phys 289, 407–421. DOI.
- Tsallis (1988) Tsallis, C.: 1988, Possible generalization of Boltzmann-Gibbs statistics. J. of Stat. Phys. 52, 479. DOI. ADS.
- Tsallis (1994) Tsallis, C.: 1994, What are the Numbers that Experiments Provide? Quim. Nova 17, 468.
- Tsallis (1995) Tsallis, C.: 1995, Some comments on Boltzmann-Gibbs statistical mechanics. Chaos, Solitons & Fractals 6, 539. Complex Systems in Computational Physics. DOI.
- Usoskin and Mursula (2003) Usoskin, I.G., Mursula, K.: 2003, Long-Term Solar Cycle Evolution: Review of Recent Developments. Solar Phys. 218, 319. DOI. ADS.
- Vizoso and Ballester (1989) Vizoso, G., Ballester, J.L.: 1989, Periodicities in the North-South Asymmetry of Solar Activity. Solar Phys. 119, 411. DOI. ADS.
- Vizoso and Ballester (1990) Vizoso, G., Ballester, J.L.: 1990, The north-south asymmetry of sunspots. Astron. Astrophys. 229, 540. ADS.
- Waldmeier (1957) Waldmeier, M.: 1957, Der lange Sonnenzyklus. Mit 3 Textabbildungen. Z. für Astrophys. 43, 149. ADS.
- Waldmeier (1971) Waldmeier, M.: 1971, The asymmetry of solar activity in the years 1959 1969. Solar Phys. 20, 332. DOI. ADS.
- Wittmann and Xu (1987) Wittmann, A.D., Xu, Z.T.: 1987, A catalogue of sunspot observations from 165 BC to AD 1684. Astron. Astrophys. Suppl. 70, 83. ADS.
- Xu et al. (2021) Xu, H., Fei, Y., Li, C., Liang, J., Tian, X., Wan, Z.: 2021, The North-South Asymmetry of Sunspot Relative Numbers Based on Complex Network Technique. Symmetry 13. DOI.
- Zou et al. (2014) Zou, Y., Donner, R.V., Marwan, N., Small, M., Kurths, J.: 2014, Long-term changes in the north-south asymmetry of solar activity: a nonlinear dynamics characterization using visibility graphs. Nonlinear Proc. in Geophys. 21, 1113. DOI. ADS.