Interpreting ALMA non-detections of JWST super-early galaxies
Abstract
Recent attempts to detect [OIII] 88m emission from super-early () galaxy candidates observed by JWST have been unsuccessful. By using zoom-in simulations, we show that these galaxies are faint, and mostly fall below the local metal-poor relation as a result of their low ionization parameter, . Such low values are found in galaxies that are in an early assembly stage, and whose stars are still embedded in high-density natal clouds. However, the most luminous galaxy in our sample (, ) could be detected by ALMA in only hrs.
1 Introduction
Early observations by the James Webb Space Telescope (JWST) have discovered several bright ( at ) galaxy candidates at unprecedentedly high redshifts (: Santini et al., 2022; Adams et al., 2022; Donnan et al., 2022; Naidu et al., 2022; Finkelstein et al., 2022; Castellano et al., 2022; Atek et al., 2022; Whitler et al., 2022; Harikane et al., 2022a; Furtak et al., 2022; Yan et al., 2022; Topping et al., 2022; Rodighiero et al., 2022). If confirmed, the large abundance of these super-early systems is a challenge for galaxy formation models (Ferrara et al., 2022; Finkelstein et al., 2022; Mason et al., 2022; Boylan-Kolchin, 2022).
So far, these galaxies have been identified photometrically. Spectroscopic follow-ups are necessary to confirm their detection. Such a task becomes tricky at early cosmic times because the most common emission lines used at lower redshifts shift out the observable bands or (Ly) are severely suppressed by resonant scattering with intergalactic H at . Detecting non-resonant emission lines (e.g. H) is the alternative strategy adopted by JWST NIRSpec observations.
While waiting for such data, attempts have been made to confirm the detection of galaxies by using the Atacama Large sub-/Millimeter Array (ALMA) to search for fine-structure far-infrared (FIR) cooling lines, such as [O ] m and [C ] (Bakx et al., 2022; Popping, 2022; Kaasinen et al., 2022; Yoon et al., 2022; Fujimoto et al., 2022). However, these experiments have been unsuccessful so far.
Among these galaxy candidates, GHZ2 has been independently detected by several groups (Castellano et al., 2022; Naidu et al., 2022; Donnan et al., 2022; Harikane et al., 2022a) which have reported a photometric redshift . Using re-calibrated JWST fluxes Bakx et al. (2022) have constrained the star formation rate of GZH2 in the range and stellar mass . Bakx et al. (2022); Popping (2022) used ALMA Band 6 Director’s Discretionary Time (DDT) program data to search for [O ] 88m line emission. Their analysis has only provided a upper limit of (Bakx et al., 2022) for the integrated [O ] line luminosity.
Another case is GHZ1, a galaxy candidate from the JWST ERS program, GLASS-JWST (Treu et al., 2022) with a photometric redshift , , and (Santini et al., 2022). The ALMA search for [O ] m and dust continuum emission from GHZ1 was unsuccessful, albeit a marginal spectral feature was reported within of the JWST position of GHZ1 (Yoon et al., 2022). The reported upper-limit of [O ] luminosity is .
For a third candidate (HD1) a tentative was reported (Harikane et al., 2022b). To confirm this detection, ALMA Band 6 (Band 4) observations were designed to target [O ] m ([C ] 158m) emission (Harikane et al., 2022b; Kaasinen et al., 2022). No clear detection was found in either of the two BANDS. The upper limit for the [O ] m and [C ] 158m emission lines are and , respectively (Kaasinen et al., 2022).
The last one is S5-z17-1 identified in JWST ERO data of Stephan’s Quintet (Pontoppidan et al., 2022), which has been followed-up by ALMA Band 7 (Fujimoto et al., 2022), resulting in line detection at 338.726 GHz, possibly corresponding to [O ] at . For this galaxy, .
These non-detections for sources discovered by JWST imply that either these galaxies are at lower redshifts (), or they are too faint to be detected with the sensitivity of the above emission line experiments (Bakx et al., 2022; Kaasinen et al., 2022).
Thus, understanding the physical nature of the possible redshift evolution of the relation is of utmost importance in these early stages of interpretation of JWST data. With this question in mind, here we analyse the [O ] m emission line from simulated galaxies.
2 Simulated super-early galaxies
serra is a suite of zoom-in simulations that is tailored for EoR galaxies (; Pallottini et al. 2022). In each radiation hydrodynamic simulation (Teyssier, 2002; Rosdahl et al., 2013), the comoving volume is and contains galaxies, whose ISM is resolved on scales of ( at ), i.e., the typical mass/size of molecular clouds (e.g. Federrath & Klessen, 2013).
The non-equilibrium chemical network used in serra includes , , , , , , , , , and (Grassi et al., 2014; Pallottini et al., 2017a). Metals are produced by stars (Pallottini et al., 2017b), with solar relative abundances (Asplund et al., 2009). Line luminosities for each gas cell are computed in post-processing by using the spectral synthesis code cloudy (Ferland et al., 2017), accounting for the turbulent and clumpy structure of the ISM (Vallini et al., 2017, 2018), computed self-consistently from the simulation (Pallottini et al., 2019). Given a field of view and a line of sight direction, the simulated galaxies can be mapped into 3-dimensional synthetic hyperspectral data cubes (Kohandel et al., 2020), that can be directly compared with observations (Zanella et al., 2021; Rizzo et al., 2022).
In serra, we have 366 galaxies at with . Here, we extract a sub-sample with , matching the values measured for super-early JWST candidates; the final sample includes 42 galaxies. These are found in dark matter halos of mass , and are classified as starburst based on their position on the plane111The burstiness parameter is defined in eq. 39 of Ferrara et al. (2019). with (Pallottini et al., 2019).
3 [OIII] emission
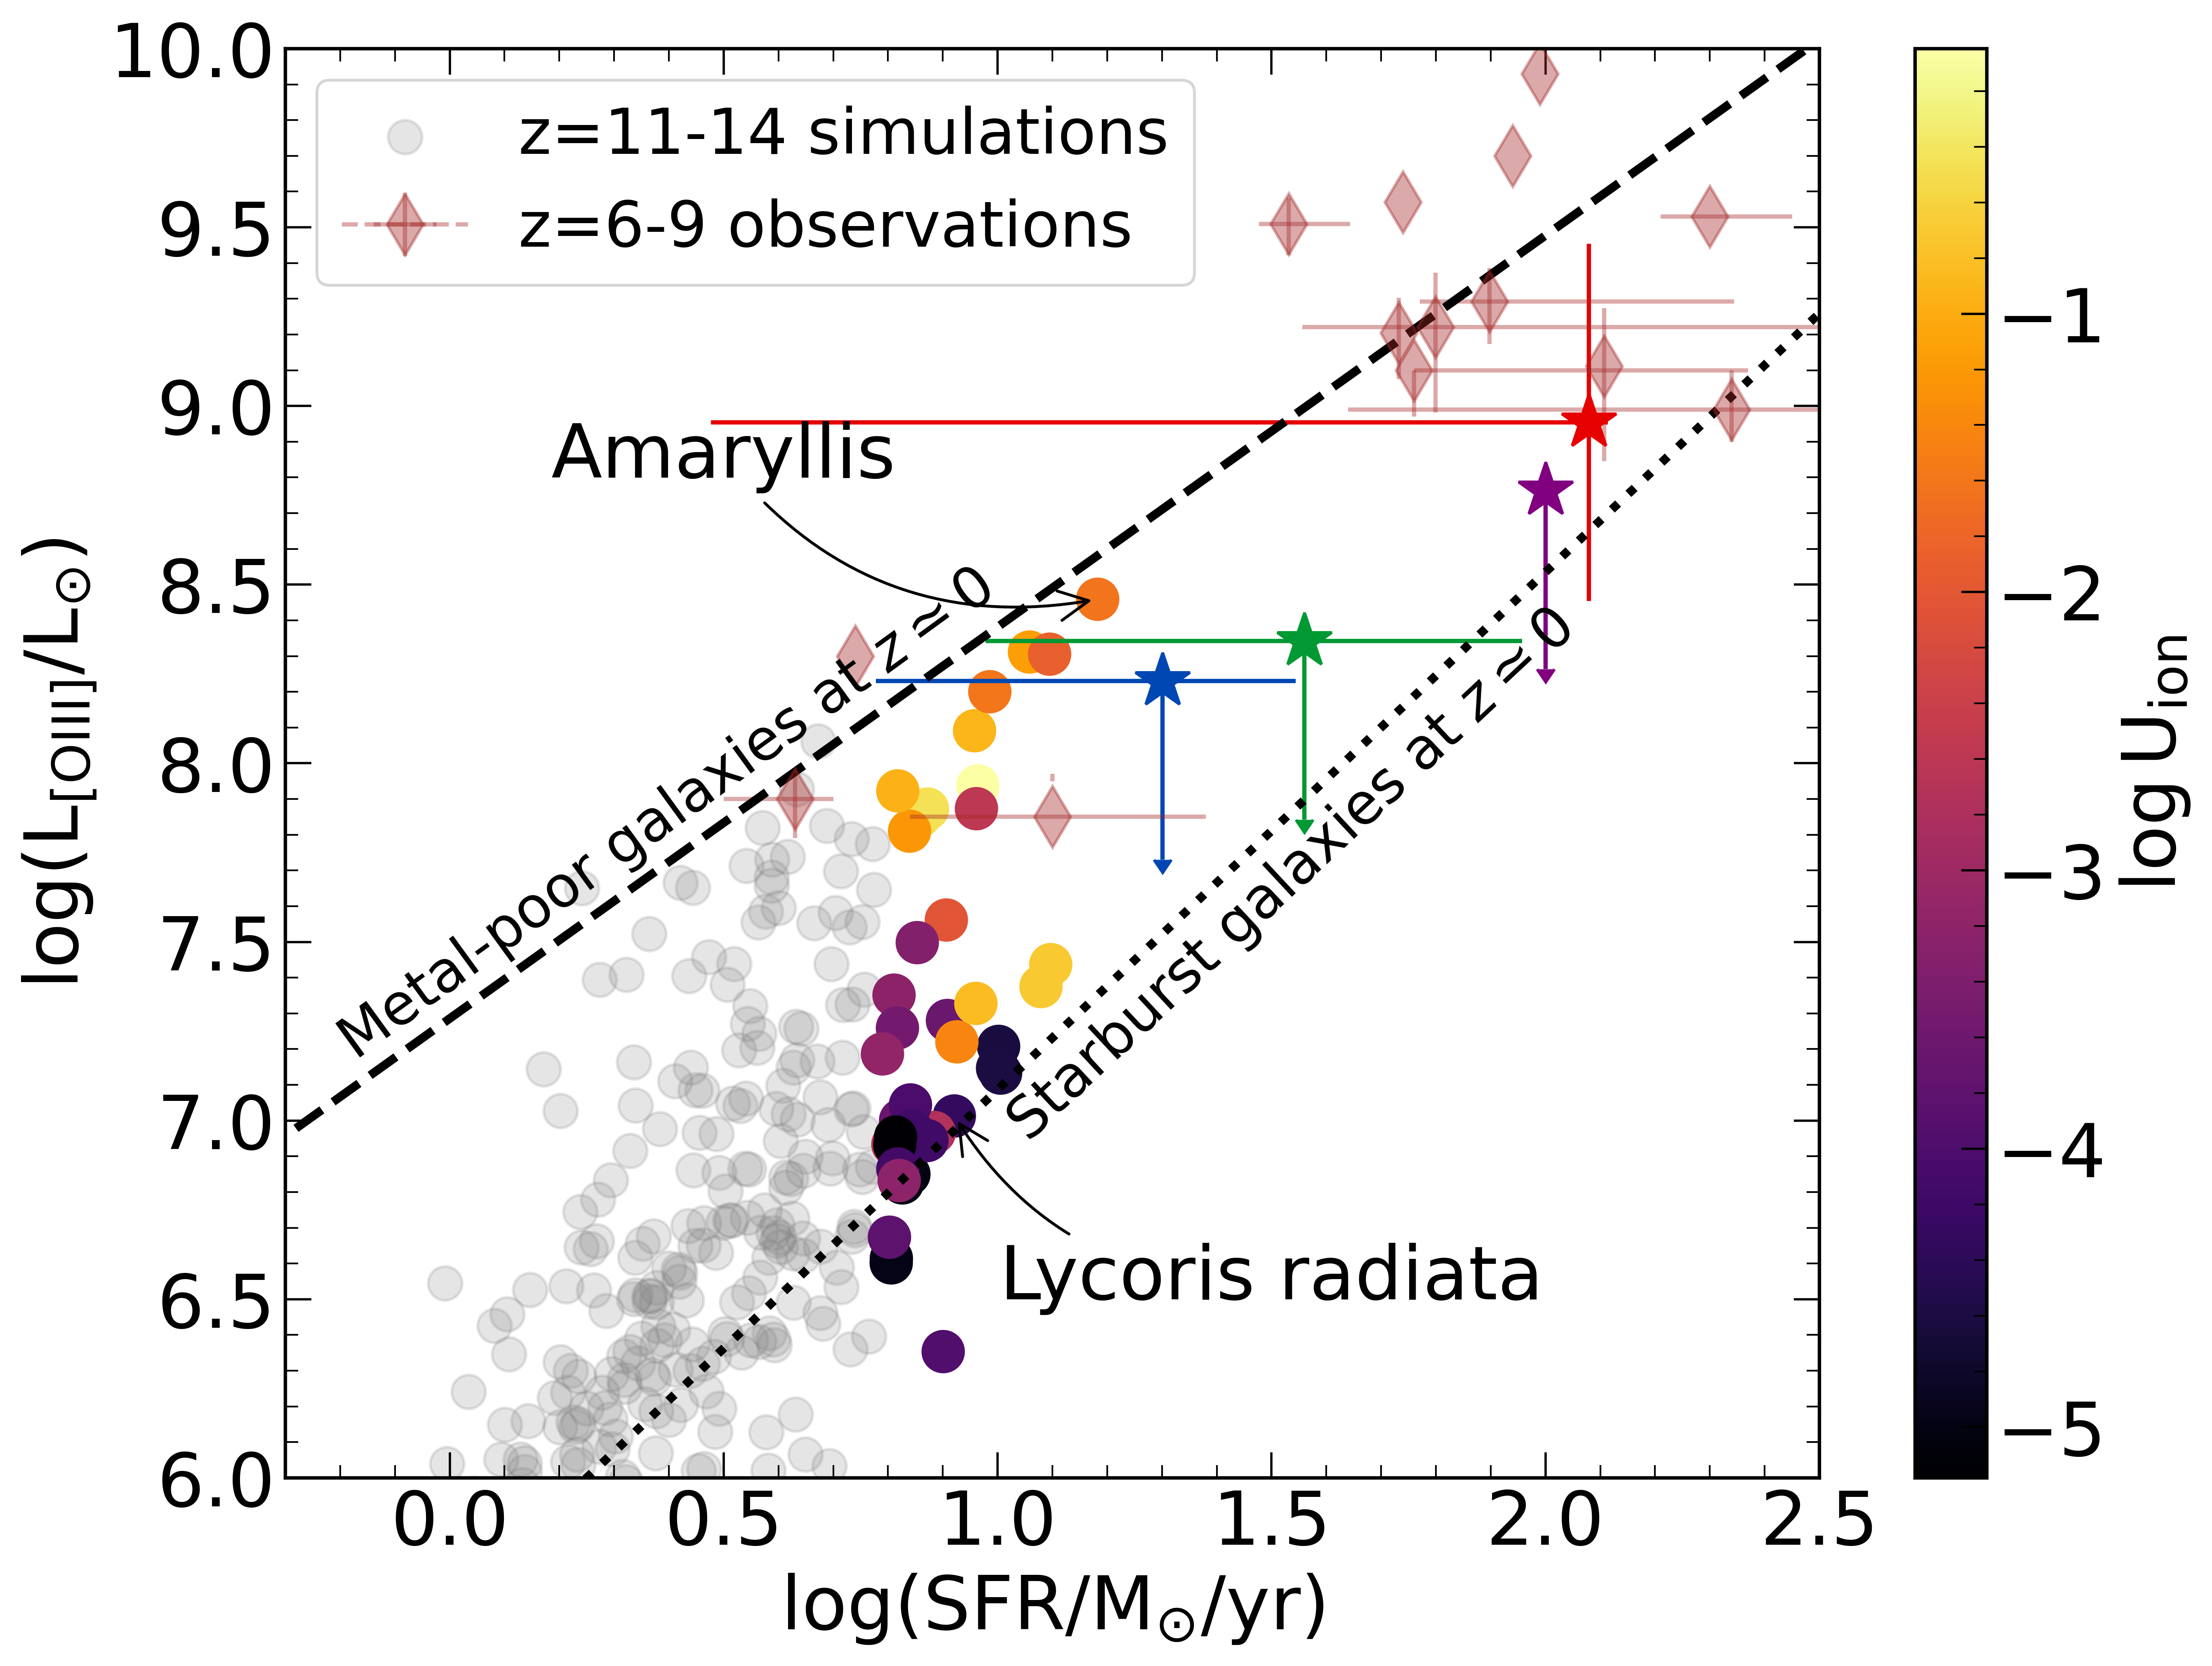
Fig. 1 shows the position of serra galaxies at on the plane, along with the super-early JWST observed galaxies: GHZ2 (Bakx et al., 2022), GHZ1 (Yoon et al., 2022), HD1 (Kaasinen et al., 2022), and S5-z17-1222Following Fujimoto et al. (2022), assuming that the emission feature is confirmed to be [O ] line at , it can be converted to [O ] by assuming a conversion factor of 5. (Fujimoto et al., 2022). For comparison, we show galaxies from the literature (Harikane et al., 2020; Witstok et al., 2022), as well as the empirical relation for local metal-poor and starburst galaxies (De Looze et al., 2014).
serra galaxies generally fall between these two local populations, i.e., they are fainter than expected from the metal-poor relation. Moreover, although these galaxies have been selected to be in the relatively narrow SFR range , their spans more than two orders of magnitude (). As a result, the local relation is effectively blurred as we move to the highest redshifts. This trend is also confirmed by the serra galaxies outside the JWST candidates SFR range (grey points) which are significantly fainter than expected from the local metal-poor relation.
We note that the predicted luminosity of 3 serra galaxies is above the GHZ2 upper limit; hence it could have been detected. However, the detection probability critically depends on the width of the line. The FWHM of the [O ] line (face-on view333Face-on view corresponds to the narrowest emission line width (Kohandel et al., 2019); thus, the estimated integration time below should be regarded as a lower limit.) is in the range with a mean of . If we consider the most luminous galaxy in our sample (, FWHM) located at , the total integration time required to detect it with ALMA at S/N over the FWHM is hrs on-source, which is slightly longer than the integration times ( hrs/tuning) of all ALMA DDT programs.
4 Interpretation
Based on the evidence that [O ] bright galaxies follow local metal-poor relation (Harikane et al., 2020; Witstok et al., 2022, see points in Fig. 1), 4 different ALMA DDT experiments (Bakx et al., 2022; Treu et al., 2022; Kaasinen et al., 2022; Fujimoto et al., 2022) have been designed accordingly to detect JWST candidates in [O ] emission. However, all failed to detect the targeted sources at the expected luminosity, providing only upper limits.
4.1 The role of the ionization parameter
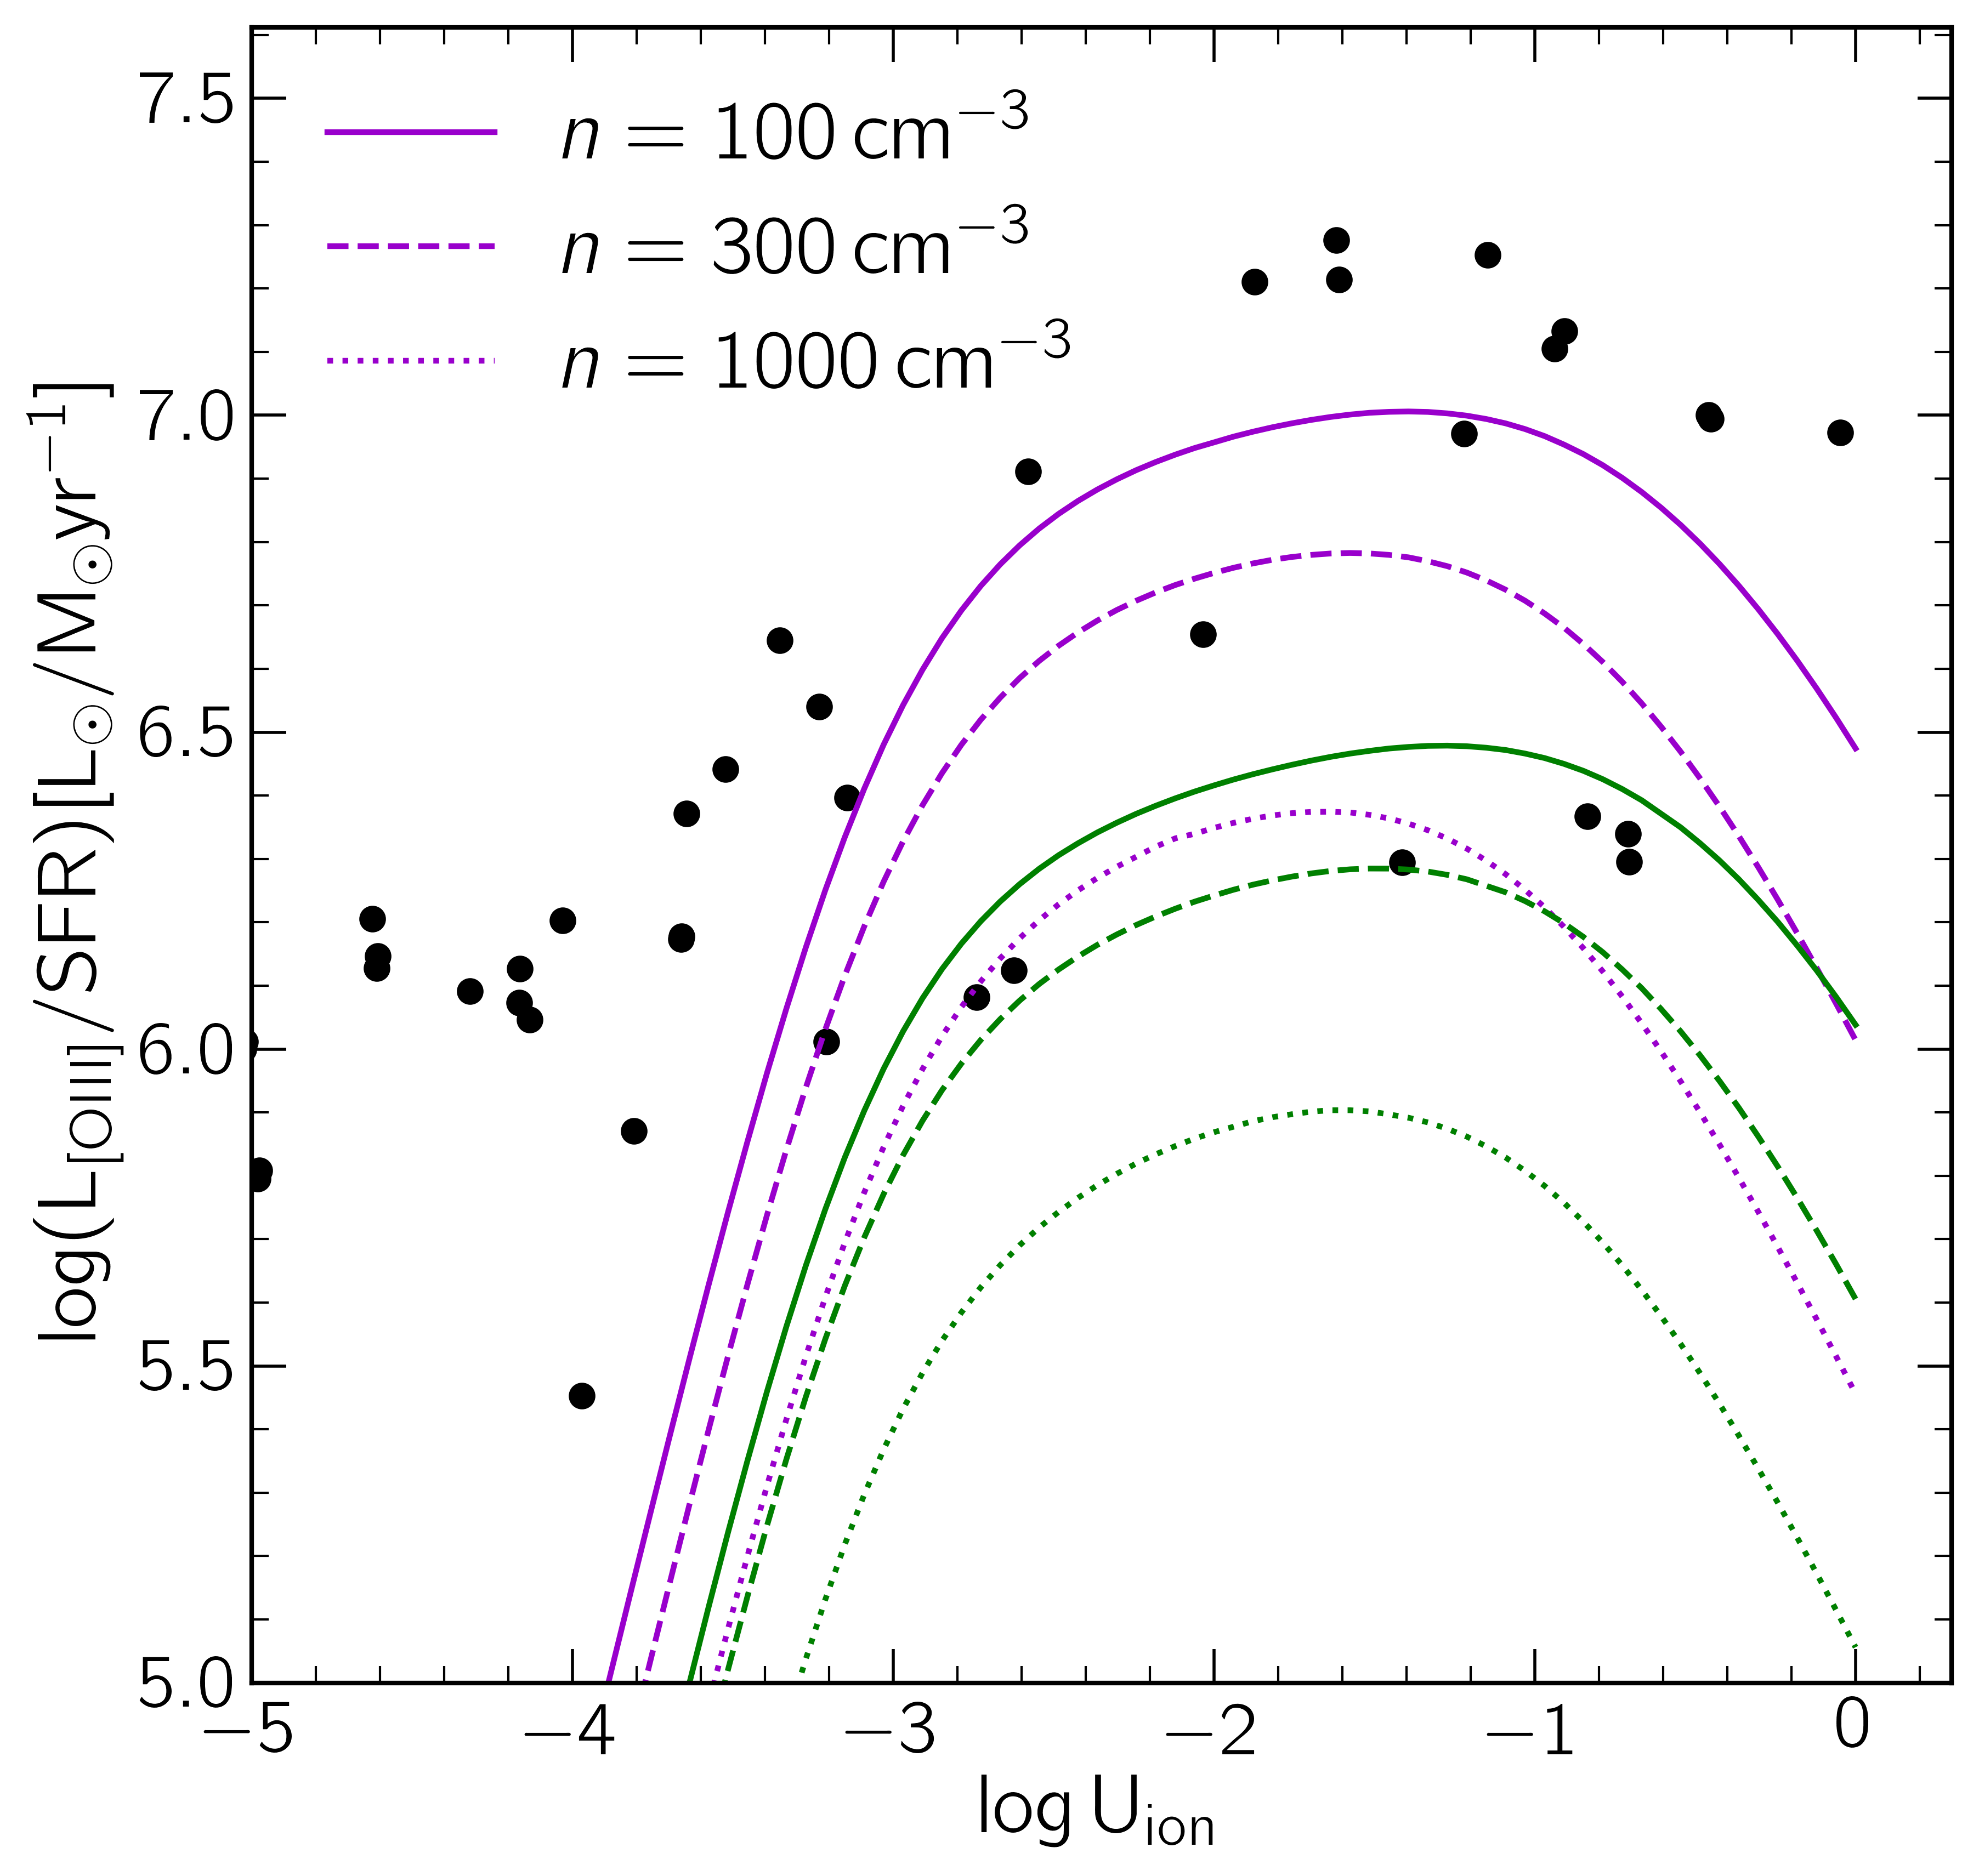
The first step to explain the unexpectedly low [O ] luminosity of super-early galaxies is to consider single-zone cloudy (Ferland et al., 2017) photoionisation models. Similarly to Harikane et al. (2020), we assume a plane-parallel gas slab with initial gas density , metallicity , and illuminated by a radiation field with ionisation parameter444, where is the density of eV photons. . The slab is set in pressure equilibrium (); the computation is stopped at a depth . The resulting ratio555The SFR is obtained from the emerging H luminosity using the conversion factor in Kennicutt (1998, eq. 2). is plotted as a function of in Fig. 2 for representative models with and .
cloudy models predict that weak [O ] emission can be produced either by (i) low , (ii) high , or (iii) low . All these quantities have an impact on [O ] emission, but while and show relatively small variations in the sample of simulated galaxies (; ), the ionization parameter spans 5 orders of magnitude (). Hence, the strongest dependence of is on , in agreement with findings by Moriwaki et al. (2018); Arata et al. (2020). The rapid drop of for is only partially mitigated in the full RT, multi-phase serra results (black circles). In Fig. 1, galaxies in our sample are color-coded with . Indeed, galaxies with the largest downward deviations from the local metal-poor relation have .
4.2 What determines the ionization parameter?
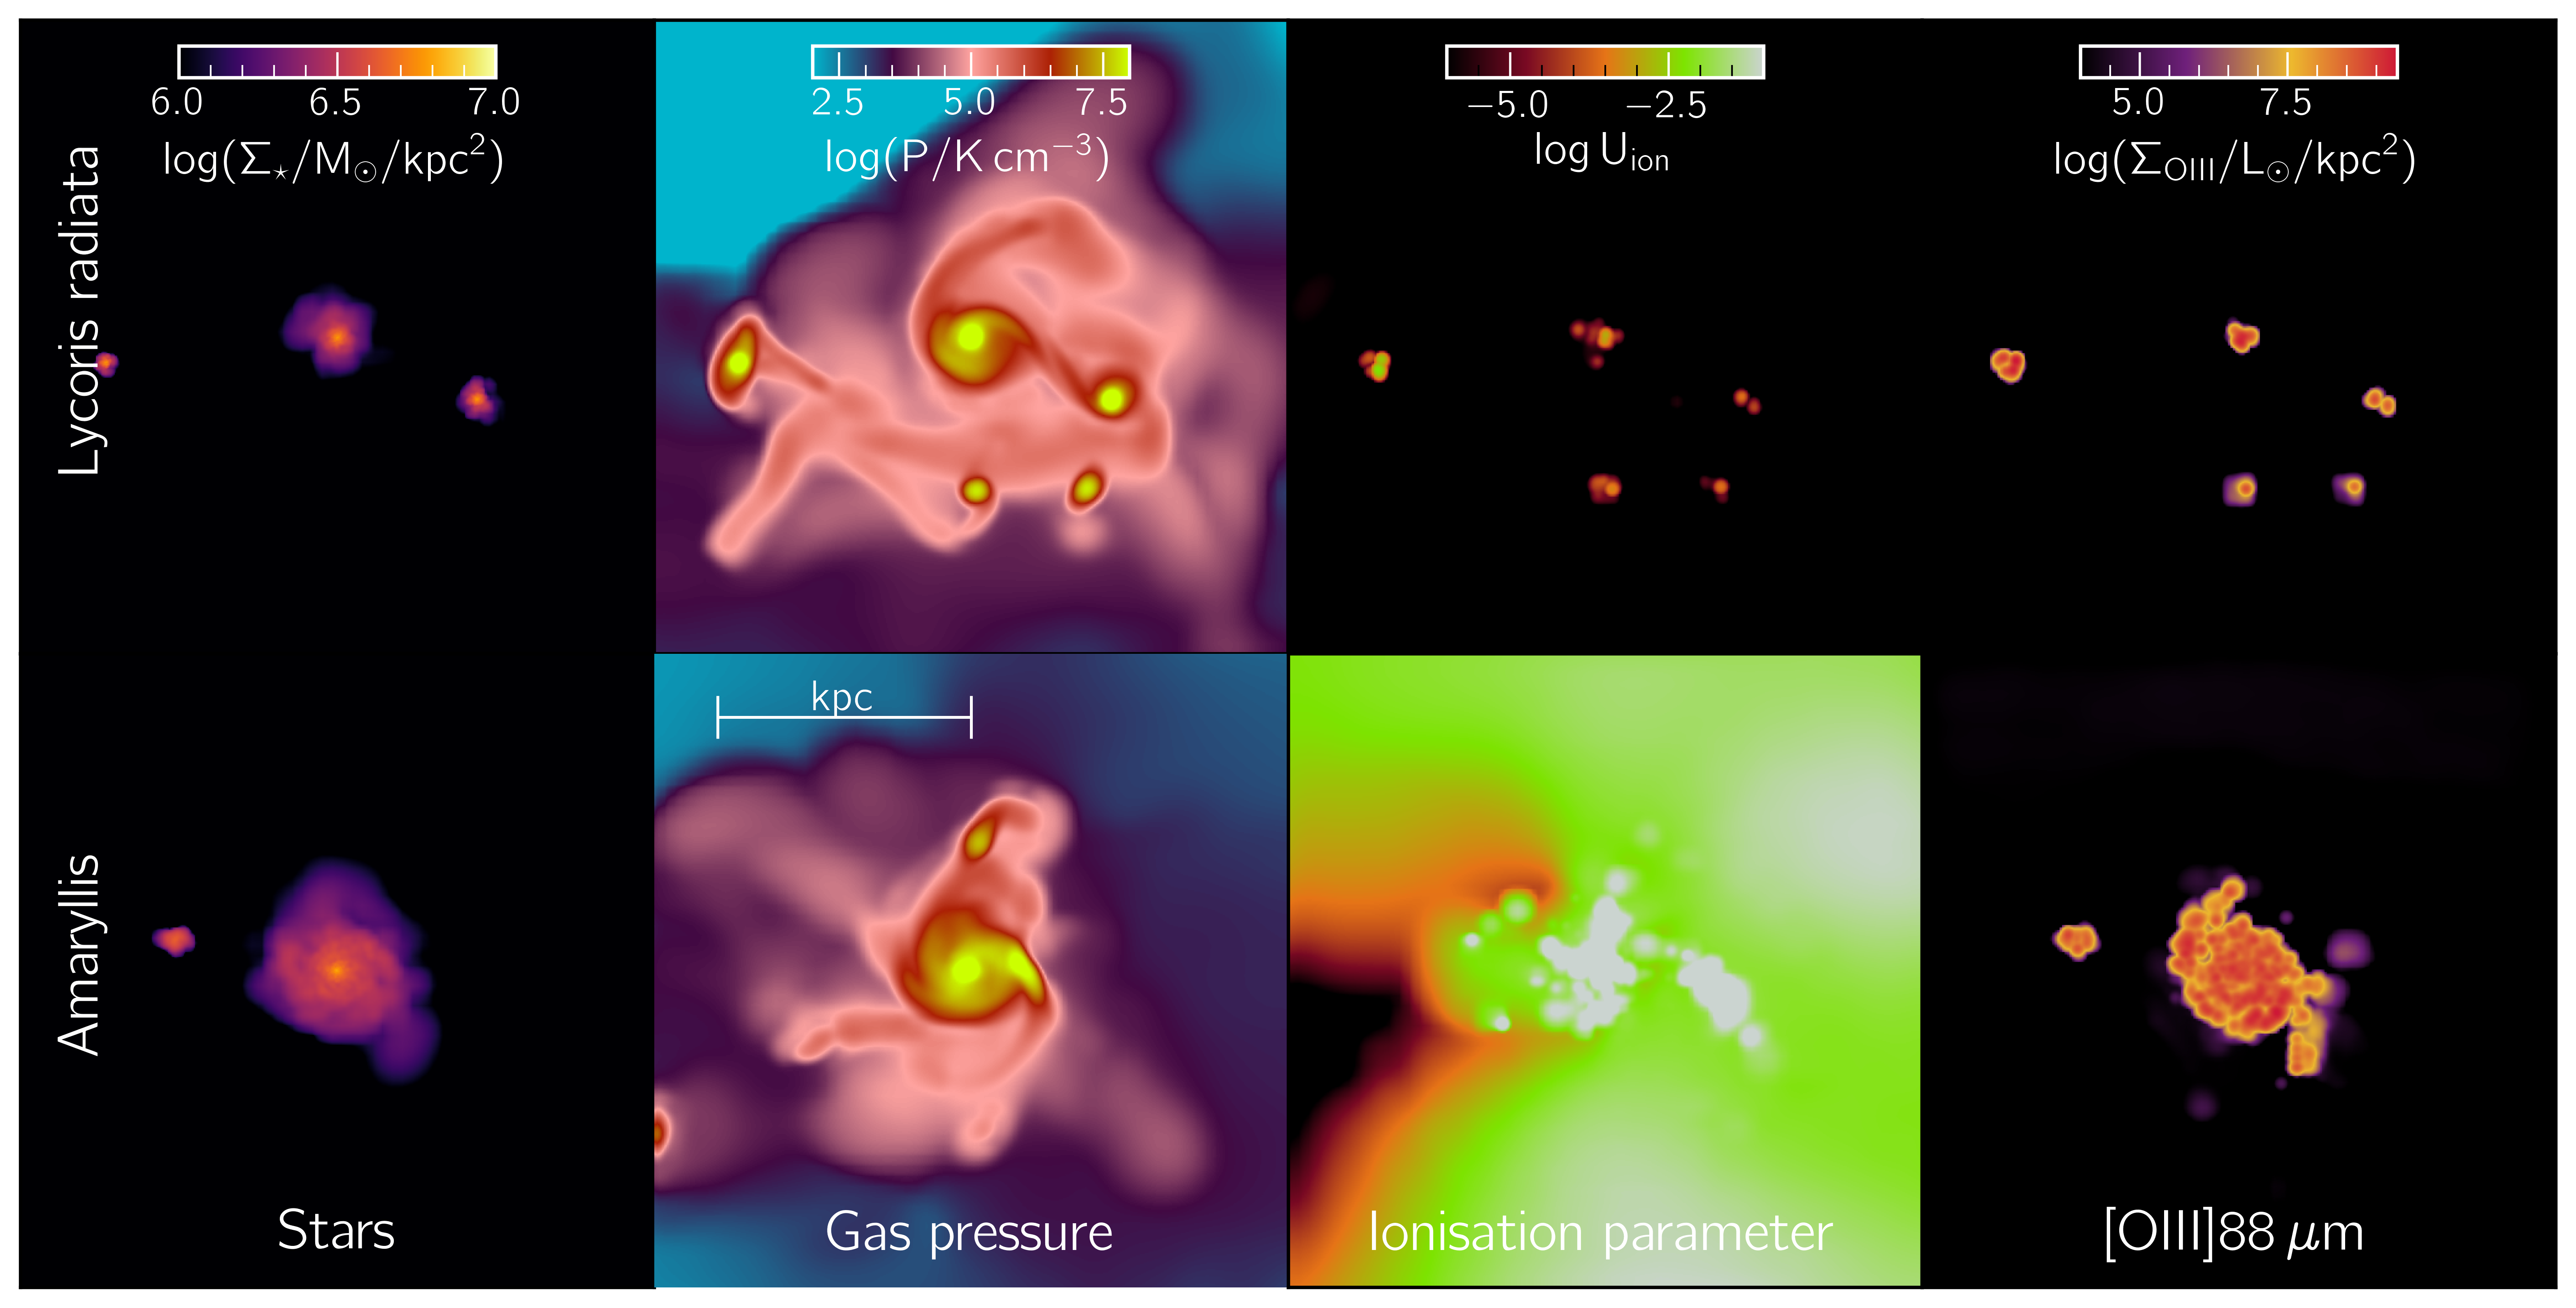
As galaxies in our sample, by construction, have very similar SFR values, what causes their wide ionization parameter range? Fig. 3 shows two galaxies from our sample: Lycoris radiata and Amaryllis. Shown are their stellar, gas pressure, ionisation parameter, and [O ] m emission line maps. Lycoris radiata is a galaxy with , at and Amaryllis is at the same redshift with and . Although these two galaxies have similar SFR and are at the same redshift (Fig. 1), Amaryllis is 20 brighter in [O ] due to its higher , i.e. vs. .
The difference in is mainly driven by the compactness of H regions. The ISM of early galaxies is highly pressurized as a result of the higher gas velocity dispersion. Fig. 3 shows that the pressure within star-forming clumps is high, , in both systems. As a consequence, clumps are more resistant to dispersal induced by stellar feedback, have longer lifetimes ( Myr), and star formation remains embedded for a longer time (Behrens et al., 2018; Sommovigo et al., 2020). These high-density () star-forming regions are characterized by , which implies very low [O ] emission (Fig. 2). Also, ionising photons are trapped inside the clumps and produce a super-compact H region.
While in Lycoris radiata stars are almost exclusively located within high-density clumps, reflecting an earlier assembly stage in which stars are very young and still embedded, Amaryllis has managed to build a well-developed disk structure, within which many star clusters have dispersed their natal cloud, ionised the low-density ISM, and produce a high . This difference can be seen from the much more extended distribution of stars with respect to clumps in Amaryllis. Thus, it is the ability to disperse natal clouds that ultimately determines the value of and the [OIII] luminosity.
5 Summary
To confirm the redshift of JWST detected super-early () galaxies, ALMA DDT observations have been designed aiming to detect the FIR [O ] m emission line, supposing that these galaxies would follow the local metal-poor relation. Such follow-up observations have been unsuccessful so far. Here, we have used the serra suite of simulations of galaxies to explain such non-detections. We find that:
-
Galaxies with SFR similar to JWST-detected sources span more than two orders of magnitude in ; most of them are fainter than expected from the metal-poor galaxies’ relation.
-
The most luminous galaxy in our sample (, FWHM) could be detected in hrs on-source, which is slightly longer than the integration times ( hrs/tuning) used by ALMA DDT programs so far.
-
Galaxies with the largest downward deviations from the local metal-poor relation have low ionisation parameter, .
-
Such low values are found in galaxies that are in an early assembly stage, as most of their stars are still embedded in high-density natal clouds, and their ionizing photons are trapped in ultra-compact H regions.
Data Availability
The derived data generated in this research will be shared on reasonable request to the corresponding author.
References
- Adams et al. (2022) Adams, N. J., Conselice, C. J., Ferreira, L., et al. 2022, arXiv e-prints, arXiv:2207.11217. https://arxiv.org/abs/2207.11217
- Arata et al. (2020) Arata, S., Yajima, H., Nagamine, K., Abe, M., & Khochfar, S. 2020, MNRAS, 498, 5541, doi: 10.1093/mnras/staa2809
- Asplund et al. (2009) Asplund, M., Grevesse, N., Sauval, A. J., & Scott, P. 2009, Annual Review of Astronomy and Astrophysics, 47, 481–522, doi: 10.1146/annurev.astro.46.060407.145222
- Astropy Collaboration et al. (2013) Astropy Collaboration, Robitaille, T. P., Tollerud, E. J., et al. 2013, A&A, 558, A33, doi: 10.1051/0004-6361/201322068
- Atek et al. (2022) Atek, H., Shuntov, M., Furtak, L. J., et al. 2022, Revealing Galaxy Candidates out to with JWST Observations of the Lensing Cluster SMACS0723, arXiv, doi: 10.48550/ARXIV.2207.12338
- Bakx et al. (2022) Bakx, T. J. L. C., Zavala, J. A., Mitsuhashi, I., et al. 2022, arXiv e-prints, arXiv:2208.13642. https://arxiv.org/abs/2208.13642
- Behnel et al. (2011) Behnel, S., Bradshaw, R., Citro, C., et al. 2011, Computing in Science Engineering, 13, 31 , doi: 10.1109/MCSE.2010.118
- Behrens et al. (2018) Behrens, C., Pallottini, A., Ferrara, A., Gallerani, S., & Vallini, L. 2018, MNRAS, 477, 552, doi: 10.1093/mnras/sty552
- Boylan-Kolchin (2022) Boylan-Kolchin, M. 2022, arXiv e-prints, arXiv:2208.01611. https://arxiv.org/abs/2208.01611
- Castellano et al. (2022) Castellano, M., Fontana, A., Treu, T., et al. 2022, arXiv e-prints, arXiv:2207.09436. https://arxiv.org/abs/2207.09436
- De Looze et al. (2014) De Looze, I., Cormier, D., Lebouteiller, V., et al. 2014, A&A, 568, A62, doi: 10.1051/0004-6361/201322489
- Donnan et al. (2022) Donnan, C. T., McLeod, D. J., Dunlop, J. S., et al. 2022, The evolution of the galaxy UV luminosity function at redshifts z 8-15 from deep JWST and ground-based near-infrared imaging, arXiv, doi: 10.48550/ARXIV.2207.12356
- Federrath & Klessen (2013) Federrath, C., & Klessen, R. S. 2013, ApJ, 763, 51, doi: 10.1088/0004-637X/763/1/51
- Ferland et al. (2017) Ferland, G. J., Chatzikos, M., Guzmán, F., et al. 2017, Rev. Mexicana Astron. Astrofis., 53, 385. https://arxiv.org/abs/1705.10877
- Ferrara et al. (2022) Ferrara, A., Pallottini, A., & Dayal, P. 2022, arXiv e-prints, arXiv:2208.00720, doi: 10.48550/ARXIV.2208.00720
- Ferrara et al. (2019) Ferrara, A., Vallini, L., Pallottini, A., et al. 2019, MNRAS, 489, 1, doi: 10.1093/mnras/stz2031
- Finkelstein et al. (2022) Finkelstein, S. L., Bagley, M. B., Arrabal Haro, P., et al. 2022, arXiv e-prints, arXiv:2207.12474. https://arxiv.org/abs/2207.12474
- Fujimoto et al. (2022) Fujimoto, S., Finkelstein, S. L., Burgarella, D., et al. 2022, arXiv e-prints, arXiv:2211.03896. https://arxiv.org/abs/2211.03896
- Furtak et al. (2022) Furtak, L. J., Shuntov, M., Atek, H., et al. 2022, arXiv e-prints, arXiv:2208.05473. https://arxiv.org/abs/2208.05473
- Grassi et al. (2014) Grassi, T., Bovino, S., Schleicher, D. R. G., et al. 2014, MNRAS, 439, 2386, doi: 10.1093/mnras/stu114
- Harikane et al. (2020) Harikane, Y., Ouchi, M., Inoue, A. K., et al. 2020, ApJ, 896, 93, doi: 10.3847/1538-4357/ab94bd
- Harikane et al. (2022a) Harikane, Y., Ouchi, M., Oguri, M., et al. 2022a, arXiv e-prints, arXiv:2208.01612. https://arxiv.org/abs/2208.01612
- Harikane et al. (2022b) Harikane, Y., Inoue, A. K., Mawatari, K., et al. 2022b, ApJ, 929, 1, doi: 10.3847/1538-4357/ac53a9
- Hunter (2007) Hunter, J. D. 2007, Computing in Science Engineering, 9, 90, doi: 10.1109/MCSE.2007.55
- Kaasinen et al. (2022) Kaasinen, M., van Marrewijk, J., Popping, G., et al. 2022, arXiv e-prints, arXiv:2210.03754. https://arxiv.org/abs/2210.03754
- Kennicutt (1998) Kennicutt, Robert C., J. 1998, ARA&A, 36, 189, doi: 10.1146/annurev.astro.36.1.189
- Kohandel et al. (2020) Kohandel, M., Pallottini, A., Ferrara, A., et al. 2020, MNRAS, 499, 1250, doi: 10.1093/mnras/staa2792
- Kohandel et al. (2019) —. 2019, MNRAS, 487, 3007, doi: 10.1093/mnras/stz1486
- Mason et al. (2022) Mason, C. A., Trenti, M., & Treu, T. 2022, arXiv e-prints, arXiv:2207.14808. https://arxiv.org/abs/2207.14808
- Moriwaki et al. (2018) Moriwaki, K., Yoshida, N., Shimizu, I., et al. 2018, MNRAS, 481, L84, doi: 10.1093/mnrasl/sly167
- Naidu et al. (2022) Naidu, R. P., Oesch, P. A., Dokkum, P. v., et al. 2022, ApJ, 940, L14, doi: 10.3847/2041-8213/ac9b22
- Pallottini et al. (2017a) Pallottini, A., Ferrara, A., Bovino, S., et al. 2017a, MNRAS, 471, 4128, doi: 10.1093/mnras/stx1792
- Pallottini et al. (2017b) Pallottini, A., Ferrara, A., Gallerani, S., et al. 2017b, MNRAS, 465, 2540, doi: 10.1093/mnras/stw2847
- Pallottini et al. (2019) Pallottini, A., Ferrara, A., Decataldo, D., et al. 2019, MNRAS, 487, 1689, doi: 10.1093/mnras/stz1383
- Pallottini et al. (2022) Pallottini, A., Ferrara, A., Gallerani, S., et al. 2022, MNRAS, 513, 5621, doi: 10.1093/mnras/stac1281
- Pontoppidan et al. (2022) Pontoppidan, K. M., Barrientes, J., Blome, C., et al. 2022, ApJ, 936, L14, doi: 10.3847/2041-8213/ac8a4e
- Pontzen et al. (2013) Pontzen, A., Rovskar, R., Stinson, G. S., et al. 2013, pynbody: Astrophysics Simulation Analysis for Python
- Popping (2022) Popping, G. 2022, arXiv e-prints, arXiv:2208.13072. https://arxiv.org/abs/2208.13072
- Rizzo et al. (2022) Rizzo, F., Kohandel, M., Pallottini, A., et al. 2022, A&A, 667, A5, doi: 10.1051/0004-6361/202243582
- Rodighiero et al. (2022) Rodighiero, G., Bisigello, L., Iani, E., et al. 2022, arXiv e-prints, arXiv:2208.02825. https://arxiv.org/abs/2208.02825
- Rosdahl et al. (2013) Rosdahl, J., Blaizot, J., Aubert, D., Stranex, T., & Teyssier, R. 2013, MNRAS, 436, 2188, doi: 10.1093/mnras/stt1722
- Santini et al. (2022) Santini, P., Fontana, A., Castellano, M., et al. 2022, arXiv e-prints, arXiv:2207.11379. https://arxiv.org/abs/2207.11379
- Sommovigo et al. (2020) Sommovigo, L., Ferrara, A., Pallottini, A., et al. 2020, MNRAS, 497, 956, doi: 10.1093/mnras/staa1959
- Teyssier (2002) Teyssier, R. 2002, A&A, 385, 337, doi: 10.1051/0004-6361:20011817
- Topping et al. (2022) Topping, M. W., Stark, D. P., Endsley, R., et al. 2022, arXiv e-prints, arXiv:2208.01610. https://arxiv.org/abs/2208.01610
- Treu et al. (2022) Treu, T., Roberts-Borsani, G., Bradac, M., et al. 2022, ApJ, 935, 110, doi: 10.3847/1538-4357/ac8158
- Vallini et al. (2017) Vallini, L., Ferrara, A., Pallottini, A., & Gallerani, S. 2017, MNRAS, 467, 1300, doi: 10.1093/mnras/stx180
- Vallini et al. (2018) Vallini, L., Pallottini, A., Ferrara, A., et al. 2018, MNRAS, 473, 271, doi: 10.1093/mnras/stx2376
- van der Walt et al. (2011) van der Walt, S., Colbert, S. C., & Varoquaux, G. 2011, Computing in Science Engineering, 13, 22, doi: 10.1109/MCSE.2011.37
- Van Rossum & de Boer (1991) Van Rossum, G., & de Boer, J. 1991, CWI Quarterly, 4, 283
- Van Rossum & Drake (2009) Van Rossum, G., & Drake, F. L. 2009, Python 3 Reference Manual (Scotts Valley, CA: CreateSpace)
- Virtanen et al. (2020) Virtanen, P., Gommers, R., Oliphant, T. E., et al. 2020, Nature Methods, 17, 261, doi: 10.1038/s41592-019-0686-2
- Whitler et al. (2022) Whitler, L., Endsley, R., Stark, D. P., et al. 2022, arXiv e-prints, arXiv:2208.01599. https://arxiv.org/abs/2208.01599
- Witstok et al. (2022) Witstok, J., Smit, R., Maiolino, R., et al. 2022, MNRAS, 515, 1751, doi: 10.1093/mnras/stac1905
- Yan et al. (2022) Yan, H., Ma, Z., Ling, C., et al. 2022, arXiv e-prints, arXiv:2207.11558. https://arxiv.org/abs/2207.11558
- Yoon et al. (2022) Yoon, I., Carilli, C. L., Fujimoto, S., et al. 2022, arXiv e-prints, arXiv:2210.08413. https://arxiv.org/abs/2210.08413
- Zanella et al. (2021) Zanella, A., Pallottini, A., Ferrara, A., et al. 2021, MNRAS, 500, 118, doi: 10.1093/mnras/staa2776