Learning a Pedestrian Social Behavior Dictionary
Abstract
Understanding pedestrian behavior patterns is a key component to building autonomous agents that can navigate among humans. We seek a learned dictionary of pedestrian behavior to obtain a semantic description of pedestrian trajectories. Supervised methods for dictionary learning are impractical since pedestrian behaviors may be unknown a priori and the process of manually generating behavior labels is prohibitively time consuming. We instead utilize a novel, unsupervised framework to create a taxonomy of pedestrian behavior observed in a specific space. First, we learn a trajectory latent space that enables unsupervised clustering to create an interpretable pedestrian behavior dictionary. We show the utility of this dictionary for building pedestrian behavior maps to visualize space usage patterns and for computing the distributions of behaviors. We demonstrate a simple but effective trajectory prediction by conditioning on these behavior labels. While many trajectory analysis methods rely on RNNs or transformers, we develop a lightweight, low-parameter approach and show results comparable to SOTA on the ETH and UCY datasets.
1 Introduction
The success of computer vision in robust recognition has paved the way for vision-guided autonomous agents in real world environments. For embodied agents to navigate amongst people, an understanding of pedestrian behavior is important for maneuvering in a non-disruptive manner. Trajectory prediction of pedestrians has received significant attention in recent years, with algorithms that learn time-series representations of trajectories while taking into account both scene context and other nearby pedestrians. While trajectory prediction algorithms are powerful, they output sequences of x-y coordinates which do not provide high level, interpretable knowledge of the scene or explain scene dynamics in terms of human behavior.
Trajectories are already low-dimensional as a sequence of x-y values with limited long-range dependencies. Consequently, the computational tools used in past trajectory prediction such as RNNs with attention [26, 29] and without [1, 33], transformers [35, 9], and spatio-temporal graph networks [35, 13] may be unnecessarily complex for the task. Instead, we create PT-net, a network that learns a pedestrian behavior dictionary in an unsupervised, data-driven manner to provide explainable, semantic social behavior labels for pedestrian trajectories in a scene. These can be used to characterize global trends in space usage and pedestrian behavior habits as well as assist in downstream tasks like trajectory prediction so that very shallow networks can be used to predict accurate paths.
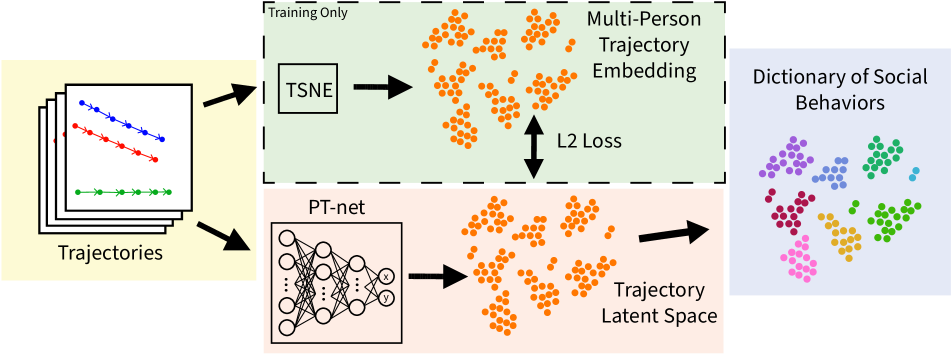
Unsupervised methods are an integral part of our framework because they do not require prohibitively time consuming labelling of large datasets like their supervised counterparts. Moreover, the labels themselves are unknown in this domain and need to be learned from pedestrian data. We are inspired by methods [37] that learn networks to reproduce a t-SNE-embedding using a student-teacher framework to circumvent this problem. PT-net creates a stationary latent space embedding of trajectories that uses t-SNE clustering as its guide to create a pedestrian behavior dictionary. This allows the dictionary to be a low-dimensional 2D latent space mapping which groups trajectories with similar social behaviors into homogeneous clusters, due to the KL divergence loss in t-SNE promoting clustering. The clusters in the projection space are well-defined and correspond to interpretable behavior. These clusters can be readily human-labelled with a semantic behavior by observing a sampling of trajectories within each cluster.
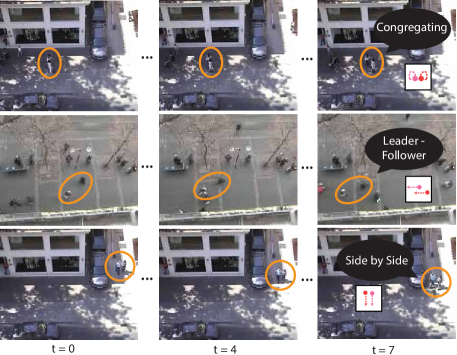
Unsupervised clustering to discover social behaviors avoids the shortcomings of manually defining presumed behaviors. For example, consider the cluster that corresponds to leader-follower behavior where two pedestrians travel approximately the same path, one in front of the other, separated by a distance. This behavior cannot be easily manually defined a priori because the inter-person distance is randomly distributed and varies among environments. Our approach clusters behaviors in an unsupervised manner without the explicit definition of these properties, supporting the discovery of the diverse behaviors within a specific environment. A network is then constructed to mimic the unsupervised clustering and embed trajectories into a latent space where new trajectory instances can be projected.
From this clustering, we can also map semantic pedestrian behaviors from the dictionary to specific locations in scenes resulting in a pedestrian behavior map that can answer key questions about an environment. How do pedestrians use this space? Where do people congregate and socialize? What are the dominant patterns in pedestrian behavior? These questions allow the localization of interesting social waypoints, i.e. points of social behavior inflection or change in the environment, which can be used in robot motion planing. For example, just as a robot should avoid running into a mailbox, it should also be cognizant of social waypoints such as patios, bus-stops, map kiosks, and other places where people congregate and socialize. While one approach may be to determine these waypoints using what is physically present in the space, another method is to observe how people use the space enabled by the taxonomy of an interpretable pedestrian behavior dictionary.
Our framework has the advantage of being light-weight, unsupervised, and relying on very basic networks to achieve useful characterizations and accurate predictions of pedestrian behavior. We provide results showing the utility of our method on the ETH [22] and UCY[17] datasets through the creation of pedestrian behavior maps to characterize environment usage and trajectory prediction that is conditioned on the predicted social semantic behavior using PT-net. While trajectory prediction is not our main goal, we demonstrate that our pedestrian behavior dictionary simplifies the task of pedestrian trajectory prediction and maintains high performance. After predicting the social behavior cluster for a particular trajectory, the dictionary label is used to constrain the future trajectory prediction. Conditioned on the behavior, trajectories can be predicted with shallow MLPs, which show comparable performance with state of the art (SOTA) methods that use much larger, more complex networks.
Our main contributions are threefold: (1) introduction of PT-net: an unsupervised method for computing a semantically meaningful pedestrian behavior dictionary using a novel t-SNE imitator network; (2) construction of interpretable pedestrian behavior maps to characterize environment usage patterns in terms of pedestrian behavior; (3) competitive pedestrian trajectory prediction results with a much simpler network than current SOTA.
2 Related Work
In prior work, pedestrian trajectories are often modelled with standard sequence based methods such as LSTMs[1, 32, 26], and more recently transformers [35, 9], with the primary goal of pedestrian trajectory prediction, not behavior dictionaries. Other computational frameworks for trajectory prediction include GANs[10, 24, 13], graph networks[29, 21, 18], and CVAEs[16, 5, 20]. Some methods explicitly model the social interactions between pedestrians using attention [14, 29] or contrastive learning [19] in order to enhance future trajectory prediction. Unlike prior work, our emphasis is on building a short-term pedestrian behavior dictionary answering basic questions like: What behaviors do small groups of pedestrian exhibit in the space? The resulting description of interpretable pedestrian behavior can be used to characterize the usage of a space by quantifying distributions and locations of pedestrian behavior.
In our work, a dictionary of behaviors is learned from small groups of pedestrians over fixed time windows in a computationally lightweight approach without sequence models. Recent work in trajectory clustering [28] shows the advantage of clustering-based, unsupervised representations for trajectories in the domain of action recognition, using video as inputs. Prior work in trajectory clustering [6, 38, 11] also show the utility of clustering to analyze dependencies in crowded scenes. Our trajectory framework uses small groups of image coordinates as input to account for short-term dependencies resulting in a model that is low-dimensional, fast to train, and suitable for characterizing pedestrian behavior.
Trajectory classification is a natural choice for quantifying actions in a space; however, it is difficult to determine the class labels a priori and annotation is impractical and time-consuming. Unsupervised and self-supervised methods for clustering have the advantage of requiring no labels. Recent work in unsupervised guidance for pre-training builds convnets in a self-supervised manner, creating a network that emulates the output of the unsupervised tasks. For example, [7, 8] learns a representation that matches visual bag-of-words output; [34] trains a network to match the 2D t-SNE output creating a latent space for texture recognition; [3, 4] trains networks to generate clusters for unsupervised feature learning; [28] trains a 3D convnet to match the k-means clustering of an embedding space. We follow this trend of using unsupervised methods to train clustering networks to build a t-SNE-imitator network for projecting pedestrian paths to a trajectory latent space. Moreover, we show that clusters in this latent space correspond to distinct and interpretable pedestrian behavior and therefore can be used to build a pedestrian behavior dictionary.
3 Methods
3.1 PT-net for a Trajectory Latent Space
We devise PT-net to act as a t-SNE-imitator by using a student-teacher framework to obtain a stable embedding from multi-pedestrian trajectories, which are particularly well-suited for t-SNE-embedding because of their low dimensionality. Given trajectories for each person in a scene over time steps, we split the trajectories into overlapping segments of length where each segment is offset by , and each pedestrian is present for the duration of the time steps in each trajectory segment. This provides environment specific pedestrian behavior examples that are limited by features such as sidewalks, entryways, and roads. The trajectory segments are augmented by rotation ( degrees) to insert synthetic variation into the data to make the learned latent space more generalizable.
The relative velocity, , is computed as follows:
| (1) |
where and are the location of pedestrian at time . Subsequently, , the distance between person at time and the nearest pedestrians in the scene at time , is computed for each time step in the segment,
| (2) |
where is the total number of people in the trajectory segment. These two vectors, and , are computed for each person in the trajectory and concatenated to form
| (3) |
where is a scaling factor included to combat the difference in scale between the relative velocities and the proximity-based features and denotes the concatenation operation. This process is repeated for each trajectory segment collected from the raw data.
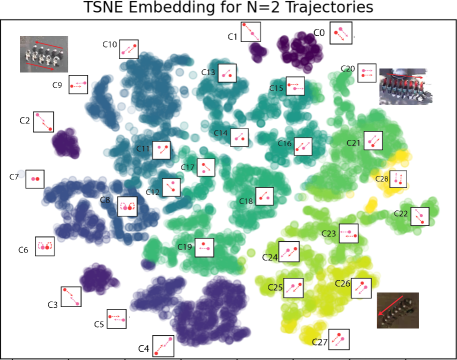
From there, we split the data into groups containing equal numbers of pedestrians and use t-SNE to create a trajectory embedding for each group. The t-SNE embedding output is clustered using k-means, where is chosen through visual inspection of the t-SNE embedding manifold. The cluster assignments of each point in t-SNE space are paired with their corresponding raw trajectories. Sampling small numbers of these points per cluster and comparing the associated raw trajectories reveals a taxonomy of semantically meaningful behaviors like leader-follower, walking in pairs, or standing around in small groups, as shown in Figure 4. See Figure 2 for an overview of this process and Table 1 for a textual description of the observed behaviors.
This trajectory embedding learned directly from the pedestrian velocities using t-SNE is useful, but t-SNE embeddings are irreproducible, which is undesirable in the event that it is necessary to predict the social behavior clusters of previously unseen pedestrian trajectories or add to the number of social clusters by processing new data. To combat this, PT-net, a feed-forward MLP network, learns to mimic the resulting t-SNE embeddings. Each cluster in the pedestrian behavior embedding corresponds to one unique social behavior. This effectively quantizes a continuum of behaviors to reduce the dimensionality of an infinite set of social behaviors, thus providing a tractable lexicon of social behaviors for high level scene reasoning.
3.2 Utilizing the Pedestrian Behavior Dictionary
Trajectory Prediction with PT-Net
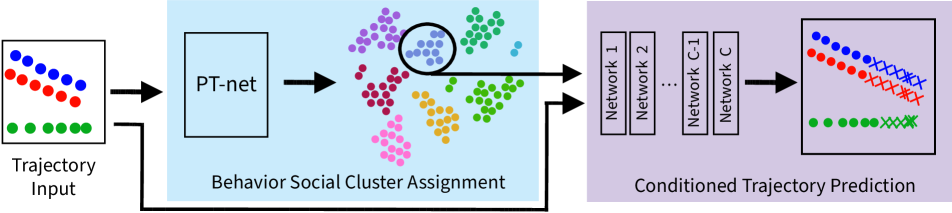
Using a set of trajectories as input, we predict future trajectories deterministically conditioned on the predicted, semantically meaningful, social behavior cluster, , from PT-net. Figure 3 illustrates this process. First, the velocity and proximity input from Equation 3 is assembled for the current scene. PT-net uses this to predict the social behavior cluster from the pedestrian behavior dictionary. Based on this cluster assignment, a specific feed-forward MLP network is chosen from an ensemble to make the pedestrian trajectory prediction. We train one MLP to predict future trajectories per cluster in the pedestrian behavior dictionary. This is possible because the dictionary effectively limits the possible state space of the trajectory prediction problem to a manageable range.
Social Behavior and Environmental Characterization
Once the pedestrian behavior dictionary is created, it can be used to answer questions about human behavior and environment utilization. A particular environment can be characterized by enumerating the social behaviors that occur and computing the frequency of these behaviors. That is, pedestrian behavior histograms and pedestrian behavior maps allow characterization of space usage and discovery of pedestrian behaviors (see Figures 5 and 6). Analysis of space in this manner is directly applicable to social science issues such as public space assessment [31, 30, 27, 12] and pedestrian behavior analysis [15, 2, 23]. Key questions in pedestrian behavior can be answered such as: what is the average distance in leader-follower relationships? Is this distance culturally dependent? What is the radius of movement when people are congregating during conversation or waiting?
4 Results
4.1 Datasets
We test our networks against SOTA methods using the ETH [22] and UCY [17] datasets on the task of pedestrian trajectory prediction. After creating the pedestrian behavior dictionary from the combination of trajectories from both datasets, PT-net is used to condition the trajectory prediction. For this task, the trajectories are normalized based on the scene sizes and centered on the origin so that the same networks can be used over multiple datasets. Note that each of the datasets occur on sidewalked areas. This limits the types of behaviors that pedestrians can exhibit. For example, it is highly unlikely that a pedestrian will walk in circles or meander directionlessly because the social convention is to walk parallel to the buildings. Subsequently, the trajectories are augmented with several rotations to introduce more behavior variety.
4.2 Training
Behavior Dictionary Cluster Prediction
To create the input data for the t-SNE, we choose sliding windows of size time steps and for ease of comparison with the experiments in SOTA and to learn behaviors that would be relevant to existing work. The sliding windows of trajectories allow for more granular detection of social behavior changes. We choose to be 15, and the
| Semantic Behavior | # People (N), |
| Cluster # (C) | |
| Standing Still | N1:C0, N2:C7 |
| N3:C13 | |
| Walking Straight | N1:C1-3, 6-9 |
| Congregating | N1: C4-5 |
| N2:C6, 8 | |
| Walking Side by Side | N2:C0,20,21,26,27 |
| N3:C4,7, 16, 19 | |
| N3:C21, 24-25 | |
| Leader-Follower | N2:C1, 15-16, |
| 22-25 | |
| Two Passing in Opposite Directions | N2:C2-5, 9-10 |
| One Passing, One Standing | N2:C11-14,17-19 |
| One Passing a Pair Standing | N3:C0, 10, 15, |
| 20, 23, 26, 30 | |
| Pair Passing One Walking in Opposite Direction | N3:C1, 5-6, 22, |
| 27, 29, 31 | |
| Two Walking in Opposite Directions Passing One Standing | N3:C2, 32 |
| One Walking Between Pair in Opposite Direction | N3:C3 |
| Two Still, One Fidgeting | N3:C8 |
| Two Leader-Follower, One Parallel | N3:C9, 17 |
| Two Passing Opposite Directions, One Standing | N3:C11 |
| Pair Walking Past One Standing | N3:C12, 14, 28 |
| Pair Walking Away From One Walking | N3:C18 |
maximum number of people in each trajectory used for our experiments is . In practice, there are much more than three pedestrians in the scene at a time. To deal with this, the larger groups are broken down into subgroups so that PT-net only predicts on the the closest pedestrians at a time. This process is repeated until each person is included in at least one group. PT-net is a collection of 3 MLPs, one for each N, trained for 300 epochs. Each MLP is comprised of four linear layers with ReLU activation functions and residual connections.
Pedestrian Trajectory Prediction
For the trajectory prediction task, positions for each person in a scene over timesteps are input to the ensemble of MLPs which predict positions over timesteps into the future for each person. This choice of input and prediction horizons is standard in multiple SOTA methods[10, 36, 1]. The ensemble networks are made up of four linear layers with the ReLU activation function and residual connections and are each trained for 1000 epochs on only the input data corresponding to their respective cluster assignments. Because PT-net learns space-specific features, we train one set of MLPs on 80% (2880 trajectories) of the data from all scenes and test on the remaining 20% (720 trajectories) for each environment. Training a scene-specific model inherently accounts for scene context. While some applications require no pre-training on the scene, the observation of a scene before algorithm deployment is quite reasonable in numerous applications, such as IOT, smart buildings, and traffic monitoring, due to a ubiquitous fixed camera.
4.3 Interpretable Pedestrian Behavior Dictionary
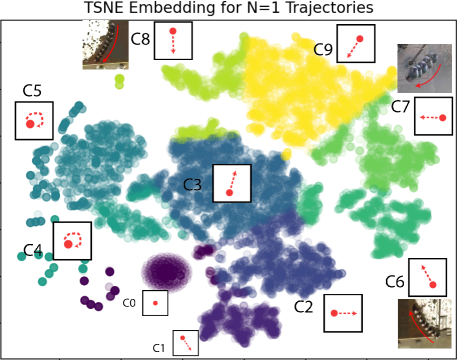
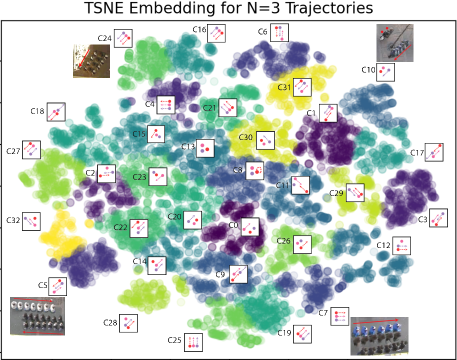
The learned latent space for pedestrians is shown in Figure 4. Drawings with representative example trajectories are superimposed on each graph next to their corresponding clusters. Distinct clusters appear for each which indicates that our velocity and proximity-based trajectory processing is sufficient for learning distinct behaviors from the trajectories. Because we use velocity-based features, similar behaviors that are executed in different directions (ie. left-right vs top-bottom) often form different clusters. A description of the semantic behaviors associated with each cluster can be found in Table 1. The descriptions are condensed to only include the semantically distinct behaviors for each .
For larger than 3, it is still possible to find social behavior clusters, but their interpretability becomes more challenging as their number increases significantly with each subsequent increase of and behaviors become more complex. Behavior separation is smaller for high dimensions ( in Figure 4); however, the embedding space still groups similar pedestrian behaviors in a sufficient manner for the downstream tasks of predicting future pedestrian trajectories and interpreting behavior patterns in a space.
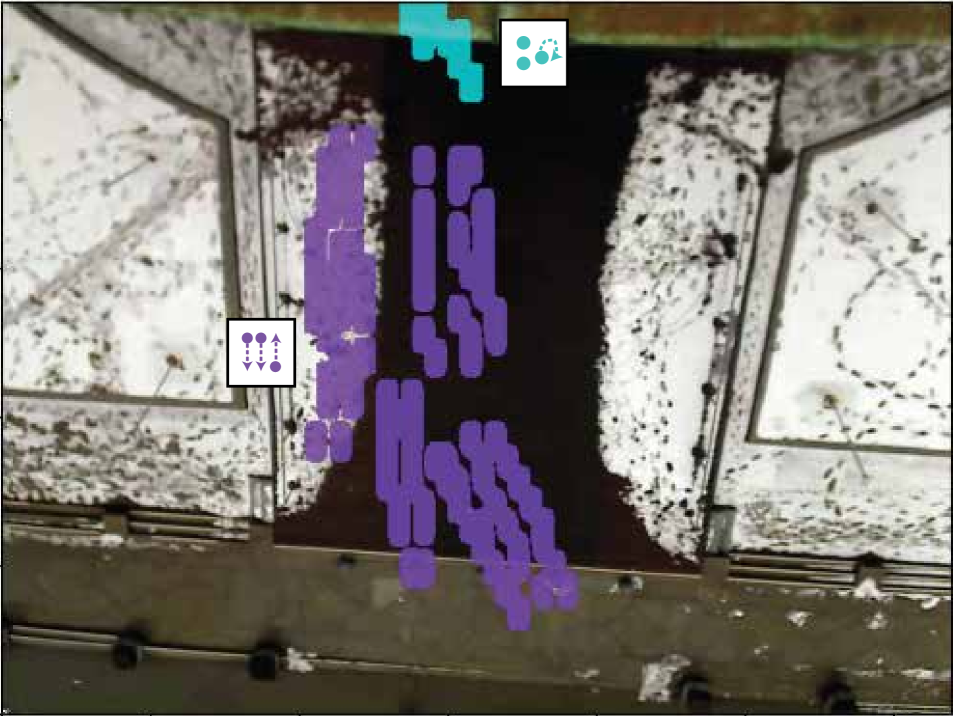
4.4 Pedestrian Behavior Maps
We use the pedestrian behavior dictionary to characterize space usage and social behavior patterns by creating behavior maps for each social behavior cluster in an environment. Clusters exhibiting the same behaviors with different pedestrian permutations are combined into the same behavior maps. For example in , clusters and show the same semantic and directional behavior, but with the pedestrian order switched. The behavior maps of different clusters are superimposed to analyze the inter-pedestrian and inter-social group interactions that take place.
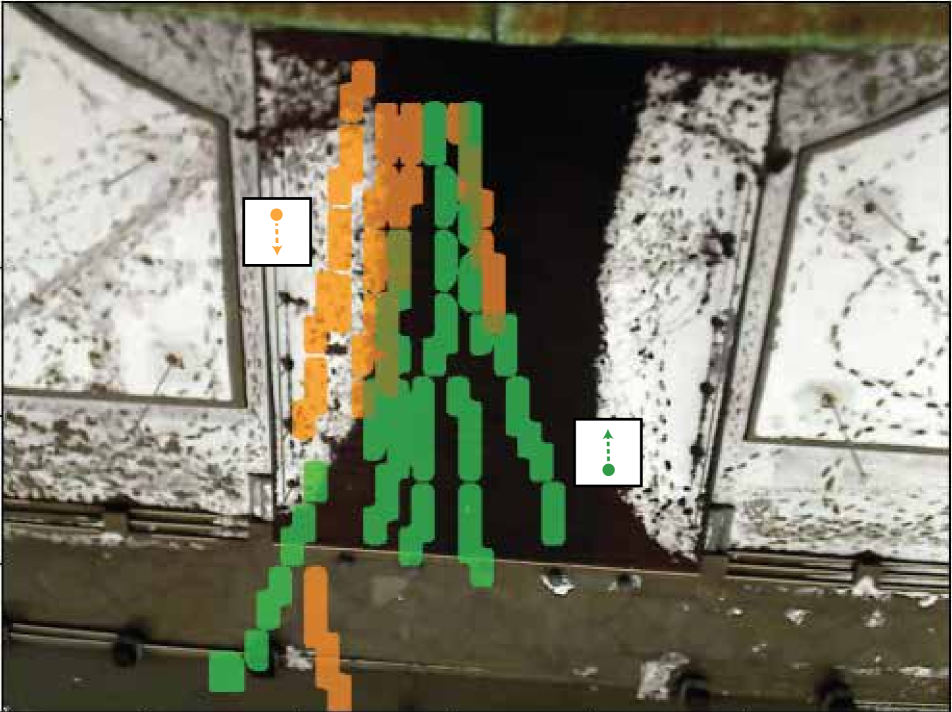
Figure 5 shows a selection of behavior maps in the ETH environment depicting the location that a particular behavior was exhibited over the duration of the entire dataset. Figure 5(a) shows the behavior map for one pedestrian entering the building (green) juxtaposed with one pedestrian leaving the building (orange). There are more people entering the building from the right, thus forcing the people exiting to stay to the left and give right of way to those entering. This could imply that there is a significant point of interest to the right of the building.
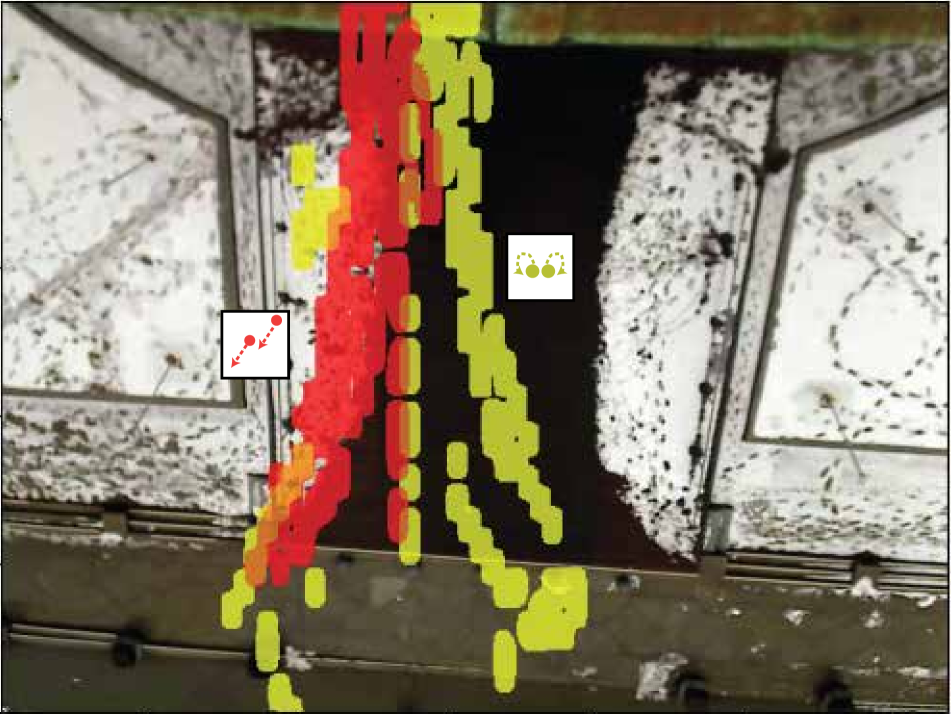
Figure 5(b) overlays the behavior map of two people standing still together (yellow) and two people leaving the building leader-follower (red). People tend to stand still off to the sides, or at an island in the middle of the walkway, where they believe they will be most out of the way. The people leaving the building are forced to travel in the gaps between these congregators. Figure 5(c) combines the behavior maps of two people walking side by side to exit the building passing one person entering the building (purple) and that of three people standing still together (blue). The behavior map for three people standing still is localized around the entrance to the building, implying there is a bottleneck around the door preventing people from moving freely. This bottleneck dissipates further away from the door where there is more free space.
| Method | ADE20 / FDE20 | ||||
|---|---|---|---|---|---|
| ETH | Hotel | Zara1 | Zara2 | Avg | |
| SGAN[10] | 0.81/1.52 | 0.72/1.61 | 0.34/0.69 | 0.42/0.84 | .57/1.17 |
| Sophie[24] | 0.70/1.43 | 0.76/1.67 | 0.30/0.63 | 0.38/0.78 | 0.54/1.13 |
| Transformer-TF[9] | 0.61/1.12 | 0.18/0.30 | 0.22/0.38 | 0.17/0.32 | 0.30/0.53 |
| STAR[35] | 0.36/0.65 | 0.17/0.36 | 0.26/0.55 | 0.22/0.46 | 0.25/0.51 |
| PECNet[20] | 0.54/0.87 | 0.18/0.24 | 0.22/0.39 | 0.17/0.30 | 0.28/0.45 |
| Trajectron++[25] | 0.39/0.83 | 0.12/0.21 | 0.15/0.33 | 0.11/0.25 | 0.19/0.41 |
| AgentFormer[36] | 0.26/0.39 | 0.11/0.14 | 0.15/0.23 | 0.14/0.24 | 0.17/0.25 |
| ADE / FDE | |||||
| PT-Net (Ours) | 0.41/1.07 | 0.63/1.33 | 0.15/0.38 | 0.16/0.42 | 0.33/0.80 |
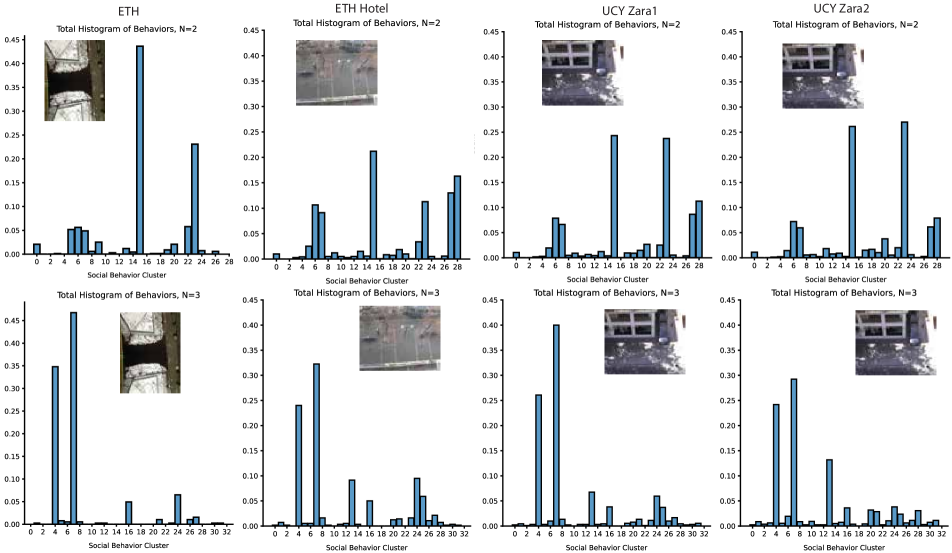
4.5 Pedestrian Behavior Histograms
Environment usage and social behavior characterization can also be done by observing the distribution of behaviors in each space. Figure 6 shows the pedestrian behavior histograms for ETH, ETH Hotel, UCY Zara1, and UCY Zara2 (along the column dimension) for people (along the row dimension). The histograms for ETH are significantly different from those of the other environments due to the difference in space usage (entryway to a building vs regular sidewalks). Pedestrians in ETH mainly exhibit horizontal leader-follower and walking side-by-side behaviors (N2:C15,23 and N3:C4,7) that allow them to enter or exit the building, while the other environments allow for more diversified movement.
ETH Hotel, UCY Zara1, and UCY Zara 2 have higher concentrations of pedestrians exhibiting the group congregating (N2:C6,7 and N3:C13,24), walking side-by-side upwards (N2:C28 and N3:C25), and walking leader-follower or side-by-side diagonally downward (N2:C27 and N3:C16) behaviors than ETH. The spatial structure of ETH Hotel predisposes it towards side-by-side vertical behavior, over that of ETH, because it has a train stop at the top of the frame. However, UCY Zara1 and UCY Zara2 are more primarily dominated by horizontal leader-follower or side-by-side behaviors, as seen in ETH, because the side walk in front of the building is a more popular avenue than the alley at the edge of the frame. Even with this similarity, UCY Zara1 and UCY Zara2 have much more pedestrian congregation than ETH, showing that pedestrians in the ETH environment are more purposed in their movement or that loitering is not accepted in the space. Additionally, between UCY Zara1 and UCY Zara2, which take place in the same environment at different times, there is variation in pedestrian quantity showing a preference amongst pedestrians for which time of day they prefer to be more active in the space.
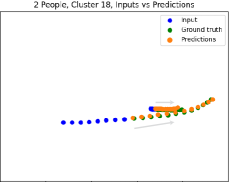
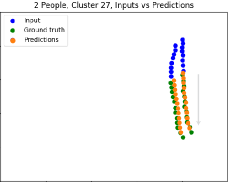
4.6 Pedestrian Trajectory Prediction
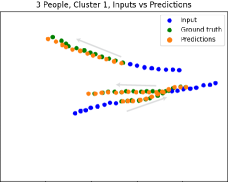
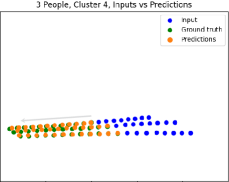
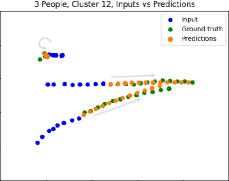
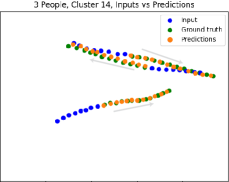
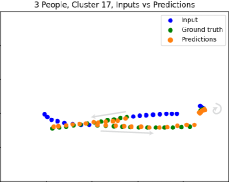
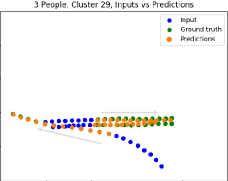
We show the utility of our method on pedestrian trajectory prediction. Table 2 shows a comparison of the metrics for PT-net and SOTA methods, where we show comparable performance on the ETH[22] and UCY[17] datasets. For the SOTA methods, each network is trained with the leave one out strategy and tested on the remaining dataset. PT-net learns scene-specific features, so it is trained on 80% of the total trajectory set (4 environments) and tested on the remaining 20%. We provide metrics for the average displacement error (ADE) and final displacement error (FDE) of our method. For SOTA, we use officially reported results for ADE20 and FDE20, where the best of the k=20 sampled trajectories is chosen. Figure 7 shows example trajectory predictions from a selection of social behavior clusters from the pedestrian behavior dictionary. The input trajectories are in blue, the ground truth future trajectories are in green, and the predictions are in orange. We predict plausible future trajectories for a myriad of socially complex scenarios using simple MLP networks.
5 Conclusion
In this paper, we proposed PT-net, a lightweight, unsupervised method for learning an interpretable pedestrian behavior dictionary for a given environment through trajectory clustering. Unsupervised methods remove the need for costly dataset labeling while allowing for the discovery of a dictionary containing diverse behavior patterns. With this dictionary, it is possible to characterize space usage and social behavior patterns to answer key questions in social science fields, like psychology and urban planning, using behavior maps and histograms to visualize the distribution of behaviors. We also demonstrate comparable performance to SOTA in trajectory prediction on the ETH and UCY datasets with a much simpler network. Decreasing the complexity and size of trajectory prediction methods is important for mobile computing and applications with limited computational resources.
Acknowledgements
This work was supported by grant NSF NRT NRT-FW-HTF: Socially Cognizant Robotics for a Technology Enhanced Society (SOCRATES), No. 2021628.
References
- [1] Alexandre Alahi, Kratarth Goel, Vignesh Ramanathan, Alexandre Robicquet, Li Fei-Fei, and Silvio Savarese. Social lstm: Human trajectory prediction in crowded spaces. In Proceedings of the IEEE conference on computer vision and pattern recognition, pages 961–971, 2016.
- [2] Gianluca Antonini, Santiago Venegas Martinez, Michel Bierlaire, and Jean Philippe Thiran. Behavioral priors for detection and tracking of pedestrians in video sequences. International Journal of Computer Vision, 69(2):159–180, 2006.
- [3] Mathilde Caron, Piotr Bojanowski, Armand Joulin, and Matthijs Douze. Deep clustering for unsupervised learning of visual features. In Proceedings of the European conference on computer vision (ECCV), pages 132–149, 2018.
- [4] Mathilde Caron, Ishan Misra, Julien Mairal, Priya Goyal, Piotr Bojanowski, and Armand Joulin. Unsupervised learning of visual features by contrasting cluster assignments. arXiv preprint arXiv:2006.09882, 2020.
- [5] Guangyi Chen, Junlong Li, Nuoxing Zhou, Liangliang Ren, and Jiwen Lu. Personalized trajectory prediction via distribution discrimination. In Proceedings of the IEEE/CVF International Conference on Computer Vision, pages 15580–15589, 2021.
- [6] Weina Ge, Robert T. Collins, and R. Barry Ruback. Vision-based analysis of small groups in pedestrian crowds. IEEE Transactions on Pattern Analysis and Machine Intelligence, 34(5):1003–1016, 2012.
- [7] Spyros Gidaris, Andrei Bursuc, Nikos Komodakis, Patrick Pérez, and Matthieu Cord. Learning representations by predicting bags of visual words. In Proceedings of the IEEE/CVF Conference on Computer Vision and Pattern Recognition, pages 6928–6938, 2020.
- [8] Spyros Gidaris, Andrei Bursuc, Gilles Puy, Nikos Komodakis, Matthieu Cord, and Patrick Pérez. Online bag-of-visual-words generation for unsupervised representation learning. arXiv preprint arXiv:2012.11552, 2020.
- [9] Francesco Giuliari, Irtiza Hasan, Marco Cristani, and Fabio Galasso. Transformer networks for trajectory forecasting. In 2020 25th International Conference on Pattern Recognition (ICPR), pages 10335–10342. IEEE, 2021.
- [10] Agrim Gupta, Justin Johnson, Li Fei-Fei, Silvio Savarese, and Alexandre Alahi. Social gan: Socially acceptable trajectories with generative adversarial networks. In Proceedings of the IEEE conference on computer vision and pattern recognition, pages 2255–2264, 2018.
- [11] Yutao Han, Rina Tse, and Mark Campbell. Pedestrian motion model using non-parametric trajectory clustering and discrete transition points. IEEE Robotics and Automation Letters, 4(3):2614–2621, 2019.
- [12] Jordi Honey-Rosés, Isabelle Anguelovski, Vincent K Chireh, Carolyn Daher, Cecil Konijnendijk van den Bosch, Jill S Litt, Vrushti Mawani, Michael K McCall, Arturo Orellana, Emilia Oscilowicz, et al. The impact of covid-19 on public space: an early review of the emerging questions–design, perceptions and inequities. Cities & health, 5(sup1):S263–S279, 2021.
- [13] Vineet Kosaraju, Amir Sadeghian, Roberto Martín-Martín, Ian Reid, Hamid Rezatofighi, and Silvio Savarese. Social-bigat: Multimodal trajectory forecasting using bicycle-gan and graph attention networks. Advances in Neural Information Processing Systems, 32, 2019.
- [14] Parth Kothari, Sven Kreiss, and Alexandre Alahi. Human trajectory forecasting in crowds: A deep learning perspective. IEEE Transactions on Intelligent Transportation Systems, 2021.
- [15] Parth Kothari, Brian Sifringer, and Alexandre Alahi. Interpretable social anchors for human trajectory forecasting in crowds. In Proceedings of the IEEE/CVF Conference on Computer Vision and Pattern Recognition, pages 15556–15566, 2021.
- [16] Mihee Lee, Samuel S Sohn, Seonghyeon Moon, Sejong Yoon, Mubbasir Kapadia, and Vladimir Pavlovic. Muse-vae: Multi-scale vae for environment-aware long term trajectory prediction. arXiv preprint arXiv:2201.07189, 2022.
- [17] Alon Lerner, Yiorgos Chrysanthou, and Dani Lischinski. Crowds by example. In Computer graphics forum, volume 26, pages 655–664. Wiley Online Library, 2007.
- [18] Jiachen Li, Fan Yang, Masayoshi Tomizuka, and Chiho Choi. Evolvegraph: Multi-agent trajectory prediction with dynamic relational reasoning. Advances in neural information processing systems, 33:19783–19794, 2020.
- [19] Yuejiang Liu, Qi Yan, and Alexandre Alahi. Social nce: Contrastive learning of socially-aware motion representations. In Proceedings of the IEEE/CVF International Conference on Computer Vision, pages 15118–15129, 2021.
- [20] Karttikeya Mangalam, Harshayu Girase, Shreyas Agarwal, Kuan-Hui Lee, Ehsan Adeli, Jitendra Malik, and Adrien Gaidon. It is not the journey but the destination: Endpoint conditioned trajectory prediction. In European Conference on Computer Vision, pages 759–776. Springer, 2020.
- [21] Abduallah Mohamed, Kun Qian, Mohamed Elhoseiny, and Christian Claudel. Social-stgcnn: A social spatio-temporal graph convolutional neural network for human trajectory prediction. In Proceedings of the IEEE/CVF Conference on Computer Vision and Pattern Recognition, pages 14424–14432, 2020.
- [22] Stefano Pellegrini, Andreas Ess, Konrad Schindler, and Luc Van Gool. You’ll never walk alone: Modeling social behavior for multi-target tracking. In 2009 IEEE 12th international conference on computer vision, pages 261–268. IEEE, 2009.
- [23] Th Robin, Gianluca Antonini, Michel Bierlaire, and Javier Cruz. Specification, estimation and validation of a pedestrian walking behavior model. Transportation Research Part B: Methodological, 43(1):36–56, 2009.
- [24] Amir Sadeghian, Vineet Kosaraju, Ali Sadeghian, Noriaki Hirose, Hamid Rezatofighi, and Silvio Savarese. Sophie: An attentive gan for predicting paths compliant to social and physical constraints. In Proceedings of the IEEE/CVF Conference on Computer Vision and Pattern Recognition, pages 1349–1358, 2019.
- [25] Tim Salzmann, Boris Ivanovic, Punarjay Chakravarty, and Marco Pavone. Trajectron++: Dynamically-feasible trajectory forecasting with heterogeneous data. In European Conference on Computer Vision, pages 683–700. Springer, 2020.
- [26] Nasim Shafiee, Taskin Padir, and Ehsan Elhamifar. Introvert: Human trajectory prediction via conditional 3d attention. In Proceedings of the IEEE/CVF Conference on Computer Vision and Pattern Recognition, pages 16815–16825, 2021.
- [27] Mario L Small and Laura Adler. The role of space in the formation of social ties. Annual Review of Sociology, 45:111–132, 2019.
- [28] Pavel Tokmakov, Martial Hebert, and Cordelia Schmid. Unsupervised learning of video representations via dense trajectory clustering. In European Conference on Computer Vision, pages 404–421. Springer, 2020.
- [29] Anirudh Vemula, Katharina Muelling, and Jean Oh. Social attention: Modeling attention in human crowds. In 2018 IEEE international Conference on Robotics and Automation (ICRA), pages 4601–4607. IEEE, 2018.
- [30] William H Whyte. The design of spaces. In The city reader, pages 631–639. Routledge, 2015.
- [31] William Hollingsworth Whyte et al. The social life of small urban spaces. 1980.
- [32] Hao Xue, Du Q Huynh, and Mark Reynolds. Ss-lstm: A hierarchical lstm model for pedestrian trajectory prediction. In 2018 IEEE Winter Conference on Applications of Computer Vision (WACV), pages 1186–1194. IEEE, 2018.
- [33] Hao Xue, Du Q Huynh, and Mark Reynolds. Poppl: Pedestrian trajectory prediction by lstm with automatic route class clustering. IEEE transactions on neural networks and learning systems, 32(1):77–90, 2020.
- [34] Jia Xue, Hang Zhang, and Kristin Dana. Deep texture manifold for ground terrain recognition. In Proceedings of the IEEE Conference on Computer Vision and Pattern Recognition, pages 558–567, 2018.
- [35] Cunjun Yu, Xiao Ma, Jiawei Ren, Haiyu Zhao, and Shuai Yi. Spatio-temporal graph transformer networks for pedestrian trajectory prediction. In European Conference on Computer Vision, pages 507–523. Springer, 2020.
- [36] Ye Yuan, Xinshuo Weng, Yanglan Ou, and Kris M Kitani. Agentformer: Agent-aware transformers for socio-temporal multi-agent forecasting. In Proceedings of the IEEE/CVF International Conference on Computer Vision, pages 9813–9823, 2021.
- [37] Hang Zhang, Jia Xue, and Kristin Dana. Deep ten: Texture encoding network. In Proceedings of the IEEE conference on computer vision and pattern recognition, pages 708–717, 2017.
- [38] Zhang Zhang, Kaiqi Huang, Tieniu Tan, Peipei Yang, and Jun Li. Red-sfa: Relation discovery based slow feature analysis for trajectory clustering. In Proceedings of the IEEE Conference on Computer Vision and Pattern Recognition, pages 752–760, 2016.