The Bumpy Road of Taking Automated Debugging to Industry
Abstract.
Debugging is arguably among the most difficult and extremely time consuming tasks of the software development life cycle. Therefore, it comes as no surprise that researchers have invested a considerable amount of effort in developing automated techniques and tools to support developers excel in these tasks. Despite the significant advances, including demonstrations of usefulness, efficacy, and efficiency, these techniques are yet to find their way into industrial adoption. In this paper, we reflect upon the commercialization efforts of a particular automated debugging technique and lay down potential reasons for lack of success stories as well as ideas to move forward.
1. Introduction
Debugging is known to be time consuming and tedious task: debugging is the ugly duckling of the software development process; yet every developer is destined to spend significant effort performing this task. The challenge is to find bugs as early and quickly as possible so that software is shipped without defects.
The research community has embraced this challenge and proposed several approaches and techniques to support developers while debugging code bases (Wong et al., 2016). Despite these advances to the state-of-the-art of debugging techniques, there are still no success stories on the world-wide adoption of these techniques by industry.
In fact, there was a recent study on the the dichotomy of debugging behavior among programmers (Beller et al., 2018) were it was confirmed that IDE-based debuggers are not used as often as the so-called “printf debugging”. The authors further of this study mention that their results “call to strengthen hands-on debugging experience in computer science curricula and have already refined the implementation of modern IDE debuggers”.
We have recently embarked in an effort to commercialize a particular automated debugging technique. In the next sections, we outline the automated debugging technique we attempted to commercialize and reflect upon the challenges that prevented successful commercialization. Finally, we conclude with suggestions for the software engineering community to move forward.
2. Automated Debugging
This section discusses the most common automated debugging approaches and a materialization into a toolset of a promising and lightweight technique.
2.1. Debugging Approaches
Debugging techniques exploit information obtained from:
-
(i)
the execution of the program;
-
(ii)
analysis of the behavior of a program or its model; and
-
(iii)
from given specifications.
Automation is essential as the size of programs and obtained information precludes manual investigation, yet different debugging methods remain isolated from each other (Wong et al., 2016).
Statistics-based techniques (e.g., (Pearson et al., 2017)) are popular automated fault localization techniques within the Software Engineering community. They correlate information about program fragments that have been exercised in multiple program execution traces (also called program spectra) with information about successful and failing executions. By doing that, spectrum-based fault localization (SFL) and other statistics-based approaches yield a list of suspect program fragments sorted by their likelihood to be at fault. Since this technique is efficient in practice, it is attractive for large modern software systems (Zoeteweij et al., 2007).
Despite the efforts to advance SFL to efficiently aid programmers to pinpoint the root cause of observed failures, it still has a few drawbacks:
-
•
Spectrum-based fault localization only exploits the topology of the software. Thus, low granularity components (e.g., statement level) will yield the best diagnostic performance, whereas coarser grain granularity may guide the developer to inspect healthy components.
-
•
Due to its statistical foundation, the diagnostic accuracy is inherently limited: (1) the accuracy is rather dependent on the number and quality of the test cases, (2) it cannot reason over multiple faults, like model-based diagnosis approaches.
-
•
The similarities are not probabilities: this hampers the analysis of the ranking using AI, probabilistic methods.
Apart from the aforementioned issues, such lightweight techniques are not yet able to consistently pinpoint a fault, if used in isolation (Abreu et al., 2009). Although SFL methods can identify promising starting points for investigation, further filtering, symptom-based aggregation, model-based reasoning and guidance mechanisms are desired (Parnin and Orso, 2011; Mayer and Stumptner, 2008). Furthermore, multiple simultaneous faults affecting the program are common yet poorly addressed (Debroy and of Texas at Dallas. Graduate Program in Software Engineering, 2011; Abreu et al., 2009).
Despite the aforementioned limitations, we argue that current state-of-the-art approaches carries valuable information to warrant being transferred to industry. In particular, there are materializations of spectrum-based fault localization that are production ready. An example is GZoltar – a technique we will outline next.
2.2. The GZoltar toolset
GZoltar (Campos et al., 2012) is an Eclipse plugin (Burnette, 2005) for automatic testing and debugging. Currently, the toolset is provided as a plugin and library, and integrates seamlessly with the JUnit framework. It is an evolution from Zoltar (Janssen et al., 2009) (addressing the C programming language) and is implemented using Java and analyses programs written in Java. To install the GZoltar toolset, users need to request a license at http://www.gzoltar.com/.
As said before, currently GZoltar offers three distinct visualizations implemented in HTML5: Sunburst (see Figure 1 as an example), Vertical Partition and Bubble Hierarchy. We only show the sunburst visualization due to space limitations; interested readers can refer the the official website to see the other visualizations. Sunburst is also the one preferred by the users (Gouveia et al., 2013). Note that this toolset uses a visualization framework, D3.js, which allows the creation of new visualizations with little effort. D3.js is a JS library which allows the creation of different visual representations of data.
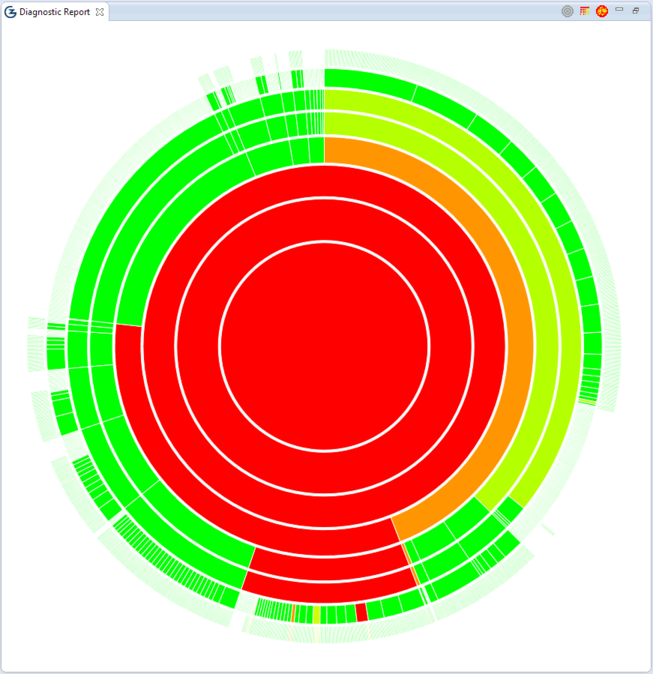
The generated visualizations are interactive, and the user is able to navigate through the project structure to analyze it in detail. The main goal of the visualizations are to represent the analyzed project in an hierarchical way to allow a faster and easier debugging process. For instance, in the Sunburst visualization, each ring denotes an hierarchical level of the source code organization (from the inner to the outer circle).
All visualizations obey to a color gradient ranging from green (low suspiciousness) to red (very high suspiciousness). The suspiciousness is computed by the diagnostic algorithm detailed in (Campos et al., 2012). If all the tests passed (i.e., there were no observed failures), the underlying fault localization technique yields an empty diagnostic report. As such, GZoltar will render a visualization with all the system components in green. It should be noted that this does not mean that the system under test is bug-free, but rather that no failure was observed.
Users are able to navigate and interact with the visualizations. They may analyze each component by hovering the mouse cursor at any element on any visualization and a tooltip is shown with the identification of it and the corresponding suspiciousness value. The user may click on any component representation to automatically open the code editor with the respective source code. Users may also zoom in/out the visualization to analyze in detail a specific part of the system, and pan the visualization. The user may also resize the diagnostic report view at any time to automatically enlarge or reduce the visualization used. There are other navigation features available, but due to space limitations we refrain from explaining them.
The commercial efforts of GZoltar, discussed next, were coined Crowbar instead.
3. Crowbar
As we developed the underline algorithms and techniques in the context of research projects funded by the Portuguese Foundation for Science and Technology (FCT) and the National Science Foundation (NSF), we felt the urge to transfer the technology into industry. In fact, the idea of transferring a toolset offering state-of-the-art automated debugging capabilities was something that came to mind during the course of the TRADER project111https://bit.ly/2JOUBe4. The objective of the TRADER project, funded by the Dutch Ministry of Economic Affairs, was to develop methods and tools for ensuring reliability of consumer electronic products. The objective was to minimize product failures that are exposed to the end user. The proposed techniques were evaluated using use cases from Philips Semiconductors’ Innovation Center Eindhoven in the area of digital television.
We assembled a team consisting of a Head of Engineering, developers (mostly PhD students), and a business developer (at the time a final-year master student in the Master in Innovation and Technological Entrepreneurship at the University of Porto222https://bit.ly/2LNqxwO). To get the ball rolling, we started by applying to UPTEC’s333UPTEC - Science and Technology Park of University of Porto supports the creation of technological, scientific and creative based companies and attracts national and international innovation centers. Startup Acceleration Program. The idea of this program is to to raise awareness among new entrepreneurs about the complex challenges in the process of creating and developing a business project. The Acceleration Program culminated with a Startup Pitch Day – which we won 444https://bit.ly/2Ml2lmu.
Winning the Startup Day helped to raise awareness and gave us momentum. As the project started to gain traction, we were invited to TV programs and were featured in specialized magazines. More importantly, though, companies started to reach out to us to better understand our technology and offer themselves to help in the industrial validation of the tool.
The industrial validation, however, proved to be extremely challenging. Finding industrial partners to try our tools out was not as difficult as one would imagine, but having the tools bullet proof to all sorts of situations was far from a reality. Due to confidentiality reasons, we cannot name our industrial partners. Rest assured that the industrial partners came from all industrial domains: from aerospace to banking and automotive industries.
Regardless of the technological challenges, we have engaged in discussions with a Venture Capital firm (VC). Once again, due to confidentiality reasons, the VC cannot be named. The VC has valued our prototype in 2 million euro, and they would be willing to invest 500k euro. However, we did not reach an agreement because the milestones were not realistic and the VC was not willing to take the necessary risk. This was a considerable blow in our efforts.
4. Challenges
In our efforts to incorporate a startup to offer automated debugging techniques we have faced several hurdles. We next discuss these challenges and outline potential solutions.
-
•
The core team was not 100% committed to the commercialization effort.
The engineering team was composed mostly of PhD students. This meant that there were some opposing forces which were difficult to manage. On the one hand, the students wanted to do a prototype to get results for the next paper, but on the other hand our industrial partners wanted mature tools to play with.
-
•
The way researchers evaluate their techniques do not mimic software developer debugging observed failures.
Most research on automated fault localization use metrics that completely disregard the human factor (Parnin and Orso, 2011; Gouveia et al., 2013). For instance, such metrics assume perfect bug understanding by developers and that developers would religiously follow the ranked list of suspicious statements given by the automated fault localization tool. This is just not right (Zoeteweij et al., 2007). In fact, extensive user studies are needed to understand whether diagnostic reports generated by current state-of-the-art techniques are indeed able to convey actionable insights once the human factor is considered. User studies require considerable effort and it might the a good idea to create a world-wide consortium of researchers and people from industry to carry a comprehensive user study to understand where we stand.
-
•
Top-level managers do not see the added value of paying a debugging technique.
In most conversations with several industrial partners (both in Portugal and in the Silicon Valley) a common comment came up: as a top-level manager I only see code that is ready to deploy. In other words, despite the several stories of software failures, top-level managers assume that this is a problem that is not going to affect them because they have hired the most stellar software engineers. However, as you can imagine, even the most stellar software engineers commit mistakes. We need a novel way to quantify the gains for the business of having automated debugging techniques helping the debugging process.
-
•
Code instrumentation challenges.
Our team faced several challenges maturing our code instrumentation toolset to gather the test-coverage information required for our diagnostic analysis. Although we managed to improve the toolset at a considerably fast pace, our industrial partners would frequently face issues regarding the instrumentation. In several cases, even after signing non-disclosure agreements, we were unable to gather and collect metrics that would help us pinpoint the root cause, much less were we able inspect the source code that caused such instrumentation to fail. Interestingly, we have ensured that our tools – which were initially developed in an academic context – performed reliably in hundreds of open-sourced projects (as evidenced by the breadth of projects the empirical evaluations cover (Pearson et al., 2017; Perez et al., 2017a)). This suggests that there is some disconnect between open-sourced software and its close-sourced counterpart, at least regarding the use language features and the choice of architectures, impacting the way code coverage needs to be instrumented, orchestrated, and gathered.
-
•
Test Cases: The Holy Grail.
Most companies do not have a systematic way to test their apps. This becomes a challenge as SFL is a dynamic technique that requires the system to be exercised with a diverse set of cases. If test cases do not exist, then SFL-like techniques will not be of any help. This challenge highlights the need to offer integrated solutions to automated test case generation and debugging. One of the major challenges is to solve the oracle problem, as there are independent techniques for both tasks. For instance, EvoSuite (Fraser and Arcuri, 2011) for test case generation and GZoltar for debugging. A technique that is able to automatically assert whether a test case passes or fails will have a tremendous contributions in making techniques such as GZoltar being mass-adopted in industry.
Yet another challenge related to test cases is that only recently the community started to investigate what properties of a test suite make it suitable for automated debugging (Perez et al., 2017b). This understanding is however crucial if one plans to use automated debugging techniques effectively. Recently, we proposed a metric, DDU (Perez et al., 2017b), that quantifies the diagnosability of a test suite. This metric evaluates several interesting properties of a test suite regarding its ability to isolate faults and has the potential to either replace or co-exist with the more common coverage metrics. DDU information helps to rethink how to evolve the test suite: e.g., adding more unit tests or system tests. Yet another added value is that DDU can be used to guide automated test generation techniques, such as the work in (Campos et al., 2013, 2014). However to foster adoption of DDU – and hence automated debugging techniques – researchers still need to find a way to convey that metric to the developer (again, explainability is a concern). Also, there are no studies as to whether the metric has the capability of quantifying the testability of a test suite.
-
•
Diagnostic Reports: Interpretation and Expectations.
Most fault localization techniques output a ranked list of components, possibly with a probability of that component be the true faulty component. As the developer looks into the ranking, there is no information as to why a given statement is considered to be potentially faulty. Furthermore, there is also no contextual information about observations in failed and passed executions in the diagnostic report. In other words, one is offered no explanation that would help understand the ranked list of suspicious components. An approach was recently proposed (Perez and Abreu, 2018) to augment the ranking with qualitative, contextual information as an attempt to explain the ranking. This work lays the first stone in a series of efforts to more deeply integrate reasoning-based Artificial Intelligence approaches into SFL. Notably, it paves the way for further efforts by the fault localization research community, namely by: (1) Improving automated landmarking by expanding its application to complex non-primitive objects and by exploring ensembles of multiple strategies; (2) Conducting a systematic user study investigating the extent that qualitative domain partitioning aids bug understanding.
Another challenge that needs to be addressed is the fact that developers need to be educated on the capabilities of the tool as to set proper expectations. The tool is just an aid to help developers debug failures and one should take the diagnostic reports: there might be false positives ranking as high as faulty statements. Addressing this challenge would require to include such techniques in course work of undergraduate curricula.
-
•
Multi-platform and development environments.
The current version of the tool is offered as an Eclipse IDE only. This hinders adoption by industrial partners. Support to other environments would potentially increase wide adoption. An idea that comes to mind is to integrate the toolset into the CI/CD pipeline – an analysis will be performed when a pull request is made and the developer would get the visual diagnostic report as a comment to the pull request is something fails.
5. Conclusions
Transferring automated fault localization techniques to industry has been far from trivial. Given the challenges outlined in the previous section, we urge the software engineering community to create an interest group, including groups in academia and industry, to publicly promote and create advantages seeking wide adoption of automated debugging techniques. The main goal of such interest group would be to develop an open source platform offering automated testing and fault localization techniques.
As starting point, we would suggest to extend current standard debugging techniques (e.g. breakpoints) of IDEs, such as Jetbrain’s IntelliJ and Microsoft Visual Studio Code, with automated debugging tools. This is aligned with the most common feedback we obtained: gain traction by offering these techniques publicly on commonly used IDEs. Without the tool vendors on board, it becomes extremely difficult to succeed.
To encourage developers and companies alike to voluntarily participate in this interest group, we further suggest that the modus operandi of this group to follow the free and open-source software principles: so that anyone is freely licensed to use, copy, study, and change the software in any way, and the source code is openly shared so that people are encouraged to contribute. The interest group should further seek a sponsorship model among all participants.
We are hopeful that this paper lays the first stone towards this interest group and that next steps are discussed at the conference.
Audere est facere.
References
- (1)
- Abreu et al. (2009) Rui Abreu, Peter Zoeteweij, and Arjan J. C. van Gemund. 2009. Spectrum-based Multiple Fault Localization. In Proceedings of the IEEE/ACM International Conference on Automated Software Engineering (ASE’09), Gabriele Taentzer and Mats Heimdahl (Eds.). IEEE Computer Society, to appear, Auckland, New Zealand.
- Beller et al. (2018) Moritz Beller, Niels Spruit, Diomidis Spinellis, and Andy Zaidman. 2018. On the Dichotomy of Debugging Behavior Among Programmers. In International Conference on Software Engineering (ICSE 2018).
- Burnette (2005) Ed Burnette. 2005. Eclipse IDE Pocket Guide. O’Reilly Media, Inc.
- Campos et al. (2013) José Campos, Rui Abreu, Gordon Fraser, and Marcelo d’Amorim. 2013. Entropy-based test generation for improved fault localization. In 2013 28th IEEE/ACM International Conference on Automated Software Engineering, ASE 2013, Silicon Valley, CA, USA, November 11-15, 2013. 257–267.
- Campos et al. (2014) José Campos, Andrea Arcuri, Gordon Fraser, and Rui Abreu. 2014. Continuous test generation: enhancing continuous integration with automated test generation. In Proceedings of the 29th ACM/IEEE international conference on Automated software engineering. ACM, 55–66.
- Campos et al. (2012) José Campos, André Riboira, Alexandre Perez, and Rui Abreu. 2012. GZoltar: An eclipse plug-in for testing and debugging. In IEEE/ACM International Conference on Automated Software Engineering, ASE’12, Essen, Germany, September 3-7, 2012. 378–381.
- Debroy and of Texas at Dallas. Graduate Program in Software Engineering (2011) V. Debroy and University of Texas at Dallas. Graduate Program in Software Engineering. 2011. Towards the Automation of Program Debugging. http://books.google.pt/books?id=hBEUtwAACAAJ
- Fraser and Arcuri (2011) Gordon Fraser and Andrea Arcuri. 2011. EvoSuite: automatic test suite generation for object-oriented software. In SIGSOFT/FSE’11 19th ACM SIGSOFT Symposium on the Foundations of Software Engineering (FSE-19) and ESEC’11: 13th European Software Engineering Conference (ESEC-13), September 5-9, 2011. 416–419.
- Gouveia et al. (2013) Carlos Gouveia, José Campos, and Rui Abreu. 2013. Using HTML5 visualizations in software fault localization. In 2013 First IEEE Working Conference on Software Visualization (VISSOFT), Eindhoven, The Netherlands, September 27-28, 2013. 1–10. https://doi.org/10.1109/VISSOFT.2013.6650539
- Janssen et al. (2009) Tom Janssen, Rui Abreu, and Arjan J. C. van Gemund. 2009. Zoltar: A Toolset for Automatic Fault Localization. In Proceedings of the 2009 IEEE/ACM International Conference on Automated Software Engineering (ASE ’09). IEEE Computer Society, Washington, DC, USA. https://doi.org/10.1109/ASE.2009.27
- Mayer and Stumptner (2008) Wolfgang Mayer and Markus Stumptner. 2008. Evaluating Models for Model-Based Debugging. In 23rd IEEE/ACM International Conference on Automated Software Engineering (ASE 2008), 15-19 September 2008, L’Aquila, Italy. 128–137. https://doi.org/10.1109/ASE.2008.23
- Parnin and Orso (2011) C. Parnin and A. Orso. 2011. Are automated debugging techniques actually helping programmers?. In Proceedings of International Symposium on Software Testing and Analysis (ISSTA’11). 199–209.
- Pearson et al. (2017) Spencer Pearson, José Campos, René Just, Gordon Fraser, Rui Abreu, Michael D. Ernst, Deric Pang, and Benjamin Keller. 2017. Evaluating and improving fault localization. In Proceedings of the 39th International Conference on Software Engineering, ICSE 2017, Buenos Aires, Argentina, May 20-28, 2017. 609–620. https://doi.org/10.1109/ICSE.2017.62
- Perez and Abreu (2018) Alexandre Perez and Rui Abreu. 2018. Leveraging Qualitative Reasoning to Improve SFL. In Proceedings of the 27th International Joint Conference on Artificial Intelligence and the 23rd European Conference on Artificial Intelligence, IJCAI-ECAI 2018, Stockholm, Sweden, July 13-19. 1–10.
- Perez et al. (2017a) Alexandre Perez, Rui Abreu, and Marcelo d’Amorim. 2017a. Prevalence of Single-Fault Fixes and Its Impact on Fault Localization. In Proceedings of the IEEE International Conference on Software Testing, Verification and Validation, ICST’17, Tokyo, Japan, March 13-17. 12–22. https://doi.org/10.1109/ICST.2017.9
- Perez et al. (2017b) Alexandre Perez, Rui Abreu, and Arie van Deursen. 2017b. A Test-Suite Diagnosability Metric for Spectrum-based Fault Localization Approaches. In Proceedings of the 39th International Conference on Software Engineering, ICSE’17, Buenos Aires, Argentina, May 20-28. 654–664. https://doi.org/10.1109/ICSE.2017.66
- Wong et al. (2016) W. Eric Wong, Ruizhi Gao, Yihao Li, Rui Abreu, and Franz Wotawa. 2016. A Survey on Software Fault Localization. IEEE Transactions on Software Engineering 42, 8 (2016), 707–740. https://doi.org/10.1109/TSE.2016.2521368
- Zoeteweij et al. (2007) Peter Zoeteweij, Rui Abreu, Rob Golsteijn, and Arjan J. C. van Gemund. 2007. Diagnosis of Embedded Software Using Program Spectra. In 14th Annual IEEE International Conference and Workshop on Engineering of Computer Based Systems (ECBS 2007). 213–220.