Thermoelectric properties of Sb doped AlFe2B2
Abstract
In this work, thermoelectric properties of Al1.2Fe2B2 compound were investigated over a temperature range from 300 K to 773 K. Al1.2Fe2B2 compound was produced by vacuum arc melting of Al, Fe, and B followed by annealing at 1323 K under argon atmosphere. The annealed ingots were subsequently crushed into powder and hot pressed at 1273 K under vacuum. The hot-pressed alloy predominantly contained Al1.2Fe2B2 phase with a small fraction of FeB, which decreases further upon 0.1 % Sb doping in Al1.2Fe2B2. The pristine Al1.2Fe2B2 exhibits n-type conductivity with a maximum figure of merit (zT) of 0.03 at 773 K. The Sb doping improves the Seebeck coefficient at high temperatures and also reduces the phonon thermal conductivity across the temperature range studied. The decrease in phonon thermal conductivity is attributed to the point-defect phonon scattering due to mass fluctuation between the Fe and Sb atoms. The 0.1 at% Sb doping at the Fe site results in improved zT of 0.056 at 773 K in spite of its limited dissolution in Al1.2Fe2B2 and forms FeSb2 secondary phase.
I Introduction
Thermoelectric (TE) power generation in recent years has been explored for several innovative applicationsR1 . The direct conversion of heat into electricity using this solid–state method
provides an opportunity to produce power from different thermal energy sources. The utility of a TE device depends on TE material properties, which are quantified by a figure of merit (zT), defined as zT = (T)/. An optimized value of the Seebeck coefficient (), electrical conductivity () and thermal conductivity () is desired to obtain enhanced zT, owing to the interdependence of these parameters on carrier concentration, band structure, and charge scatteringR2 . Promising p– and n-type TE materials such as PbTe, GeTe, and CoSb3 have been investigated following several novel approaches including band convergenceR3 , Fermi-level optimization R4 , resonance level doping R5 , crystal structure modification R6 ; R7 high-entropy conceptR8 ; R8a , composite methods R9 ; R9a etc. However, the relatively low TE conversion efficiency and high material costs are the major challenges that inhibit large-scale applications of these materials. Replacing the expensive compounds with environment-friendly and abundantly available elements can significantly reduce device costs.
Al1.2Fe2B2 is one such compound; however, not been investigated in detail so far for its TE properties. It is a ferromagnetic compound known for its Curie temperature close to room temperature with promising magnetocaloric applications.R10 ; R11 Several methods, including melting R10 ; R11 , melt spinning R12 , and spark plasma sintering of elemental powders R13 have been used to synthesize this compound. The phase formation from the melt during solidification follows peritectic reaction and demands proper control of Al content to avoid the impurity phases viz. FeB and Al13Fe4 R10 ; R11 ; R12 . The FeB forms when Al content is sub-stoichiometry, whereas the excess amount leads to the formation of Al13Fe4. The Al13Fe4 impurity is usually removed by etching with dilute HCl acid. R10 ; R11 ; R12
Al1.2Fe2B2 crystallizes in a layered orthorhombic structure in which, Fe2B2 slabs are stacked between aluminum layers.R14 It shows metallic nature that results in higher and , and, lower , and hence, requires optimization of electronic structure to improve TE properties. With this aim, we demonstrate the effect of Sb alloying on TE properties of earth-abundant Al1.2Fe2B2. The Sb substitution has shown improved TE properties, i.e. increased Seebeck coefficient and electrical resistivity compared to the parent compound.
II Experimental Details
The Al1.2Fe2B2 and Al1.2Fe1.9Sb0.1B2 compounds were synthesized by vacuum arc melting of Al
(99.9%, American elements), Fe (99.9%, 3.2–6.4 mm, Alfa Aesar), B (99.5%, 20 mm, Thermofisher Scientific) and Sb (99.9% American elements) were weighed according to the stoichiometric composition. A 20 wt.% excess Al was added to compensate for the losses during arc melting. The solidified ingots were annealed for 96 h at 1323 K under argon, and ground into powder. The powder was subsequently consolidated by a vacuum (510-5 mbar) hot pressing at 1273 K for 2 h under 50 MPa pressure to 20 mm diameter pellets. The structural characterization was performed using a Rigaku Smart Lab X–ray powder diffractometer (Cu-Kα, =0.15406 nm) with a step of 0.01 and scan range from 20–80∘ at 1∘/min scan rate. The microstructural observation was done using field emission scanning electron microscope (FE–SEM; Zeiss Merlin, Germany). Chemical analysis of various phases present in the microstructure was carried out using energy dispersive X–ray spectrometry (EDS). The Seebeck coefficient, electrical conductivity was measured using a standard four-probe method
(Seebsys system: NorECS AS, Norway). Thermal conductivity (=D Cp ) was measured using the thermal diffusivity (D), specific heat (Cp) and sample density (). The D
measurements were performed using the laser flash technique (LFA–457, Netsch GmbH, Germany) on a cylindrical sample having 10 mm diameter and 2 mm thickness. The Cp was obtained using Dulong–Petit law. The sample density () was measured using the Archimedes method.
sample Phases Lattice parameters Phase a () b () c () % Al1.2Fe2B2 Al1.2Fe2B2 2.924 (5) 11.033 (9) 2.871 (1) 93.12 1.42 FeB 4.095 (5) 5.520 (6) 2.886 (8) 6.88 Al1.2Fe1.9Sb0.1B2 Al1.2Fe1.9Sb0.1B2 2.915 (4) 11.025 (8) 2.873 (7) 99.42 2.25 FeB 4.102 (5) 5.306 (4) 2.803 (8) 0.58
III Results and Discussion
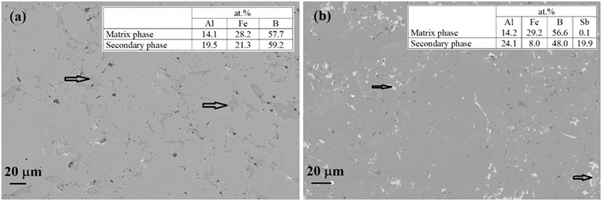
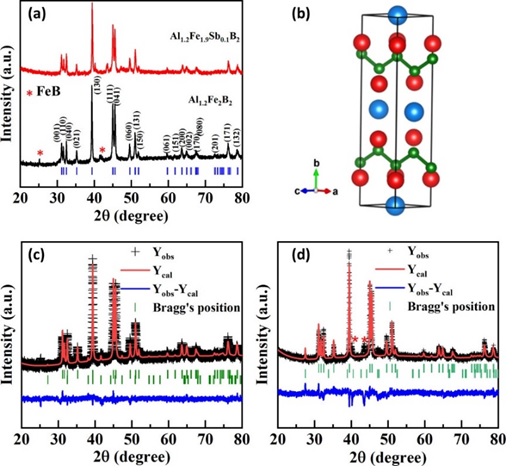
Fig. 1(a) shows the XRD patterns of hot-pressed Al1.2Fe2B2 and Al1.2Fe1.9Sb0.1B2 samples. The major peaks in the pattern can be indexed to Al1.2Fe2B2 [ICSD reference: 98–000–7593] having
an orthorhombic crystal structure, with a few minor peaks corresponding to FeB [ICSD reference:
00-002-0869] impurity (marked by in Fig. 1(a)). It is found that a peak corresponding to
Al13Fe4 phase is seen in the Al1.2Fe2B2 synthesized with 30% excess Al samples (XRD pattern
not given). It indicates that 20% excess Al addition in the starting stoichiometry compensates
for the losses during synthesis by arc melting, which is optimum. Further, the XRD diffraction
pattern of the Sb substituted sample shows a similar diffraction pattern, with additional two minor peaks
of FeSb2 are also observed at 40.2∘ and 44.1∘, which indicates that 0.1 at% of Sb is the higher side of the solubility limit. The intensity corresponding to the FeB phase in Sb-doped Al1.2Fe2B2 sample reduces, indicating the Sb doping helps to obtain a near single phase of Al1.2Fe2B2. Further, two-phase Rietveld refinement of the XRD pattern was done using Fullprof software, considering Al1.2Fe2B2 as primary (Pbnm) and FeB (Pbnm) as the secondary phases. The refinement patterns for Al1.2Fe2B2 and Sb-doped Al1.2Fe2B2 are shown in Fig. 1(c-d) and the corresponding refinement parameters are shown in Table I. It is seen that the phase fraction for the FeB, obtained from the refinement, reduces in Sb doped sample. The goodness of fit () is in the acceptable limit for both samples. Further, the refinement parameters are used to create the structure of the unit cell using Vesta softwareR14a as shown in Fig. 1b.
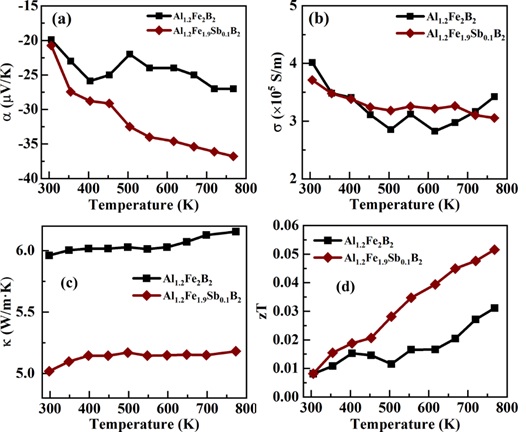
Fig. 2(a–b) shows the SEM micrographs of Al1.2Fe2B2 and Sb doped Al1.2Fe2B2 samples. The
microstructure of Al1.2Fe2B2 is homogeneous with a small volume of secondary phase/s constituted
of Fe, Al, and B. The atomic ratio values mentioned in the inset of Fig. 2(a,b) are the average
values taken at various spots within the cross-section of the sample. As it is difficult to quantify
boron using EDS, Al: Fe ratio was used to measure the stoichiometry. The ratio in Al1.2Fe2B2
sample is 0.46 for region AlFe1+xB2, which is close to the ratio for Al1.2Fe2B2 compound (0.5)
and the secondary phase/s is the (FeAl)B1+x phase. From the XRD results, it is evident that the
secondary phase/s is predominantly constituted of FeB, however, the EDS analysis suggests the
composition of the second phase region is a nearly equiatomic ratio of Al and Fe. From the
established Al-Fe-B ternary equilibrium phase diagramR15 ; R16 , it is clear that the line
compound Al1.2Fe2B2, under off stoichiometry of Al depletion, form FeB, FeAl2 and B phases
along with Al1.2Fe2B2 phase. The comparable atomic fraction observed in the EDS analysis for
both Fe and Al suggests that the secondary phases observed may also contain the FeAl2 phase apart
from FeB. In Al1.2Fe1.9Sb0.1B2 the Al to Fe ratio was 0.48–0.49, and the secondary phases
consisted of relatively higher Sb than matrix Al1.2Fe2B2 phase. The 0.1 at.% Sb added largely
makes into secondary phase/s, and only a small fraction dissolves in Al1.2Fe2B2 matrix. The
presence of minor peaks in the XRD pattern of Sb doped Al1.2Fe2B2Sb closely matches with
FeSb2 phase strengthening the view that Sb mostly segregates to the secondary phase. AlB2 and
AlB12 are some of the other possible constituents that can form as secondary phases under off stoichiometry of Fe depletion from Al1.2Fe2B2 stoichiometry. However, no observable peak
corresponding to these phases was present in the XRD pattern.
Fig. 3(a) depicts the temperature-dependent Seebeck coefficient () for Al1.2Fe2B2 and
Al1.2Fe1.9Sb0.1B2 samples. The negative values for indicate that the samples have dominant n-type carriers. The value of (-20 V/K at 300 K) obtained in pristine Al1.2Fe2B2 matches with the reported values in the literature.R18 The Sb substitution improves ; however, its effect is particularly notable at elevated temperatures. The for Al1.2Fe1.9Sb0.1B2 is -38 V/K at 773 K higher than that of pristine Al1.2Fe1.2B2 (-27 V/K). The electrical conductivity () as a function of temperature is shown in Fig. 3(b). The measured ( 4105 S/m at 300 K) is slightly higher than the value reported (3.7105 S/m at 300 K) for Al1.2Fe2B2 compound.R17 This difference in can be attributed to the chemical homogeneity
in the present work, as the samples were prepared using arc melting, annealing, crushing, and
hot pressing. Whereas, the samples reported in the literature were arc-melted followed by
annealing. The Sb alloying seems to be marginally affecting the . However, at elevated
temperatures, the electrical conductivity of pure and Sb-doped samples is comparable. Fig. 3(c) shows the temperature-dependent thermal conductivity () for Al1.2Fe2B2 and
Al1.2Fe1.9Sb0.1B2. The thermal conductivity for Al1.2Fe2B2 is 6 W/m·K at 300 K, which is in good agreement with the previously reported value.R18 The Sb doping noticeably decreases the thermal conductivity across the temperature range of testing. It is known that the total thermal conductivity consists of electronic () as well as phonon thermal conductivities () i.e.,(). The is proportional to the electrical conductivity, according to Wiedemann Franz law. From Fig. 3(b), it was also found that the electrical conductivity was almost similar for both the samples, and hence their electronic contribution to thermal conductivity might be similar, considering the metallic nature of the sample. This further suggests that Sb doping reduces the phonon thermal conductivity resulting in lower thermal conductivity. This decrease in lattice thermal conductivity may be attributed to the point-defect phonon scattering by mass fluctuation between host atoms (Fe) and dopants (Sb).R19 Further, as found in the XRD and SEM analysis, some FeSb2 impurity present in the Sb-doped Al1.2Fe2B2 sample further result in reduced thermal conductivity.
The thermoelectric parameters (, , and ) measured in this study have been used to calculate the thermoelectric figure of merit (zT) and its variation with temperature is shown in Fig. 3(d). The zT for pristine Al1.2Fe2B2 sample is 0.03 at 773 K, which is almost the first report in t conductivity in Sb doped Al1.2Fe2B2 results in improved zT. A maximum zT of 0.056 is achieved at 773 K for Al1.2Fe1.9Sb0.1B2. Moreover, the compound having earth-abundant elements with enhanced electrical conductivity and the possibility to reduce the phonon thermal
conductivity makes it interesting for further investigation concerning the optimization of carrier
concentration and band structure, which can significantly improve its TE performance.
IV Conclusion
Earth-abundant Al1.2Fe2B2 and Al1.2Fe1.9Sb0.1B2 are synthesized using a vacuum arc melting. The X-ray diffraction analysis followed by two-phase Rietveld refinement showed the presence of a smaller quantity (6.9 wt.%) of FeB secondary phase along with Al1.2Fe2B2. The phase fraction corresponding to the FeB phase reduces (0.6 wt.%) in Sb doped Al1.2Fe2B2 sample. The metallic nature of pristine Al1.2Fe2B2 shows a high electrical conductivity but a low Seebeck coefficient and large thermal conductivity. However, Sb doping improves the Seebeck coefficient with almost similar electrical conductivity and decreases the total thermal conductivity via decreased phonon thermal conductivity. As a result of the simultaneous increase in the Seebeck coefficient and decrease in thermal conductivity, an improved figure of merit (zT) of 0.056 at 773 K for Al1.2Fe1.9Sb0.1B2.
References
- (1) N. Jaziri, A. Boughamoura, J. Müller, B. Mezghani, F. Tounsi, M. Ismail, A comprehensive review of thermoelectric generators: technologies and common applications, Energy Rep. 6 (2020) 264–287. https://doi.org/10.1016/j.egyr.2019.12.011.
- (2) G. Tan, L.D. Zhao, M.G. Kanatzidis, Rationally designing high-performance bulk thermoelectric materials, Chem. Rev. 116 (2016) 12123–12149. https://doi.org/10.1021/acs.chemrev.6b00255.
- (3) P. Jood, J. P. Male, S. Anand, Y. Matsushita, Y. Takagiwa, M. G. Kanatzidis, G. J. Snyder, M. Ohta, Na doping in PbTe: solubility, band convergence, phase boundary mapping, and thermoelectric properties, J. Am. Chem. Soc. 142 (2020) 15464–15475.
- (4) P. Wei, C. Cai, C. Hsing, C. Wei, S. Yu, H. Wu, C. Chen, D. Wei, D. Nguyen, Mitch M. C. Chou, Y.Y. Chen, Enhancing thermoelectric performance by Fermi level tuning and thermal conductivity degradation in (Ge1-xBix)Te crystals, Sci. Rep. 9 (2019) 8616.
- (5) P. Nieroda, K. Kutorasinski, J. Tobola, K.T. Wojciechowski, Search for resonantlike impurity in Ag-doped CoSb3 skutterudite: theoretical and experimental study, J. Eletron. Mater. 43 (2013) 1-8.
- (6) X. Zhang, Z. Bu, S. Lin, Z. Chen, W. Li, Y. Pei., GeTe thermoelectrics, Joule 4 (2020) 986-1003.
- (7) A. Kumar, P. Bhumla, T. Parashchuk, S. Baran, S. Bhattacharya, K.T. Wojciechowski, Engineering electronic structure and lattice dynamics to achieve enhanced thermoelectric performance of Mn–Sb co-doped GeTe, Chem. Mater. 33 (2021) 3611–3620. https://doi.org/10.1021/acs.chemmater.1c00331.
- (8) J. Yang, G. Liu, H. Wang, F. Shi, X. Tan, Z. Ge, J. Jiang, Ultralow thermal conductivity and improved ZT of CuInTe2 by high entropy structure design, Mater. Today Phys. 18 (2021) 100394.
- (9) A. Kumar, D. Dragoe, D. Berardan, N. Dragoe, Thermoelectric properties of high-entropy rare-earth cobaltates, Journal of Materiomics. (2022). https://doi.org/10.1016/j.jmat.2022.08.001.
- (10) B. Feng, J. Xie, G. Cao, T. Zhu, X. Zhao, Enhanced thermoelectric properties of ptype CoSb3/graphene nanocomposite, J Mater. Chem. A. 1 (42) 2013.
- (11) A. Kumar, P. Bhumla, A. Kosonowski, K. Wolski, S. Zapotoczny, S. Bhattacharya, K. Wojciechowski, Synergistic effect of workfunction and acoustic impedance mismatch for improved thermoelectric performance in GeTe/WC composite, ACS Applied Materials and Interfaces 14 (39) (2022) 44527-44538 https://doi.org/10.1021/acsami.2c11369
- (12) M. ElMassalami, D. da S. Oliveira, H. Takeya, On the ferromagnetism of Al1.2Fe2B2, J. Magn. Magn. Mater. 323 (2011) 2133–2136. https://doi.org/10.1016/j.jmmm.2011.03.008.
- (13) X. Tan, P. Chai, C.M. Thompson, M. Shatruk, Magnetocaloric effect in AlFe2B2 : toward magnetic refrigerants from earth-abundant elements, J. Am. Chem. Soc. 135 (2013) 9553–9557. https://doi.org/10.1021/ja404107p.
- (14) Q. Du, G. Chen, W. Yang, Z. Song, M. Hua, H. Du, C. Wang, S. Liu, J. Han, Y. Zhang, J.Yang, Magnetic properties of AlFe2B2 and CeMn2Si2 synthesized by melt spinning of stoichiometric compositions. Japanese Journal of Applied Physics 54, (2015) 053003.
- (15) S. Hirt, F. Yuan, Y. Mozharivskyj, H. Hillebrecht, AlFe2-xCoxB2 (x=0-0.3): TC tuning through Co substitution for a promising magnetocaloric material realized by spark plasma sintering, Inorg. Chem. 55 (2016) 9677-9684.
- (16) W. Jeitschko, The crystal structure of Fe2AlB2, Acta Crystallogr. Sect. B Struct.Crystallogr. Cryst. chem. 25 (1969) 163–165. https://doi.org/10.1107/S0567740869001944.
- (17) K. Momma, F. Izumi, VESTA 3 for three-dimensional visualization of crystal, volumetric and morphology data, J. Appl. Cryst. 44 (2011) 1272-1276.
- (18) G. Ghosh, The Al-B-Fe (Aluminum-Boron-Iron) system. Bull. Alloy Phase Diag. 10, (1989) 667–668. https://doi.org/10.1007/BF02877641.
- (19) G.A. Panov, M.A. Zakharov, Phase diagram calculation of A III B V binary solutions of the eutectic type in the generalized lattice model, J. Phys. Conf. Ser. 643 (2015) 012102. https://doi.org/10.1088/1742-6596/643/1/012102
- (20) E.M. Levin, B.A. Jensen, R. Barua, B. Lejeune, A. Howard, R.W. McCallum, M.J. Kramer, L.H. Lewis, Effects of Al content and annealing on the phases formation, lattice parameters, and magnetization of AlxFe2B2 (X=1.0, 1.1, 1.2), Phys. Rev. Mater. 2 (2018) 034403. https://doi.org/10.1103/PhysRevMaterials.2.034403.
- (21) L.H. Lewis, R. Barua, B. Lejeune, Developing magnetofunctionality: coupled structural and magnetic phase transition in AlFe2B2, J. Alloys Compd. 650 (2015) 482–488. https://doi.org/10.1016/j.jallcom.2015.07.255.
- (22) Ravich, SEMICONDUCTING LEAD CHALCOGENIDES, 2013. https://doi.org/10.1017/CBO9781107415324.004