Charge density wave induced nodal lines in LaTe3
Abstract
LaTe3 is a noncentrosymmetric (NC) material with time reversal (TR) symmetry in which the charge density wave (CDW) is hosted by the Te bilayers. Here, we show that LaTe3 hosts a Kramers nodal line (KNL), a twofold degenerate nodal line that connects the TR invariant momenta in NC achiral systems, using angle resolved photoemission spectroscopy (ARPES), density functional theory (DFT), effective band structure (EBS) calculated by band unfolding, and symmetry arguments. DFT incorporating spin-orbit coupling (SOC) reveals that the KNL – protected by the TR and lattice symmetries – imposes gapless crossings between the bilayer-split CDW-induced shadow bands and the main bands. In excellent agreement with the EBS, ARPES data corroborate the presence of the KNL and show that the crossings traverse the Fermi level. Furthermore, spinless nodal lines – entirely gapped out by the SOC – are formed by the linear crossings of the shadow and main bands with a high Fermi velocity.
I Introduction
Recent years have witnessed a rapid development in the understanding of the physics of cooperative charge density wave (CDW) electronic state [1, 2, 3, 4, 5, 6, 7, 8, 9, 10, 11, 12]. In particular, interplay of the CDW electronic state with the non-trivial topological phases provides an interesting platform for discovery of novel quasiparticles such as, axionic insulator [3, 13], quantum spin-hall insulator [14], fractional Chern insulator states [15] and manipulation of topologically protected states [16, 17]. CDW can drive topological phase transitions by modifying the symmetry of the lattice, such as breaking the inversion symmetry [18]. Interesting topological phases are frequently found in noncentrosymmetric materials, such as, nodal chain fermions [19], Dirac and Weyl fermions [20, 21, 22], hourglass fermions protected by glide reflection [23], Kramers Weyl semimetal (KWS) [24] and recently predicted Kramers nodal line (KNL) metal [25]. KNLs differ from the Weyl nodal lines because they join two time reversal invariant momenta (TRIM) points and should appear in all achiral noncentrosymmetric time reversal symmetry (TRS) preserving systems [25]. For the subclass of nonsymmorphic symmetry, KNLs emerge from the points. Unlike the previously known nodal lines manifested by band inversion[26], the KNLs are robust under spin-orbit coupling (SOC) unless the protecting lattice symmetries such as TRS, mirror, or roto-inversion symmetries are broken. KNL fermions have been predicted to exhibit novel physical properties such as quantized optical conductivity [25]. However, in this emerging field, to the best of our knowledge, the experimental evidence of KNL is limited to the work by Shang et al. [27] who reported that transition metal ruthenium silicides belong to this class and exhibit unconventional superconductivity based on muon spin spectroscopy and density functional theory (DFT).
In recent years, multiple fascinating findings in LaTe3 [1, 7, 28, 4, 29, 30] – a member of the RTe3 (R represents a rare earth element) family with highest CDW transition temperature of 670 K [31, 32] – have rekindled the scientific interest of the community in this noncentrosymmetric TRS preserving material. The detection of an axial Higgs boson mode in LaTe3 from Raman spectroscopy has been related to unconventional CDW excitation [1]. Photoinduced CDW state with topological defects in this material has been discovered from ultrafast electron diffraction and related studies [7, 28]. Transport studies have revealed that LaTe3 possesses an unusually high non-saturated longitudinal magnetoresistance [30], which is similar to that of nodal line material [33]. In addition, LaTe3 possesses very high carrier mobility [30], which, in conjunction with its high transition temperature, makes it a promising contender for next-generation electronics. Theoretical calculation of the electronic susceptibility as well as experiments have shown that dependent electron phonon coupling plays an important role in stabilizing the CDW state in RTe3 [34, 35]. While there are no DFT investigations, angle resolved photoemission spectroscopy (ARPES) measurements on LaTe3 are also scarce in literature [36, 7]. Using time resolved ARPES, Zong et al. [7] examined light-induced melting of the CDW state of LaTe3. A previous research by Brouet et al. [36] demonstrated that the CDW-induced shadow bands hybridize with the main bands existing in the non-CDW state creating a CDW gap along a particular direction of the Brillouin zone (BZ).
In light of the fact that LaTe3 is a noncentrosymmetric achiral material with TRS intact, topological phases brought on by inversion symmetry breaking in conjunction with other symmetries may be anticipated in the CDW state. Here, from an in-depth study of the band structure of LaTe3 in the CDW state by combining ARPES and DFT using a realistic experiment-based structure, we establish the existence of a KNL in a CDW material for the first time. It originates from the interaction of the shadow band and the main band, and is hosted by the TRS and the lattice symmetries. Furthermore, spinless nodal lines that are entirely gapped out by SOC are also identified.
II Results
II.1 Modulated structure of LaTe3 in the CDW state
Fig. 1a shows a 7-fold modulated (117) supercell structure of LaTe3. It is derived from the experimental structure obtained from single crystal x-ray diffraction (XRD) at 100 K [37] (see Methods). Its space group is ( #40), which is same as that reported for the average structure [37]. LaTe3 is made up of two main structural units: La-Te1 corrugated slabs and Te2-Te3 bilayer. The latter, highlighted by blue double-sided arrows, are weakly coupled by van der Waals interaction. The Te bilayer of the 7-fold modulated structure hosts the CDW with = = 0.286, where c∗ is the reciprocal lattice vector along in the non-CDW state. This value is close to the experimental values determined from ARPES (subsection II.2) and reported in previous literature [37, 38]. Moreover, the amplitude of the CDW modulation is nearly similar to that from XRD [37], see Supplementary Figs. S1a,b.
The CDW modulation has been directly observed in the LaTe3 crystal studied here from a high resolution scanning tunneling microscopy (STM) topography image. In Fig. 1b, the modulated Te net formed by connecting the Te atoms (orange circles) is shown by white lines. Low energy electron diffraction (LEED) pattern also shows CDW related satellite spots (encircled) besides the (11) spots (Fig. 1c). Satellite spots are also observed in the Fourier transform of the STM image, see Supplementary Note 1 and Fig. S2.
The experiment based 7 fold modulated structure discussed above has been used for the DFT calculations. The corresponding BZ is shown in Fig. 1d inscribed within the non-CDW BZ. Since the BZ is related to the ordering of the lattice constants of the conventional cell, its comparison with the primitive unit cell of the 7-fold structure is shown in Supplementary Figs. S3a,b. In our notation, the horizontal plane in the BZ is represented by - and is oriented along . The CDW BZ, containing features such as the primitive reciprocal lattice vectors and all the pertinent high symmetry points and directions as well as their coordinates, is depicted in Supplementary Fig. S3c.

II.2 Crossing of the bilayer-split shadow and main bands from ARPES
An ARPES intensity plot in a generic direction parallel to at = 0.68 Å-1 i.e., near the point (the length of being 0.737 Å-1) is shown in Fig. 2a (see Methods for the experimental details). The direction of the measurement is shown by a red line denoted by “a” in Fig. 2g . It shows two main bands (inner and outer) centered around that cross at = 0.15 and 0.21 Å-1, respectively. The outer main band disperses down to binding energy () of about 1.25 eV, while the inner band has a nearly flat bottom at ∼0.8 eV. It is interesting to note that a relatively weaker band centered around = 0.41 Å-1 is a replica of the main band shifted by (= 0.28= 0.41 Å-1), as shown by two horizontal white dashed arrows. This replica band crosses at = 0.21 and 0.61 Å-1 and disperses down to ∼1.25 eV. No shift in its position along compared to the main band is observed, which indicates that it is related to the initial state CDW superlattice [40]. It has been referred to in literature as the shadow band [36, 40, 41]. The signature of the shadow band is also evident in the Fermi surface (FS) shown in Fig. 1e, where shadow FS branches appear at a separation of from the main branches, as shown by white dashed arrows in the metallic region around the point parallel to the direction. In the Supplementary Note 2, a discussion about the FS and obtained from the average separation of the shadow and main branches are provided. = 0.28005 determined in this way is close to and is in excellent agreement with the values obtained from STM and LEED, see Supplementary Note 1.
In Fig. 2a, The shadow and the main bands resemble an inverted “V” and meet each other close to at = 0.21 Å-1(highlighted by a green dashed oval). This region is shown in an expanded scale in Fig. 2e, where the white dashed lines suggest a possible crossing of nearly linear bands at . The Fermi velocities of these bands, determined using the expression (), turn out to be 1.20.05 and 10.05 m/s for the shadow and main bands, respectively. These values are comparable to graphene (1 m/s [42]), indicating large mobility of LaTe3 in agreement with recent report from Hall conductivity measurements [30].
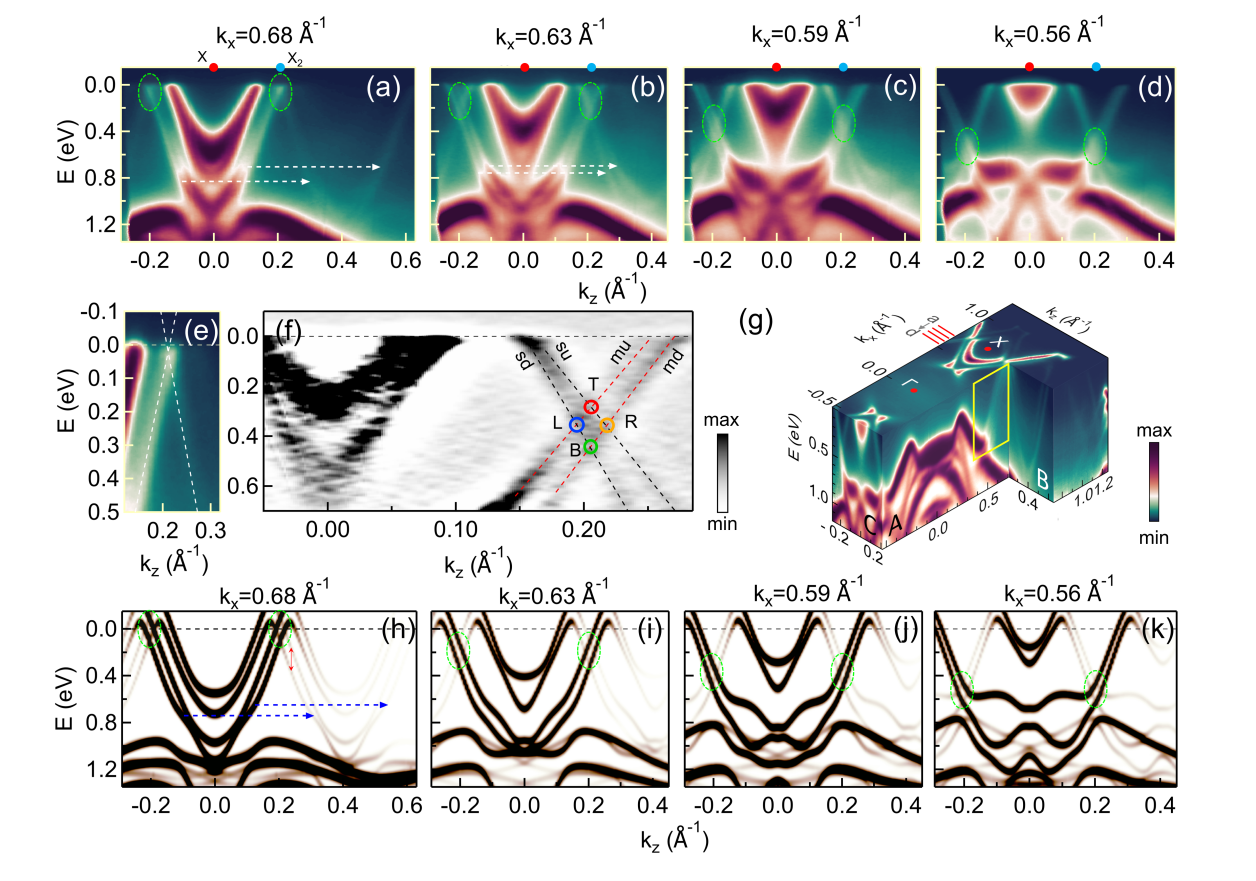
To further investigate these bands and their possible crossing, ARPES was performed over a range of out of which three representative plots (along the red lines parallel to “a” up to “d” in Fig. 2g) are shown in Figs. 2b-d. Interestingly, as decreases, both the main and the shadow bands spread out in and the crossings – highlighted by green dashed ovals – shift below to larger . However, note that their position remains unchanged around . In Figs. 2b-d, splittings in both the shadow and the mains bands are observed, which are related to the coupling between the two adjacent weakly coupled Te layers. This is the bilayer splitting that has been reported in other RTe3 members [43, 44, 36], bilayer graphene [45], and cuprate superconductors [46]. Here, we find that the splitting increases with , e.g., it varies from 0.016 to 0.03 Å-1 as increases from 0.1 to 0.5 eV (Fig. 2c). Evidence of varying bilayer splitting is also observed in the FS (see Supplementary Note 2).
Both the bilayer-split shadow bands - denoted by su (sd) for smaller (larger) , see Fig. 2f - are shifted by from the corresponding main bands (denoted by mu and md). This is shown by the white dashed horizontal arrows in Figs. 2a,b. This leads to formation of four crossings between the main and the shadow bands, as shown in Fig. 2f. These are also visible in a constant energy - isosurface through the band crossing e.g. at = 0.5 eV and a stack of momentum distribution curves (MDCs), see Supplementary Figs. S8a,b.
The crossings are denoted by left (L, blue circle, crossing of mu and sd i.e., ), right (R, orange circle, ), top (, red circle, ), and bottom (B, green circle, ) (Fig. 2f). While Figs. 2a-d show the band dispersion at discrete values, we show a continuous dispersion of the crossings, for example the in cut A of Fig. 2g. Here, the at =0.216 Å-1 shows the loci of the crossing within the yellow rectangle.
ARPES with different photon energies shows negligible dependence of the crossings. For example at kx= 0.58 Å-1, Supplementary Figs. S9a-d show that their position (highlighted by green dashed ovals) remains almost unchanged with . This is summarized in Fig. S9e through a - map at = 0.39 eV, where the two crossings at = 0.2 Å-1 (marked by yellow arrows) show almost no change with , indicating the quasi-2D nature of LaTe3.
II.3 Effective band structure from DFT compared to ARPES
Multiple crossings indicated by ARPES is a surprising result since hybridization gap is generally expected at the band touching points between the Bloch states connected by [47, 44]. To understand this, we have performed DFT calculations using the modulated structure discussed in subsection II.1.
The bands calculated at different as in the experiment are shown in an extended zone scheme spread over the non-CDW BZ in Supplementary Fig. S10. Many bands are observed in the CDW state due to band folding. The complexity of these bands hides the influence of the CDW on the electronic bands and impedes their interpretation and direct comparison with ARPES. So, an effective band structure (EBS) has been calculated by unfolding the bands in the non-CDW BZ [48, 49, 50]. In Figs. 2h-k, EBS shows the distribution of states as a function of their energy and momenta with appropriate spectral weight, where broadening similar to the experiment has been applied. Variations in the spectral weight is evident resulting in dissimilar EBS in the different CDW BZs. This complexity in a CDW system is discussed further in subsection II.6.
The importance of the EBS calculation is that despite the CDW effect being small with the modulation amplitude only ∼4.5% of the average Te2-Te3 distances, the EBS reveals the shadow bands that are shifted from the main bands by (blue dashed arrows) in excellent agreement with ARPES (compare Figs. 2h-k with Figs. 2a-d). In contrast, the bands in the non-CDW state, where obviously the CDW amplitude is zero, shows only the main bands (Supplementary Fig. S11a). An analysis of the orbital character establishes that the shadow bands (as well as the main bands) are of predominantly in-plane Te - character, see the Supplementary Figs. S12a-f. The out-of-plane character becomes slightly significant only for 0.6 eV, and the contributions from the La-Te1 block is negligible. However, transfer of electrons from La to the Te net determines the band filling in the Te2-Te3 layer and this has been calculated using the Bader charge analysis (see Supplementary Note 3 including Refs. 51, 52, 53).
From Fig. 2h, we find that the outer branch of the shadow band disperses towards and crosses the main band around = 0.21 Å-1 (highlighted by a dashed green oval). A bunch of bands that disperse weakly between 1.15 to 1.6 eV are observed in both theory and experiment at similar . A bilayer splitting of 0.17-0.2 eV (red double arrow in Fig. 2h) is observed in the EBS with and crossings close to , while () appears above (below) . However, these are not visible separately in Fig. 2a, indicating that possibly at this the experimental bilayer splitting is smaller compared to the DFT value. The inner branch of the shadow band that disperses to about 0.6 eV is more prominent in the EBS, but also has its counterpart in the curvature plot of ARPES (see Supplementary Fig. S11b). In Figs. 2i-k, for progressively smaller values, EBS portray all the four crossings at similar - observed in ARPES (compare Figs. 2i-k with Figs. 2b-d). The agreement is also good at larger : the main bands around 0.8 eV become flatter and move to lower .
Important to note is that from ARPES the crossings appear to be gapless (Fig. 2a-f) within the experimental and lifetime broadening. Although this is supported by the EBS (Fig. 2h-k), it should be noted that the calculations have been performed with a step size () of 610-3Å-1, and with broadening comparable to ARPES, which might conceal the potential presence of minigaps. In the subsequent subsections II.4 and II.5, we show the DFT bands calculated with smaller to probe these crossings further.
II.4 Spinless nodal lines formed by the and crossings
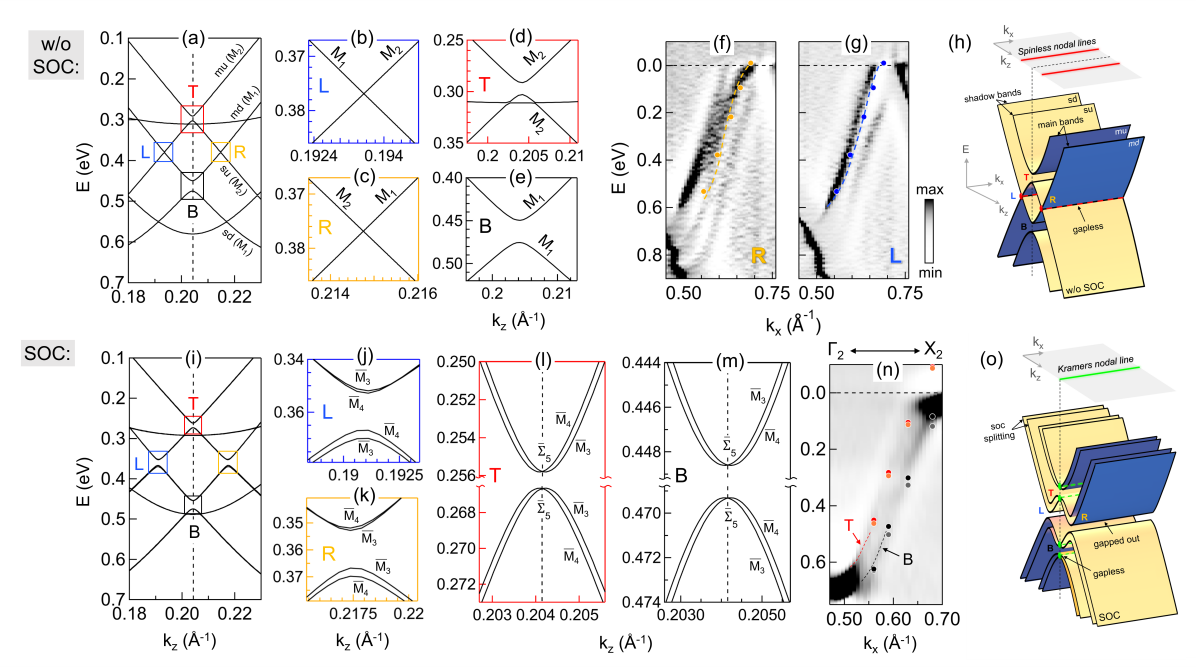
The DFT bands in the crossing region with small (= 510-4Å-1) in absence of SOC indeed indicate that the and crossings are gapless (Fig. 3a). This is reconfirmed in Figs. 3b,c by the bands calculated with even smaller (= 110-5Å-1). It is interesting to note that these crossings occur at generic points of the BZ in the - plane and the bands involved are linear (Figs. 3a-c). ARPES intensity plots in Figs. 2c,f at this also demonstrate the linearity of the bands around and in excellent agreement with DFT. The velocities calculated from their slopes are similar to that obtained at from Fig. 2e. Although these bands originate from the in-plane orbitals with small difference in contributions from the and orbitals as shown in Supplementary Figs. S12a-f, md and sd bands belong to irreducible band representation (irrep), while mu and su belong to irrep. Thus both and crossings are formed by bands belonging to different irreps (Figs. 3a-c).
The crossings disperse with and at larger = 0.685 Å-1 compared to 0.59 Å-1, and crossings traverse the (Supplementary Fig. S13a-c). In fact, calculations for a series of values establish that the gapless linear crossings occur over an extended range of the - space (Supplementary Fig. S14). The loci of each crossing form a continuous curve in the momentum space that has been referred to as a nodal line. A direct comparison of the () cuts from ARPES (Figs. 3f,g for and , respectively) show that the positions of both the nodal lines are in excellent agreement with DFT. Both disperse between (, ) = (0 eV, 0.7 Å-1) to (∼0.6 eV, 0.5 Å-1) with at 0.195 and 0.22 Å-1 for and , respectively. Thus, the crossings appear within an energy window of ∼0.6 eV to the . Their projections in the - plane form a pair of approximately parallel nodal lines that are 0.2 Å-1 in length and appear at a separation of ∼0.02 Å-1 in a general direction on this plane (red solid lines in Fig. 3h). These appear parallel to but on either sides of that occurs at kz= 0.204 Å-1. These nodal lines are formed by two fold crossings of nondegenerate bands in the absence of spin and so are referred to spinless nodal lines.
With inclusion of SOC, it is intriguing to find that both the and crossings (and hence the nodal lines) are entirely gapped out by minigap of 14-17 meV into upper and lower branches, as shown in Figs. 3i-k and Supplementary Figs. S13g,h. A schematic is shown in Fig. 3o. The gap is formed by hybridization of bands belonging to same one dimensional double group irrep involving both and .
Note that noncentrosymmetry should lift the SU(2) spin degeneracy. This is visible through the spin splitting of both the upper and lower branches in Figs. 3j,k. These spin-split bands belong to different irreps and and do not cross each other. The splittings for both and are -dependent, it is maximum at the extrema (∼3 meV for lower and 1 meV for the upper branch in Figs. 3j,k) and decreases away from it.
II.5 Evidence of Kramers nodal line from the and crossings
In the case of and , the shadow and main bands belong to the same irrep, leading to hybridization-related minigaps without SOC and the creation of upper and lower branches (Figs. 3a,d,e). The inclusion of SOC provides a fascinating outcome: the spin-split bands in both the upper and lower branches of and exhibit gapless crossings (Figs. 3l,m), which contrasts the bands at and (Figs. 3j,k). Each branch of and crosses at the same = 0.204 Å-1 (dashed lines in Figs. 3i,l,m) resulting in four crossings. This value of is special, since it falls on the line of the CDW BZ (i.e., or the line) (Fig. 1d). At = 0.59 Å-1, the four crossings appear at different : 0.256 (0.267) eV for the upper (lower) branch of , and 0.448 (0.469) eV for upper (lower) branches of .
These gapless crossings are observed over a range of , as in the case of and (subsection II.4). For example, at = 0.685 Å-1, the crossings disperse to smaller and in this case both the branches of () are above (below) the (Supplementary Fig. S13f-h). Significantly, the crossings always appear at same i.e., along the line, suggesting that the crossings may be enforced by the lattice symmetries along this direction.
The band irreps with SOC shown in Fig. 3l,m are as follows: the crossing belongs to a double valued irrep that is two dimensional (), while away from it, the spin-split bands have one dimensional ( or ) representation. Significantly, the line that emerges from the point has the little group that is isomorphic to point group and has symmetries such as the two fold rotation about the - axis denoted by 21000,0,0, glide reflection perpendicular to the axis in the - plane followed by a translation of given by 0,0, and an off-centered mirror perpendicular to the axis 0,0,. is a TRIM point, where according to the Kramers theorem, each band is at least doubly degenerate. The little group of is related to that of by the compatibility relations. We find that and are represented by two dimensional double-valued irreps: and , respectively. These representations are similar, as shown in Supplementary Table S2 [54]. The line passes through the point with co-ordinates (0.257, 0.257,0) and meets the TRIM point (0.5, 0.5, 0) in the next BZ (see Supplementary Fig. S15). also belongs to double-valued two dimensional irrep that is same as and (Supplementary Table S2). The condition that at the TRIM points the representations should be time reversal invariant is satisfied since both and are pseudo-real [54]. Thus, -- is able to support two fold degeneracy of the bands along i.e., the line. This is a Kramers nodal line (KNL) that occurs along the line in the mirror-invariant -plane in presence of TRS, and the additional rotational symmetry constrains the KNL along a high symmetry direction [25]. Xie et al. [25] have proved the existence of KNL along the rotational axis (21000,0,0), which in our case is along that lies in the - mirror plane (0,0,). In Fig. 3o, the projection of the loci of the crossings of the four pairs of bands in the -- space on the - plane shows the KNL (thick green line) that enforces the crossings.
The bands in a plane that cuts the KNL perpendicularly – as is the case in Fig. 3i – have been described in the literature as two-dimensional massless Dirac Hamiltonian with the Berry curvature concentrated at the crossing [25]. These authors demonstrated that the Berry phase around a KNL is quantized as m mod 2. In case of quadratic and cubic dispersion of these bands, the crossing has been dubbed as a higher-order Dirac point [25]. In the present case, both the upper and lower branches of and exhibit quadratic dispersion very close to the crossings, as is evident in Figs. 3l,m. Consequently, the gapless crossings in LaTe3 that are associated with the KNL are higher-order Dirac points.
II.6 ARPES and DFT along the KNL and other directions
In Fig. 4a, the bands calculated along the KNL (i.e., ) show two pairs of degenerate bands related to the and crossings, highlighted by green shading in the insets i, ii. The ARPES intensity plot in Fig. 3n represents these bands that are also identified by the degenerate crossings of bands in the perpendicular direction (Figs. 3l,m) enforced by the KNL. The existence of the KNL between 0.5 to 0.7 Å-1 along is affirmed by ARPES through an excellent agreement of the positions of the crossings obtained from DFT (filled circles) that are overlaid on the experimental data in Fig. 3n. The agreement is also evident in the Supplementary Fig. S16, where Fig. 3i is superposed on Fig. 2f. However, the energy separations between the upper and lower branches of both and are too small to be resolved by ARPES. Similarly, the quadratic nature visible in a tiny range shown in Figs. 3l,m is not distinguished, see the regions enclosed by the red and black rectangles in Supplementary Fig. S16. Nonetheless, ARPES is consistent with DFT, and both show that the crossings disperse from 0.6 eV at 0.55 Å-1 and traverse the at = 0.65-0.7 Å-1.
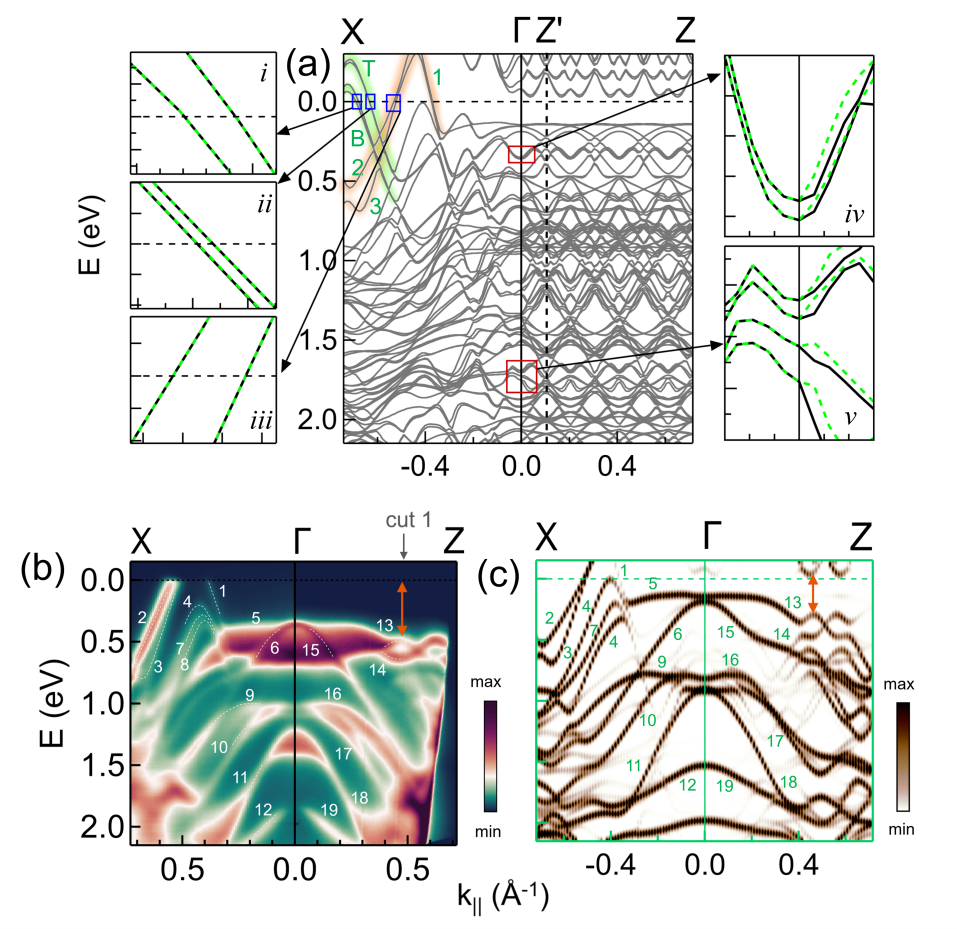
We find that every band along is degenerate due to the double degeneracy enforced by the KNL (see for example the insets i-v of Fig. 4a) and belong to two dimensional irrep. Besides the and related bands discussed above, there are other bands that cross in Fig. 4a. These bands – numbered as 1, 2 and 3 and highlighted by orange shading – have not been observed in the ARPES along (= 0.204 Å-1) due to their low spectral weight at this . However, these three bands are clearly visible in the ARPES intensity plot along (= 0 Å-1) in Fig. 4b and disperse across the in splendid agreement with the EBS along the same direction in Fig. 4c. At larger other bands (numbered as 4-12) in the EBS along are in very good agreement with ARPES (Fig. 4b). On the other hand, the bands around the and crossings both along and perpendicular to the KNL have negligible spectral weight around and so are observed neither in EBS nor ARPES in Figs. 4b,c. Similarly, in Fig. 3a,i parabolic bands around = 0.3 eV and = 0.5-0.6 eV are not visible in the EBS or ARPES. The is caused by the variation of the spectral weight mentioned in subsection II.3. On the other hand, the band structure shows the crossings formed by band folding in every BZ, see Supplementary Fig. S10, where the crossing region is highlighted by red ovals. This shows the importance of performing ARPES over multiple CDW BZs in the direction of to decipher the influence of the CDW on the electronic band structure.
Perpendicular to the KNL along (), the bands are represented by one dimensional irreps (Supplementary Fig. S15 and Supplementary Table S3). Since the little group along this direction has lesser symmetry than C2v, degeneracy is not enforced. This is shown by the spin-splitting along in the zoomed insets iv,v of Fig. 4a. This is also true for the bands calculated along various other high symmetry directions (Supplementary Fig. S17), where the insets show degeneracy along and splitting along other directions. In the direction no bands are found to cross the , and this is corroborated by ARPES as well as EBS. Here, a hybridization related gap is observed with bands 13,14 being the highest occupied ones (red double arrow in Figs. 4b,c). This gap has been referred to in previous literature as the CDW gap in LaTe3 [36] and other RTe3 systems [44, 43, 40, 55, 56]. A discussion about the variation of the CDW gap of LaTe3 with and is provided in the Supplementary Note 4.
III Discussions
In this work, we show the existence of the recently predicted [25] KNL in the CDW state of LaTe3, along the direction with point group (Fig. 3o) based on the results of ARPES, ab-initio DFT, EBS obtained by band unfolding and symmetry arguments. The origin of the KNL is associated with the time reversal symmetry (LaTe3 being non-magnetic in contrast to the other RTe3 materials) as well as the symmetries of the noncentrosymmetric and nonsymmorphic lattice ( rotation along and mirror in the - plane).
The crossings of the CDW-induced shadow and the main bands enforced by the KNL occur from ∼0.6 eV, and disperse in to traverse the as increases (Fig. 3n). The dispersion in is related to the dispersion of the main band (the crossing of the main band with moves to larger as decreases, see Figs. 2a-d, h-k) coupled with the constraint that the shadow band is always separated from it by . Other spin degenerate bands also cross the along the KNL. We characterize LaTe3 as a KNL metal in the CDW state based on multiple bands crossing the both along and perpendicular to the KNL.
We have furthermore identified spinless nodal lines in a general direction on the - plane in the limit of negligible SOC (Fig. 3h). These nondegenerate bands with distinct irreps involved in the crossings are linear and traverse the with high Fermi velocity. The nodal lines are entirely gapped with SOC. These characteristics resemble those of noncentrosymmetric topological nodal line semi-metals such as pinictides e.g., CaAgAs [57], in which the nodal line is entirely gapped by SOC resulting in a topological insulator [57, 58]. Whether the SOC-induced gap in LaTe3 has a topological character is an open question that would require further investigation.
The appearance of these two distinct types of nodal lines can be attributed to the bilayer splitting, that splits both the shadow and the main bands to bands belonging to different irreps. Thus, the foundation of our investigation is the unambiguous observation of the bilayer-split shadow bands by ARPES with which the theory is in impressive agreement. This occurred due to the 7 fold modulated structure with = = 0.286, employing which DFT was done for the first time with and the amplitude of the CDW modulation close to the experimental value. However, the experimental values differ depending on the method: for example, electron diffraction showed = 0.280.01 [38], whereas XRD reported = 0.2757(4) [37] in the temperature range of 90-100 K. Here, from ARPES we find to be 0.280.005. Considering these values, it is possible that there might be a minor deviation of experimental from ; hence, is often considered as “incommensurate” [38, 37]. In order to answer the question whether the KNL would exist if deviates, we find that it is possible to construct a 29-fold (1129) structure with = = 0.2759 from the experimental XRD structure [59]. Note that it has the same space group (SG #40) as the 7-fold structure. Its equals the experimental XRD value, which is most precise among the distinct methods, rounded to the third decimal place. Moreover, the required displacement of the 232 atoms in the primitive unit cell from the atomic positions from XRD [37] is zero (0.0000) for virtually all the atoms, with the exception of only a couple of Te atoms where it is 0.0001 Å. Since the symmetries of SG #40 as well as the TRS are retained in the 29-fold structure, it is expected that the KNL will remain intact.
In conclusion, the discovery of CDW-induced KNL in LaTe3 – a non-centrosymmetric, quasi-2D, TRS-preserving material – is the cornerstone of our work, which we feel will stimulate further investigation into the fascinating realm of CDW materials.
IV Methods
Experimental: Single crystals of LaTe3 with residual resistivity ratio (RRR, (300 K)/(2 K)) of ∼270 were grown by tellurium flux technique, as discussed in our previous work [30].
The ARPES measurements presented here were performed at the SGM3 beamline at the ASTRID2 synchrotron facility [60]. ARPES data at SGM3 beamline were collected with an energy resolution of 18 meV at h= 24.4 eV. The angular resolution was 0.2∘ (0.008 Å-1). The measurements were performed at 100 K with different photon energies ranging from 13 eV to 140 eV. All the measurements were done on freshly cleaved surfaces at a chamber base pressure better than 210-10 mbar. The ARPES intensity plots measured as a function of photon energy (h) have been converted to assuming the free electron final states [61]. The raw data ( vs h) have been converted to vs by utilizing the expression = , where is the kinetic energy of the photoelectrons, is the emission angle and the inner potential has been assumed to be 7.5 eV based on the best matching with the ARPES data. The curvature plots have been obtained as in our earlier work [62, 63] with respect to both E and k axes following the method proposed by Zhang [64]. This method improves the visibility of the weaker bands in the ARPES intensity plots and is better than the second derivative approach. The data analysis has been performed using IGOR pro (version 9). The dashed curves in Figs. 2e,f are obtained by a curve fitting the maxima of the MDCs. The maxima are identified by fitting the MDCs with Lorentzian functions. The least-square error method has been used for the curve fitting.
The STM measurements were carried out at a base pressure of 210-11 mbar using a variable temperature STM from Omicron Nanotechnology GmbH, while LEED and preliminary ARPES measurements were carried out in a workstation from Prevac sp. z o.o. STM was performed in the constant current mode using a tungsten tip that was cleaned by sputtering and voltage pulse method. The tip was biased and sample was kept at the ground potential. LEED is performed using a four grid rear view optics from OCI Vacuum Microengineering. Both STM and LEED were performed in the CDW state at room temperature.
Density functional theory: The DFT calculations have been performed for the 7-fold modulated structure with C2cm space group (SG #40). This structure has been derived from the experimental atomic positions at 100 K reported in Ref. 37 using the PSEUDO program with average displacement of the atoms being 0.01Å [59]. VESTA software has been used for Crystal structure visualization [65].
We have employed the DFT-based Vienna Ab-initio Simulation Package(VASP) [66, 67] within the framework of the projector augmented wave method(PAW) [66, 67] to investigate the electronic structure of LaTe3. The exchange-correlation functional is treated under the generalized gradient approximation(GGA) given by Perdew, Burke, and Ernzerhof [68]. We have considered 11 valence electrons of the La atom () and 6 valence electrons of Te atom () in the PAW pseudopotential. The energy cut-off is set to 500 eV for the expansion of the planewaves. The convergence criterion for energy in the self-consistent-field cycle and total force tolerance on each atom are taken to be 10-6 eV and 0.02 eV/Å, respectively. The SOC is employed by a second-variation method as implemented in the VASP code [67]. To calculate the EBS, we have unfolded the band structure of the CDW state into the primitive BZ of the non-CDW state, using the PyProcar python code [50]. All the DFT bands (and consequently the EBS) are rigidly shifted to larger by 0.1 eV with respect to the for comparison with the ARPES data.
Furthermore, to reconfirm the band crossings and to identify their irreps, DFT calculations have been performed using the all electron WIEN2k programme package [69] and Quantum Espresso software package [70]. Supplementary Fig. S18 shows that the bands are in agreement between the different methods. WIEN2k was performed with energy cut-off of 16 Ry, where the RMTKmax value is taken to be 9.5. Further, we have used 10 for the maximum value of angular momentum for the (l,m) expansion of wave function or density. Convergence criteria for energy and charge have been taken to be 10-5 Ry and 0.001 e-, respectively. Quantum Espresso calculations have been carried out using fully relativistic PAW pseudopotentials for La and Te atoms. A planewave cutoff of 80 Ry and a k-grid were taken along with the energy accuracy of 10-8 Ry.
V Acknowledgment
S.S., P.S. and S.R.B. gratefully acknowledge the financial support from Department of Science and Technology, Government of India within the framework of the DST-Synchrotron-Neutron Project to perform experiments at ASTRID2 synchrotron facility. A part of this work was supported by VILLUM FONDEN via the Centre of Excellence for Dirac Materials (Grant No. 11744). The Computer division of Raja Ramanna Centre for Advanced Technology is thanked for installing the DFT codes and providing support throughout.
VI Author contributions
S.S., P.S., D.C., and S.R.B. conducted the ARPES measurements with assistance and support from M.B. and P.H. LEED was carried out by S.S. and P.S., while STM was performed by V.K.S. J.B. and R.D. did the DFT calculations under the supervision of A.C. The explanation of the results was provided by S.S., T.D., A.C., and S.R.B. The single crystals of LaTe3 were grown by A.P., S.R. and P.M, the latter introduced us to this system. S.S. analyzed the experimental data with initial help from D.C., performed the post-analysis of the DFT results with some inputs from J.B., and prepared the figures. The project was planned and led by S.R.B. who wrote the paper with significant contributions from S.S., P.H., and A.C.
VII Competing interests
The authors declare no competing interests.
References
- Wang et al. [2022] Wang, Y. et al., Axial higgs mode detected by quantum pathway interference in RTe3, Nature 606, 896 (2022).
- Jiang et al. [2021] Jiang, Y.-X. et al., Unconventional chiral charge order in kagome superconductor KV3Sb5, Nature Materials 20, 1353 (2021).
- Shi et al. [2021] Shi, W. et al., A charge-density-wave topological semimetal, Nature Physics 17, 381 (2021).
- Rettig et al. [2016] Rettig, L. et al., Persistent order due to transiently enhanced nesting in an electronically excited charge density wave, Nature Communications 7, 10459 (2016).
- Luo et al. [2022] Luo, H. et al., Electronic nature of charge density wave and electron-phonon coupling in kagome superconductor KV3Sb5, Nature Communications 13, 273 (2022).
- Yu et al. [2021] Yu, F. H. et al., Unusual competition of superconductivity and charge-density-wave state in a compressed topological kagome metal, Nature Communications 12, 3645 (2021).
- Zong et al. [2018] Zong, A. et al., Evidence for topological defects in a photoinduced phase transition, Nature Physics 15, 27 (2018).
- Li et al. [2021] Li, H. et al., Observation of unconventional charge density wave without acoustic phonon anomaly in kagome superconductors AV3Sb5 (, Cs), Phys. Rev. X 11, 031050 (2021).
- Song et al. [2022] Song, Z. et al., Observation of an incommensurate charge density wave in monolayer TiSe2/CuSe/Cu(111) heterostructure, Phys. Rev. Lett. 128, 026401 (2022).
- Lv et al. [2022] Lv, B. Q. et al., Unconventional hysteretic transition in a charge density wave, Phys. Rev. Lett. 128, 036401 (2022).
- Pan et al. [2022] Pan, H., Xie, M., Wu, F. and Das Sarma, S., Topological phases in ab-stacked MoTe2/WSe2: Z2 topological insulators, chern insulators, and topological charge density waves, Phys. Rev. Lett. 129, 056804 (2022).
- D’Souza et al. [2012] D’Souza, S. W. et al., Coexistence of charge-density wave and ferromagnetism in Ni2MnGa, Phys. Rev. B 85, 085123 (2012).
- Gooth et al. [2019] Gooth, J. et al., Axionic charge-density wave in the weyl semimetal (TaSe4)2I, Nature 575, 315 (2019).
- Qian et al. [2014] Qian, X., Liu, J., Fu, L. and Li, J., Quantum spin hall effect in two-dimensional transition metal dichalcogenides, Science 346, 1344 (2014).
- Polshyn et al. [2021] Polshyn, H. et al., Topological charge density waves at half-integer filling of a moiré superlattice, Nature Physics 18, 42 (2021).
- Mitsuishi et al. [2020] Mitsuishi, N. et al., Switching of band inversion and topological surface states by charge density wave, Nature Communications 11, 2466 (2020).
- Lei et al. [2021] Lei, S. et al., Band engineering of dirac semimetals using charge density waves, Advanced Materials 33, 2101591 (2021).
- Hsu et al. [2021] Hsu, M.-C. et al., Topological theory of inversion-breaking charge-density-wave monolayer 1T-TiSe2, New Journal of Physics 23, 093025 (2021).
- Bzdušek et al. [2016] Bzdušek, T., Wu, Q., Rüegg, A., Sigrist, M. and Soluyanov, A. A., Nodal-chain metals, Nature 538, 75 (2016).
- Xia et al. [2020] Xia, Y., Cai, X. and Li, G., Multitype dirac fermions protected by orthogonal glide symmetries in a noncentrosymmetric system, Phys. Rev. B 102, 041201 (2020).
- Gao et al. [2018] Gao, H. et al., Dirac-weyl semimetal: Coexistence of dirac and weyl fermions in polar hexagonal crystals, Phys. Rev. Lett. 121, 106404 (2018).
- Oh et al. [2019] Oh, Y.-T., Min, H.-G. and Kim, Y., Dual topological nodal line and nonsymmorphic dirac semimetal in three dimensions, Phys. Rev. B 99, 201110 (2019).
- Leonhardt et al. [2021] Leonhardt, A. et al., Symmetry-enforced topological band crossings in orthorhombic crystals: classification and materials discovery, Phys. Rev. Materials 5, 124202 (2021).
- Chang et al. [2018] Chang, G. et al., Topological quantum properties of chiral crystals, Nature Materials 17, 978 (2018).
- Xie et al. [2021] Xie, Y.-M. et al., Kramers nodal line metals, Nature Communications 12, 3064 (2021).
- Yu et al. [2015] Yu, R., Weng, H., Fang, Z., Dai, X. and Hu, X., Topological node-line semimetal and dirac semimetal state in antiperovskite Cu3PdN, Phys. Rev. Lett. 115, 036807 (2015).
- Shang et al. [2022] Shang, T. et al., Unconventional superconductivity in topological Kramers nodal-line semimetals, Science Advances 8, eabq6589 (2022).
- Kogar et al. [2019] Kogar, A. et al., Light-induced charge density wave in LaTe3, Nature Physics 16, 159 (2019).
- Zong et al. [2021] Zong, A. et al., Role of equilibrium fluctuations in light-induced order, Phys. Rev. Lett. 127, 227401 (2021).
- Pariari et al. [2021] Pariari, A. et al., Interplay between charge density wave order and magnetic field in the nonmagnetic rare-earth tritelluride LaTe3, Phys. Rev. B 104, 155147 (2021).
- Hu et al. [2014] Hu, B. F., Cheng, B., Yuan, R. H., Dong, T. and Wang, N. L., Coexistence and competition of multiple charge-density-wave orders in rare-earth tritellurides, Phys. Rev. B 90, 085105 (2014).
- Yumigeta et al. [2021] Yumigeta, K. et al., Advances in rare-earth tritelluride quantum materials: Structure, properties, and synthesis, Advanced Science 8, 2004762 (2021).
- Singha et al. [2017] Singha, R., Pariari, A. K., Satpati, B. and Mandal, P., Large nonsaturating magnetoresistance and signature of nondegenerate dirac nodes in ZrSiS, Proceedings of the National Academy of Sciences 114, 2468 (2017).
- Johannes and Mazin [2008] Johannes, M. D. and Mazin, I. I., Fermi surface nesting and the origin of charge density waves in metals, Phys. Rev. B 77, 165135 (2008).
- Eiter et al. [2012] Eiter, H.-M. et al., Alternative route to charge density wave formation in multiband systems, Proceedings of the National Academy of Sciences 110, 64 (2012).
- Brouet et al. [2008] Brouet, V. et al., Angle-resolved photoemission study of the evolution of band structure and charge density wave properties in RTe3 (R=Y, La, Ce, Sm, Gd, Tb, and Dy), Phys. Rev. B 77, 235104 (2008).
- Malliakas and Kanatzidis [2006] Malliakas, C. D. and Kanatzidis, M. G., Divergence in the behavior of the charge density wave in RETe3 (RE = rare-earth element) with temperature and RE element, Journal of the American Chemical Society 128, 12612 (2006).
- DiMasi et al. [1995] DiMasi, E., Aronson, M. C., Mansfield, J. F., Foran, B. and Lee, S., Chemical pressure and charge-density waves in rare-earth tritellurides, Phys. Rev. B 52, 14516 (1995).
- Setyawan and Curtarolo [2010] Setyawan, W. and Curtarolo, S., High-throughput electronic band structure calculations: Challenges and tools, Computational Materials Science 49, 299 (2010).
- Komoda et al. [2004] Komoda, H. et al., High-resolution angle-resolved photoemission study of incommensurate charge-density-wave compound CeTe3, Phys. Rev. B 70, 195101 (2004).
- Mans et al. [2006] Mans, A. et al., Experimental proof of a structural origin for the shadow fermi surface of Bi2Sr2CaCu2O8, Physical Review Letters 96, 10.1103/physrevlett.96.107007 (2006).
- Novoselov et al. [2005] Novoselov, K. S. et al., Two-dimensional gas of massless dirac fermions in graphene, Nature 438, 197 (2005).
- Gweon et al. [1998] Gweon, G.-H. et al., Direct observation of complete fermi surface, imperfect nesting, and gap anisotropy in the high-temperature incommensurate charge-density-wave compound SmTe3, Phys. Rev. Lett. 81, 886 (1998).
- Brouet et al. [2004] Brouet, V. et al., Fermi surface reconstruction in the cdw state of CeTe3 observed by photoemission, Phys. Rev. Lett. 93, 126405 (2004).
- Ohta et al. [2006] Ohta, T., Bostwick, A., Seyller, T., Horn, K. and Rotenberg, E., Controlling the electronic structure of bilayer graphene, Science 313, 951 (2006).
- Feng et al. [2001] Feng, D. L. et al., Bilayer splitting in the electronic structure of heavily overdoped Bi2Sr2CaCu2O8+δ, Phys. Rev. Lett. 86, 5550 (2001).
- Yang and Kee [2010] Yang, B.-J. and Kee, H.-Y., Searching for topological density-wave insulators in multiorbital square-lattice systems, Phys. Rev. B 82, 195126 (2010).
- Ku et al. [2010] Ku, W., Berlijn, T. and Lee, C.-C., Unfolding first-principles band structures, Phys. Rev. Lett. 104, 216401 (2010).
- Popescu and Zunger [2010] Popescu, V. and Zunger, A., Effective band structure of random alloys, Phys. Rev. Lett. 104, 236403 (2010).
- Herath et al. [2020] Herath, U. et al., PyProcar: A python library for electronic structure pre/post-processing, Computer Physics Communications 251, 107080 (2020).
- Bader [1985] Bader, R. F., Atoms in molecules, Accounts of Chemical Research 18, 9 (1985).
- Bhattacharya and Chakrabarti [2023] Bhattacharya, J. and Chakrabarti, A., Electronic and transport properties of heusler alloy based magnetic tunneling junctions: A first principles study, Computational Materials Science 216, 111852 (2023).
- Sarkar et al. [2020] Sarkar, S. et al., X-ray photoelectron spectroscopy study of a layered tri-chalcogenide system LaTe3, AIP Conference Proceedings, 2220, 100005 (2020).
- Elcoro et al. [2017] Elcoro, L. et al., Double crystallographic groups and their representations on the bilbao crystallographic server, Journal of Applied Crystallography 50, 1457 (2017).
- Lee et al. [2016] Lee, E. et al., The 7 1 fermi surface reconstruction in a two-dimensional f -electron charge density wave system: PrTe3, Scientific Reports 6, 30318 (2016).
- Chikina et al. [2022] Chikina, A. et al., Charge density wave-generated fermi surfaces in NdTe3, arXiv preprint , arXiv:2209.04226v1 (2022).
- Yamakage et al. [2016] Yamakage, A., Yamakawa, Y., Tanaka, Y. and Okamoto, Y., Line-node dirac semimetal and topological insulating phase in noncentrosymmetric pnictides CaAgX(X= P, As), Journal of the Physical Society of Japan 85, 013708 (2016).
- Lv et al. [2021] Lv, B. Q., Qian, T. and Ding, H., Experimental perspective on three-dimensional topological semimetals, Rev. Mod. Phys. 93, 025002 (2021).
- Capillas et al. [2011] Capillas, C. et al., A new computer tool at the bilbao crystallographic server to detect and characterize pseudosymmetry, Zeitschrift für Kristallographie 226, 186 (2011).
- Hoffmann et al. [2004] Hoffmann, S., Søndergaard, C., Schultz, C., Li, Z. and Hofmann, P., An undulator-based spherical grating monochromator beamline for angle-resolved photoemission spectroscopy, Nuclear Instruments and Methods in Physics Research Section A: Accelerators, Spectrometers, Detectors and Associated Equipment 523, 441 (2004).
- Ngankeu et al. [2017] Ngankeu, A. S. et al., Quasi-one-dimensional metallic band dispersion in the commensurate charge density wave of 1TTaS2, Phys. Rev. B 96, 195147 (2017).
- Singha et al. [2022] Singha, R. et al., Signatures of topological surface state and unconventional magnetotransport properties in elemental ruthenium, Submitted (2022).
- Sadhukhan et al. [2019] Sadhukhan, P. et al., Electronic structure of Au-Sn compounds grown on Au(111), Phys. Rev. B 100, 235404 (2019).
- Zhang et al. [2011] Zhang, P. et al., A precise method for visualizing dispersive features in image plots, Review of Scientific Instruments 82, 043712 (2011).
- Momma and Izumi [2011] Momma, K. and Izumi, F., Vesta for three-dimensional visualization of crystal, volumetric and morphology data, Journal of Applied Crystallography 44, 1272 (2011).
- Kresse and Furthmüller [1996] Kresse, G. and Furthmüller, J., Efficient iterative schemes for total-energy calculations using a plane-wave basis set, Phys. Rev. B 54, 11169 (1996).
- Kresse and Joubert [1999] Kresse, G. and Joubert, D., From ultrasoft pseudopotentials to the projector augmented-wave method, Phys. Rev. B 59, 1758 (1999).
- Perdew et al. [1996] Perdew, J. P., Burke, K. and Ernzerhof, M., Generalized gradient approximation made simple, Phys. Rev. Lett. 77, 3865 (1996).
- Blaha et al. [2001] Blaha, P. et al., WIEN2k : An augmented plane wave plus local orbitals program for calculating crystal properties, Techn. Universitat 60 (2001).
- Baroni et al. [2001] Baroni, S., de Gironcoli, S., Dal Corso, A. and Giannozzi, P., Phonons and related crystal properties from density-functional perturbation theory, Rev. Mod. Phys. 73, 515 (2001).