Broadband mHz QPOs and spectral study of LMC X–4 with AstroSat
Abstract
We report the results of broadband timing and spectral analysis of data from an AstroSat observation of the High Mass X-ray binary LMC X–4. The Large Area X-ray Proportional Counter (LAXPC) and Soft X-ray Telescope (SXT) instruments on-board the AstroSat observed the source in August 2016. A complete X-ray eclipse was detected with the LAXPC. The 3–40 keV power density spectrum showed the presence of coherent pulsations along with a 26 mHz quasi-periodic oscillation feature. The spectral properties of LMC X–4 were derived from a joint analysis of the SXT and LAXPC spectral data. The 0.5–25 keV persistent spectrum comprised of an absorbed high energy cutoff power law with photon index of 0.8 and cutoff at 16 keV, a soft thermal component with kT 0.14 keV and Gaussian components corresponding to Fe Kα, Ne ix and Ne x emission lines. Assuming a source distance of 50 kpc, we determined 0.5–25 keV luminosity to be erg s-1.
keywords:
X-rays: binaries – (stars:) pulsars: individual – accretion, accretion discs – stars: neutron – X-rays: individual: LMC X–41 Introduction
LMC X–4 is a highly luminous, eclipsing high mass X-ray binary (HMXB) which is located in the Large Magellanic Cloud (Giacconi et al., 1972). LMC X–4 exhibits variations in X-ray flux over a wide range of time scales. It harbours a 1.25 M⊙ neutron star spinning at a period of 13.5 s and accreting matter from a 14th magnitude OB star (Pakull & Olander, 1976; Pesch et al., 1976; Kelley et al., 1983; van der Meer et al., 2007). The binary has an inclination angle of 59∘ (Inoue, 2019). The pulsar orbits its donor in an almost circular orbit. The X-ray eclipse lasts for a duration of about 5 hr and recurs every 1.4 d (Li et al., 1978; White, 1978). The orbital period is known to decay at a rate of about 10-6 yr-1 (Levine et al., 2000; Naik & Paul, 2004; Falanga et al., 2015). Over and above this, a 30.5 d intensity variation is also seen in this system (Lang et al., 1981; Paul & Kitamoto, 2002; Molkov et al., 2015). It is attributed to a precessing tilted accretion disc which periodically obscures direct X-ray emission from the compact object. Flaring episodes (of duration up to 45 min) have been reported in LMC X–4 (Epstein et al., 1977; Levine et al., 1991; Beri & Paul, 2017). These large X-ray flares show quasi-periodic variability at frequencies of and mHz (Moon & Eikenberry, 2001). Recently, mHz quasi-periodic oscillation (QPO) was detected with XMM-Newton during the persistent emission (Rikame et al., 2022).
The spectral variations in LMC X–4 are equally interesting. The 0.1-100 keV spectrum of LMC X–4 is described by a hard power law with a high-energy cutoff, a strong iron emission line and a soft X-ray excess originating due to reprocessing of hard X-rays by the inner accretion disc (Levine et al., 1991; Woo et al., 1996; La Barbera et al., 2001; Paul et al., 2002; Naik & Paul, 2003; Hickox et al., 2004; Shtykovsky et al., 2017). The spectral properties are known to significantly depend on the high/low super-orbital phase (Naik & Paul, 2003). There exists a positive correlation between the 7–25 keV flux and the flux of the iron emission line. The spectrum is observed to be relatively flat during the low state in comparison to the high state (Naik & Paul, 2003).
In this paper, we present the results obtained from an AstroSat - LAXPC and SXT observation of LMC X–4 made during 2016 August. The paper is organised in the following way. Section §2 gives a description of the observation and the data reduction procedure. In Section §3, the results from timing and spectral analysis of LMC X–4 have been presented. Our findings have been discussed in Section §4.
2 Observations
| AstroSat | Observation | Start Time | Stop time | Mode | Obs span | clean exposurea |
|---|---|---|---|---|---|---|
| Instrument | ID | (yyyy-mm-dd hh:mm:ss) | (yyyy-mm-dd hh:mm:ss) | (ks) | (ks) | |
| LAXPC | 9000000634 | 2016-08-29 20:00:39 | 2016-08-30 20:47:37 | EA | 89.2 | 31.5 |
| SXT | 9000000634 | 2016-08-29 21:02:35 | 2016-08-30 19:57:57 | PC | 82.6 | 14.1 |
| aNet exposure of the persistent emission. | ||||||
AstroSat is India’s first multi-wavelength (from optical to hard X-rays) astronomical mission. It was launched by Indian Space Research Organization in September 2015 (Agrawal, 2006; Singh et al., 2014). It comprises of five scientific instruments – Scanning Sky Monitor (SSM: 2.5–10 keV; Ramadevi et al., 2018), Soft X-ray Telescope (SXT: 0.3–8.0 keV; Singh et al., 2017), Large Area X-ray Proportional Counters (LAXPC: 3–80 keV; Yadav et al., 2016; Agrawal et al., 2017), Cadmium Zinc Telluride Imager (CZTI: 20–100 keV; Rao et al., 2017), and Ultra-Violet Imaging Telescope (UVIT: 1300–5500 Å; Tandon et al., 2017). For the current work, we have used data from SXT and LAXPC detectors only.
AstroSat - LAXPC has capability for high time resolution X-ray studies and covers a broad X-ray spectral band. It consists of three co-aligned proportional counters (LAXPC10, LAXPC20 and LAXPC30) which are sensitive to the X-ray photons in 3-80 keV energy range, with a total effective area of 6000 cm-2 at 15 keV. It has a collimator with a field of view. For our analysis, data from LAXPC10 and LAXPC30 were not used due issues of high background and variable gain with the two instruments, respectively (Agrawal et al., 2017; Antia et al., 2017). LAXPC20 has 20% spectral resolution at 30 keV (Antia et al., 2021).
AstroSat - SXT is a focusing X-ray telescope fitted with a CCD in the focal plane. It can perform X-ray imaging and spectroscopy in the 0.3–8 keV energy range with an energy resolution of 150 eV. The peak effective area is 120 cm2 in 0.8–2 keV range; 60 cm2 in 2.5–5 keV and 7 cm2 at 8 keV (Singh et al., 2016, 2017). The on-axis FWHM of point spread function in the focal plane is arcmin.
The data from an AstroSat observation of LMC X–4 (Observation Id G05_115T01_9000000634) made during 2016 August was analyzed for this work (See Table 1 for observation details). During this observation, LMC X–4 was observed for a span of 90 ks. The Event Analysis (EA) mode data from LAXPC20 was processed by using the standard LAXPC software111https://www.tifr.res.in/~astrosat_laxpc/LaxpcSoft.html (LaxpcSoft: version 3.4.2). The light curves and spectra for the source and background were extracted from level 1 files by using the tool laxpcl1. The background in LAXPC is estimated from the blank sky observations (see, Antia et al., 2017). The photon arrival times in level 2 files were corrected to the solar system barycenter by using as1bary222http://astrosat-ssc.iucaa.in/?q=data_and_analysis tool.
For the spectral analysis, we have used the SXT data in addition to the LAXPC data. The SXT data of LMC X–4 was taken in Photon Counting (PC) mode with time resolution of sec. Level 1 data was processed using sxtpipeline version 1.4b which generated the filtered level-2 cleaned event files. The cleaned event files from different orbits in SXT data were merged using sxtevtmergertool. A circular region of 12 arcmin radius was considered as a source region around the source location. Source events were not affected by pile-up as the observed average count rate ( counts/s) was less than the threshold of 40 counts/s for pile-up in the PC mode. The spectra, image and light curve were extracted using the xselect v2.4m tool. The ancillary response file (ARF) was created with sxtARFModule using the arf file provided by SXT team. The response file (sxt_pc_mat_g0to12.rmf) and the blank sky background spectrum file (SkyBkg_comb_EL3p5_Cl_Rd16p0_v01.pha) were used which was provided by SXT team333https://www.tifr.res.in/~astrosat_sxt/dataanalysis.html.
3 ANALYSIS AND RESULTS
Figure 1 shows the snapshot of long term light curve of LMC X–4. The top and bottom panels of this figure respectively correspond to 2–20 keV MAXI/GSC (Mihara et al., 2011) and 15–50 keV Swift/BAT (Krimm et al., 2013) light curves. The span of AstroSat observation is marked with vertical blue lines in both the panels. The observation was made during the high super-orbital phase of LMC X–4.

3.1 TIMING ANALYSIS
Figure 2 shows the background subtracted barycenter corrected light curve of LMC X–4 obtained from SXT and LAXPC binned with 20 s. A complete X-ray eclipse lasting for about 18000 s is clearly visible. Starting from the top, the panels correspond to 0.5–7 keV, 3–7 keV, 7–15 keV, 15–40 keV and 40–80 keV, respectively. The count rate was very low in the 40–80 keV energy band and eclipse profile was not visible beyond 40 keV. The out of eclipse count rate remained constant and no flares were detected during the entire observation. For further analysis we have used only persistent count emission i.e. out of eclipse data.

3.1.1 Power Density Spectrum
We generated power density spectrum (PDS) from SXT and LAXPC light curves covering the intervals of persistent emission. The powspec tool of XRONOS sub-package of ftools (Blackburn et al., 1999) was used for this purpose. The SXT light curve binned at 2.37 sec was divided into stretches of 256 bins. The LAXPC light curve binned at 1 sec was divided into stretches of 1024 bins. The white noise was subtracted from all the PDS and they were normalized (Leahy et al., 1983) such that the integral between two frequencies corresponded to the squared r.m.s. fractional variability. The PDS from all the intervals were then averaged and re-binned geometrically in frequency. Owing to very low net exposure and a low count rate during the persistent emission, the PDS generated with SXT light curve had insufficient statistics and showed large error bars, therefore we have not used SXT data for timing analysis.
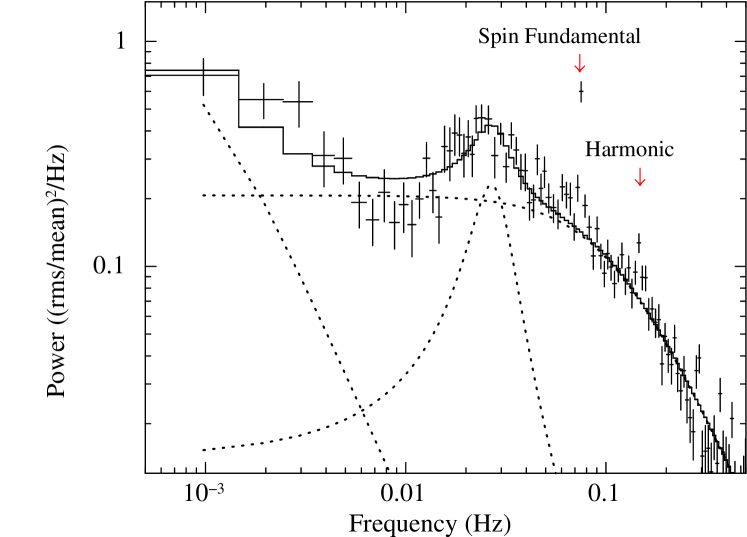
Figure 3 shows the 3–40 keV PDS of LMC X–4 obtained from LAXPC light curve. The PDS consisted of strong red noise, a QPO-like bump at 0.026 Hz, along with spin frequency peak at 0.074 Hz and its harmonic at 0.15 Hz (shown with red arrow marker in Figure 3). We modelled the PDS continuum with two Lorentzians centered at zero frequency. A third Lorentzian component was used to model the QPO feature at frequency of 26 mHz. The data points around the fundamental spin frequency and its harmonic were excluded from the fit. Table 2 gives the best fit model parameters (centre frequency of the Lorentzian , full width half maximum (F.W.H.M. ), quality factor and r.m.s. amplitude of each Lorentzian components. The best fit model yielded a of 153 for 87 degrees of freedom (d.o.f). The error bars reported in this table are at confidence level (= 1.0).
| Energy | Frequency | F.W.H.M. | Quality | r.m.s. |
| (keV) | (mHz) | (mHz) | Factor | (%) |
| 3–40 keVa | 0∗ | |||
| 0∗ | ||||
| Variation of QPO parameters with energy | ||||
| 3–6 | ||||
| 6–12 | ||||
| 12–20 | 10fixed | 2.57 | ||
| 20–40 | 24.11.3 | |||
| a /dof = 153/87 for 3–40 keV PDS | ||||
| ∗This parameter was fixed at zero frequency | ||||
We also investigated the energy dependence of the 26 mHz QPO. The PDS was extracted in 3–6 keV, 6–12 keV, 12–20 keV, 20–40 keV and 40–80 keV energy bands. Above 40 keV, the QPO feature was insignificant. A summary of the QPO characteristics (centre frequency, F.W.H.M., quality factor and r.m.s. amplitude) as a function of energy is listed in Table 2 and shown in Figure 4. The quality factor does not show any clear trend with energy. Though the r.m.s. amplitude of the QPO appears to increase with energy, it is not statistically significant.

3.1.2 Pulsations
The orbital period of LMC X–4 is about 1.4 d and the pulses are expected to lose coherence within a short timescale of few thousands seconds. Therefore assuming a nearly circular orbit, the photon arrival time was corrected for the binary motion using ephemeris reported in Levine et al. (2000).
We used the epoch folding technique (Leahy et al., 1983) to determine the best period. The error in the spin period was estimated by using the bootstrap method described in Lutovinov et al. (2012) and Boldin et al. (2013). Assuming that the count rate at any instant of time in the original light curve is and it has an error of associated with it, we simulated 1000 light curves such that the new count rate () at each instant of time is given by Equation 1. Here, is a uniformly distributed variate between [-1,1].
| (1) |
Spin period was obtained for each of the simulated light curves by using the epoch folding technique. We obtained a standard deviation of sec in the best spin period distribution. This number was taken as error in pulse period. As a result, the best pulse periods of LMC X–4 for AstroSat observation obtained is 13.501606 (16) sec for epoch 57630.0 MJD.
We created energy resolved pulse profiles using the folding technique with the best period obtained for this observation. Figure 5 shows the energy resolved pulse profiles of LMC X–4 in the energy range of 3–80, 3–6, 6–12, 12–20, 20–40 and 40–80 keV, respectively. The observed pulse profiles are similar to that reported with data from Ginga (Woo et al., 1996), RXTE (Levine et al., 2000), BeppoSAX (Naik & Paul, 2004), Suzaku (Hung et al., 2010) and NuSTAR (Shtykovsky et al., 2017). The low energy pulse profiles (3–6 keV and 6–12 keV) comprise of complex structures showing narrow dip around 0.5–0.6 pulse phase. These dips could be due to obscuration by accretion stream (Paul et al., 2002; Naik & Paul, 2004; Beri & Paul, 2017). Dips are not observed above 20 keV and the profile is a smooth sinusoidal in the energy range 20–40 keV. Due to very low signal-to-noise ratio (See Fig. 8), we did not detect pulsed emission in 40–80 keV energy range.

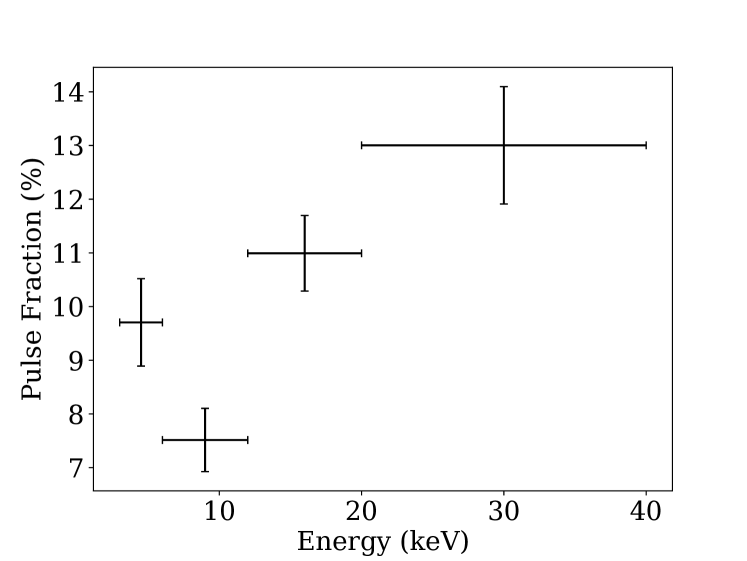
Figure 6 presents the energy dependence of the pulsed fraction , where and are the maximum and minimum intensities of the pulse profile in the corresponding energy range, respectively. From in the 3–6 keV energy range, the pulse fraction decreased to in 6–12 keV energy range. Thereafter, the pulse fraction shows a marginally increasing trend with increasing energy, and in 12–20 keV and 20–40 keV, respectively. We obtained a of 10.9 for 2 dof for a linear trend compared to a of 26 for 3 dof for a constant model. The 3-6 keV pulse profile shows narrow dip (due to obscuration from accretion stream) which causes increase in pulse fraction. Above 6 keV, pulse fraction show an increase with energy. Similar decrease/dip in pulse fraction was also observed with one of the NuSTAR observation of LMC X–4 (Shtykovsky et al., 2018). The increase in pulse fraction with energy has been observed in several bright X-ray pulsars (Lutovinov & Tsygankov, 2009; Shtykovsky et al., 2017).
3.2 Spectral Analysis
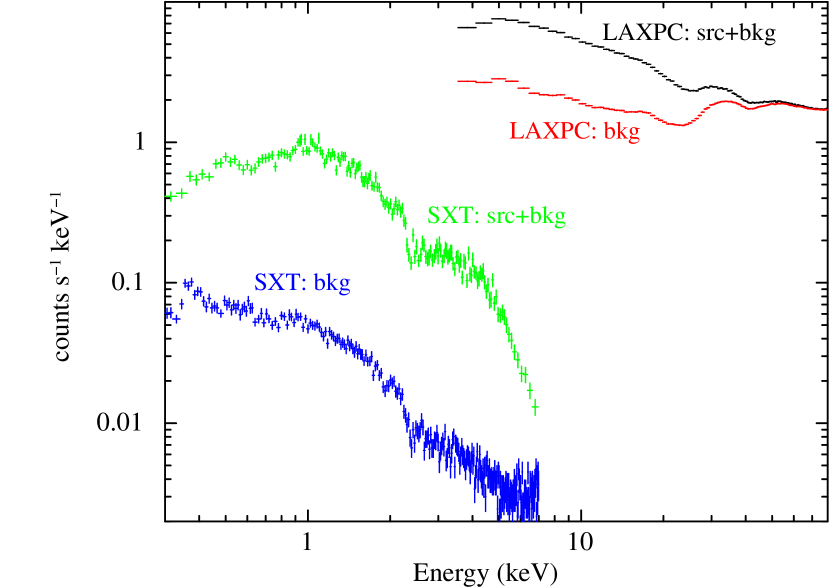
To study the broadband emission spectra of LMC X–4, we performed combined spectral analysis of SXT and LAXPC20. Spectral fitting was performed by using the xspec v 12.12.0 of the Heasoft 6.29 package (Arnaud, 1996). A systematic uncertainty of 1% was used during spectral fitting. A background comparison with the observed signal from SXT and LAXPC is shown in fig. 8. The LAXPC20 spectrum above 25 keV was ignored because of larger uncertainty in background estimation around the K-fluorescence energy of Xe at 30 keV (Antia et al., 2017; Sharma et al., 2020; Beri et al., 2021), which makes it difficult to measure spectrum of faint sources with LAXPC at higher energies. The SXT and LAXPC spectrum were grouped using grppha to have a minimum count of 20 counts per bin. We added a constant component to represent the cross-calibration constant between the SXT and the LAXPC20 instruments. We also applied a gain correction for the SXT. The gain slope was fixed to 1.0 and the gain offset was allowed to vary. We observed a gain offset of eV.
We fitted the 0.5–25 keV SXT+LAXPC spectrum by power law with high energy cutoff ( in xspec) with line of sight absorption (tbabs in xspec). LMC X–4 does not show significant intrinsic absorption. The absorption column density in a direction towards LMC X–4 is low. It is close to the value of galactic absorption. So initially we fixed it to cm-2 (HI4PI Collaboration et al., 2016). Later we allowed the parameter to vary and found the upper limits of atoms cm-2 (Paul et al., 2002).
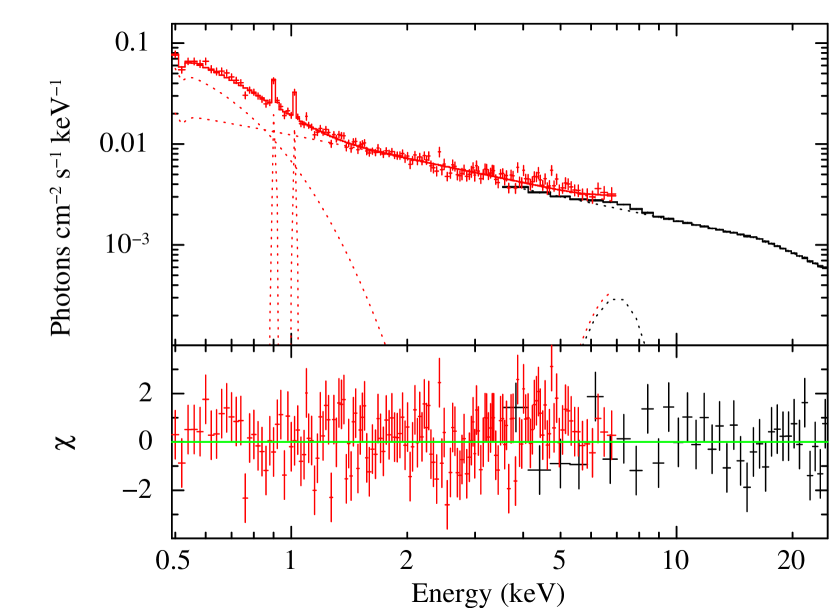
The fit obtained with highecut powerlaw model was not good. The residuals showed significant soft excess at low energies and emission feature at 6–7 keV. To model the emission feature, we added a Gaussian component to the model. The soft excess was modelled with addition of a soft thermal component (bbodyrad). Addition of emission line and soft thermal component significantly improved the fit. The residuals around 1 keV from SXT indicated emission features. Therefore, two Gaussian emission line components were added at 0.9 keV and 1.02 keV for Ne ix and Ne x respectively (Neilsen et al., 2009; Hung et al., 2010). The best fit 0.5–25 keV persistent spectrum of LMC X–4 is shown in Figure 7 and the best fit parameters are listed in Table 3.
| Model | Parameters | SXT+LAXPC |
| TBabs | ( cm-2) | |
| BBodyrad | (keV) | |
| normBB | ||
| (km)c | ||
| HighEcut | (keV) | |
| (keV) | ||
| Powerlaw | ||
| Norm | ||
| Gaussian (Fe K) | (keV) | |
| (keV) | ||
| Eqw (eV) | ||
| Norm () | ||
| Gaussian (Ne ix Heα) | (keV) | |
| (keV) | ||
| Eqw (eV) | ||
| Norm () | ||
| Gaussian (Ne x L) | (keV) | |
| (keV) | ||
| Eqw (eV) | ||
| Norm () | ||
| Constant | ||
| Unabs. Fluxa | ||
| X-ray Luminosityb | ||
| 466.8/412 | ||
| aUnabsorbed Flux in the units of erg cm-2 s-1. | ||
| bX-ray luminosity in the units of erg s-1. | ||
| is obtained assuming no color correction. | ||
We have determined an average unabsorbed 0.5–25 keV flux of erg cm-2 s-1. This corresponds to an unabsorbed X-ray luminosity of erg s-1 for a distance of 50 kpc (Pietrzyński et al., 2013). Assuming absence of other spectral features in a wider energy range, the extrapolated 0.1–100 keV flux was calculated to be erg cm-2 s-1, which translates to an X-ray luminosity of erg s-1.
4 DISCUSSION
In this work, we have presented the results of broadband timing and spectral analysis of HMXB LMC X–4 by using AstroSat data of 2016 August. The source was in its high state of super-orbital motion during this observation. We conclude the following.
-
1.
Detection of energy dependent 26 mHz QPO in a wide energy band of 3–40 keV,
-
2.
Pulse period at 13.501606 (16) sec and energy dependent pulse profiles,
-
3.
0.5–25 keV energy spectrum comprised of absorbed high energy cutoff power law () with high energy cutoff at keV, a soft thermal component at keV and Gaussian components corresponding to Fe Kα, Ne ix and Ne x spectral lines.
QPOs have been detected in the power spectrum of several accreting high magnetic field X-ray pulsars (Angelini et al., 1989; Takeshima et al., 1991; Finger et al., 1996; Paul & Rao, 1998; Kaur et al., 2007) and Low Mass X-ray Binaries (LMXBs; Zhang et al., 1996; Makishima et al., 1999; Kaur et al., 2008; Jain et al., 2010). The QPO characteristics, especially their frequency and their evolution with time and energy, have been used to understand the physical processes that lead to QPO generation, the size of the emitting region and their connection with the spectral parameters (Finger, 1998; Bult & van der Klis, 2015).
In LMC X–4, the QPO r.m.s. is seen to increase with energy with a slope of 0.06(5) % per keV in a broad energy band of 3–40 keV. This indicates that these aperiodic oscillations are not driven by the cold disc component. It is most likely due to variation in the hot plasma. This is also corroborated by the fact that the source luminosity is dominated by the power-law emission (integrated flux of erg cm-2 s-1) rather than the black-body component (integrated flux of erg cm-2 s-1). Although Rikame et al. (2022) have reported a decrease in r.m.s. variability with an increase in energy; the r.m.s. variability in the low energy band (0.3–1 keV; thermal dominated) was 10.1% and in the high energy band (1–10 keV; non-thermal dominated) was 5.3%. The difference in r.m.s. variability in the 0.3–1 keV band compared to the rest of the energy bands could be due to difference in the origin of X-ray radiation at these energies. The soft X-ray emission (below 1 keV) is dominated by the reprocessed emission from the structure around the neutron star (such as accretion disc) whereas the hard X-ray emission is coming from the accretion column above the neutron star poles. The r.m.s. variability of the QPO in this work as well as in Rikame et al. (2022) for energies above 1 keV is similar.
LMC X–4 has been extensively investigated by several X-ray missions. But in order to ascertain the presence of QPO feature, we analysed the light curves from these missions without going into a detailed analysis. XMM-Newton observed LMC X–4 on six occasions. But the mHz QPO has been detected in only two observations (see, Rikame et al., 2022, for more details). BeppoSAX-MECS has observed LMC X–4 twice but QPO feature was not detected in either of them. LMC X–4 was observed by Suzaku thrice. A QPO feature at mHz with r.m.s. of 4.5% was detected in only one observations (obs-ID = 702037010) and that too with significance. There was no detection of a QPO in the longest observation of RXTE. Non-detection of QPOs in most observations clearly suggests that presence of a QPO in LMC X–4 is a transient phenomena, similar to several other accreting pulsars such as Cen X-3, KS 1947+300 and 1A 1118-615 (Raichur & Paul, 2008; James et al., 2010; Nespoli & Reig, 2011).
The pulse profiles of LMC X-4 are significantly energy dependent. The pulse profiles in the soft X-ray energies (3–6 keV and 6–12 keV) showed complex dip-like features, possibly due to absorption from the accretion stream (Paul et al., 2002; Naik & Paul, 2004; Beri & Paul, 2017). Similar features are also reported in the pulse profile of other pulsars (e.g. see, Naik et al., 2008; Naik et al., 2013). At higher energies, profiles are single-peaked, smooth and show an almost sinusoidal behaviour.
The energy spectrum of LMC X–4 is generally described by model comprising of a power-law with high-energy cutoff (Woo et al., 1996; La Barbera et al., 2001; Hung et al., 2010). The Comptonization model has also been used by some authors (La Barbera et al., 2001). We have modelled the 0.5–25 keV energy spectrum with a power law continuum () and a high energy cutoff of 16 keV. Similar numbers have been reported with previous missions (Ginga and ROSAT (Woo et al., 1996), BeppoSAX (La Barbera et al., 2001), and NuSTAR (Shtykovsky et al., 2017).
From the spectral fits, we have found that the power-law emission dominates the black-body component above 1 keV. Following Paul et al. (2002) and Hickox et al. (2004), it is possible that the power-law emission from the neutron star is reprocessed by the inner accretion disc from where the black-body radiation is emitted. Using the normalization of bbodyrad, and assuming a circular emission geometry, the radius of the black-body emission region is estimated to be km for distance of 50 kpc.
From the SXT spectrum, we observed a broad emission line from Fe Kα and narrow emission lines Ne ix and Ne x with equivalent width of 291 eV, 19 eV and 17 eV, respectively. From the NuSTAR observations, Shtykovsky et al. (2017) determined an equivalent width of the iron line to be eV. Neilsen et al. (2009) observed many narrow H-like and He-like emission lines from elements O, N, Ne and Fe. They proposed that Ne ix originated from the stellar winds while Ne x had its origin in the outer accretion disc. These lines were also observed with Suzaku spectra (Hung et al., 2010) and with XMM-Newton+NuSTAR spectra (Brumback et al., 2020). The equivalent width of the observed Fe emission line is consistent with that reported by Naik & Paul (2003) and Neilsen et al. (2009) during the high state of LMC X–4.
Using (van der Meer et al., 2007) for the neutron star and km, we find the velocity at the inner accretion disc to be km s-1, which corresponds to Doppler shift of keV for Fe Kα. The line width observed from spectral fit was keV. This broad Fe line could be Doppler broadened Fe Kα emitted from the inner accretion disc due to the high velocity or produced by emission from Fe in a range of ionization states (Neilsen et al., 2009; Hung et al., 2010).
Acknowledgments
This work has made use of data from the AstroSat mission of the Indian Space Research Organisation (ISRO), archived at the Indian Space Science Data Centre (ISSDC). We thank the LAXPC Payload Operation Center (POC) and the SXT POC at TIFR, Mumbai for providing necessary software tools. We have also made use of data and software provided by the High Energy Astrophysics Science Archive Research Center (HEASARC), which is a service of the Astrophysics Science Division at NASA/GSFC. We also thank the anonymous referee for insightful comments and suggestions.
Data Availability
Data used in this work can be accessed through the Indian Space Science Data Center (ISSDC) at https://astrobrowse.issdc.gov.in/astro_archive/archive/Home.jsp.
References
- Agrawal (2006) Agrawal P. C., 2006, Advances in Space Research, 38, 2989
- Agrawal et al. (2017) Agrawal P. C., et al., 2017, Journal of Astrophysics and Astronomy, 38, 30
- Angelini et al. (1989) Angelini L., Stella L., Parmar A. N., 1989, ApJ, 346, 906
- Antia et al. (2017) Antia H. M., et al., 2017, ApJS, 231, 10
- Antia et al. (2021) Antia H. M., et al., 2021, Journal of Astrophysics and Astronomy, 42, 32
- Arnaud (1996) Arnaud K. A., 1996, in Jacoby G. H., Barnes J., eds, Astronomical Society of the Pacific Conference Series Vol. 101, Astronomical Data Analysis Software and Systems V. p. 17
- Beri & Paul (2017) Beri A., Paul B., 2017, New Astron., 56, 94
- Beri et al. (2021) Beri A., et al., 2021, MNRAS, 500, 565
- Blackburn et al. (1999) Blackburn J. K., Shaw R. A., Payne H. E., Hayes J. J. E., Heasarc 1999, FTOOLS: A general package of software to manipulate FITS files, Astrophysics Source Code Library, record ascl:9912.002 (ascl:9912.002)
- Boldin et al. (2013) Boldin P. A., Tsygankov S. S., Lutovinov A. A., 2013, Astronomy Letters, 39, 375
- Brumback et al. (2020) Brumback M. C., Hickox R. C., Fürst F. S., Pottschmidt K., Tomsick J. A., Wilms J., 2020, ApJ, 888, 125
- Bult & van der Klis (2015) Bult P., van der Klis M., 2015, ApJ, 798, L29
- Epstein et al. (1977) Epstein A., Delvaille J., Helmken H., Murray S., Schnopper H. W., Doxsey R., Primini F., 1977, ApJ, 216, 103
- Falanga et al. (2015) Falanga M., Bozzo E., Lutovinov A., Bonnet-Bidaud J. M., Fetisova Y., Puls J., 2015, A&A, 577, A130
- Finger (1998) Finger M. H., 1998, Advances in Space Research, 22, 1007
- Finger et al. (1996) Finger M. H., Wilson R. B., Harmon B. A., 1996, ApJ, 459, 288
- Giacconi et al. (1972) Giacconi R., Murray S., Gursky H., Kellogg E., Schreier E., Tananbaum H., 1972, ApJ, 178, 281
- HI4PI Collaboration et al. (2016) HI4PI Collaboration et al., 2016, A&A, 594, A116
- Hickox et al. (2004) Hickox R. C., Narayan R., Kallman T. R., 2004, ApJ, 614, 881
- Hung et al. (2010) Hung L.-W., Hickox R. C., Boroson B. S., Vrtilek S. D., 2010, ApJ, 720, 1202
- Inoue (2019) Inoue H., 2019, PASJ, 71, 36
- Jain et al. (2010) Jain C., Paul B., Dutta A., 2010, MNRAS, 403, 920
- James et al. (2010) James M., Paul B., Devasia J., Indulekha K., 2010, MNRAS, 407, 285
- Kaur et al. (2007) Kaur R., Paul B., Raichur H., Sagar R., 2007, ApJ, 660, 1409
- Kaur et al. (2008) Kaur R., Paul B., Kumar B., Sagar R., 2008, ApJ, 676, 1184
- Kelley et al. (1983) Kelley R. L., Jernigan J. G., Levine A., Petro L. D., Rappaport S., 1983, ApJ, 264, 568
- Krimm et al. (2013) Krimm H. A., et al., 2013, ApJS, 209, 14
- La Barbera et al. (2001) La Barbera A., Burderi L., Di Salvo T., Iaria R., Robba N. R., 2001, ApJ, 553, 375
- Lang et al. (1981) Lang F. L., et al., 1981, ApJ, 246, L21
- Leahy et al. (1983) Leahy D. A., Darbro W., Elsner R. F., Weisskopf M. C., Sutherland P. G., Kahn S., Grindlay J. E., 1983, ApJ, 266, 160
- Levine et al. (1991) Levine A., Rappaport S., Putney A., Corbet R., Nagase F., 1991, ApJ, 381, 101
- Levine et al. (2000) Levine A. M., Rappaport S. A., Zojcheski G., 2000, ApJ, 541, 194
- Li et al. (1978) Li F., Rappaport S., Epstein A., 1978, Nature, 271, 37
- Lutovinov & Tsygankov (2009) Lutovinov A. A., Tsygankov S. S., 2009, Astronomy Letters, 35, 433
- Lutovinov et al. (2012) Lutovinov A., Tsygankov S., Chernyakova M., 2012, MNRAS, 423, 1978
- Makishima et al. (1999) Makishima K., Mihara T., Nagase F., Tanaka Y., 1999, ApJ, 525, 978
- Mihara et al. (2011) Mihara T., et al., 2011, PASJ, 63, S623
- Molkov et al. (2015) Molkov S. V., Lutovinov A. A., Falanga M., 2015, Astronomy Letters, 41, 562
- Moon & Eikenberry (2001) Moon D.-S., Eikenberry S. S., 2001, ApJ, 549, L225
- Naik & Paul (2003) Naik S., Paul B., 2003, A&A, 401, 265
- Naik & Paul (2004) Naik S., Paul B., 2004, ApJ, 600, 351
- Naik et al. (2008) Naik S., et al., 2008, ApJ, 672, 516
- Naik et al. (2013) Naik S., Maitra C., Jaisawal G. K., Paul B., 2013, ApJ, 764, 158
- Neilsen et al. (2009) Neilsen J., Lee J. C., Nowak M. A., Dennerl K., Vrtilek S. D., 2009, ApJ, 696, 182
- Nespoli & Reig (2011) Nespoli E., Reig P., 2011, A&A, 526, A7
- Pakull & Olander (1976) Pakull M. W., Olander 1976, IAU Circ., 3017, 3
- Paul & Kitamoto (2002) Paul B., Kitamoto S., 2002, Journal of Astrophysics and Astronomy, 23, 33
- Paul & Rao (1998) Paul B., Rao A. R., 1998, A&A, 337, 815
- Paul et al. (2002) Paul B., Nagase F., Endo T., Dotani T., Yokogawa J., Nishiuchi M., 2002, ApJ, 579, 411
- Pesch et al. (1976) Pesch P., Sanduleak N., Philip A. G. D., 1976, IAU Circ., 3023, 2
- Pietrzyński et al. (2013) Pietrzyński G., et al., 2013, Nature, 495, 76
- Raichur & Paul (2008) Raichur H., Paul B., 2008, ApJ, 685, 1109
- Ramadevi et al. (2018) Ramadevi M. C., et al., 2018, Journal of Astrophysics and Astronomy, 39, 11
- Rao et al. (2017) Rao A. R., Bhattacharya D., Bhalerao V. B., Vadawale S. V., Sreekumar S., 2017, Current Science, 113, 595
- Rikame et al. (2022) Rikame K., Paul B., Pradhan P., Paul K. T., 2022, MNRAS, 512, 4792
- Sharma et al. (2020) Sharma R., Beri A., Sanna A., Dutta A., 2020, MNRAS, 492, 4361
- Shtykovsky et al. (2017) Shtykovsky A. E., Lutovinov A. A., Arefiev V. A., Molkov S. V., Tsygankov S. S., Revnivtsev M. G., 2017, Astronomy Letters, 43, 175
- Shtykovsky et al. (2018) Shtykovsky A. E., Arefiev V. A., Lutovinov A. A., Molkov S. V., 2018, Astronomy Letters, 44, 149
- Singh et al. (2014) Singh K. P., et al., 2014, in Space Telescopes and Instrumentation 2014: Ultraviolet to Gamma Ray. p. 91441S, doi:10.1117/12.2062667
- Singh et al. (2016) Singh K. P., et al., 2016, in den Herder J.-W. A., Takahashi T., Bautz M., eds, Society of Photo-Optical Instrumentation Engineers (SPIE) Conference Series Vol. 9905, Space Telescopes and Instrumentation 2016: Ultraviolet to Gamma Ray. p. 99051E, doi:10.1117/12.2235309
- Singh et al. (2017) Singh K. P., et al., 2017, Journal of Astrophysics and Astronomy, 38, 29
- Takeshima et al. (1991) Takeshima T., Dotani T., Mitsuda K., Nagase F., 1991, PASJ, 43, L43
- Tandon et al. (2017) Tandon S. N., et al., 2017, AJ, 154, 128
- van der Meer et al. (2007) van der Meer A., Kaper L., van Kerkwijk M. H., Heemskerk M. H. M., van den Heuvel E. P. J., 2007, A&A, 473, 523
- White (1978) White N. E., 1978, Nature, 271, 38
- Woo et al. (1996) Woo J. W., Clark G. W., Levine A. M., Corbet R. H. D., Nagase F., 1996, ApJ, 467, 811
- Yadav et al. (2016) Yadav J. S., et al., 2016, in Space Telescopes and Instrumentation 2016: Ultraviolet to Gamma Ray. p. 99051D, doi:10.1117/12.2231857
- Zhang et al. (1996) Zhang W., Morgan E. H., Jahoda K., Swank J. H., Strohmayer T. E., Jernigan G., Klein R. I., 1996, ApJ, 469, L29
Appendix A Source and Background Comparison