Gravitational lensing modification of the high redshift galaxy luminosity function
Abstract
The bright end of the rest-frame UV luminosity function (UVLF) of high-redshift galaxies is modified by gravitational lensing magnification bias. Motivated by recent discoveries of very high-z galaxies with JWST, we study the dependence of magnification bias on the finite size of sources at . We calculate the magnification probability distributions and use these to calculate the magnification bias assuming a rest-frame Schechter UVLF for galaxies at redshift . We find that the finite size of bright high-redshift galaxies together with lens ellipticity significantly suppresses magnification bias, producing an observed bright end which declines more sharply than the power-law resulting from assumption of point sources. By assuming a luminosity-size relation for the source population and comparing with the observed galaxy luminosity function from Harikane et al. (2022), we show that the UVLF can be used to set mild constraints on the galaxies intrinsic size, favoring smaller galaxies compared to the fiducial luminosity-size relation. In the future, wide surveys using Euclid and Roman Space Telescope will place stronger constraints. We also tabulate the maximum magnification possible as a function of source size and lens ellipticity.
keywords:
gravitational lensing: strong – galaxies: high-redshift – galaxies: luminosity function – galaxies: evolution1 Introduction
Study of the rest-frame UV luminosity function (UVLF) is fundamental to understanding the role of high-redshift galaxies during the epoch of reionization and their evolution through cosmic time.
In recent years, surveys have measured the UVLF over a large absolute magnitude interval up to (e.g. Bouwens et al. 2022, Harikane
et al. 2022, Atek et al. 2018, Livermore et al. 2017, Finkelstein
et al. 2015).
These works suggest that the rest-frame UVLF is well fitted by a Schechter function (a power law at faint luminosities and an exponential cut-off at bright luminosities, Schechter 1976) or a double power-law, whose parameters evolve with redshift.
The number counts and flux measurements of high-redshift sources are distorted by gravitational lensing due to foreground structures (Barkana &
Loeb 2000, Wyithe et al. 2011, Mason
et al. 2015).
In particular, considering a Schechter profile for the intrinsic UVLF, the magnification of more numerous fainter galaxies leads to an apparent increase in the observed number of bright galaxies, an effect called magnification bias (Turner
et al. 1984).
Other studies focused on modeling the low magnification regime for virialized and non-virialized lens structures (Fialkov &
Loeb 2015).
Barone-Nugent
et al. (2015) directly measured the magnification bias on a sample of Lyman-break galaxies at in the eXtreme Deep Field (XDF) and the Cosmic Assembly Near-infrared Deep Extragalactic Legacy Survey (CANDELS) fields.
Modification of the statistics of the bright end of the observed high-redshift galaxy UVLF are dominated by galaxy-scale lenses, which are well described by isothermal ellipsoids (Keeton
et al. 1997). Background galaxy sources are finite-sized with a luminosity profile characterized by a characteristic radius.
Both non-spherical lenses and extended sources affect the predictions of a lensing model (e.g. see Schneider
et al. 1992 for a theoretical introduction and Oguri 2002 for an application on the statistics of strong lensing radial arcs).
However, discussion of lensing statistics for high-z galaxies has been restricted to spherical lenses and point sources.
In this Letter we study the combined effect of elliptical lenses and extended sources on the bright end of the luminosity function for high-redshift galaxies.
In Section 2, we obtain magnification probability distributions for extended sources assuming a singular isothermal ellipsoid (SIE) lens model.
In Section 3, we calculate apparent luminosity functions and the magnification bias assuming a rest-frame Schechter UVLF for galaxies at redshift .
We then compare our models with some previous observational results for the UV luminosity functions for galaxies at and show how this could lead to constraints on the intrinsic size distribution for high-redshift galaxies.
Discussion and conclusions are presented in Section 4.
Throughout this paper, we adopt km s-1 Mpc-1, , .
2 Magnification probability distributions
The dimensionless lens equation relating source position to image positions through the deflection angle is
| (1) |
where and are expressed in units of the Einstein radius, which, for a singular isothermal sphere lens model (SIS, see for example Schneider et al. 1992), is
| (2) |
Here is the velocity dispersion. Therefore in galaxy-scale lenses with a geometry such that .
The cosmological distances , , are respectively the angular diameter distances between the observer and the deflector, the observer and the source, and the deflector and the source.
To calculate the magnification, we consider a singular isothermal ellipsoid (SIE, see Kormann et al. 1994) model for the lens, characterized by the parameter defined as the ratio between the minor and major axes of the elliptical isodensity contours111The other model parameters are ignored here, since the connection with the value of the surface mass density is removed by the dimensionless scaling, and our analysis is not sensible to the absolute position and rotation of the lens model..
Due to the singularity of the surface mass density, a SIE lens produces 1, 2 or 4 images of a point source, depending on the position of the source with respect to lens.
Gravitational lensing conserves surface-brightness but stretches the solid angle that an unlensed source subtends in the sky. The ratio of the observed and intrinsic (unlensed) fluxes gives the magnification .
For an extended source, one integrates the point-like magnification over the surface-brightness profile of the source to obtain
| (3) |
An extended source therefore has a lower or equal magnification than a point-source through the same lens.
For example, considering a circular source with a constant surface-brightness near a linear caustic, it has been shown that there is a maximum magnification at a finite distance from the caustic (see Appendix of Schneider &
Weiss 1987).
This implies that the magnification probability distribution has a cutoff after .
Our choice of modeling elliptical lenses and extended sources improves upon the previous statistical lensing studies on the luminosity function of high-redshift galaxies, which considered point-like sources and a singular isothermal sphere model for the lenses (Wyithe et al. 2011, Mason
et al. 2015).
The effect of the finite size of a source becomes significant when it is comparable with its distance from the caustic.
We expect bright galaxies at high-redshift to have angular sizes (e.g. see Liu
et al. 2017 for a semi-analytical model of high-z galaxies size), which is smaller than but comparable to the Einstein radius .
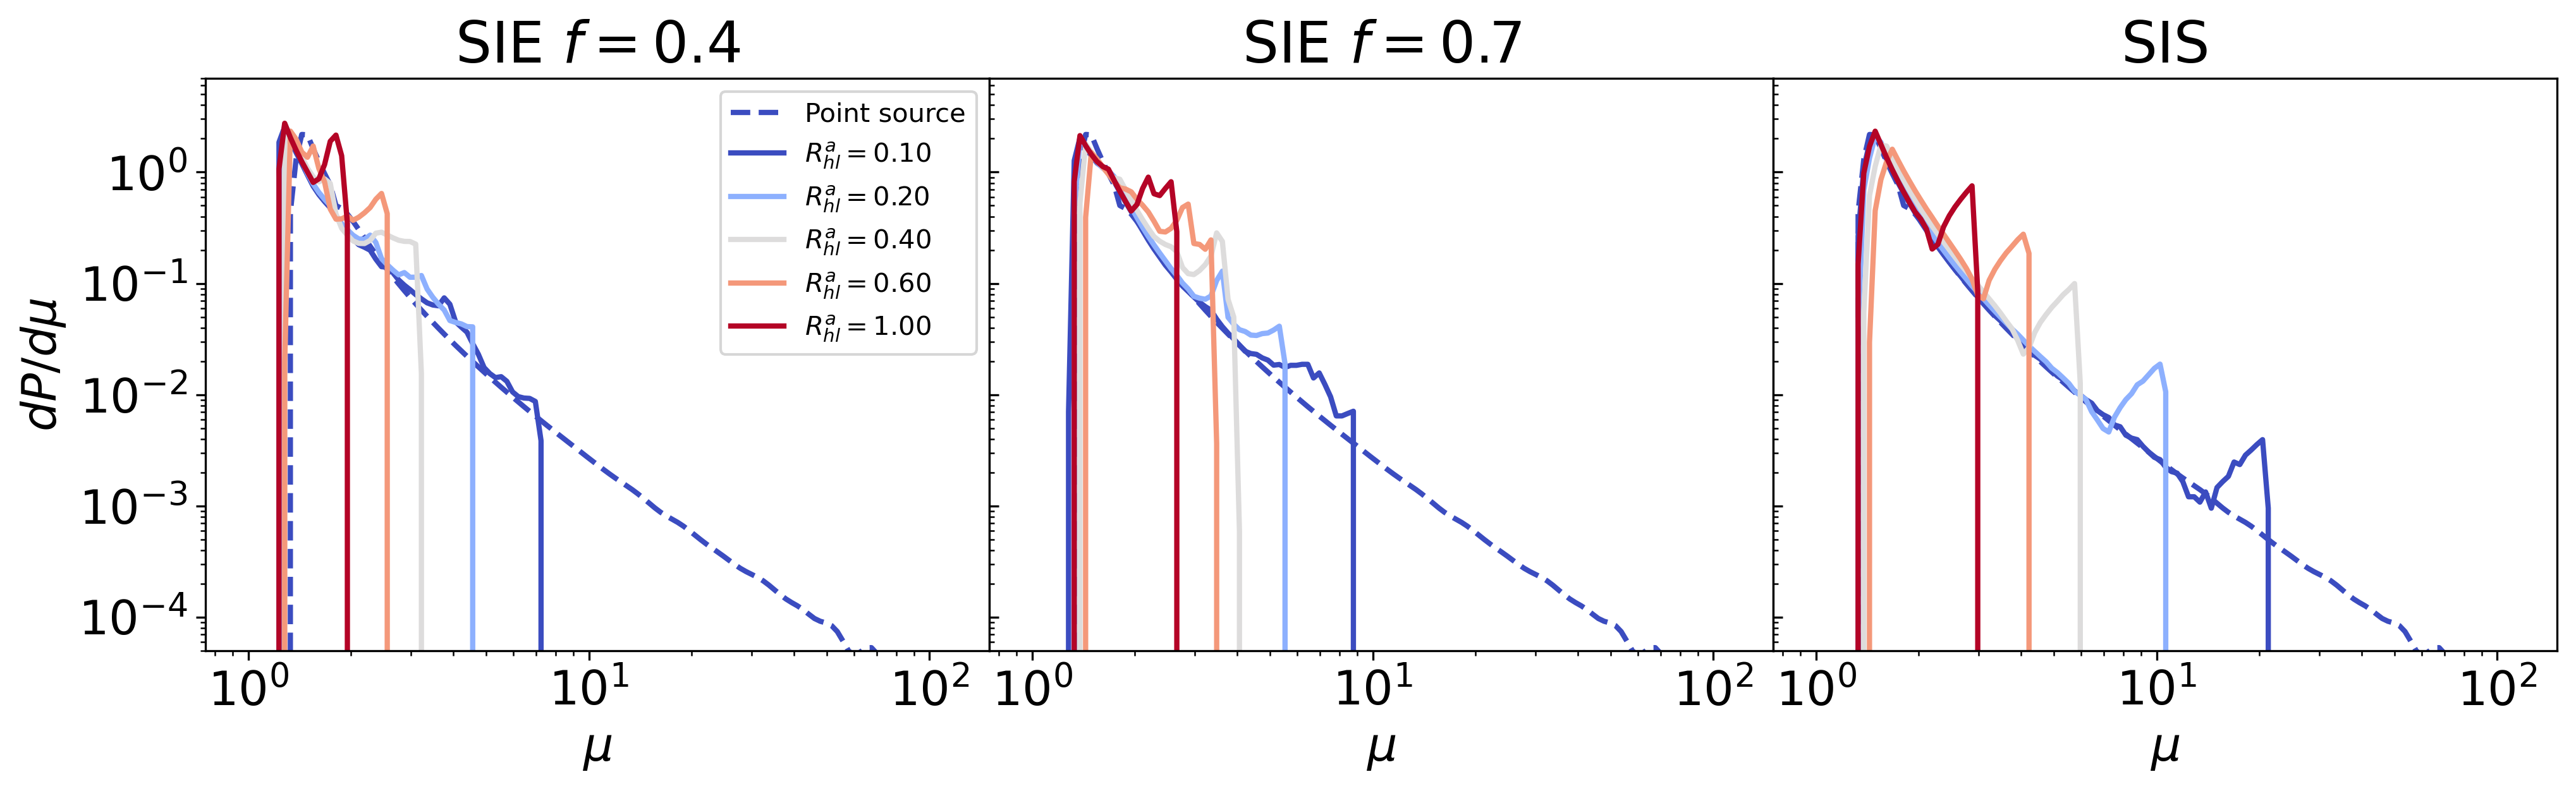
We implemented the numerical solution for the SIE lens model discussed in Kormann et al. (1994), initializing a dimensionless source plane with a square area divided in pixels.
We chose the value to be , to have both high resolution in the high magnification regions and explore the low magnification regions away from the caustic.
We solve the lens equation assuming different choices of the lens axis ratio for a point-like source in each pixel, and retrieved a map of the magnification values for the brightest of the images of each source.
We then applied Eq. (3) considering a circular source with a constant surface-brightness and different choices for the values of the dimensionless half-light radius of the source, obtained by scaling its physical size in the source plane as .
From these magnification maps, we obtained the magnification probability distributions for the brightest image as a function of and .
Some of those are represented in Fig. 1.
The magnification probability distributions for point-like sources show the expected power-law characteristic of the SIS profile (e.g. see Pei 1995, Wyithe et al. 2011), while the magnification probability distributions for extended sources present a cutoff above a certain maximum value of magnification. This maximum increases toward small sources and spherical lenses, and will be of interest in particular observed cases.
The values of maximum magnification as a function of source size and lens ellipticity are listed in Table 1.
| Source dimensions [arcsec ] | |||||||||
| 0.05 | 0.10 | 0.15 | 0.20 | 0.40 | 0.60 | 0.80 | 1.00 | ||
| Lens axes ratio | 1 | 5.74 | 3.62 | 2.87 | 2.46 | 1.95 | 1.49 | 1.23 | 1.18 |
| 2 | 9.12 | 5.97 | 4.74 | 4.06 | 2.66 | 2.03 | 1.68 | 1.49 | |
| 3 | 10.23 | 6.70 | 5.32 | 4.39 | 2.98 | 2.46 | 2.11 | 1.81 | |
| 4 | 11.05 | 7.24 | 5.53 | 4.56 | 3.22 | 2.56 | 2.28 | 1.95 | |
| 5 | 12.41 | 7.82 | 5.97 | 4.92 | 3.35 | 2.66 | 2.28 | 2.19 | |
| 6 | 13.40 | 8.44 | 6.45 | 5.74 | 3.48 | 2.87 | 2.66 | 2.46 | |
| 7 | 14.47 | 8.77 | 7.52 | 5.53 | 4.06 | 3.48 | 2.98 | 2.66 | |
| 8 | 16.24 | 11.49 | 7.52 | 6.20 | 4.92 | 3.91 | 3.22 | 2.76 | |
| 9 | 22.97 | 12.89 | 11.94 | 9.85 | 5.74 | 4.22 | 3.35 | 2.87 | |
| SIS | 42.54 | 21.27 | 14.47 | 10.64 | 5.97 | 4.22 | 3.48 | 2.98 | |
3 Lensed luminosity functions of extended sources
The a-priori probability for a source to be lensed by a foreground galaxy into multiple images is defined as the optical depth (e.g., see Wyithe et al. 2011 and references therein), defined as
| (4) |
where and are respectively the source and lens redshifts, is the velocity dispersion function.
Flux limited samples are also subject to magnification bias, which increases the relative probability that detected galaxies are gravitationally lensed, and concentrates sources in a flux limited sample around foreground objects (Webster et al. 1988, Wyithe et al. 2011).
The observed luminosity function can therefore be approximated as the sum of the apparent luminosity function of the fraction of lensed galaxies and the intrinsic UVLF
| (5) |
We ignored the effective small demagnification in the unlensed UVLF in the right-hand side due to the conservation of flux over the whole sky since its effect is negligible over the bright-end of the apparent UVLF. We adopted the standard Schechter function (Schechter 1976) for the intrinsic luminosity function
| (6) |
The evolution of the Schechter function parameters with respect to redshift is taken from Bouwens et al. (2022) (in particular, see Fig. 6 and Sect. 3.4 in that paper).
The apparent luminosity function of the fraction of lensed galaxies for a fixed value of ellipticity of the lens population is then
| (7) |
where is the dimensionless source plane area used in the previous section to derive .
Note that this expression for the bias is different than the one in Wyithe et al. (2011), as we can’t separate the optical depth term from the integral since in the case of finite sources the magnification probability distribution is a function of the geometry and mass of the lenses.
We adopt the Mason
et al. (2015) velocity dispersion function and its evolution with redshift
| (8) |
with their best fit values for the parameters
, , , , and
.
This is close to the local Velocity Dispersion Function measured by the SDSS (Choi
et al. 2007).
The relation between galaxy size and luminosity is commonly fitted by a power law
| (9) |
where is the effective radius at , and is the slope.
Here is the characteristic UV luminosity for Lyman-break galaxies at , which corresponds to magnitude (Steidel et al. 1999).
As a reference, we adopted the best-fit values of kpc and at found in Liu
et al. (2017).
In this work we favoured the use of this simple relation over more complex luminosity-size relations (e.g. Genel
et al. 2018).
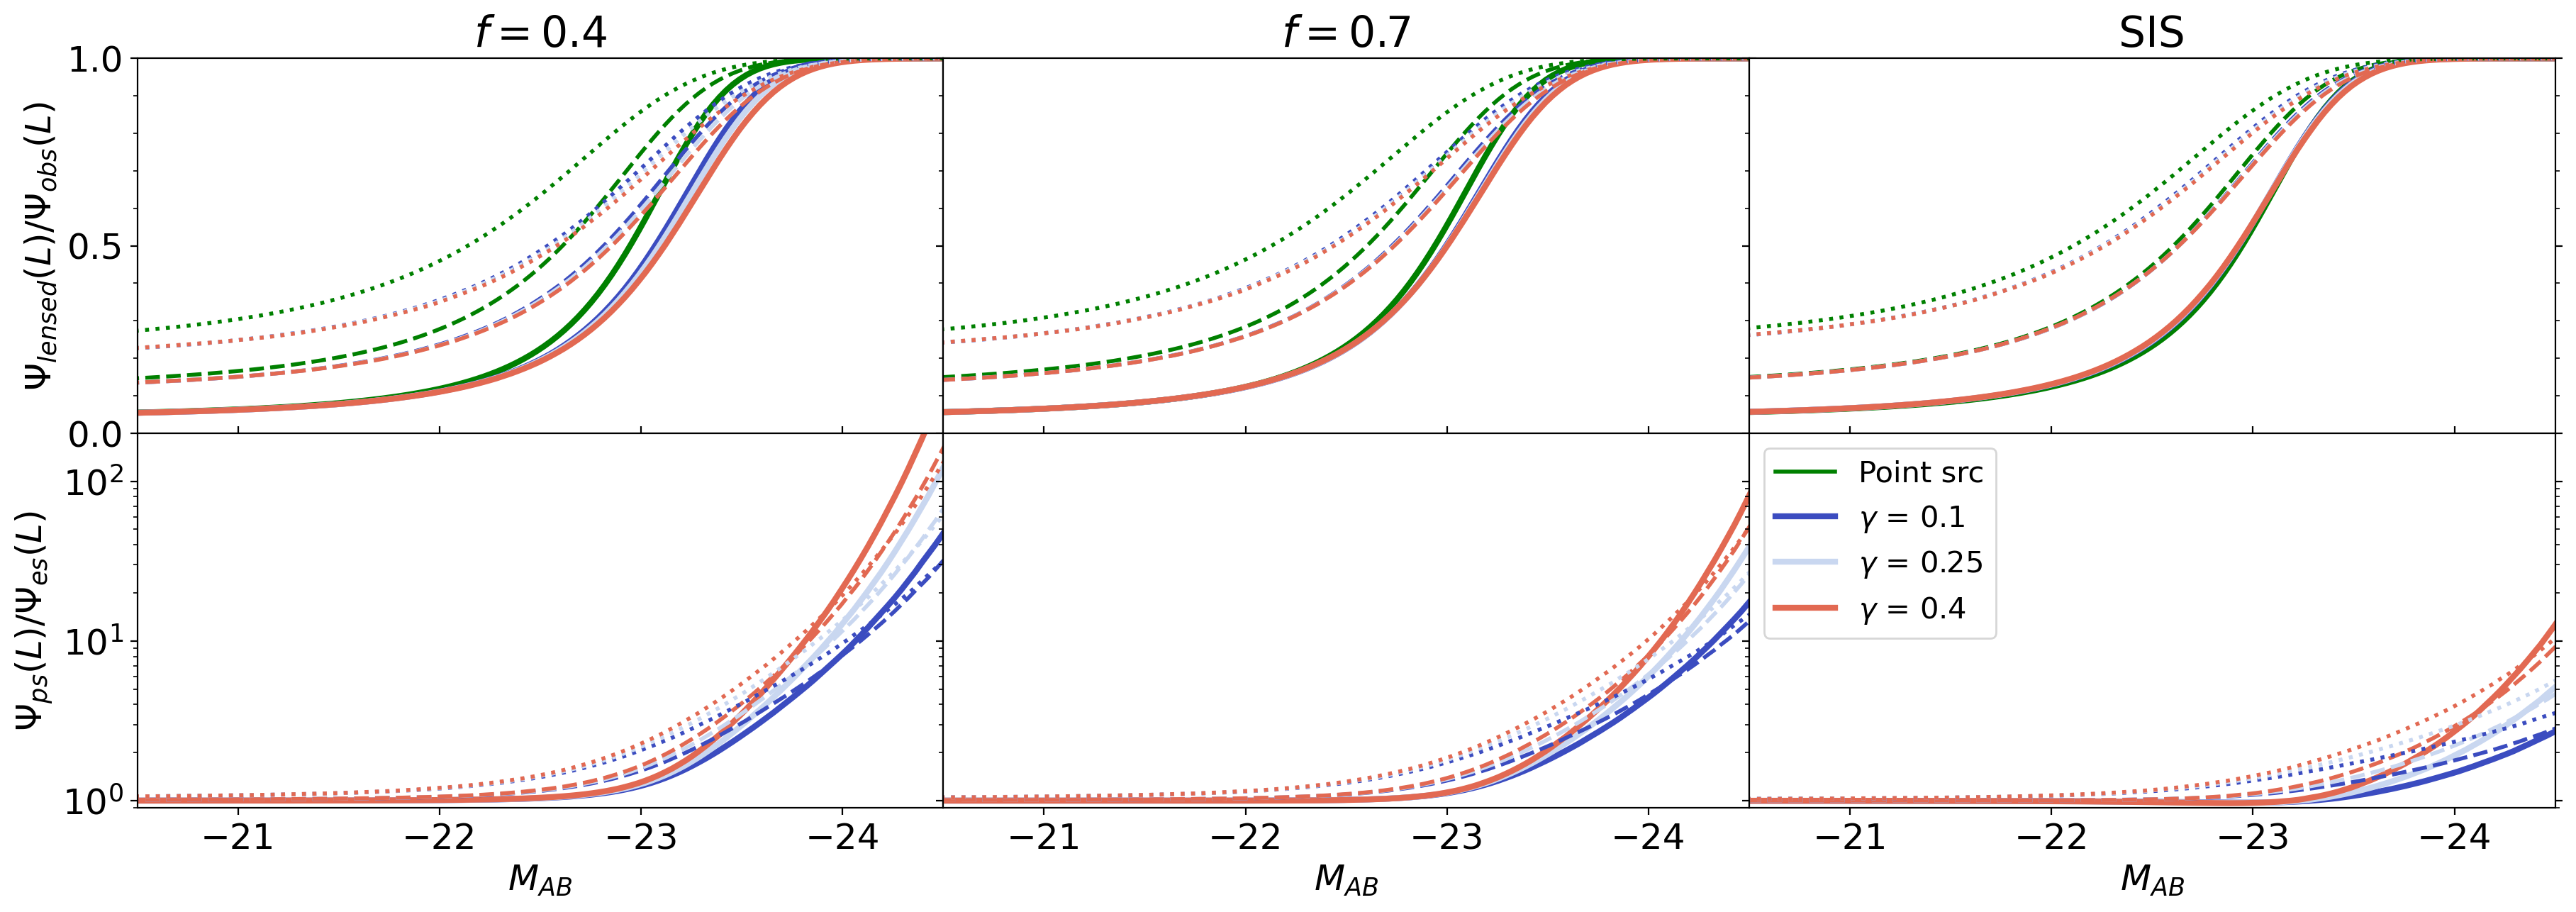
The fraction of observed lensed galaxies per luminosity interval at the bright end is well approximated by the ratio , as shown in the top panel of Fig. 2.
In the lower panel of Fig. 2 we show the ratio of LFs with respect to a point source case. We see that extended sources can suppress the effect of magnification bias by several orders of magnitude.
3.1 Comparison with observed luminosity functions
We next consider the lensed UVLF for a population of lenses with varying ellipticities. Based on the ellipticity distribution for the deflector population, we do a weighted sum over to obtain the predicted observed UVLF
| (10) |
We included the dependency on the ellipticity distribution of lenses using the geometry constraints up to provided by the SDSS (van der Wel et al. 2014) and assuming that the ellipticity of the lensing potential is approximated by the projected star distribution ellipticity 222The assumption is reasonable considering a constant mass-to-light ratio and a weak contribution of the dark matter halo in the central region where strong lensing happens. Within the distributions listed by van der Wel et al. 2014, we choose the one associated with the stellar mass bin at redshift as it represents the galaxy population of the most effective lenses (due to their strength and cosmological distances geometry). The final distribution is approximately a Gaussian centered on with a standard deviation of .
In Fig. 3 we compare our prediction for the galaxy UVLF at to observational results at that redshift from Harikane
et al. (2022) and Bouwens
et al. (2021).
The inset plot shows the value of the Bayes factor comparing the extended source model and the point source model.
The effect of extended sources is to suppress the apparent brightening of the UVLF.
This is due to the cutoff in the magnification probability distribution shown in Fig. 1, which convolved with the exponential shape of the Schechter profile gives the deviation from the power-law bright end expected from point-like sources.
This provides a constraint on the intrinsic size of high-z galaxies because of the small number of observations of bright () sources.
The brightest data-point is compatible with a non-detection, therefore we do not penalize the models that predict a lower density at that magnitude, but the second brightest point marginally favors galaxies that are smaller compared to the predicted L-size relation parameters values from observed high-z galaxies (Kawamata et al. 2018, Yang
et al. 2022, or the clumpy and extended morphologies found in Bowler et al. 2017), simulations (Liu
et al. 2017, Marshall et al. 2019, or the dust-attenuated -size relation in Marshall
et al. 2022).
That is, for a galaxy with at , we find a size of pc instead of kpc found in Liu
et al. (2017) and Kawamata et al. (2018). Yang
et al. (2022) reports a size of around kpc in rest frame optical, and pc in rest frame UV, using a sample of galaxies with from early JWST data.
The lensed Schechter presented in Harikane
et al. (2022) (following Wyithe et al. 2011) is lower than the one predicted in our work, due to the difference in the adopted magnification probability distribution.
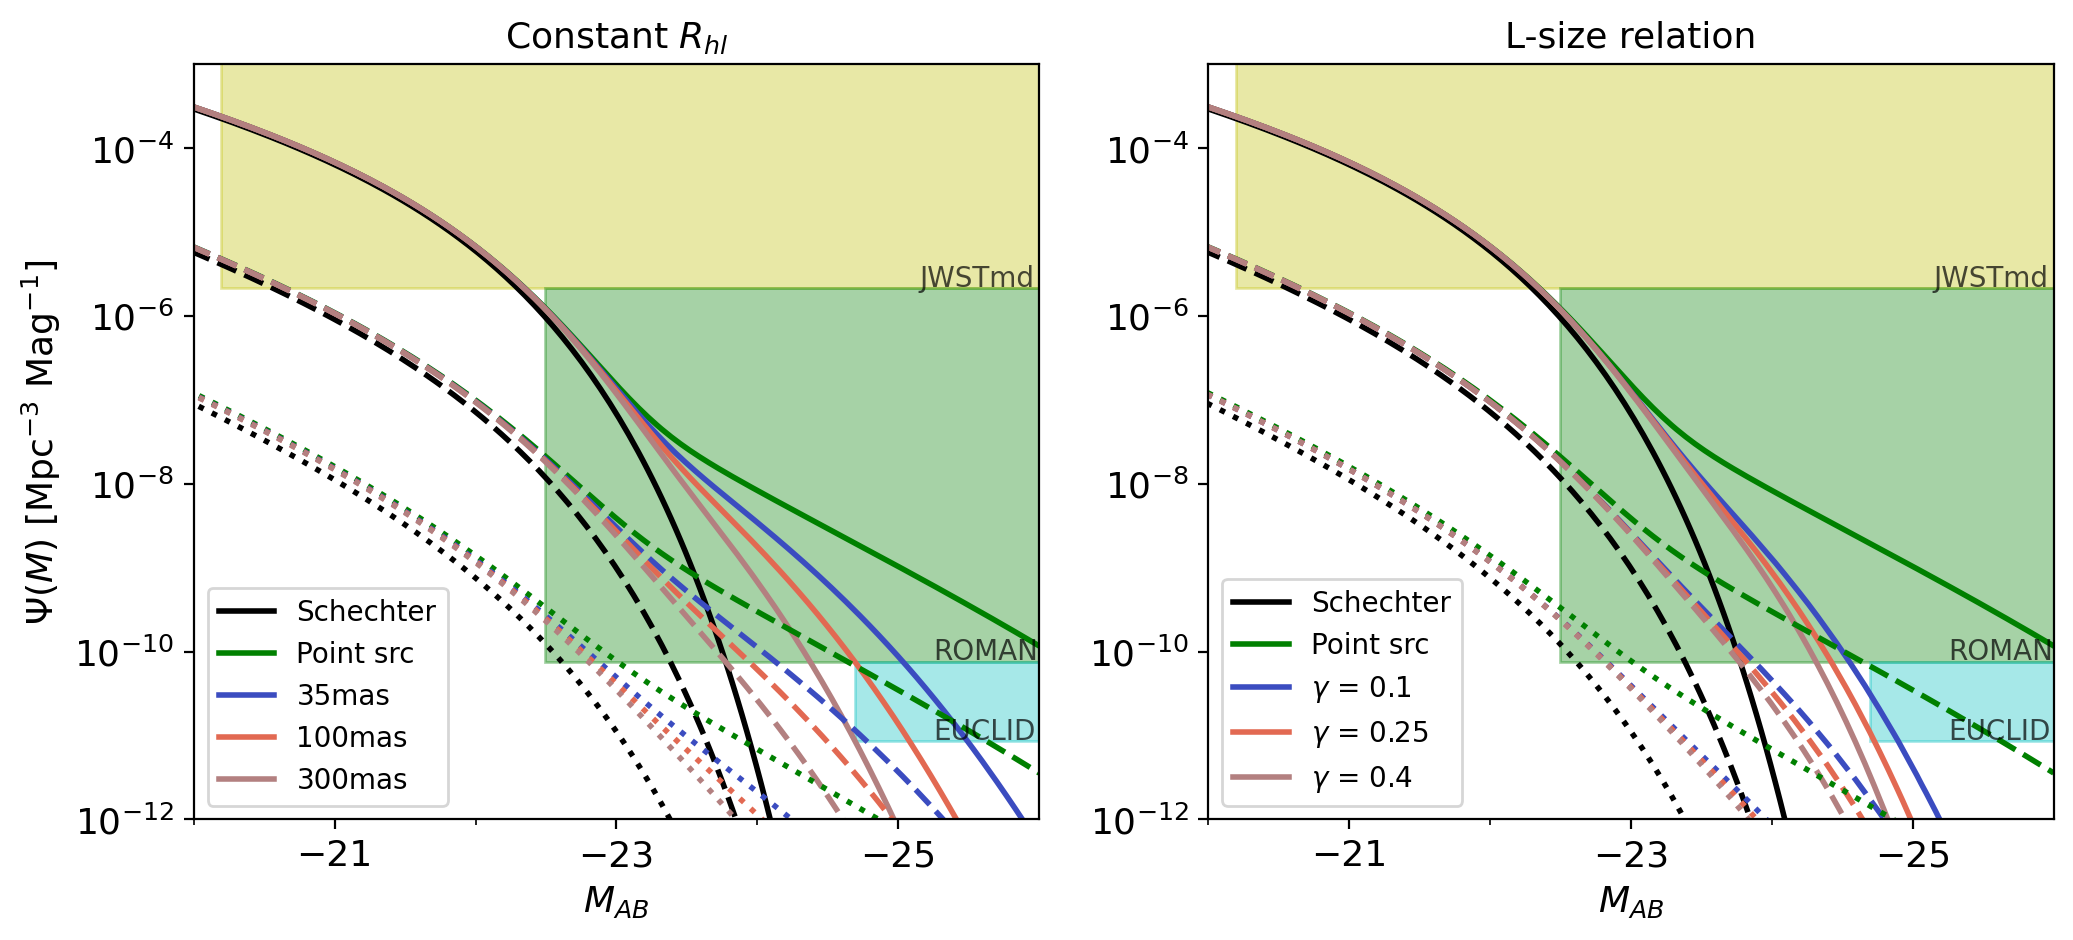
In the future we expect the UVLF at the bright end will probe the source size.
To illustrate, in Fig. 4 we show the observed LFs at for both a constant source size and a size-luminosity relation, along with a comparison to some current and future surveys aiming to probe the first galaxies volume density at the bright end of the UVLF.
We see that the LFs from future wide field high-z surveys could be strongly affected by gravitational lensing.
We note that observations of the bright end of the galaxy luminosity function may suffer AGN contamination (Harikane
et al. 2022; see also Leethochawalit
et al. 2022 and Bagley
et al. 2022 for potential evidence of such contamination at redshift and ).
Additional studies of the intrinsic AGNs luminosity function are needed to correctly disentangle the two population. It is worth remarking that AGNs would behave as point-like sources. However lensing bias would play a negligible effect on them assuming an intrinsic double power-law luminosity function profile (e.g. see Wyithe &
Loeb 2003, Qin
et al. 2017, and Ren &
Trenti 2021).
Furthermore, recent studies by Mason
et al. (2022) and Ferrara
et al. (2022) predict that the bright end of the UV luminosity function of high-z galaxies is strongly affected by dust attenuation. Significant dust attenuation has also been observationally confirmed in bright high-redshift galaxies (e.g. Bowler et al. 2022).
Since this modification on the UVLF profile happens in the rest-frame of the source, it will introduce a steepening in the intrinsic UVLF bright end, thus increasing the effects of gravitational lensing.
If on the other hand the slope of the galaxy size-luminosity relation depends on dust attenuation (Wu 2018, Marshall
et al. 2022), we expect to see a change in the observed bright-end slope at different observed rest-frame wavelengths.
4 Conclusions
In this Letter we calculate the effects of source size of bright high-redshift galaxies and lens ellipticity on gravitational lensing statistics. We show that these significantly suppress magnification bias, producing an apparent bright end with a sharper decline than previously considered.
Comparing our model for the observed UVLF to data from Harikane
et al. (2022), which includes a departure from a Schechter profile at the bright end, we show that the luminosity function can be used to set constraints on the galaxies intrinsic size.
This limited sample favors galaxies that are smaller compared to other predicted luminosity-size relation parameters values (Kawamata et al. 2018, Liu
et al. 2017, Marshall et al. 2019, or the dust-attenuated -size relation in Marshall
et al. 2022).
However, increasing the sample size will be necessary to make a reliable measurement.
In the future, the difference in lensed LFs due to finite source size effects is expected to be measurable by the Roman Space Telescope High Latitude Wide Area Survey, and would allow to constrain the size of galaxies in the epoch of reionization.
Acknowledgments
The authors thank Charlotte Mason for useful suggestions and discussions. This research was supported by the Australian Research Council Centre of Excellence for All Sky Astrophysics in 3 Dimensions (ASTRO 3D), through project number CE170100013.
Data Availability
The modeled data discussed in this Letter will be shared upon reasonable request to the corresponding authors.
References
- Atek et al. (2018) Atek H., Richard J., Kneib J.-P., Schaerer D., 2018, MNRAS, 479, 5184
- Bagley et al. (2022) Bagley M. B., et al., 2022, arXiv e-prints, p. arXiv:2205.12980
- Barkana & Loeb (2000) Barkana R., Loeb A., 2000, ApJ, 531, 613
- Barone-Nugent et al. (2015) Barone-Nugent R. L., Wyithe J. S. B., Trenti M., Treu T., Oesch P., Bouwens R., Illingworth G. D., Schmidt K. B., 2015, MNRAS, 450, 1224
- Bouwens et al. (2021) Bouwens R. J., et al., 2021, AJ, 162, 47
- Bouwens et al. (2022) Bouwens R. J., Illingworth G. D., Ellis R. S., Oesch P. A., Stefanon M., 2022, arXiv e-prints, p. arXiv:2205.11526
- Bowler et al. (2017) Bowler R. A. A., Dunlop J. S., McLure R. J., McLeod D. J., 2017, MNRAS, 466, 3612
- Bowler et al. (2022) Bowler R. A. A., Cullen F., McLure R. J., Dunlop J. S., Avison A., 2022, MNRAS, 510, 5088
- Choi et al. (2007) Choi Y.-Y., Park C., Vogeley M. S., 2007, ApJ, 658, 884
- Ferrara et al. (2022) Ferrara A., Pallottini A., Dayal P., 2022, arXiv e-prints, p. arXiv:2208.00720
- Fialkov & Loeb (2015) Fialkov A., Loeb A., 2015, ApJ, 806, 256
- Finkelstein et al. (2015) Finkelstein S. L., et al., 2015, ApJ, 810, 71
- Genel et al. (2018) Genel S., et al., 2018, MNRAS, 474, 3976
- Harikane et al. (2022) Harikane Y., et al., 2022, ApJS, 259, 20
- Kawamata et al. (2018) Kawamata R., Ishigaki M., Shimasaku K., Oguri M., Ouchi M., Tanigawa S., 2018, ApJ, 855, 4
- Keeton et al. (1997) Keeton C. R., Kochanek C. S., Seljak U., 1997, ApJ, 482, 604
- Kormann et al. (1994) Kormann R., Schneider P., Bartelmann M., 1994, A&A, 284, 285
- Leethochawalit et al. (2022) Leethochawalit N., Roberts-Borsani G., Morishita T., Trenti M., Treu T., 2022, arXiv e-prints, p. arXiv:2205.15388
- Liu et al. (2017) Liu C., Mutch S. J., Poole G. B., Angel P. W., Duffy A. R., Geil P. M., Mesinger A., Wyithe J. S. B., 2017, MNRAS, 465, 3134
- Livermore et al. (2017) Livermore R. C., Finkelstein S. L., Lotz J. M., 2017, ApJ, 835, 113
- Marshall et al. (2019) Marshall M. A., Mutch S. J., Qin Y., Poole G. B., Wyithe J. S. B., 2019, MNRAS, 488, 1941
- Marshall et al. (2022) Marshall M. A., Wilkins S., Di Matteo T., Roper W. J., Vijayan A. P., Ni Y., Feng Y., Croft R. A. C., 2022, MNRAS, 511, 5475
- Mason et al. (2015) Mason C. A., et al., 2015, ApJ, 805, 79
- Mason et al. (2022) Mason C. A., Trenti M., Treu T., 2022, arXiv e-prints, p. arXiv:2207.14808
- Oguri (2002) Oguri M., 2002, ApJ, 573, 51
- Pei (1995) Pei Y. C., 1995, ApJ, 440, 485
- Qin et al. (2017) Qin Y., et al., 2017, MNRAS, 472, 2009
- Ren & Trenti (2021) Ren K., Trenti M., 2021, ApJ, 923, 110
- Schechter (1976) Schechter P., 1976, ApJ, 203, 297
- Schneider & Weiss (1987) Schneider P., Weiss A., 1987, A&A, 171, 49
- Schneider et al. (1992) Schneider P., Ehlers J., Falco E. E., 1992, Gravitational Lenses, doi:10.1007/978-3-662-03758-4.
- Steidel et al. (1999) Steidel C. C., Adelberger K. L., Giavalisco M., Dickinson M., Pettini M., 1999, ApJ, 519, 1
- Turner et al. (1984) Turner E. L., Ostriker J. P., Gott J. R. I., 1984, ApJ, 284, 1
- Webster et al. (1988) Webster R. L., Hewett P. C., Harding M. E., Wegner G. A., 1988, Nature, 336, 358
- Windhorst et al. (2022) Windhorst R. A., et al., 2022, arXiv e-prints, p. arXiv:2209.04119
- Wu (2018) Wu P.-F., 2018, MNRAS, 473, 5468
- Wyithe & Loeb (2003) Wyithe J. S. B., Loeb A., 2003, ApJ, 595, 614
- Wyithe et al. (2011) Wyithe J. S. B., Yan H., Windhorst R. A., Mao S., 2011, Nature, 469, 181
- Yang et al. (2022) Yang L., et al., 2022, ApJ, 938, L17
- van der Wel et al. (2014) van der Wel A., et al., 2014, ApJ, 792, L6