Distant Echoes of the Milky Way’s Last Major Merger
Abstract
The majority of the Milky Way’s stellar halo consists of debris from our Galaxy’s last major merger, the Gaia-Sausage-Enceladus (GSE). In the past few years, stars from GSE have been kinematically and chemically studied in the inner kpc of our Galaxy. However, simulations predict that accreted debris could lie at greater distances, forming substructures in the outer halo. Here we derive metallicities and distances using Gaia DR3 XP spectra for an all-sky sample of luminous red giant stars, and map the outer halo with kinematics and metallicities out to kpc. We obtain follow-up spectra of stars in two strong overdensities — including the previously identified Outer Virgo Overdensity — and find them to be relatively metal-rich and on predominantly retrograde orbits, matching predictions from simulations of the GSE merger. We argue that these are apocentric shells of GSE debris, forming kpc counterparts to the kpc shells that are known to dominate the inner stellar halo. Extending our search across the sky with literature radial velocities, we find evidence for a coherent stream of retrograde stars encircling the Milky Way from kpc, in the same plane as the Sagittarius Stream but moving in the opposite direction. These are the first discoveries of distant and structured imprints from the GSE merger, cementing the picture of an inclined and retrograde collision that built up our Galaxy’s stellar halo.
1 Introduction
The majority of our Galaxy’s stellar halo was likely deposited by one massive merger event, the so-called Gaia-Sausage-Enceladus (GSE, e.g., Deason et al. 2013; Belokurov et al. 2018; Helmi et al. 2018). GSE was discovered as a distinct sequence in the color-magnitude diagram (CMD) of halo stars and as a coherent kinematic population in memory-preserving integrals of motion. Subsequent work has developed a picture of a merger Gyr ago that built up most of the present-day stellar halo (e.g., Haywood et al., 2018; Gallart et al., 2019; Mackereth et al., 2019; Gallart et al., 2019; Lancaster et al., 2019; Bignone et al., 2019; Fattahi et al., 2019; Vincenzo et al., 2019; Naidu et al., 2020; Das et al., 2020; Bonaca et al., 2020; Naidu et al., 2021; Belokurov et al., 2022). To date, GSE has been extensively studied in the inner halo of the Milky Way, out to kpc. In this regime, the GSE debris is thoroughly phase-mixed, and must be identified via kinematic or chemical signatures. Consequently, models are relatively unconstrained regarding the precise orientation and dynamics of the merger.
The hallmark of a major merger like GSE is rapid radialization, depositing stars on radial orbits with low azimuthal angular momentum and high eccentricity (e.g., Amorisco 2017, Naidu et al. 2021, Vasiliev et al. 2022). The metallicity distribution function (MDF) of GSE sharply peaks at and is well-fit by a simple chemical evolution model (e.g., Hasselquist et al., 2020; Naidu et al., 2020; Feuillet et al., 2020; Horta et al., 2022; Johnson et al., 2022; Limberg et al., 2022). Naidu et al. (2020) report a population of retrograde stars dubbed ‘Arjuna’ that closely matches this MDF, and argued that it may represent the early-stripped tail of GSE stars. The existence of this population hints at a retrograde orientation for the merger. Belokurov et al. (2022) instead argue for a prograde configuration based on a mild prograde tilt of nearby ( kpc) GSE debris in the Gaia DR3 RVS sample (Gaia Collaboration et al., 2022a; Katz et al., 2022). Linking the orientation of present-day inner debris to the original trajectory of the merger is further complicated by any precession of the Milky Way disk since , which would change the net angular momentum vector of the Galaxy (e.g., Dillamore et al., 2022; Dodge et al., 2022)
Naidu et al. (2021, hereafter N21) ran a comprehensive suite of N-body simulations of the GSE merger, tailor-made to reproduce the kinematics of GSE and Arjuna stars from the H3 Survey (Conroy et al., 2019b). Their fiducial model consists of a merger beginning at , which started out with a tilted and retrograde orientation before rapidly radializing. No spatial constraints were used to orient their simulations — the initially retrograde orientation is required to reproduce Arjuna’s kinematics in the H3 Survey (Naidu et al., 2020). Nonetheless, their model reproduces the spatial orientation of the observed stellar halo out to kpc (Jurić et al., 2008; Xue et al., 2015; Das & Binney, 2016; Iorio et al., 2018; Iorio & Belokurov, 2019), including a primary axis tilted off the plane of the Galactic disk (Han et al., 2022) and aligned with the so-called Hercules-Aquila Cloud (HAC; Belokurov et al. 2007; Simion et al. 2018, 2019) and inner Virgo Overdensity (VOD; Jurić et al. 2008; Bonaca et al. 2012; Donlon et al. 2019). Li et al. (2016) previously linked the orbit of the so-called Eridanus-Phoenix overdensity to the HAC and VOD as well, suggesting a common origin for all three structures.
The HAC and VOD define a preferred spatial axis for GSE debris between kpc. One of the key predictions from N21 is a stellar stream of retrograde GSE stars beyond these distances, possessing a similar on-sky track to the Sagittarius stream, albeit moving in the opposite direction. This debris should also contain observable apocentric overdensities, with stars ‘echoing’ back and forth between regions of pile-up on the sky. The prediction of debris beyond kpc is generic to simulations of this merger, with more radially anisotropic configurations producing larger fractions of distant debris (e.g., Bignone et al., 2019; Elias et al., 2020).
At more than four times the distance from the GSE-associated VOD lies the outer Virgo Overdensity (OVO; Sesar et al. 2017a), a hitherto mysterious structure discovered via RR Lyrae stars (RRL) at kpc. It is interesting to consider that this outer overdensity lies in one of two preferred octants for debris from the GSE merger, perhaps linking it to the extended outer streams predicted by simulations. Likewise, Carlin et al. (2012) used orbital information to associate the VOD to the southern Pisces Overdensity at kpc, another possible distant remnant of GSE (Sesar et al., 2007; Kollmeier et al., 2009; Sesar et al., 2010).
However, disentangling and interpreting these structures has thus far been challenging in the absence of kinematic information. Although RRL have long been standard outer halo tracers due to their precise distances, at kpc they have typical Gaia DR3 tangential (proper motion) velocity uncertainties km s-1. It is also challenging to measure radial velocities for RRL since they exhibit pulsation phase-dependent RV variations that need to be modelled. This makes them unsuitable to search for cold velocity substructures in the outer halo, motivating the need for more luminous tracers like red giant stars.
Red giant branch (RGB) stars are luminous tracers with characteristic tangential velocity uncertainties km s-1 at kpc, an order of magnitude improvement over RRL. This comes at the cost of distance accuracy, and their isochrone distances particularly depend on the assumed metallicity. The third data release from Gaia has revolutionized this latter effort by releasing low-resolution () ‘XP’ prism spectra for million stars brighter than (Montegriffo et al., 2022; De Angeli et al., 2022). These spectra enable us to measure metallicities for red giant stars, deriving much more accurate distances than previously possible. This dataset enables us to, for the first time, comprehensively map the outer halo with 5D and — for the subset with follow-up and literature radial velocities — 6D kinematic information.
In this work, we use luminous red giants with 5D and 6D kinematics to discover echoes of GSE in the outer halo of the Galaxy. We use Gaia DR3 astrometry and spectrophotometry to construct a pure sample of red giants out to kpc. We augment this sample with radial velocities from follow-up spectra and existing spectroscopic surveys, creating an unprecedented dataset with 6D kinematics in the outer halo. We describe our sample construction, metallicity measurements, and follow-up spectroscopy in 2. We present our analysis of apocentric overdensities in 3, and extend our search for GSE debris across the sky in 4. We conclude by discussing our results and future lines of inquiry in 5.
2 Data and Analysis
2.1 Selecting RGB Stars
We begin by assembling a sample of RGB stars using Gaia DR3 astrometry and unWISE infrared photometry (Mainzer et al., 2014; Schlafly et al., 2019; Brown et al., 2021; Lindegren et al., 2021; Gaia Collaboration et al., 2022a). We query Gaia DR3 for sources with mas, mas/yr, and to remove obvious nearby dwarfs and mask out the MW disk. Gaia parallaxes for distant giants are typically low-significance measurements that cannot reliably be turned into distances — most have . However, these parallaxes are still powerful to remove contamination from foreground dwarf stars. For a star with a given apparent magnitude and color, we predict the parallax of a dwarf using MIST isochrones (Choi et al., 2016). We divide the difference between the predicted and observed parallax by the predicted parallax uncertainty for the star’s magnitude, deriving a significance statistic that encodes how many standard deviations lie between the observed parallax and the prediction for a dwarf. Using stars from the H3 Spectroscopic Survey (Conroy et al., 2019b) as a guide, we find that removing stars with results in a pure sample of stars with .
We further purify this sample by applying a broad color cut in the color space to remove dwarfs based on their WISE infrared colors (Conroy et al., 2018, 2021), which increases the sample purity to . Our resulting parent sample consists of RGB stars brighter than in the color range , i.e., K and M type giants.
2.2 5D Giants: Metallicities and Distances with Gaia XP
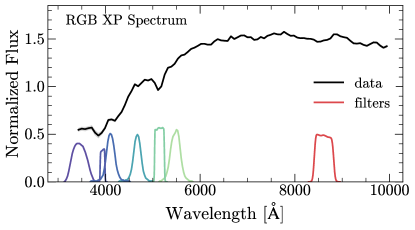
Mapping the spatial and orbital properties of giants requires an estimate of their distance, and photometric isochrone distances are heavily dependent on the assumed metallicity (e.g., Conroy et al., 2021). We therefore derive spectro-photometric metallicities for our giants using low-resolution ‘XP’ prism spectra from Gaia DR3 (De Angeli et al., 2022; Montegriffo et al., 2022). In order to compress the information contained in these continuously-represented spectra into astrophysically interpretable quantities, we compute integrated photometry in several narrow band filters using the GaiaXPy utility (v1.0.2, Ruz-Mieres, 2022; Gaia Collaboration et al., 2022b). These filters are drawn from the J-PLUS and Strömgren systems, and are centred on absorption features that are sensitive to stellar parameters like metallicity (Figure 1, see e.g., Strömgren, 1966; Bailer-Jones, 2004; Marín-Franch et al., 2012). As our feature set, we use colors of the following bands relative to the synthesized band: J0395, J0515, J0861, u, v, b, y. We de-redden these colors using the dust maps of Schlegel et al. (1998) — re-normalized by Schlafly & Finkbeiner (2011) — and restrict our sample to . In practice this removes a small fraction of our sample, since most high-extinction regions are already masked out via the cut on the parent sample.
To map this multidimensional feature set to metallicities, we use high-resolution spectroscopic data from the H3 Survey (Conroy et al., 2019b), which have metallicities estimated using the MINESweeper routine (Cargile et al., 2020). Ideally, we would build a generative model of the spectral energy distributions using theoretical spectra and estimate metallicities in a full fitting framework. However, this method is sensitive to offsets between the theoretical and observed colors, which are challenging to isolate and correct. Instead, we opt for a discriminative regression in which we directly map colors to metallicities in observed space. This circumvents systematic offsets in the theoretical models or filter curves, at the cost of a well-defined error model for the predicted metallicities. This trade-off is quite justified for our present science case (see Rix et al., 2022, for an application of similar techniques).
We select stars from our parent sample that were also observed by the H3 Survey, and consequently have high-resolution [Fe/H] measurements. These stars span a wide range of parameters , , and . We train a two-layer neural network with 16 neurons in each layer to map our XP-synthesized color space to H3-measured [Fe/H] and (Pedregosa et al., 2011). We experimented with less flexible models like linear and quadratic regression, and found that the neural network produced a noticeably better root-mean-square prediction error on test data that was withheld from the training set. We use two-fold cross-validation — training on 1/2 of our dataset and predicted on the remaining 1/2, and vice-versa — to increase our confidence that the chosen regression model is not over-fitting the training data. Our final model predicts H3 [Fe/H] to within 0.3 dex on average, and to within 0.1 dex, with negligible bias (Figure 1, bottom left). Due to the purity of our parent giant sample the vast majority of the data have XP-inferred , but we use the predicted by our model to further clean the sample and remove non-giants with XP-predicted ( of the stars).
We estimate -band distance moduli — and consequently distances — to all giants in our sample using a 10 Gyr MIST isochrone spline-interpolated to each star’s XP-inferred [Fe/H] and . This assumption of a fixed age is well-founded (e.g., Bonaca et al., 2020), and a factor of two change in the assumed age affects the resulting distances by less than . A comparison to spectroscopic distances from the H3 Survey demonstrates that we obtain unbiased distances with scatter out to 100 kpc (Figure 1, bottom right).
2.3 6D Giants
2.3.1 Literature Radial Velocities
In order to derive 6D phase-space information for a subset of our sample, we cross-match our giants to catalogs from the Sloan Extension for Galactic Understanding and Exploration (SEGUE; Lee et al. 2008; Yanny et al. 2009; Eisenstein et al. 2011; Alam et al. 2015), and Large Sky Area Multi-Object Fibre Spectroscopic Telescope (LAMOST; Cui et al. 2012; Zhao et al. 2012; Xiang et al. 2019), as well as the H3 Survey (Conroy et al., 2019b; Cargile et al., 2020). We use a version of the SEGUE catalog with parameters estimated via the MINESweeper routine (Cargile et al., 2020), which should have more robust [/Fe] values than the default pipeline, and includes spectrophotometric distances. We do not utilize the Gaia DR3 Radial Velocity Survey (RVS; Katz et al. 2022) here, since it contains near-zero stars beyond kpc due to its shallow depth. This yields giants with 6D kinematic information and spectroscopic metallicities, of which are beyond 40 kpc. We refer to both the ‘5D giant’ and ‘6D giant’ datasets in this paper.
2.3.2 Follow-up Spectroscopy with MIKE
To more comprehensively sample the two outer halo overdensities studied in this work, we obtained follow-up spectroscopy for XP-selected giants using the Magellan Inamori Kyocera Echelle (MIKE; Bernstein et al. 2003) spectrograph on the 6.5 m Magellan Clay telescope at Los Campanas Observatory in Chile (PIs Naidu and Ji). We used minute exposures with the 07 slit to attain signal-to-noise (S/N) on the red end of the spectra. We reduced the data using the CarPy utility, and derived radial velocities using Payne4MIKE with typical uncertainties km s-1 (Kelson, 2003; Ting et al., 2019, Ji et al., in preparation). Further details on the target selection and analysis are described in 3.
Our MIKE spectra have SNR in the calcium triplet (CaT) region, but only SNR in the bluer ( Å) portions of the spectrum, hampering a sophisticated fit to the entire optical spectrum. We therefore derive metallicities for our MIKE stars using the CaT calibration of Carrera et al. (2013). We fit Voigt profiles to each of the three CaT absorption lines using lmfit (Newberg et al., 2009) and derive their equivalent widths. The Carrera et al. (2013) calibration relies on the summed equivalent widths and absolute V-band luminosity () of the star. We make a first estimate of using the XP-inferred metallicity and MIST isochrones. We then compute the spectroscopic metallicity following Carrera et al. (2013), and re-compute . This process is iterated until the metallicity and converge, which in practice occurs within 5 iterations.
Our MIKE CaT metallicities are broadly consistent with the XP metallicities for these stars, with a median absolute deviation of dex and a bias of dex, and with the MIKE metallicities being slightly more metal-poor than XP (recall that the XP metallicities were trained on H3 Survey data, 2.2). This offset is unsurprising given that our adopted CaT metallicity calibration does not take into account -enhancement, whereas H3 jointly fits for [Fe/H] and [/Fe] with high-resolution spectra of the Mgb triplet region (Cargile et al., 2020). We utilize the MIKE metallicities (and their corresponding isochrone distances) for the remainder of this work except where otherwise noted, while cautioning that there is a slight offset in the MIKE metallicity scale compared to XP and the H3 Survey.
2.3.3 Orbital Parameters
We compute orbital parameters for stars with 6D phase-space information using gala (Price-Whelan, 2017; Price-Whelan et al., 2020), adopting the default MilkyWayPotential. For the Solar position with respect to the Galaxy, we adopt a radius kpc (GRAVITY Collaboration et al., 2018), and a height above the mid-plane pc (Bennett & Bovy, 2019). We use a right-handed Galactocentric cartesian coordinate frame with a solar position kpc, and solar velocity (Reid & Brunthaler, 2004; Drimmel & Poggio, 2018; GRAVITY Collaboration et al., 2018). Orbital parameters are computed after numerically integrating the orbits with a timestep of 1 Myr over 2.5 Gyr.
3 Apocenter Pileup: Echoes in the Galactic North and South
In this section, we use our Gaia DR3 sample to identify RGB stars in the Outer Virgo Overdensity and Pisces Overdensity, and characterize their kinematics and chemistry with follow-up MIKE spectroscopy. We argue that these overdensities represent apocentric shells from the GSE merger, matching several key predictions from simulations of the merger. Finally, we use these stars — along with the N21 simulations — to measure the metallicity gradient of the GSE progenitor out to the edge of its disk.
3.1 Spectroscopic Follow-up of the Outer Virgo Overdensity and its Southern Counterpart
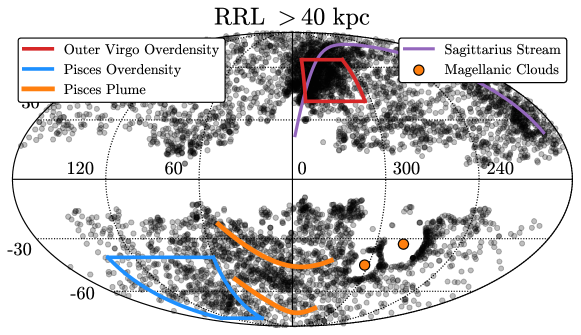
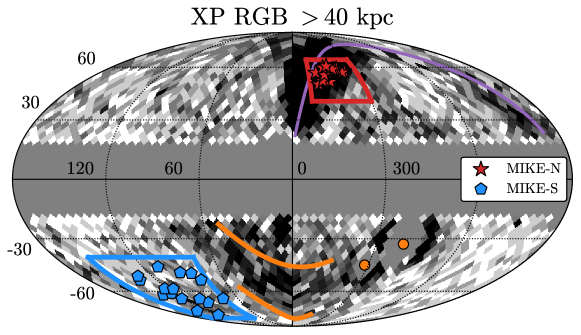
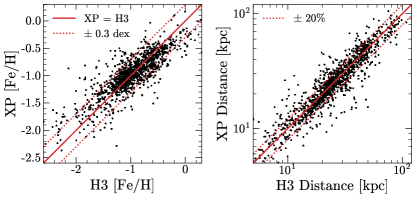
Figure 2 illustrates the kpc outer halo with RRL from Gaia DR3 (top panel, Clementini et al., 2022), and of our 5D XP RGB stars (bottom panel). Several key structures and overdensities are highlighted. The Outer Virgo Overdensity (OVO) was first identified by Sesar et al. (2017a) using RRL from Pan-STARRS (Sesar et al., 2017b). It was described as a strong excess of Pan-STARRS RRL clustered around at a distance of kpc, with a line-of-sight Gaussian extent of kpc (Chambers et al., 2016; Sesar et al., 2017b, a). The northern map is dominated by distant arm of Sagittarius (Majewski et al., 2003), whereas in the south the elongated Pisces Plume is prominent (Belokurov et al., 2019; Conroy et al., 2021). We overlay a polynomial track around to guide the eye along the Plume. The origin of the Pisces Plume is uncertain, particularly whether it contains debris stripped from the Magellanic Clouds, or if it mainly represents the dynamical friction wake of the Large Magellanic Cloud (Belokurov et al., 2019; Conroy et al., 2021).
Apart from the Plume, there is another prominent southern overdensity that we highlight in blue. This structure is spatially coincident with the previously identified Pisces Overdensity (Sesar et al., 2007; Watkins et al., 2009; Kollmeier et al., 2009; Nie et al., 2015), and like the OVO lies in one of the preferred octants for GSE debris. We delineate this structure with and , enclosing the previously identified regions of the overdensity. Our selection is significantly wider than past surveys of the PO, since the overdensity in our K giant sample spans a larger swath on the sky.
The OVO and Pisces Overdensity are shown in Galactic longitude–distance coordinates in Figure 3. We color the stars by their angular separation from the Sagittarius stream track (Law & Majewski, 2010a). The OVO stands out as a clear overdensity off the plane of Sagittarius, and at almost twice the distance of Sagittarius debris in the plane of the sky. The corresponding southern overdensity is weaker and more extended. However, previously-identified RRL are insufficient to kinematically disentangle and identify populations due to their faintness and consequently large tangential velocity uncertainties. We therefore set out to obtain follow-up spectroscopy of RGB stars in both overdensities to obtain 6D kinematics and more precise metallicities for a representative sample of stars.
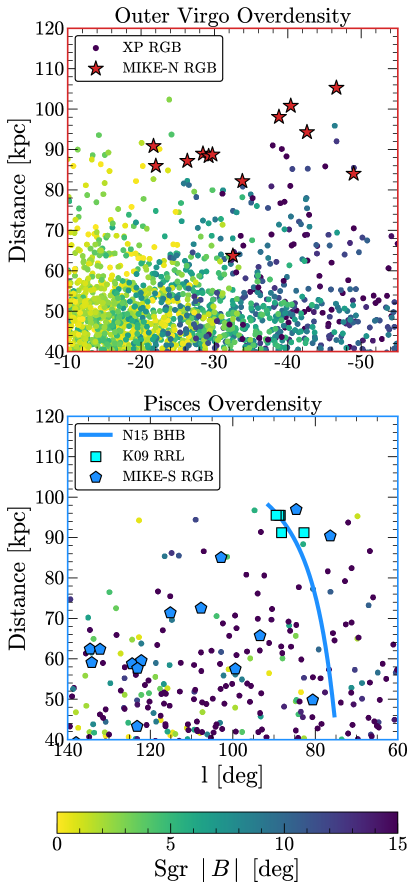
In the north, we selected 13 stars from our 5D XP giants dataset that lie within of the OVO with XP-inferred distances of kpc, bracketing the OVO RRL. We applied no selections on XP-inferred metallicity and kinematics for this northern sample. We performed a corresponding selection for 16 stars in the south, guided by the overdensity of stars visible on the all-sky RRL and RGB maps (Figures 2 & 3). Since the southern overdensity is weaker and more extended, we applied selection in Solar reflex-corrected proper motions of mas yr-1 (% of the sample) to increase the likelihood of selecting retrograde stars. This was guided by the fact that there were two giants in our 6D RGB star catalog (with literature radial velocities) lying in the Outer Virgo Overdensity, and both had retrograde kinematics. We therefore targeted stars with similar kinematics in the south, to ascertain if there was an associated population there. We account for this selection bias in the subsequent interpretations.
Our spectroscopic targets are shown in Galactic coordinates in Figure 2, and are also overlaid on the distance maps of Figure 3. The bottom panel of Figure 3 demonstrates that although our southern targets are in a similar region of sky as the previously-identified Pisces Overdensity, they are closer and more extended in Galactic longitude. We henceforth refer to the respective MIKE samples as MIKE-N (northern OVO) and MIKE-S (southern counterpart around the Pisces Overdensity) to avoid ambiguity. MIKE-N is an unbiased survey of stars lying in the Outer Virgo Overdensity, whereas MIKE-S is a PM-targeted search for stars near the Pisces Overdensity that have a higher likelihood of being retrograde.
3.2 Kinematics of the Outer Overdensities
Following the spectroscopic reduction and fitting described in 2.3.2, we are armed with 6D kinematics and chemistry for our MIKE targets. The MIKE-N stars have median MIKE (XP) [Fe/H] (), whereas the MIKE-S stars have median MIKE (XP) [Fe/H] (). This relatively high metallicity already points to a massive progenitor galaxy for these stars — in the outer halo, the two most likely sources of metal-rich stars are GSE or Sagittarius. We note that Watkins et al. (2009) found a slightly lower [Fe/H] in the Pisces Overdensity (MIKE-S) region, although their sample was more spatially concentrated and centered around kpc compared to our broader sample around kpc (see the bottom panel of Figure 3).
Conroy et al. (2019a) find that stars in the H3 Survey beyond kpc have a richly structured metallicity distribution, with both metal-rich ([Fe/H] ) and metal-poor ([Fe/H] ) components. Subsequent work has argued that the majority of the [Fe/H] stars can be attributed to the GSE merger (Naidu et al., 2020, 2021). Therefore, the metallicity of these overdensities suggests that they might share a common origin with the bulk of the field halo stars at these distances. GSE stars are expected to be tidally stripped over a range of radii, plausibly populating both the field halo and the apocentric overdensities presented in this work.
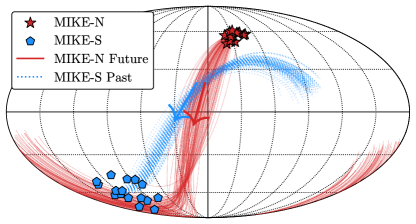
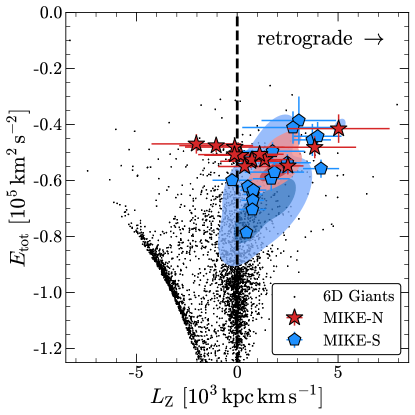
Figure 4 illustrates the kinematics of our MIKE sample. The inverse-variance weighted mean 6D phase-space coordinates of MIKE-N (MIKE-S) stars are integrated forward (backward) in time for 1 Gyr in the gala MilkyWayPotential with 1 Myr timesteps. The motivation for these respective timescales is that in the N21 simulations, the northern debris temporally precedes the southern debris as the GSE progenitor falls into the Milky Way. We sample the mean phase space coordinates from their uncertainty distributions (assuming Gaussian uncertainties on the observed coordinates and kinematics) and display 100 realizations of these orbits in the top panel of Figure 4. The MIKE-N and MIKE-S populations — and by extension the underlying Outer Virgo Overdensity and at least the retrograde portion of the Pisces Overdensity — appear kinematically associated, moving in a common orbital plane. The correspondence is not exact, suggesting that these populations may have been stripped at different times during the merger, and hence occupy slightly different orbital planes and phases. Furthermore, the assumed potential is static and likely inaccurate in detail (e.g., Erkal et al., 2019; Koposov et al., 2022). Regardless, these orbits suggest that the northern stars will occupy a region near the southern overdensity in a Gyr, and conversely that the southern stars used to reside near the northern overdensity a Gyr ago. These are possible signatures of a pair of apocentric pileups, evoking an image of stars ‘echoing’ between these overdensities over time.
The bottom panel of Figure 4 shows the azimuthal angular momentum versus total orbital energy of these stars. Stars targeted in the northern Outer Virgo Overdensity are overwhelmingly retrograde, despite being selected without any kinematic bias. The two stars with slightly prograde kinematics could be interlopers from the nearby Sagittarius stream, as they also have modestly negative (see the top panel of Figure 3). The southern stars were kinematically selected to have a high likelihood of being retrograde on the basis of proper motions, and are indeed all so. The retrograde nature of these stars strongly argues against an association with the Sagittarius stream, which is highly prograde. These stars are also inconsistent with the extremely negative angular momentum of Sagittarius, having a median .
For comparison, we select star particles from the fiducial N21 GSE merger simulations lying in analogous northern and southern regions beyond kpc, and overlay their distribution with contours in Figure 4. There is a reasonable correspondence between the models and data. In particular, the models predict that the southern stars lie at lower energies (smaller apocenters) than the northern stars, which is reflected in our data. Our MIKE-N targets have a median distance kpc, whereas the MIKE-S stars lie kpc away.
We estimate how close these stars are to their apocenters with the statistic . The stars have a median in the North and in the South. This affirms our conclusion that these stars are piling up near their apocenters. This is analogous to our current understanding of the inner Virgo Overdensity and Hercules Aquila Cloud, which are likewise thought to consist of GSE stars near apocenter (Simion et al., 2019; Iorio & Belokurov, 2019; Naidu et al., 2021; Perottoni et al., 2022; Han et al., 2022).
Previously, Zaritsky et al. (2020) used data from the H3 Survey to independently identify a kinematically cold structure of 15 stars near the Pisces Overdensity at . This structure lies near our MIKE-S sample, although the Zaritsky et al. (2020) stars are more clustered around the canonical Pisces Overdensity RRL than our more extended MIKE-S selection. They argued that these stars may be debris stripped from the Small Magellanic Cloud, based on their negative Galactocentric radial velocities and [Fe/H] mean metallicity. Furthermore, the stars are linked in position and velocity with the gaseous Magellanic stream (Nidever et al., 2008).
As noted by Zaritsky et al. (2020), the distances and angular momenta of these stars are somewhat discrepant compared to the bulk of simulated SMC debris from Besla et al. (2013), although more recent simulations may be in better agreement (Lucchini et al., 2021). The structure reported by Zaritsky et al. (2020) is in fact modestly retrograde, and overlaps with the MIKE-S stars in orbital energy and between (see Figure 4). We therefore speculate that the stars identified by Zaritsky et al. (2020) may also be associated with the distant GSE debris discovered in our work, with a correspondence on-sky, in kinematics, and in mean metallicity. However, this region of sky requires more comprehensive spectroscopy to disentangle the various structures — chiefly the Pisces Overdensity and Pisces Plume (see Figure 2) — and ascertain whether these stars are more plausibly associated with GSE or the Small Magellanic Cloud.
4 Distant Streams of GSE
In 3 we presented follow-up spectroscopy of a pair of on-sky overdensities that correspond to the most prominent GSE debris piling up near apocenter. In this section, we extend the search for debris across the sky using our dataset of RGB stars with 6D kinematics via a cross-match to literature radial velocities. We identify a population of retrograde stars beyond kpc that seem to form a coherent track on the sky, aligned with the apocentric overdensities described in 3. We suggest that these stars are likewise structured remnants from the merger, matching expectations of GSE based on their kinematics and chemistry.
4.1 Selection with 6D Giants
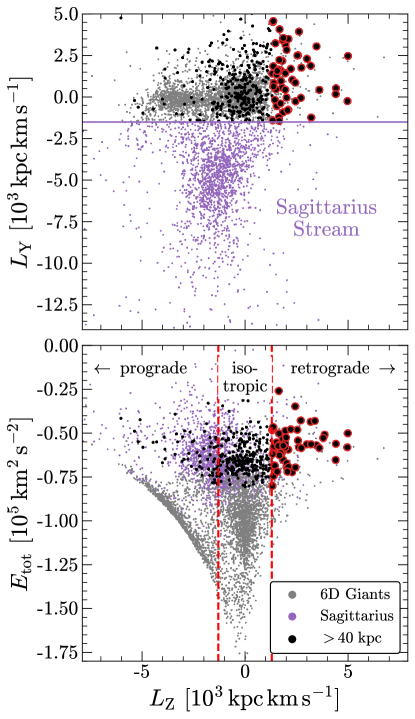
We begin with the 6D giant sample in the energy-angular momentum space (bottom panel of Figure 5). Three structures dominate this space: the prograde and rotationally supported disk, the eccentric and radial GSE locus around , and the cloud of Sagittarius stream stars at higher energies. We disentangle and excise the Sagittarius stars using an cut following Johnson et al. (2020), coloring them separately in subsequent plots (Figure 5, top). Finally, we select stars with XP-inferred distances kpc.
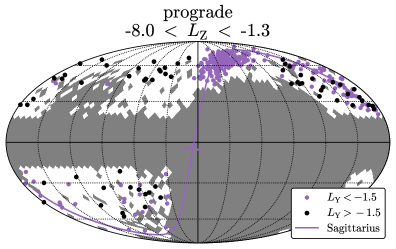
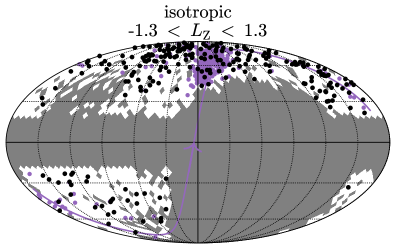
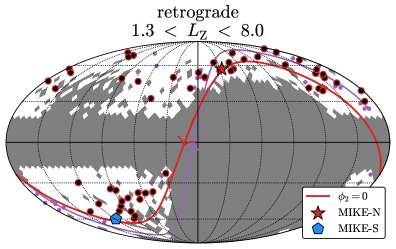
The resulting sample of distant stars is dominated by Sagittarius, with the remaining stars spanning a swatch of azimuthal angular momentum. We split these stars into prograde, isotropic, and retrograde bins and display their spatial distribution in Figure 6. The footprint of our underlying spectroscopic surveys is shown in white, whereas grey regions denote 13 healpixels containing zero spectra in the parent spectroscopic catalogs. The non-Sagittarius prograde stars are scattered across the sky (top left panel), although even our conservative cut appears to have missed some tightly clustered Sagittarius stars in the top-right portion of the map. The bulk of Sagittarius stars fall into our isotropic bin (top right panel), with non-Sagittarius stars uniformly distributed across the sky. Finally, the retrograde selection entirely excludes the Sagittarius stream based on kinematics (bottom left panel). Compared to the isotropic stars, the retrograde stars suggest a stream-like structure in the distant halo, aligned with the MIKE-N and MIKE-S samples presented in 3. These stars lie in a plane similar to that of the Sagittarius stream, but move in the opposite direction. The appearance of this structure is certainly confounded by the selection footprint of the underlying (northern) spectroscopic surveys, although even just the northern stars exhibit a spatial asymmetry in the retrograde selection compared to the isotropic one. There is likely dominant GSE debris in both these panels, since even beyond kpc about half of the GSE debris is predicted by N21 to be radial with low angular momentum. However, we focus here on the retrograde population because it can be clearly differentiated from the field stellar halo.
To quantify the orbital plane of this structure, we fit the distribution of retrograde stars with a great circle, minimizing the mean squared angular deviation of these stars from the great circle track. We use this fitted track to define a coordinate frame aligned with the great circle (red line in the bottom panels of Figure 6). The overlaid track visually emphasizes how this sample of kinematically-selected stars forms a coherent track on the sky, passing through the Outer Virgo Overdensity and Pisces Overdensity. This structure has likely escaped detection thus far due to its spatial overlap with the Sagittarius stream, which dominates these regions of the sky. Of the 6D giants beyond kpc, belong to the Sagittarius stream selection in , whereas only belong to the retrograde structure identified here.
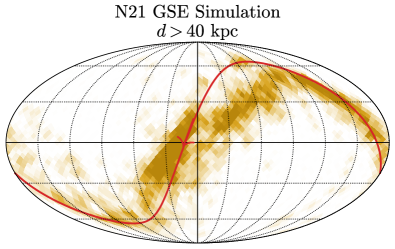
We qualitatively compare our result with simulation-based predictions from N21 in the bottom right panel of Figure 6. We perform the same kpc selection as the data and display the on-sky density of simulated star particles, overlaying the fitted track described above. We emphasize here that the N21 simulations did not utilize any spatial information to constrain their model, yet the predicted track of distant GSE debris is quite consistent with our data. This lends further credence to the proposed retrograde orientation of the merger, building on prior evidence that GSE produced the kpc Hercules Aquila Cloud and (inner) Virgo Overdensity (Simion et al., 2019; Perottoni et al., 2022).
4.2 Stream Coordinates and Chemistry
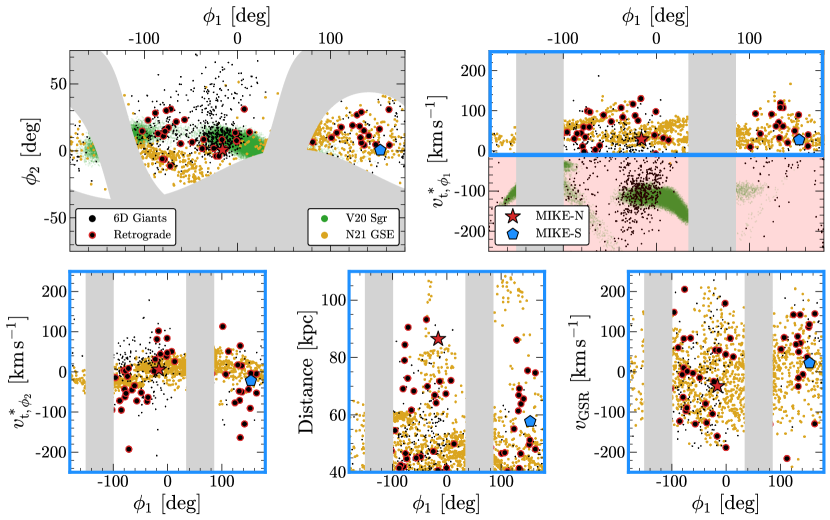
Figure 7 illustrates our sample in the transformed great circle coordinate frame. The entire distant 6D giant sample is shown without the Sagittarius cut applied, to establish the clear difference between GSE and Sagittarius in our data. We show simulation particles of the GSE merger from N21, along with simulated Sagittarius stars from Vasiliev et al. (2021). We select retrograde 6D giants that lie within of the great circle frame — in practice, this spatial cut removes only field retrograde stars that lie elsewhere on the sky. We apply a further purity cut of to select stars that move along the great circle — this removes another stars, leaving 49 stars in the distant retrograde sample. The stars that fail this cut are likely field halo stars that happen to be retrograde, or genuine stream stars with large proper motion errors. Their XP metallicity distribution is peaked at [Fe/H] , consistent with the field halo at these distances (Conroy et al., 2019a). In the bottom panels of Figure 7 we only show stars that satisfy this criterion.
The top right panel of Figure 7 shows tangential velocity along the coordinate, emphasizing how different the proper motions of the retrograde giants are from Sagittarius, despite lying in a similar on-sky plane. Although there is generally good agreement between our data and the N21 simulations in all these panels, the distribution of tangential velocities is hotter in the data than the simulations (bottom left panel). This could reflect some perturbative process not considered in the simulations, like the growing MW disk or the influence of Sagittarius and the LMC (e.g., Law & Majewski, 2010b; Gómez et al., 2015; Erkal et al., 2016; Koposov et al., 2022). The N21 simulations predict distant kpc debris at two location along this stream track, both of which we identify in the data as the Outer Virgo Overdensity (MIKE-N, ) and Pisces Overdensity (MIKE-S, ) respectively (bottom middle panel). The disordered but net km s-1 Galactocentric radial velocities are typical of ‘shells’ of merger debris in simulations (bottom right panel, e.g., Hernquist & Spergel, 1992; Pop et al., 2018; Dong-Páez et al., 2022).
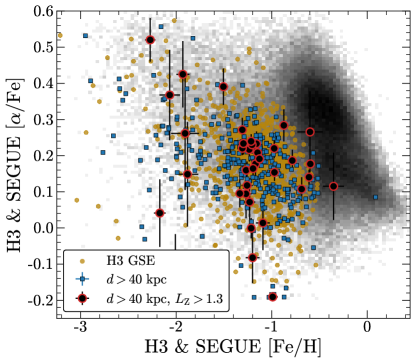
We finally explore this all-sky retrograde debris in chemistry. We utilize the subset of retrograde 6D giants shown in Figure 6 that have data from H3 and SEGUE. Both the H3 and SEGUE datasets were fitted using the MINESweeper routine to derive [Fe/H] and [/Fe], and therefore share the same abundance scale (more details in Cargile et al., 2020). We illustrate this chemical space in Figure 8. The background log-scaled histogram shows all stars in the H3 survey, and the golden points show GSE giants selected from H3 using the cuts of Naidu et al. (2020). The retrograde giants we identify in this work match the GSE chemical sequence, clustering around its locus. We note that much of the outer halo shares a similar locus, perhaps in part because GSE itself forms much of the diffuse outer halo. There are a few retrograde stars off the GSE track with low [Fe/H] and low [/Fe], plausibly stars from past minor mergers with smaller dwarf galaxies (e.g., Cohen & Huang, 2009, 2010).
4.3 Metallicity Gradient of GSE’s Outer Disk
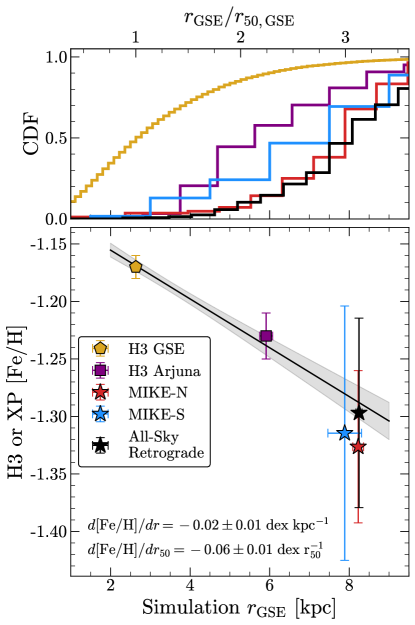
The distant GSE debris identified here is expected to contain the earliest-stripped stars from the outer regions of the GSE progenitor, since they retain the progenitor’s large initial angular momentum prior to radialization. This correspondence between GSE disk radius and present-day angular momentum can be used to trace observed stars back to their predicted location in the simulated GSE disk. We query the snapshots from N21 to select stars similar to our MIKE targets in Galactocentric coordinates, and trace them back to their locations in the intact GSE progenitor. The resulting (cumulative) radial distributions are shown in the top panel of Figure 9. We also show the corresponding distributions for simulation particles selected following the inner GSE and Arjuna selections in the H3 Survey. Clearly, these populations originate from different radial regions of the GSE progenitor. Following N21, we can leverage this effect to measure the metallicity gradient of the GSE progenitor out to times its half-mass radius.
For the GSE and Arjuna metallicities, we utilize the H3 Survey measurements from N21. For the MIKE-N and MIKE-S stars, we use our Gaia DR3 XP metallicities (2) since they were trained on H3 data and should lie on a comparable metallicity scale, whereas the CaT metallicities are systematically offset dex metal-poor compared to XP. Finally, we include the all-sky retrograde debris beyond kpc described in 4.2, again using the XP metallicities for consistency. We select correspondingly distant and retrograde particles from the N21 simulation, after applying the on-sky survey selection function shown in Figure 6.
For each sample described above, we measure the median (spherical) galactocentric radius in the simulated GSE progenitor , as well as the median observed metallicity with bootstrapped uncertainties. We display the resulting metallicity gradient in the bottom panel of Figure 9, along with a linear fit that accounts for the heteroskedastic metallicity measurements. We measure a gradient of , or when normalizing to the simulated GSE half-mass radius of kpc.
The fit is primarily driven by the high-precision H3 datapoints, but the outer debris presented here is entirely consistent with the inferred negative metallicity gradient. Our conclusions are qualitatively unchanged if we use the MIKE CaT metallicities instead, but they are offset dex lower than the XP metallicities and would correspondingly lead to a slight tension with the H3-extrapolated linear trend. We emphasize that these uncertainties are purely statistical, and do not account for the (substantial) systematic uncertainty mapping these populations to via the N21 N-body simulation.
The distant debris presented here probes the very outer disk of the GSE progenitor, and it is reassuring that the metallicity gradient inferred by N21 extrapolates well into this regime. This is a relatively shallow gradient compared to intact dwarf galaxies around the Milky Way (Kirby et al., 2011), supporting the picture that metallicity gradients steepen over cosmic time (e.g., Curti et al., 2020; Sharda et al., 2021; Tissera et al., 2022). We note that if the proposed Sequoia merger (Myeong et al., 2019) is instead a metal-poor and retrograde tail of the GSE merger itself (e.g., Amarante et al., 2022; Horta et al., 2022), then the implied metallicity gradient would be about twice as steep as that measured here (Limberg et al., 2022).
5 Discussion
We have assembled a sample of luminous red giant stars out to kpc and discovered a large population of retrograde debris that we argue represent the most distant echoes of the GSE merger. We first established that the Outer Virgo Overdensity contains predominantly retrograde stars (Figure 4), and found a corresponding retrograde stellar population in the southern hemisphere near the previously identified Pisces Overdensity. These structures match predictions of early-stripped debris piling up near their apocenters, and reproduce two key aspects of the simulations — retrograde kinematics, and a northern overdensity that is further than the southern one. We combined our data with simulations from N21 to map these populations back to their locations in the GSE progenitor’s stellar disk, and measured a negative metallicity gradient in this accreted galaxy out to three half-mass radii that is consistent with past measurements from the H3 Survey.
Searching for more distant retrograde stars in the broader sample of giants, we find that the majority () of retrograde stars beyond kpc coherently lie along a stream-like track that is well-fit by a great circle on the sky (Figure 6). These stars can be cleanly differentiated from co-spatial Sagittarius stream stars based on their kinematics (Figures 6 & 7), and appear chemically consistent with GSE (Figure 8). A truly all-sky picture evades us due to the lack of spectroscopic data in the southern celestial hemisphere. Future spectroscopy of the distant halo in the southern hemisphere (e.g., with SDSS-V, Kollmeier et al. 2017) will help fill in this missing portion of the sky.
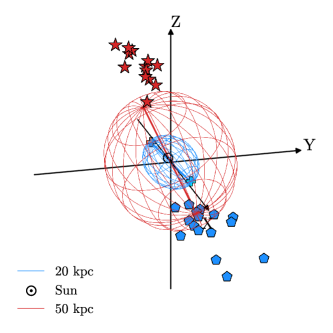
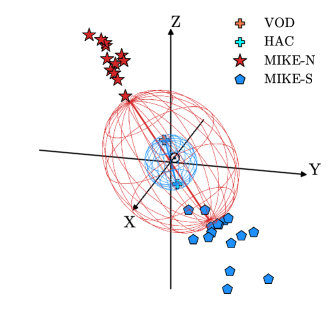
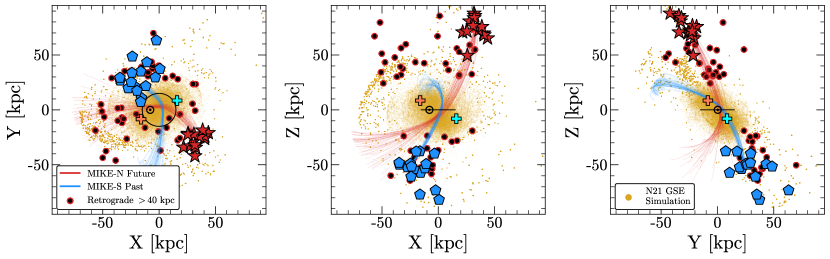
We summarize the Galactocentric distribution of the various structures described in this work in Figure 10, along with the median orbits of the MIKE-N and MIKE-S sample. The top panels show the shape of inner GSE debris in H3 Survey data (Han et al., 2022, blue), along with a scaled up version rotated to match the orientation of the MIKE-N and MIKE-S stars (red). These panels illustrate how the kpc debris presented in this work relate to the previously identified GSE apocenters that form the kpc inner Virgo Overdensity and Hercules Aquila Cloud. There is a offset between the inner and outer overdensities along two axes. This is consistent with the N21 simulations, in which the inner and outer apocenters are misaligned by up to in the XY plane, due to the sharp radialization of the satellite over time. These four overdensities strongly constrain the in-falling trajectory of the GSE progenitor. A natural next step would be to self-consistently simulate the GSE merger to identify a configuration that reproduces the kinematic qualities of the inner halo, along with the spatial orientation of these four overdensities.
5.1 The Emerging Picture of the GSE Merger
In the merger simulations of N21, the GSE progenitor arrived on a tilted and retrograde trajectory before rapidly radializing as it merged with the Milky Way (see also Bignone et al., 2019; Amarante et al., 2022; Vasiliev et al., 2022). The retrograde orientation of the merger was required by N21 to reproduce the kinematics of Arjuna, the population of metal-rich retrograde stars prominently seen in the H3 Survey (Naidu et al., 2020). In this work, we have discovered coherent and relatively metal-rich retrograde debris in the outer halo beyond kpc, which are reasonably consistent with predictions from the N21 simulations. Our findings beyond kpc match spatial constraints of the halo’s shape at closer distances — specifically that the bulk of the halo is oriented along two preferred octants that contain the inner Virgo Overdensity and the Hercules-Aquila Cloud (Figure 10; Iorio & Belokurov 2019; Han et al. 2022).
The existence of a significant population of GSE debris at large has been a generic prediction of simulations of this merger, but the mass and kinematics of this population strongly depends on the assumed configuration. For example, if one invokes an initially radial merger to explain the predominantly radial inner GSE stars, then the remnant could fling a significant fraction of its mass to large distances as it merges (e.g., Elias et al., 2020). However, both N-body simulations and analytic calculations have shown that a merger as massive as GSE would self-radialize on short timescales, eventually creating inner debris with low angular momentum for a wide range of initial merger angular momenta (Amorisco, 2017; Naidu et al., 2021; Vasiliev et al., 2022). In more gradual merger scenarios, a smaller fraction of accreted stars would be deposited at large distances, and they would retain more angular momentum. It is challenging to make quantitative conclusions with our present data given the complex selection functions of the underlying surveys, as well as the use of kinematics to define the distant GSE population in the first place. Regardless, the presence of such a prominent population of retrograde debris in the outer halo leads us to favor the latter merger scenario, in which a retrograde GSE progenitor was gradually stripped of stars that produce the echoes we see beyond kpc. At closer distances, this population transitions into the phase-mixed Arjuna stars, and finally the radialized bulk of GSE debris that dominate the inner stellar halo (Naidu et al., 2020; Donlon et al., 2020).
Our work has presented evidence for distant and early-stripped retrograde GSE debris in the outer halo beyond kpc. These kinematics strongly suggest that the orientation of the GSE merger was retrograde, matching results from N21, and the presence of the retrograde Arjuna population in the H3 Survey from kpc. Conversely, Belokurov et al. (2022) argue for a prograde merger orientation based on the slight prograde tilt of GSE stars in their Gaia DR3 RVS dataset, which is primarily limited within kpc. In the absence of [/Fe] information, the RVS sample could be contaminated by prograde stars from the in-situ halo population (e.g., Bonaca et al., 2017, 2020; Belokurov et al., 2020). However, a more subtle prograde tilt is also seen in the APOGEE DR17 dataset once the in-situ halo is filtered out via [/Fe] (V. Belokurov, private communication; Majewski et al. 2017; Abdurro’uf et al. 2022). A plausible resolution to this discrepancy is that the bulk of retrograde Arjuna stars lie beyond kpc, whereas the RVS and APOGEE samples primarily contain more nearby stars. Therefore, the earlier-stripped retrograde component could be mostly absent from these nearer datasets, while appearing prominently in the more distant H3 Survey, and in this present work.
Any conclusions linking present-day merger debris to the original configuration of the merger are complicated by the precession of the Milky Way disk, which would shift the angular momentum vector of the Galaxy (e.g., Dodge et al., 2022; Dillamore et al., 2022). N21 did not account for disk precession in their angular momentum calculations. However, they also did not model the growing of the MW disk since . It is reasonable to expect that a growing disk could suppress the degree of precession, preserving the linkage between original and present-day angular momenta. The fact that the distant debris shown here closely matches the N21 simulations in angular momentum — despite neglecting the effect of precession — could be a hint that the MW disk has only weakly precessed since . A more comprehensive test would be to self-consistently simulate the GSE merger with a growing disk, and track the evolving angular momentum of the resulting debris.
5.2 An Outer Halo in Disequilibrium
A broader implication of this work is apparent in our all-sky maps of the distant halo (Figure 2). The Milky Way’s outer halo contains significant substructure, and is in fact dominated by it. Due to the prominence of these disequilibrium structures, any efforts to measure the Milky Way’s properties in the outer halo — from its mass to the perturbative response of its dark matter halo (e.g., Garavito-Camargo et al., 2019, 2021; Shen et al., 2022) — will require more sophisticated and time-dependent modelling (e.g., Vasiliev et al., 2021; Lilleengen et al., 2023; Koposov et al., 2022).
Four overdensities overwhelm our maps beyond kpc: the Sagittarius stream, the Outer Virgo Overdensity, the Pisces Overdensity, and the elongated Pisces Plume flowing from the Magellanic clouds. The former three structures are clearly visible in RRL, whereas the latter is most prominent in the RGB maps. In this work we have argued that both the Outer Virgo Overdensity and at least some part of the Pisces Overdensity can be linked to the GSE merger; the origin of the Pisces Plume remains more uncertain, particularly to what extent it comprises Magellanic debris or the dynamical friction wake of the LMC. We have shown here how precise 6D kinematics and chemistry of even a handful of members can offer key links to the origins of a structure.
6 Conclusions
We have constructed an all-sky sample of luminous red giants out to kpc with metallicities from Gaia DR3 XP spectra, and augmented it with radial velocities from public surveys as well as follow-up spectroscopy. The key conclusions from our work are as follows:
-
1.
The outer halo beyond kpc is richly structured, with four prominent overdensities dominating the sky: the Sagittarius Stream, Outer Virgo Overdensity, Pisces Overdensity, and Pisces Plume (Figure 2).
-
2.
Using follow-up MIKE spectroscopy of the OVO and PO, we find both to be relatively metal-rich ([Fe/H] ) — similar to the bulk of the stellar halo at these distances — and orbiting significantly retrograde relative to the MW disk. We consequently argue that both of these overdensities represent apocentric pileup of debris from the Gaia-Sausage Enceladus (GSE) dwarf galaxy, matching key predictions from simulations of the merger (Figure 4).
-
3.
Extending our search across the sky, we find evidence for a vast stream of retrograde stars encircling the Milky Way between kpc, in the same plane as the Sagittarius stream albeit moving in the opposite direction (Figure 6). Together with the OVO and PO, we identify these stars as the earliest-stripped debris from the GSE merger.
-
4.
We use our sample to measure the metallicity gradient in the GSE progenitor out to the edge of its stellar disk, exploiting the link between present-day angular momentum and progenitor galactocentric radius. Although the systematic and statistical uncertainties are large, we find a negative metallicity gradient , consistent with previous studies (Figure 9).
Our discovery of coherent retrograde debris beyond kpc argues for an initially retrograde orbit of the GSE progenitor, a matter of debate in the current literature. The location and kinematics of the stars presented here can be used to further constrain the orbit of the merging progenitor at early times, building towards a precise picture of the last major merger that formed the majority of the Milky Way’s stellar halo. More broadly, the methods presented here to identify distant RGB stars should enable a spectroscopic census of the outer halo in 6D, finally unmasking the patchwork of accreted structure that enshrouds our Galaxy.
Appendix A MIKE Spectroscopy
In Table 1 we list the stars with follow-up MIKE spectroscopy from the MIKE-N (Outer Virgo Overdensity) and MIKE-S (Pisces Overdensity) samples presented in this work. We provide the CaT metallicities as estimated using the calibration of Carrera et al. (2013).
| Gaia Source ID | RA | Dec. | MIKE | MIKE [Fe/H] | |
|---|---|---|---|---|---|
| EDR3 | deg | deg | mag | dex | |
| 3618701644156259840 | 208.208 | -8.921 | 17.1 | -52.2 | -1.5 |
| 3619451541150749696 | 210.237 | -7.164 | 16.9 | 43.5 | -1.1 |
| 3629830484239963392 | 197.219 | -5.127 | 17.1 | 56.5 | -1.2 |
| 3635542382722531072 | 198.599 | -5.704 | 17.1 | 58.1 | -1.3 |
| 3636560530489773312 | 200.267 | -3.084 | 16.8 | 2.5 | -1.2 |
| 3637038882471985536 | 201.534 | -3.407 | 17.3 | 101.3 | -1.3 |
| 3637178009347886976 | 202.26 | -2.88 | 16.9 | -1.1 | -1.5 |
| 3639801478451745152 | 214.924 | -7.219 | 17.1 | -38.2 | -1.8 |
| 3640443314069314432 | 211.555 | -6.825 | 17.0 | -23.5 | -1.4 |
| 3656976434192873088 | 208.364 | -4.257 | 16.6 | 110.6 | -1.4 |
| 3659398314711482624 | 211.511 | -1.183 | 17.4 | 75.5 | -1.3 |
| 3662283261424032256 | 206.258 | -0.294 | 16.6 | -8.2 | -1.3 |
| 3662686709176714752 | 204.023 | -0.192 | 17.1 | 18.1 | -1.2 |
| 2372535196962774912 | 13.193 | -14.292 | 16.4 | -36.8 | -1.1 |
| 2431365283865625472 | 4.032 | -6.307 | 16.7 | -0.2 | -1.3 |
| 2438768536173626752 | 354.67 | -8.787 | 16.9 | -55.2 | -2.4 |
| 2454879993588592512 | 18.87 | -15.281 | 16.1 | 76.9 | -1.2 |
| 2469715257305762560 | 17.086 | -11.468 | 16.9 | -51.3 | -1.2 |
| 2529777385642667136 | 12.537 | -2.1 | 16.8 | -87.6 | -1.3 |
| 2534734362017687680 | 18.063 | 0.101 | 16.3 | -118.7 | -1.3 |
| 2540409830586618240 | 4.513 | -3.509 | 17.0 | -0.7 | -1.6 |
| 2549636867743405952 | 12.98 | 1.578 | 16.9 | 29.3 | -1.1 |
| 2552533462406653696 | 12.949 | 4.514 | 16.3 | 13.4 | -2.2 |
| 2554005502317914112 | 8.786 | 4.096 | 16.7 | -70.6 | -1.8 |
| 2578800279797928576 | 19.916 | 9.139 | 16.3 | -159.8 | -1.2 |
| 2583539312352584960 | 18.82 | 11.716 | 15.9 | -36.6 | -2.2 |
| 2657602587398571904 | 348.964 | 1.815 | 17.0 | -180.6 | -1.6 |
| 2664334794016300288 | 348.748 | 6.481 | 17.2 | -121.0 | -1.2 |
| 2761521550212895232 | 353.562 | 9.753 | 16.9 | -8.9 | -0.8 |
| 2772570443776800384 | 1.776 | 16.206 | 16.1 | -97.3 | -1.1 |
References
- Abdurro’uf et al. (2022) Abdurro’uf, Accetta, K., Aerts, C., et al. 2022, ApJS, 259, 35, doi: 10.3847/1538-4365/ac4414
- Alam et al. (2015) Alam, S., Albareti, F. D., Allende Prieto, C., et al. 2015, ApJS, 219, 12, doi: 10.1088/0067-0049/219/1/12
- Amarante et al. (2022) Amarante, J. A. S., Debattista, V. P., Beraldo E Silva, L., Laporte, C. F. P., & Deg, N. 2022, ApJ, 937, 12, doi: 10.3847/1538-4357/ac8b0d
- Amorisco (2017) Amorisco, N. C. 2017, MNRAS, 464, 2882, doi: 10.1093/mnras/stw2229
- Bailer-Jones (2004) Bailer-Jones, C. A. L. 2004, A&A, 419, 385, doi: 10.1051/0004-6361:20035779
- Belokurov et al. (2019) Belokurov, V., Deason, A. J., Erkal, D., et al. 2019, Monthly Notices of the Royal Astronomical Society: Letters, 488, L47, doi: 10.1093/mnrasl/slz101
- Belokurov et al. (2018) Belokurov, V., Erkal, D., Evans, N. W., Koposov, S. E., & Deason, A. J. 2018, Monthly Notices of the Royal Astronomical Society, 478, 611, doi: 10.1093/mnras/sty982
- Belokurov et al. (2020) Belokurov, V., Sanders, J. L., Fattahi, A., et al. 2020, Monthly Notices of the Royal Astronomical Society, 494, 3880, doi: 10.1093/MNRAS/STAA876
- Belokurov et al. (2022) Belokurov, V., Vasiliev, E., Deason, A. J., et al. 2022, arXiv, arXiv:2208.11135. https://arxiv.org/abs/2208.11135
- Belokurov et al. (2007) Belokurov, V., Evans, N. W., Bell, E. F., et al. 2007, ApJL, 657, L89, doi: 10.1086/513144
- Bennett & Bovy (2019) Bennett, M., & Bovy, J. 2019, MNRAS, 482, 1417, doi: 10.1093/mnras/sty2813
- Bernstein et al. (2003) Bernstein, R., Shectman, S. A., Gunnels, S. M., Mochnacki, S., & Athey, A. E. 2003, in Society of Photo-Optical Instrumentation Engineers (SPIE) Conference Series, Vol. 4841, Instrument Design and Performance for Optical/Infrared Ground-based Telescopes, ed. M. Iye & A. F. M. Moorwood, 1694–1704, doi: 10.1117/12.461502
- Besla et al. (2013) Besla, G., Hernquist, L., & Loeb, A. 2013, Monthly Notices of the Royal Astronomical Society, 428, 2342, doi: 10.1093/mnras/sts192
- Bignone et al. (2019) Bignone, L. A., Helmi, A., & Tissera, P. B. 2019, ApJL, 883, L5, doi: 10.3847/2041-8213/ab3e0e
- Bonaca et al. (2017) Bonaca, A., Conroy, C., Wetzel, A., Hopkins, P. F., & Kereš, D. 2017, ApJ, 845, 101, doi: 10.3847/1538-4357/aa7d0c
- Bonaca et al. (2012) Bonaca, A., Geha, M., & Kallivayalil, N. 2012, Astrophysical Journal Letters, 760, doi: 10.1088/2041-8205/760/1/L6
- Bonaca et al. (2020) Bonaca, A., Conroy, C., Cargile, P. A., et al. 2020, The Astrophysical Journal, 897, L18, doi: 10.3847/2041-8213/ab9caa
- Brown et al. (2021) Brown, A. G., Vallenari, A., Prusti, T., et al. 2021, Astronomy and Astrophysics, 649, 1, doi: 10.1051/0004-6361/202039657
- Cargile et al. (2020) Cargile, P. A., Conroy, C., Johnson, B. D., et al. 2020, The Astrophysical Journal, 900, 28, doi: 10.3847/1538-4357/aba43b
- Carlin et al. (2012) Carlin, J. L., Yam, W., Casetti-Dinescu, D. I., et al. 2012, ApJ, 753, 145, doi: 10.1088/0004-637X/753/2/145
- Carrera et al. (2013) Carrera, R., Pancino, E., Gallart, C., & del Pino, A. 2013, Monthly Notices of the Royal Astronomical Society, 434, 1681, doi: 10.1093/mnras/stt1126
- Chambers et al. (2016) Chambers, K. C., Magnier, E. A., Metcalfe, N., et al. 2016, arXiv, arXiv:1612.05560. https://arxiv.org/abs/1612.05560
- Choi et al. (2016) Choi, J., Dotter, A., Conroy, C., et al. 2016, The Astrophysical Journal, 823, 102, doi: 10.3847/0004-637x/823/2/102
- Clementini et al. (2022) Clementini, G., Ripepi, V., Garofalo, A., et al. 2022, arXiv, arXiv:2206.06278. https://arxiv.org/abs/2206.06278
- Cohen & Huang (2009) Cohen, J. G., & Huang, W. 2009, ApJ, 701, 1053, doi: 10.1088/0004-637X/701/2/1053
- Cohen & Huang (2010) —. 2010, ApJ, 719, 931, doi: 10.1088/0004-637X/719/1/931
- Conroy et al. (2018) Conroy, C., Bonaca, A., Naidu, R. P., et al. 2018, The Astrophysical Journal, 861, L16, doi: 10.3847/2041-8213/aacdf1
- Conroy et al. (2021) Conroy, C., Naidu, R. P., Garavito-Camargo, N., et al. 2021, Nature, 592, 534, doi: 10.1038/s41586-021-03385-7
- Conroy et al. (2019a) Conroy, C., Naidu, R. P., Zaritsky, D., et al. 2019a, The Astrophysical Journal, 887, 237, doi: 10.3847/1538-4357/ab5710
- Conroy et al. (2019b) Conroy, C., Bonaca, A., Cargile, P., et al. 2019b, The Astrophysical Journal, 883, 107, doi: 10.3847/1538-4357/ab38b8
- Cui et al. (2012) Cui, X.-Q., Zhao, Y.-H., Chu, Y.-Q., et al. 2012, RAA, 12, 1197, doi: 10.1088/1674-4527/12/9/003
- Curti et al. (2020) Curti, M., Maiolino, R., Cirasuolo, M., et al. 2020, MNRAS, 492, 821, doi: 10.1093/mnras/stz3379
- Das & Binney (2016) Das, P., & Binney, J. 2016, MNRAS, 460, 1725, doi: 10.1093/mnras/stw744
- Das et al. (2020) Das, P., Hawkins, K., & Jofré, P. 2020, MNRAS, 493, 5195, doi: 10.1093/mnras/stz3537
- De Angeli et al. (2022) De Angeli, F., Weiler, M., Montegriffo, P., et al. 2022, arXiv, arXiv:2206.06143. https://arxiv.org/abs/2206.06143
- Deason et al. (2013) Deason, A. J., Belokurov, V., Evans, N. W., & Johnston, K. V. 2013, ApJ, 763, 113, doi: 10.1088/0004-637X/763/2/113
- Dillamore et al. (2022) Dillamore, A. M., Belokurov, V., Font, A. S., & McCarthy, I. G. 2022, MNRAS, 513, 1867, doi: 10.1093/mnras/stac1038
- Dodge et al. (2022) Dodge, B. C., Slone, O., Lisanti, M., & Cohen, T. 2022, arXiv, arXiv:2207.02861. https://arxiv.org/abs/2207.02861
- Dong-Páez et al. (2022) Dong-Páez, C. A., Vasiliev, E., & Evans, N. W. 2022, MNRAS, 510, 230, doi: 10.1093/mnras/stab3361
- Donlon et al. (2020) Donlon, Thomas, I., Newberg, H. J., Sanderson, R., & Widrow, L. M. 2020, ApJ, 902, 119, doi: 10.3847/1538-4357/abb5f6
- Donlon et al. (2019) Donlon, Thomas, I., Newberg, H. J., Weiss, J., Amy, P., & Thompson, J. 2019, ApJ, 886, 76, doi: 10.3847/1538-4357/ab4f72
- Drimmel & Poggio (2018) Drimmel, R., & Poggio, E. 2018, RNAAS, 2, 210, doi: 10.3847/2515-5172/aaef8b
- Eisenstein et al. (2011) Eisenstein, D. J., Weinberg, D. H., Agol, E., et al. 2011, Astronomical Journal, 142, doi: 10.1088/0004-6256/142/3/72
- Elias et al. (2020) Elias, L. M., Sales, L. V., Helmi, A., & Hernquist, L. 2020, MNRAS, 495, 29, doi: 10.1093/mnras/staa1090
- Erkal et al. (2016) Erkal, D., Sanders, J. L., & Belokurov, V. 2016, Monthly Notices of the Royal Astronomical Society, 461, 1590, doi: 10.1093/mnras/stw1400
- Erkal et al. (2019) Erkal, D., Belokurov, V., Laporte, C. F., et al. 2019, Monthly Notices of the Royal Astronomical Society, 487, 2685, doi: 10.1093/mnras/stz1371
- Fattahi et al. (2019) Fattahi, A., Belokurov, V., Deason, A. J., et al. 2019, MNRAS, 484, 4471, doi: 10.1093/mnras/stz159
- Feuillet et al. (2020) Feuillet, D. K., Feltzing, S., Sahlholdt, C. L., & Casagrande, L. 2020, MNRAS, 497, 109, doi: 10.1093/mnras/staa1888
- Gaia Collaboration et al. (2022a) Gaia Collaboration, Vallenari, A., Brown, A. G. A., et al. 2022a, arXiv, arXiv:2208.00211. https://arxiv.org/abs/2208.00211
- Gaia Collaboration et al. (2022b) Gaia Collaboration, Montegriffo, P., Bellazzini, M., et al. 2022b, arXiv, arXiv:2206.06215. https://arxiv.org/abs/2206.06215
- Gallart et al. (2019) Gallart, C., Bernard, E. J., Brook, C. B., et al. 2019, Nature Astronomy, 3, 932, doi: 10.1038/s41550-019-0829-5
- Garavito-Camargo et al. (2019) Garavito-Camargo, N., Besla, G., Laporte, C. F. P., et al. 2019, The Astrophysical Journal, 884, 51, doi: 10.3847/1538-4357/ab32eb
- Garavito-Camargo et al. (2021) —. 2021, The Astrophysical Journal, 919, 109, doi: 10.3847/1538-4357/ac0b44
- Gómez et al. (2015) Gómez, F. A., Besla, G., Carpintero, D. D., et al. 2015, ApJ, 802, 128, doi: 10.1088/0004-637X/802/2/128
- GRAVITY Collaboration et al. (2018) GRAVITY Collaboration, Abuter, R., Amorim, A., et al. 2018, A&A, 615, L15, doi: 10.1051/0004-6361/201833718
- Han et al. (2022) Han, J. J., Conroy, C., Johnson, B. D., et al. 2022, AJ, 164, 249, doi: 10.3847/1538-3881/ac97e9
- Harris et al. (2020) Harris, C. R., Millman, K. J., van der Walt, S. J., et al. 2020, Nature, 585, 357, doi: 10.1038/s41586-020-2649-2
- Hasselquist et al. (2020) Hasselquist, S., Zasowski, G., Feuillet, D. K., et al. 2020, The Astrophysical Journal, 901, 109, doi: 10.3847/1538-4357/abaeee
- Haywood et al. (2018) Haywood, M., Di Matteo, P., Lehnert, M. D., et al. 2018, ApJ, 863, 113, doi: 10.3847/1538-4357/aad235
- Helmi et al. (2018) Helmi, A., Babusiaux, C., Koppelman, H. H., et al. 2018, Nature, 563, 85, doi: 10.1038/s41586-018-0625-x
- Hernquist & Spergel (1992) Hernquist, L., & Spergel, D. N. 1992, ApJL, 399, L117, doi: 10.1086/186621
- Horta et al. (2022) Horta, D., Schiavon, R. P., Mackereth, J. T., et al. 2022, MNRAS.tmp, doi: 10.1093/mnras/stac3179
- Hunter (2007) Hunter, J. D. 2007, Computing in Science & Engineering, 9, 90, doi: 10.1109/MCSE.2007.55
- Iorio & Belokurov (2019) Iorio, G., & Belokurov, V. 2019, Monthly Notices of the Royal Astronomical Society, 482, 3868, doi: 10.1093/mnras/sty2806
- Iorio et al. (2018) Iorio, G., Belokurov, V., Erkal, D., et al. 2018, MNRAS, 474, 2142, doi: 10.1093/mnras/stx2819
- Johnson et al. (2020) Johnson, B. D., Conroy, C., Naidu, R. P., et al. 2020, The Astrophysical Journal, 900, 103, doi: 10.3847/1538-4357/abab08
- Johnson et al. (2022) Johnson, J. W., Conroy, C., Johnson, B. D., et al. 2022, arXiv, arXiv:2210.01816. https://arxiv.org/abs/2210.01816
- Jurić et al. (2008) Jurić, M., Ivezić, Ž., Brooks, A., et al. 2008, The Astrophysical Journal, 673, 864, doi: 10.1086/523619
- Katz et al. (2022) Katz, D., Sartoretti, P., Guerrier, A., et al. 2022, arXiv, arXiv:2206.05902. https://arxiv.org/abs/2206.05902
- Kelson (2003) Kelson, D. 2003, Publications of the Astronomical Society of the Pacific, 115, 688, doi: 10.1086/375502
- Kirby et al. (2011) Kirby, E. N., Lanfranchi, G. A., Simon, J. D., Cohen, J. G., & Guhathakurta, P. 2011, Astrophysical Journal, 727, doi: 10.1088/0004-637X/727/2/78
- Kollmeier et al. (2009) Kollmeier, J. A., Gould, A., Shectman, S., et al. 2009, Astrophysical Journal, 705, doi: 10.1088/0004-637X/705/2/L158
- Kollmeier et al. (2017) Kollmeier, J. A., Zasowski, G., Rix, H.-W., et al. 2017, in arXiv, 274. https://arxiv.org/abs/1711.03234
- Koposov et al. (2022) Koposov, S. E., Erkal, D., Li, T. S., et al. 2022, arXiv, arXiv:2211.04495. https://arxiv.org/abs/2211.04495
- Lancaster et al. (2019) Lancaster, L., Koposov, S. E., Belokurov, V., Evans, N. W., & Deason, A. J. 2019, Monthly Notices of the Royal Astronomical Society, 486, 378, doi: 10.1093/mnras/stz853
- Law & Majewski (2010a) Law, D. R., & Majewski, S. R. 2010a, Astrophysical Journal, 714, 229, doi: 10.1088/0004-637X/714/1/229
- Law & Majewski (2010b) —. 2010b, Astrophysical Journal, 718, 1128, doi: 10.1088/0004-637X/718/2/1128
- Lee et al. (2008) Lee, Y. S., Beers, T. C., Sivarani, T., et al. 2008, AJ, 136, 2022, doi: 10.1088/0004-6256/136/5/2022
- Li et al. (2016) Li, T. S., Balbinot, E., Mondrik, N., et al. 2016, ApJ, 817, 135, doi: 10.3847/0004-637X/817/2/135
- Lilleengen et al. (2023) Lilleengen, S., Petersen, M. S., Erkal, D., et al. 2023, MNRAS, 518, 774, doi: 10.1093/mnras/stac3108
- Limberg et al. (2022) Limberg, G., Souza, S. O., Pérez-Villegas, A., et al. 2022, ApJ, 935, 109, doi: 10.3847/1538-4357/ac8159
- Lindegren et al. (2021) Lindegren, L., Klioner, S. A., Hernández, J., et al. 2021, Astronomy and Astrophysics, 649, A2, doi: 10.1051/0004-6361/202039709
- Lucchini et al. (2021) Lucchini, S., D’Onghia, E., Fox, A. J., D’Onghia, E., & Fox, A. J. 2021, The Astrophysical Journal Letters, 921, L36, doi: 10.3847/2041-8213/ac3338
- Mackereth et al. (2019) Mackereth, J. T., Schiavon, R. P., Pfeffer, J., et al. 2019, MNRAS, 482, 3426, doi: 10.1093/mnras/sty2955
- Mainzer et al. (2014) Mainzer, A., Bauer, J., Cutri, R. M., et al. 2014, Astrophysical Journal, 792, 30, doi: 10.1088/0004-637X/792/1/30
- Majewski et al. (2003) Majewski, S. R., Skrutskie, M. F., Weinberg, M. D., & Ostheimer, J. C. 2003, The Astrophysical Journal, 599, 1082, doi: 10.1086/379504
- Majewski et al. (2017) Majewski, S. R., Schiavon, R. P., Frinchaboy, P. M., et al. 2017, AJ, 154, 94, doi: 10.3847/1538-3881/aa784d
- Marín-Franch et al. (2012) Marín-Franch, A., Chueca, S., Moles, M., et al. 2012, in Society of Photo-Optical Instrumentation Engineers (SPIE) Conference Series, Vol. 8450, Modern Technologies in Space- and Ground-based Telescopes and Instrumentation II, ed. R. Navarro, C. R. Cunningham, & E. Prieto, 84503S, doi: 10.1117/12.925430
- Montegriffo et al. (2022) Montegriffo, P., De Angeli, F., Andrae, R., et al. 2022, arXiv, arXiv:2206.06205. https://arxiv.org/abs/2206.06205
- Myeong et al. (2019) Myeong, G. C., Vasiliev, E., Iorio, G., Evans, N. W., & Belokurov, V. 2019, Monthly Notices of the Royal Astronomical Society, 1247, 1235, doi: 10.1093/mnras/stz1770
- Naidu et al. (2020) Naidu, R. P., Conroy, C., Bonaca, A., et al. 2020, ApJ, 901, 48, doi: 10.3847/1538-4357/abaef4
- Naidu et al. (2021) —. 2021, ApJ, 923, 92, doi: 10.3847/1538-4357/ac2d2d
- Newberg et al. (2009) Newberg, H. J., Yanny, B., & Willett, B. A. 2009, Astrophysical Journal, 700, 10, doi: 10.1088/0004-637X/700/2/L61
- Nidever et al. (2008) Nidever, D. L., Majewski, S. R., & Butler Burton, W. 2008, ApJ, 679, 432, doi: 10.1086/587042
- Nie et al. (2015) Nie, J. D., Smith, M. C., Belokurov, V., et al. 2015, ApJ, 810, 153, doi: 10.1088/0004-637X/810/2/153
- Pedregosa et al. (2011) Pedregosa, F., Varoquaux, G., Gramfort, A., et al. 2011, Journal of Machine Learning Research, 12, 2825
- Perottoni et al. (2022) Perottoni, H. D., Limberg, G., Amarante, J. A. S., et al. 2022, ApJL, 936, L2, doi: 10.3847/2041-8213/ac88d6
- Pop et al. (2018) Pop, A.-R., Pillepich, A., Amorisco, N. C., & Hernquist, L. 2018, MNRAS, 480, 1715, doi: 10.1093/mnras/sty1932
- Price-Whelan et al. (2020) Price-Whelan, A., Sipőcz, B., Lenz, D., et al. 2020, adrn/gala: v1.3, v1.3, Zenodo, doi: 10.5281/zenodo.4159870
- Price-Whelan (2017) Price-Whelan, A. M. 2017, The Journal of Open Source Software, 2, doi: 10.21105/joss.00388
- Reid & Brunthaler (2004) Reid, M. J., & Brunthaler, A. 2004, ApJ, 616, 872, doi: 10.1086/424960
- Rix et al. (2022) Rix, H.-W., Chandra, V., Andrae, R., et al. 2022, arXiv, arXiv:2209.02722. https://arxiv.org/abs/2209.02722
- Ruz-Mieres (2022) Ruz-Mieres, D. 2022, gaia-dpci/GaiaXPy: GaiaXPy 1.1.4, 1.1.4, Zenodo, doi: 10.5281/zenodo.6674521
- Schlafly & Finkbeiner (2011) Schlafly, E. F., & Finkbeiner, D. P. 2011, ApJ, 737, 103, doi: 10.1088/0004-637X/737/2/103
- Schlafly et al. (2019) Schlafly, E. F., Meisner, A. M., & Green, G. M. 2019, The Astrophysical Journal Supplement Series, 240, 30, doi: 10.3847/1538-4365/aafbea
- Schlegel et al. (1998) Schlegel, D. J., Finkbeiner, D. P., & Davis, M. 1998, ApJ, 500, 525, doi: 10.1086/305772
- Sesar et al. (2017a) Sesar, B., Hernitschek, N., Dierickx, M. I. P., Fardal, M. A., & Rix, H.-W. 2017a, The Astrophysical Journal, 844, L4, doi: 10.3847/2041-8213/aa7c61
- Sesar et al. (2010) Sesar, B., Vivas, A. K., Duffau, S., & Živezić, E. 2010, Astrophysical Journal, 717, 133, doi: 10.1088/0004-637X/717/1/133
- Sesar et al. (2007) Sesar, B., Ivezić, Ž., Lupton, R. H., et al. 2007, The Astronomical Journal, 134, 2236, doi: 10.1086/521819
- Sesar et al. (2017b) Sesar, B., Hernitschek, N., Mitrović, S., et al. 2017b, The Astronomical Journal, 153, 204, doi: 10.3847/1538-3881/aa661b
- Sharda et al. (2021) Sharda, P., Wisnioski, E., Krumholz, M. R., & Federrath, C. 2021, MNRAS, 506, 1295, doi: 10.1093/mnras/stab1836
- Shen et al. (2022) Shen, J., Eadie, G. M., Murray, N., et al. 2022, ApJ, 925, 1, doi: 10.3847/1538-4357/ac3a7a
- Simion et al. (2019) Simion, I. T., Belokurov, V., & Koposov, S. E. 2019, Monthly Notices of the Royal Astronomical Society, 482, 921, doi: 10.1093/mnras/sty2744
- Simion et al. (2018) Simion, I. T., Belokurov, V., Koposov, S. E., Sheffield, A., & Johnston, K. V. 2018, Monthly Notices of the Royal Astronomical Society, 476, 3913, doi: 10.1093/mnras/sty499
- Strömgren (1966) Strömgren, B. 1966, ARA&A, 4, 433, doi: 10.1146/annurev.aa.04.090166.002245
- Ting et al. (2019) Ting, Y.-S., Conroy, C., Rix, H.-W., & Cargile, P. 2019, The Astrophysical Journal, 879, 69, doi: 10.3847/1538-4357/ab2331
- Tissera et al. (2022) Tissera, P. B., Rosas-Guevara, Y., Sillero, E., et al. 2022, MNRAS, 511, 1667, doi: 10.1093/mnras/stab3644
- Vasiliev et al. (2021) Vasiliev, E., Belokurov, V., & Erkal, D. 2021, Monthly Notices of the Royal Astronomical Society, 501, 2279, doi: 10.1093/mnras/staa3673
- Vasiliev et al. (2022) Vasiliev, E., Belokurov, V., & Evans, N. W. 2022, ApJ, 926, 203, doi: 10.3847/1538-4357/ac4fbc
- Vincenzo et al. (2019) Vincenzo, F., Spitoni, E., Calura, F., et al. 2019, MNRAS, 487, L47, doi: 10.1093/mnrasl/slz070
- Virtanen et al. (2020) Virtanen, P., Gommers, R., Oliphant, T. E., et al. 2020, Nature Methods, 17, 261, doi: 10.1038/s41592-019-0686-2
- Watkins et al. (2009) Watkins, L. L., Evans, N. W., Belokurov, V., et al. 2009, MNRAS, 398, 1757, doi: 10.1111/j.1365-2966.2009.15242.x
- Xiang et al. (2019) Xiang, M., Ting, Y.-S., Rix, H.-W., et al. 2019, The Astrophysical Journal Supplement Series, 245, 34, doi: 10.3847/1538-4365/ab5364
- Xue et al. (2015) Xue, X. X., Rix, H. W., Ma, Z., et al. 2015, Astrophysical Journal, 809, 144, doi: 10.1088/0004-637X/809/2/144
- Yanny et al. (2009) Yanny, B., Rockosi, C., Newberg, H. J., et al. 2009, AJ, 137, 4377, doi: 10.1088/0004-6256/137/5/4377
- Zaritsky et al. (2020) Zaritsky, D., Conroy, C., Naidu, R. P., et al. 2020, The Astrophysical Journal, 905, L3, doi: 10.3847/2041-8213/abcb83
- Zhao et al. (2012) Zhao, G., Zhao, Y.-H., Chu, Y.-Q., Jing, Y.-P., & Deng, L.-C. 2012, RAA, 12, 723, doi: 10.1088/1674-4527/12/7/002