Quantity restrictions and price discounts on Russian oil
Abstract
Following Russia’s invasion of Ukraine, Western countries have looked for ways to limit Russia’s oil income. This paper considers, theoretically and quantitatively, two such options: 1) an export-quantity restriction and 2) a forced discount on Russian oil. We build a parsimonious quantifiable model of the global oil market and analyze how each of these policies affect: which Russian oil fields fall out of production; the global oil supply; and the global oil price. By these statics we derive the effects of the policies on Russian oil profits and oil-importers’ economic surplus. The potential effects on Russian oil profits are substantial. In the short run (within the first year), a quantity restriction of 20% yields Russian losses of 62 million USD per day, equivalent to 1.2% of GDP and 32% of military spending. In the long run (beyond a year) new investments become unprofitable and losses rise to 100 million USD/day, 2% of GDP and 56% of military spending. A price discount of 20% is even more harmful for Russia, yielding losses of 152 million USD per day, equivalent to 3.1% of GDP and 85% of military spending in the short run. In the long run, results are largely the same in terms of Russian profit losses, with the addition that investment in the oil sector will be harmed. A price discount puts generally more burden on Russia and less on importers compared to a quantity restriction. In fact, a price discount implies net gains for oil importers as it essentially redistributes oil rents from Russia to importers. If the restrictions are expected to last for long, the burden on oil importers decreases. Overall, both policies at all levels imply larger relative losses for Russia than for oil importers (in shares of their GDP). The case for a price discount on Russian oil is thus strong, should oil importers want to escalate the economic warfare with Russia. However, Russia may choose not to export at the discounted price, in which case the price-discount sanction becomes a de facto supply restriction.
Keywords: Energy warfare, oil, Russia, Ukraine, EU, price cap, price discount, quantity restriction, sanctions.
JEL codes: E61; F13; H56; H77; Q4.
1 Introduction
Following Russia’s invasion of Ukraine, Western countries have implemented a large number of economic sanctions on Russia (see EC, (2022) and Treasury, (2022) for lists). In particular, much political thinking and diplomatic effort has been devoted to tightening sanctions on the Russian oil sector. This is natural given that total oil revenues stand for 13% of (pre-war) Russian GDP, 42% of Russian exports and 35% of government income Rystad, 2022b ; World Bank, (2022). Yet, since the world economy is reliant on oil, the actual implementation has remained elusive. Western governments have feared the economic reprecussions of oil sanctions. As it currently stands, the US and UK have completely halted their Russian oil imports and the EU has reduced theirs by 40% (Rystad, 2022a, ) and is planning to implement a near-complete import embargo in the near term (Weizent, (2022)).111The consequences of the EU import embargo for Russian oil profits are analyzed by Spiro et al., (2022) and the consequences for the EU by (Bachmann et al.,, 2022) and Berger et al., (2022). See also Gars et al., (2022) for analysis of the effects on Russia of other EU energy policies. In parallel, the G7 countries are discussing a price discount on Russian oil (Gardner and Psaledakis,, 2022).222The G7 proposal is often described as a “price cap”. According to the current proposal, Russian oil is supposed to be sold at a fixed price lower than the current world oil price. More precisely, Russia will not be able to use Western-controlled tankers and insurance for transport unless that oil is sold at the discounted price. See Kennedy, (2022) for discussion and Spiro et al., (2022) for analysis of a tanker embargo. In our paper we explore a fixed discount relative to the world oil price. Another option to limit Russian oil income is to restrict the quantity of oil it can export.333This can be done in a number of direct and indirect ways, e.g., a limit imports, access to transport and maintenance technology or outright destruction of infrastructure.
This paper asks three questions:
-
1.
What is the effect of a quantity restriction on Russian oil profits and oil-importers’ oil expenditures?
-
2.
What is the effect of a price discount on Russian oil profits and oil-importers’ oil expenditures?
-
3.
How do the burdens on Russia and oil importers compare between the two policies?
To answer these questions, we build a parsimonious model of the oil market (adapted from Gars et al., (2022), see also Fæhn et al., (2017) and Erickson and Lazarus, (2014) for similar modeling in other domains). Both policies imply that some Russian oil fields fall out of production. This in turn means global oil supply falls which induces a global oil-price increase and a potential supply increase of other oil producers as well as a demand respone from consumers. To quantify these effects, we use oil-field data for Russia and estimates of global demand and supply quantities and elasticities of oil.
This is thus the first paper to provide a quantitative cost-benefit analysis of energy sanctions of Russia.444Previous studies we are aware of study either the cost to Russia (Hosoi and Johnson,, 2022; Gars et al.,, 2022; Spiro et al.,, 2022) or the sanctioning party (Bachmann et al.,, 2022; Berger et al.,, 2022; Lafrogne-Joussier et al.,, 2022). For other conflicts see, e.g., Gharehgozli, (2017); Allen, (2008); Fischhendler et al., (2017); Chen et al., (2019); Shapovalova et al., (2020). We largely follow the concepts outlined in Johnson, (1950); Sturm, (2022).
We want to be explicit about an important limitation of this study. We abstract from the political and diplomatic feasibiliy of the sanctions and of the precise construction – we take the restrictions as given and assume they are complete and enforced. This implies that we abstract from strategic considerations on the part of Russia and other oil exporters in their supply of oil. We discuss the strategic implications in light of our results in the conclusions.
2 Theoretical framework and results
Global oil demand is denoted , the Russian oil supply and the oil supply from the rest of the world . All these are functions of the oil price Russian oil supply is given by a marginal cost curve so that is the inverse marginal cost when total extraction is . We assume a constant elasticity of supply for the rest of the world supply and a constant demand elasticity for total demand.555Being interested in sanctions on Russia we thus represent its supply in more detail while global demand and remaining supply take the simpler form of constant elasticities.
Russian oil profits are given by
Initially, the equilibrium on the global oil market is determined by
and the resulting equilibrium price is denoted by , and the quantities by , and . Furthermore, the share of the oil supply coming from Russia is denoted by so that
In this equilibrium, Russian profits are given by
We are also interested in the consumer surplus associated with oil use. With a constant elasticity of demand , demand can be written where is a constant. The consumer surplus is given by
With the assumed demand function, the change in consumer surplus when the oil price changes from to is
| (1) |
2.1 Quantity restriction
We now consider a sanction that reduces Russian oil supply by a share compared to their free-trade supply. That is, Russian oil supply after the sanction has been implemented is
The rest of the world supply and the demand respond endogenously to this change.
After the sanction has been implemented, the equilibrium in the oil market is
Treating as a function of , differentiating fully with respect to and rewriting gives
The price change following a sanction of can be approximated by
where
is a constant.
The resulting change in Russian oil profits can then be approximated by
| (2) |
Since the sanction will lead to an increased oil price, , Russia will gain from an increase in the oil price and from a decrease of extraction costs but lose from the decreased quantity. For relatively small , the effect on extraction costs will be relatively large since the marginal oil is expensive to extract. Hence the net effect could theoretically be positive for small . Whether they are so in practice will be examined quantitatively.
Using (1) the change in consumer surplus is
| (3) |
2.2 Price discount
We now consider a price sanction that allows Russia to sell as much oil as it wants but only at a discount compared to the current global oil price. With this sanction, the equilibrium in the oil market is
When approximating the effect of a sanction we assume that demand and supply from ROW can be approximated linearly based on elasticities while the Russian oil supply cannot since the relative change is bigger there and the exact shape of the supply curve matters more. The resulting price change is then implicitly given by the approximation
Denote the resulting approximate change in Russian oil supply by
We can now approximate the difference in Russian oil profits due to a price discount by
| (4) |
When computing the change in consumer surplus there are now two effects. The first is a change in the market price . This part is the same as in (1). The second effect is that the oil bought from Russia is bought at a discount . This second effect gives an increase in consumer surplus. The joint effect is
| (5) |
that is, we assume all buyers of oil get their “fair” share of discounted oil.
3 Model parameters and quantities
The parameters needed to quantitatively assess the equilibrium are summarized in Table 1. Several are the same as used in Gars et al., (2022) and are motivated there.
Parameter Value Short run Value Long run Reference World oil demand 99 Mb/d 99 Mb/d Rystad UCube database (Rystad, 2022b, ) Oil supply Russia (exports) 7.5 Mb/d 7.5 Mb/d Rystad UCube database (Rystad, 2022b, ) Elasticity of supply Russia See Figure 1 See Figure 1 Rystad UCube database (Rystad, 2022b, ) Oil supply ROW (incl. RU domestic) 91.5 Mb/d 91.5 Mb/d Rystad UCube database (Rystad, 2022b, ) Elasticity of supply ROW 0 0.13 Gars et al., (2022) Elasticity of demand -0.125 -0.45 Gars et al., (2022)
An important exception is the supply function of Russia. For this we use data on field-by-field costs from Rystad Energy Ucube database (Rystad, 2022b, ). These supply functions, one for the short run and one for the long run, are depicted in Figure 1.
We distinguish in our analysis between short and long run effects of the policies. Short run can be thought of as within a first year and long run as beyond one year and up to three years. The difference is captured in the parameters, where elasticities generally are higher in the long run (see Table 1). Importantly, we differentiate between the Russian supply functions in the short and long run. In the short run, investment costs (CAPEX) that have gone into finding and developing a field are sunk. What remains are only the costs of operation (OPEX). In the long run new fields need to be found and developed and the choice of this depends on the expected price. Thus, in the long run CAPEX are not sunk but part of lowering the profit margins. The conceptual difference between the short run and long run is therefore that in the short run, the restrictions imposed happen as a surprise while in the long run the restrictions are part of affecting expectations.666In practice, the shift between short and long run is smooth and represented by a gradual increase in new fields as share of all fields, thus a gradual increase in the fields for which CAPEX are part of determining profits. None of the supply curves include Russian government take since we are interested in the effects on the Russian economy as a whole.
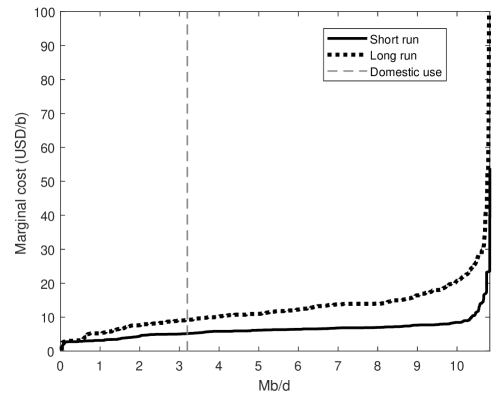
Notes: Marginal cost curves based on field-by-field in Russia from Rystad, 2022b . The short run curve includes operating costs (OPEX). The long-run curve includes also investment costs (CAPEX). Government take is not included.
4 Results
4.1 Short run
The effects of a quantity restriction in the short run are depicted in Figure 2. The upper panel shows Russia’s profit losses (from (2)) and the second panel the oil-consumer’ surplus (from (3)). We will interpret the latter as a proxy for oil-importers’ gains and losses from the policy and will use consumer surplus and oil-importers’ surplus interchangeably. As can be seen, both are falling as the quantity restriction becomes tighter. This is since there is a fall in aggregate supply driven by the reduced Russian export (third panel) which leads to a substantial price increase (fourth panel). The supply and price reactions are large since, in the short run, supply from the remaining producers is inelastic. A quantity restriction of 20% yields Russian profit losses of 57 million USD/day, a 30% restriction yields 99 million USD/day and 50% yields 212 million USD/day.
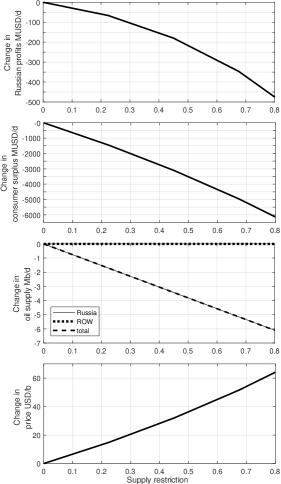
Notes: Effects of a quantity restriction in the short run. x-axis in all panels is extent of restriction. First panel: Change in Russian profit. Second panel: Change of oil-consumer surplus. Third panel: Change in quantity from Russia, from other oil exporters and in aggregate. Fourth panel: Change of oil price.
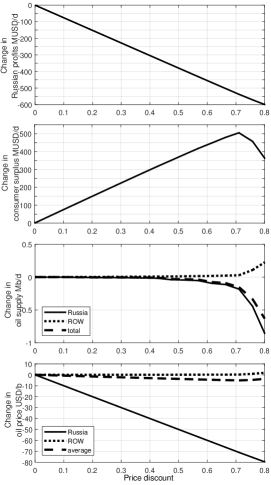
The effects of a price discount in the short run are depicted in Figure 3. The upper panel shows Russia’s profit losses (from (4)) and the second panel the change in consumer surplus (from (5)). As can be seen, a price discount leads to Russian losses and an increase in consumer surplus. This is since, in effect, the price discount is equivalent to a succesful buyers’ cartel. An important detail is that, under the price discount, Russia does not reduce its supplies until the discount is above roughly 75% (third panel). This is since Russian oil is largely profitable even at very low oil prices, in the short run. This means that there is no global oil-price reaction until that level either (fourth panel). At around 75% discount, Russian production starts falling out. Since other oil producers are inelastic in the short run, this spurs an increase in the global oil price. This is what makes consumer surplus start falling at around 80% discount. Nevertheless Russian profits keep decreasing as the discount is strong enough to offset that the increased global oil price may drive up the Russian (discounted) price. A price discount of 20% yields Russian profit losses of 152 million USD/day, a 30% restriction yields 229 million USD/day and 50% yields 381 million USD/day.
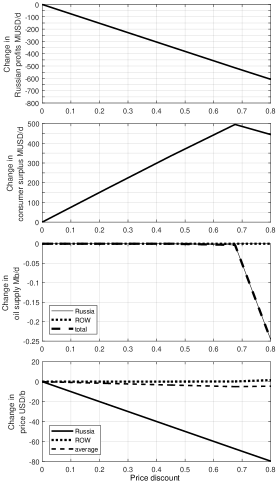
Notes: Effects of a price discount in the short run. x-axis in all panels is extent of restriction. First panel: Change in Russian profit. Second panel: Change of oil-consumer surplus. Third panel: Change in quantity from Russia, from other oil exporters and in aggregate. Fourth panel: Change of oil price Russia gets, global oil price and weighted average.
4.2 Long run
The effects of a quantity restriction in the long run are depicted in Figure 4. Russian profits fall monotonically with the extent of the restriction and so does the consumer surplus. Qualitatively it is thus similar to what happens in the short run. Quantitatively there is a large difference though. Russian losses are larger: a quantity restriction of 20% in the long run yields Russian profit losses of 100 million USD/day, a 30% restriction yields 158 million USD/day and 50% yields 284 million USD/day. In the long run the oil importers’ surplus reduction is substantially smaller. The reason for this is partly since the elasticity of other suppliers is much higher, meaning that they substitute some of the Russian oil that falls out. This is visible in the third panel where supply from other producers is increasing. Partly, the lower burden on oil importers is also due to demand being more elastic, implying that buyers substitute away from oil. For this reason the relative burden of quantity restrictions is higher on Russia in the long run.
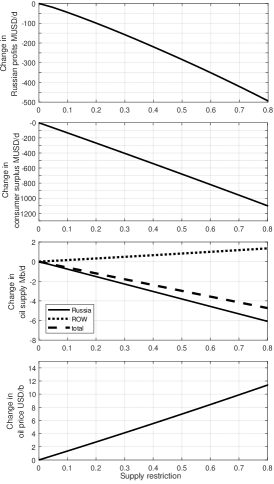
Notes: Effects of a quantity restriction in the long run. x-axis in all panels is extent of restriction. First panel: Change in Russian profit . Second panel: Change of oil-consumer surplus. Third panel: Change in quantity from Russia, from other oil exporters and in aggregate. Fourth panel: Change of oil price.
The effects of a price discount in the long run are depicted in Figure 5. Russian profits are falling monotonically with the discount. A price discount of 20% yields Russian profit losses of 152 million USD/day, a 30% restriction yields 228 million USD/day and 50% yields 379 million USD/day. In the long run, Russian supply falls already at a discount of around 45%. This is earlier than in the short run since new field investments are not profitable for a longer-lasting discount. With the more elastic supply from remaining producers, total supply falls less than in the short run. Nevertheless the reduced supply at smaller discounts implies that the consumer surplus reaches its peak earlier.
Notes: Effects of a price discount in the long run. x-axis in all panels is extent of restriction. First panel: Change in Russian profit . Second panel: Change of oil-consumer surplus. Third panel: Change in quantity from Russia, from other oil exporters and in aggregate. Fourth panel: Change of oil price Russia gets, global oil price and weighted average.
4.3 Who bears the burdens of the policies?
Figure 6 compares the two policies. The horizontal axes represent consumer surplus and the vertical axes show the Russian loss. The upper-panel axes are measured in USD while the lower-panel axes are measured in shares of GDP (Russia’s pre-war GDP on the y-axis and global GDP on the x-axis). Gains and losses normalized by GDP provide important information since, in war, the adversaries’ relative losses matter. The left panels are in the short run while the right panels are in the long run. We can note that the x-axis covers both positive values – representing gains for oil importers – and negative values. The y-axis has only negative values since Russia loses from both policies. Furthermore, for the price-discount policy there may exist two values of losses for Russia for the same consumer gain. This is since the effect of policy on consumer surplus is non-monotonic.
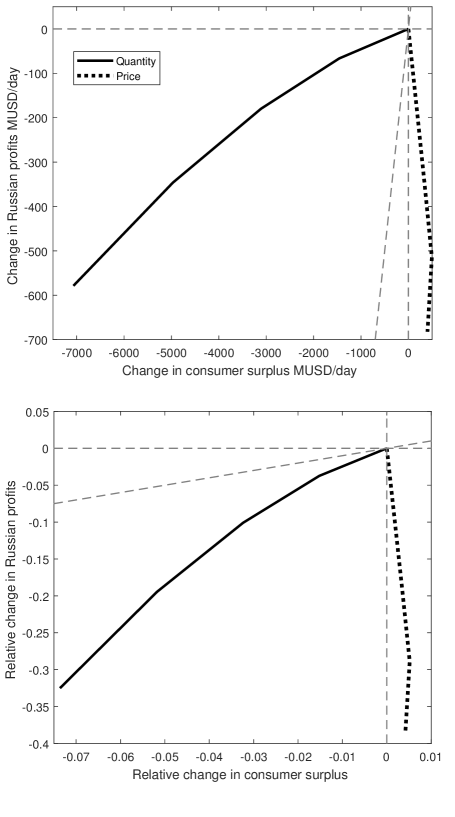
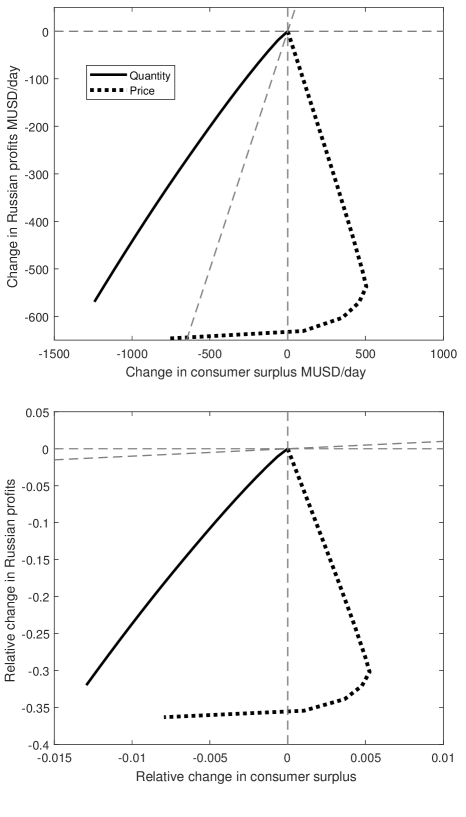
Notes: Comparison of policies in the short run (left panels) and long run (right panels). Change in oil-consumers’ surplus (x-axis) and Russian profits (y-axis) for the two policies. Upper panel is in USD and lower panel is USD/GDP or each respectively. The vertical and horizontal lines mark the zero-lines, the sloping dashed line is the 45-degree-line marking equal burden.
What is evident from the figure is that the price discount generally puts more burden on Russia compared to the quantity restriction. For any given Russian loss (fixing a point on the y-axis), importers gain more with the price discount than with the quantity restriction.
Furthermore, in absolute terms, the supply restriction is north-west of the 45-degree line implying that oil importers bear a heavier burden. The price discount, on the other hand, is mostly to the south-east of the 45-degree line implying that Russia bears a heavier burden, except for a very extensive price discount which is captured by the part of the line that is to the right of the 45-degree line. Taking into account the economic size of Russia viz-a-viz the oil importers, Russia bears a much heavier burden than oil importers for both supply restrictions and the price discount.
4.4 Regional breakdown of consumer surplus
A contentious issue before and during the war has been the effect of various sanctions on the population, i.e., consumers in the sanctioning countries. We here report the change in consumer surplus in four main economies: US, EU, India and China. The two former have been part of sanctions and the two latter have not as of yet.
Table 2 reports, for quantity restrictions, the change of consumer surplus as share of these regions GDP. The results are based on equation (3), and take into account the oil consumption () of the economies.
The table indicates that, of the potential sanctioning economies, India bears the largest relative burden. This is since its economy is more oil intensive than the others’. The consumer loss is more pronounced in the short run, indicating that the main political obstacle is getting the sanctioning in place rather than making it last in the long term.
The table also shows that Russia’s economy will be harmed relatively more for any level of sanctioning. In particular in the long run, where their losses are an order magnitude larger than the oil consumers’.
Extent () 10% 30% 50% 70% Short run EU US India China Russia -0.15% -0.20% -0.36% -0.21% -0.47% -0.47% -0.63% -1.1% -0.65% -2.0% -0.82% -1.1% -2.0% -1.2% -4.3% -1.1% -1.6% -3.0% -1.7% -7.6% Long run EU US India China Russia -0.03% -0.04% -0,08% -0.04% -0.9% -0.10% -0.13% -0.23% -0.13% -3.2% -0.16% -0.22% -0.39% -0.22% -5.8% -0.23% -0.30% -0.55% -0.32% -8.7%
Notes: Change of consumer surplus as share of GDP due to a quantity restriction. GDP data (USD in 2021) from worldbank.org. Oil consumption data from BP, (2022). Left table is short run, right table is long run. Right colum shows Russia’s profit loss as share of GDP.
Table 3 reports, for price discounts, the change of consumer surplus as share of these regions’ GDP. The results are based on equation (5), and take into account the oil consumption () of the economies. The table reflects that oil consumers gain from a price discount, and more so the more extensive the discount is. Recall, however, from Figure 3 that the optimal discount is at around 70-80%. Consumer surplus decreases beyond that level.
Extent () 10% 30% 50% 70% Short run EU US India China Russia 0.02% 0.02% 0.04% 0.02% -1.6% 0.05% 0.07% 0.13% 0.07% -4.7% 0.09% 0.12% 0.21% 0.12% -7.8% 0.12% 0.16% 0.3% 0.17% -11% Long run EU US India China Russia 0.02% 0.02% 0.04% 0.02% -1,6% 0.05% 0.07% 0.13% 0.07% -4.7% 0.07% 0.12% 0.21% 0.12% -7.8% 0.12% 0.16% 0.29% 0.17% -11%
Notes: Change of consumer surplus as share of GDP due to a price discount. GDP data (USD in 2021) from worldbank.org. Oil consumption data from BP, (2022). Left table is short run, right table is long run. Right colum shows Russia’s profit loss as share of GDP.
4.5 Which policy would Russia dislike the least?
Figure 7 compares the policies from Russia’s point of view. It shows an indifference curve between the policies. For each percentage of quantity restriction (x-axis) the figure shows the price discount (y-axis) for which Russia is equally harmed. To the north-west of the line are combinations of price discount and quantity restriction such that Russia would prefer the quantity restriction. As an example, in the short run, if the world imposes a price discount of 20%, Russia would rather limit their supply by any share up to roughly 40%. Since the curves generally reside below the 45-degree-line, it means that a price discount is generally more harmful to Russia than the same level of quantity restriction.

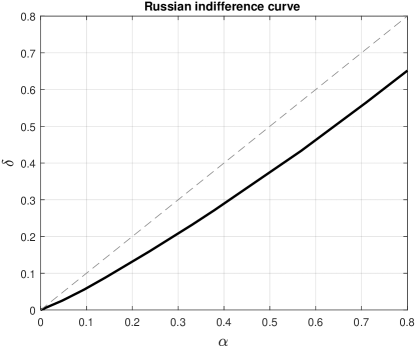
Notes: Comparison of Russian losses. Each curve shows the extent of quantity restriction (x-axis) that would make Russia indifferent to a price discount at a certain level (y-axis). Dashed line is 45-degree line. Left is short run and right is long run.
5 Conclusions and discussion
We find that both a supply restriction and price discount on Russian oil imply substantial economic losses for Russia. For example, a supply restriction covering 20% of Russian oil exports implies a Russian profit loss of 59 million USD per day in the short run (within a first year) and 100 million USD per day in the long run (beyond a year). This is equivalent to 1.2 and 2% of Russia’s (pre-war) GDP respectively; and 32% and 56% of their (pre-war) military spending.
An imposed price discount implies even greater losses for Russia. A 20% discount of the global oil price yields a Russian loss of 152 million USD per day in both the short and long run. This is equivalent to 3.1% of Russias (pre-war) GDP and 85% of their (pre-war) military spending.
A price discount of 20% seems, at this moment, to be feasible. It would correspond to around 20 USD/b – less than what has been discussed at G7 meetings and less than the Urals discount that has been in effect since the Russian invasion. Even greater discounts may be feasible and yield greater losses for Russia.
Furthermore, a price discount implies net gains for oil importers. This implies that consensus of its value as an economic weapon should be rather broad among oil importers (see Table 2). In particular, our results suggest (Table 2) that it will be harder to get broad acceptance of a quantity restriction compared to a price discount. It is particularly India who may dispute a quantity restriction (they lose relatively more), and in second place China. Furthermore, it is particularly India (second place China) who gain from a price discount.
A coordinated price discount is essentially equivalent to a buyers’ cartel. Thus follow its benefits. But, just like any cartel, the stability of such an agreement is not obvious. Any one buyer has a self interest in buying a little bit more from Russia at a somewhat higher price. Similarly, Russia may choose not to export at the discounted price, in which case the price-discount sanction becomes a de facto supply restriction. The indifference curves in Figure 7 are indicative of Russia’s best response to a price discount. This is particularly important to consider for the sanctioning side in relation to the actual implementation of a price discount. Russia always has the option to restrict its own exports of oil. The suggested implementation of the price discount is to limit Russia’s access to tanker shipments unless it sells at or below the required price (Gardner and Psaledakis,, 2022). More precisely, tankers will not be able to use western insurance companies if they ship Russian oil above the price cap. A large share of the tankers use such insurance companies. A response for Russia may then be to not use such tankers. In practice, Russia then chooses a quantity restriction. The extent of this quantity restriction is dependent on how much of Russia’s transport needs that can be covered by the remaining tanker market and to what extent buyers accept sanctioned oil and non-western insurance. It is beyond this paper to fully analyze this, we refer to Spiro et al., (2022) for analysis of the tanker market.
A quantity restriction is equivalent to an agreed Cournot cartel. The downside of this construction is that it implies losses for the oil importers. In the short run the relative losses are smaller than Russia’s albeit in the same order magnitude. In the long run the losses to oil importers are substantially smaller. Thus, while it may be hard to get broad consensus around setting up a quantity restriction (in particular India loses), it should not be as hard to keep it in place in the long term. Nevertheless it may be difficult to argue among buyers for such a construction given these losses. However, what drives the losses is a rise in the price of oil. And this high price will make it less tempting to deviate from the agreement. Unless, of course, Russia offers its oil at their own discount, in which case the supply restriction is partly transformed into a de-facto price discount.
References
- Allen, (2008) Allen, S. H. (2008). The domestic political costs of economic sanctions. Journal of Conflict Resolution, 52(6):916–944.
- Bachmann et al., (2022) Bachmann, R., Baqaee, D., Bayer, C., Kuhn, M., Löschel, A., Moll, B., Peichl, A., Pittel, K., and Schularick, M. (2022). What if germany is cut off from russian energy? VoxEU. org, 25.
- Berger et al., (2022) Berger, E. M., Bialek, S., Garnadt, N., Grimm, V., Salzmann, L., Schnitzer, M., Truger, A., Wieland, V., et al. (2022). A potential sudden stop of energy imports from russia: Effects on energy security and economic output in germany and the eu. Technical report, IMFS Working Paper Series.
- BP, (2022) BP (2022). BP Statistical Review of World Energy 2022. Technical report.
- Chen et al., (2019) Chen, Y. E., Fu, Q., Zhao, X., Yuan, X., and Chang, C.-P. (2019). International sanctions’ impact on energy efficiency in target states. Economic Modelling, 82:21–34.
- EC, (2022) EC (2022). Eu restrictive measures against russia over ukraine (since 2014).
- Erickson and Lazarus, (2014) Erickson, P. and Lazarus, M. (2014). Impact of the keystone xl pipeline on global oil markets and greenhouse gas emissions. Nature Climate Change, 4(9):778–781.
- Fæhn et al., (2017) Fæhn, T., Hagem, C., Lindholt, L., Mæland, S., and Rosendahl, K. E. (2017). Climate policies in a fossil fuel producing country–demand versus supply side policies. The Energy Journal, 38(1).
- Fischhendler et al., (2017) Fischhendler, I., Herman, L., and Maoz, N. (2017). The political economy of energy sanctions: insights from a global outlook 1938–2017. Energy Research & Social Science, 34:62–71.
- Gardner and Psaledakis, (2022) Gardner, T. and Psaledakis, D. (2022). U.s says g7 should soon unveil price cap level on russian oil, adjust regularly.
- Gars et al., (2022) Gars, J., Spiro, D., and Wachtmeister, H. (2022). The effect of european fuel-tax cuts on the oil income of russia. Nature Energy, 7(10):989–997.
- Gharehgozli, (2017) Gharehgozli, O. (2017). An estimation of the economic cost of recent sanctions on iran using the synthetic control method. Economics Letters, 157:141–144.
- Hosoi and Johnson, (2022) Hosoi, A. and Johnson, S. (2022). How to implement an eu embargo on russian oil. CEPR Policy Insight, 116.
- Johnson, (1950) Johnson, H. G. (1950). Optimum welfare and maximum revenue tariffs. The Review of Economic Studies, 19(1):28–35.
- Kennedy, (2022) Kennedy, C. (2022). Putin’s looming tanker crisis.
- Lafrogne-Joussier et al., (2022) Lafrogne-Joussier, R., Levchenko, A., Martin, J., and Mejean, I. (2022). Beyond macro: Firm-level effects of cutting off russian energy. Global Economic Consequences of the War in Ukraine Sanctions, Supply Chains and Sustainability, page 8.
- (17) Rystad (2022a). Oil Market Special Report:Russia.
- (18) Rystad (2022b). UCube.
- Shapovalova et al., (2020) Shapovalova, D., Galimullin, E., and Grushevenko, E. (2020). Russian arctic offshore petroleum governance: The effects of western sanctions and outlook for northern development. Energy Policy, 146:111753.
- Spiro et al., (2022) Spiro, D., Wachtmeister, H., and Gars, J. (2022). Will russian income fall if the eu bans imports of russian oil?
- Sturm, (2022) Sturm, J. (2022). The simple economics of trade sanctions on russia: A policymaker’s guide. Technical report, Working Paper, 9.4.
- Treasury, (2022) Treasury, U. D. O. (2022). Ukraine-/russia-related sanctions.
- Weizent, (2022) Weizent (2022). Oil prices jump after eu leaders agree to ban most russian crude imports.
- World Bank, (2022) World Bank (2022). Exports of goods and services (current US$) - Russian Federation | Data.