The ALPINE-ALMA [CII] survey: double stellar population and AGN activity in a galaxy at
Abstract
Context. GDS J033218.92-275302.7 (here GS-14) is a galaxy with unusual UV spectral features that have been interpreted as signatures of either a double stellar population or of an active galactic nucleus (AGN). GS-14 was detected in [C ii] as part of the ALPINE survey, turning out to be the galaxy with the lowest molecular gas fraction () of that sample.
Aims. We exploited the multi-wavelength coverage of GS-14 to investigate the properties and the origin of its emission.
Methods. We performed UV-to-NIR SED-fitting, with single/double stellar population and/or AGN component. We analyzed the latest release of the VIMOS spectrum, which shows highly-ionized emission lines (O vi , N v , and N iv] ). The line equivalent widths and line ratios have been compared with those observed in galaxies and AGN, as well as with the predictions from radiation transfer models for star-forming galaxies, AGN, and shocks.
Results. The SED-fitting provides a total stellar mass of , an age of the main stellar population of and a recent short () burst of star formation (SF) of . We do not find a significant contribution from an AGN, although we do not have any coverage in the mid-IR, where the dust emission of the AGN would peak. The N v line has a characteristic P-Cygni profile. Fitting it with stellar models suggests a old population of stars with a mass of , consistent with a second component of young stars, as found in the SED-fitting analysis. The N v profile also shows evidence for an additional component of nebular emission. The comparison of the line ratios (N iv]/N v and O vi/N v) with theoretical models allows us to associate the emission with SF or AGN, but the strong radiation field required to ionize the O vi is more commonly related to AGN activity.
Conclusions. Studying GS-14, we found evidence for an old and already evolved stellar population at and show that the galaxy is experiencing a second short burst of SF. In addition, GS-14 carries signatures of obscured AGN activity. The AGN could be responsible for the short depletion time of this galaxy, thus making GS-14 one of the two ALPINE sources with hints of an active nucleus and an interesting target for future follow-ups to understand the connection between SF and AGN activity.
Key Words.:
galaxies: high-redshift – galaxies: active – galaxies: evolution1 Introduction
It is established that the growth of supermassive black holes (SMBH) and the evolution and properties of their host-galaxies must be coupled, but the exact mechanism, timescales, and how they influence each other are still debated. The presence of scaling relations between the mass of the SMBH and several physical properties of the host galaxy, like galaxy bulge mass, luminosity, and velocity dispersion (e.g. Kormendy & Richstone 1995; Magorrian et al. 1998; Ferrarese & Merritt 2000; Gebhardt et al. 2000; Kormendy & Ho 2013) led to the formulation of the AGN-galaxy co-evolution paradigm (e.g. Hopkins et al. 2007). In this co-evolution scenario, on the one hand, the stellar feedback may help in funneling gas towards the nuclear region of the galaxy, thus triggering the Active Galactic Nucleus (AGN) activity. On the other hand, the AGN feedback heats up and expels the gas (Zana et al. 2022), reducing or quenching the star-formation (SF). Signatures of this interaction have been observed in winds and outflows of cold molecular gas (e.g. Feruglio et al. 2010; Cicone et al. 2014), neutral atomic (Rupke et al. 2005), and ionised (Weymann et al. 1991; McKernan et al. 2007) gas. The interplay between AGN and SF of main-sequence (MS) galaxies has been studied in the local universe and at the “cosmic noon” (), but scarcely at high redshift (), where most of our knowledge comes from luminous quasars (QSO) and starburst (SB) galaxies (e.g. Bischetti et al. 2022). A key step of the co-evolution scenario is represented by the obscured-accretion phase, where most of the stellar mass formation and of the BH accretion should take place. The main difficulty in studying this phase is that the AGN activity is shrouded by gas and dust and likely embedded in the galaxy emission, thus, difficult to identify. This is particularly true for low-luminosity AGN (LLAGN): which have their mid-IR emission diluted and overshadowed by the host-galaxy luminosity (i.e. Gruppioni et al. 2013). In addition, even the most recent X-ray facilities struggle to detect high- LLAGN, due to their low X-ray photon fluxes (Barchiesi et al. 2021).
High-redshift galaxies with ongoing SF and indication of a possible AGN are the sources to focus on when searching for hidden BH growth as well as for the impact of AGN on the SF (hence early galaxy evolution) itself. GDS J033218.92-275302.7 (hereafter GS-14) falls exactly within those parameters.
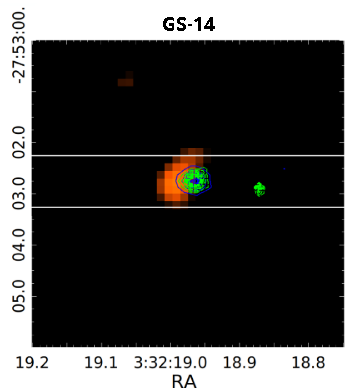
GS-14 is a (Raiter et al. 2010; Vanzella et al. 2010) MS-galaxy with unusual spectral features, which have been interpreted as signatures of a double stellar population or linked to AGN activity. The nature of GS-14 emission has been extensively debated since its discovery in the southern field of the Great Observatories Origins Deep Survey (GOODS) during the ESO/FORS2 survey (Vanzella et al. 2006). Fontanot et al. (2007) selected this source as a QSO candidate on the basis of its magnitude and color selection, but reclassified it as an H II star-forming galaxy due to the presence of the N iv] and the lack of the N v lines in the FORS2 spectrum (Vanzella et al. 2006). GS-14 appears as a compact-source at all wavelengths (Fig. 1), altought marginally resolved both in the and bands (Vanzella et al. 2010). In Wiklind et al. (2008) the source is classified as a Balmer galaxy, with the discontinuity between the Ks and m filter indicating an evolved stellar population. In Vanzella et al. (2010), the bright Ly line and the detection of N iv] emission line have been interpreted as signature of a young population of massive stars or, alternatively, of an AGN. They also performed Spectral Energy Distribution (SED)-fitting using 16 photometric bands from UV to near-IR (NIR), and found that the source may host a double stellar population, composed of an evolved/aged population, and of a young one of massive stars. Grazian et al. (2020) deeply analyzed the same FORS2 spectrum of Vanzella et al. (2010), and new VIMOS and X-SHOOTER spectra of this source. In addition to the two lines detected by (Vanzella et al. 2010), they also found O vi , and N v emission lines, which led them to regard GS-14 as an AGN. Regarding the X-ray bands, GS-14 is undetected in the ultradeep 7 Ms X-ray image by Chandra with a flux limit of in the observer-frame keV band (Giallongo et al. 2019).
GS-14 has also been selected as part of the ALMA Large Program to INvestigate C+ at Early Times survey, (ALPINE, Le Fèvre et al. 2020; Faisst et al. 2020; Béthermin et al. 2020) as a normal star-forming galaxy (SFG). It has been detected in the [C ii] emission line with a Signal-to-Noise ratio () of , but it is not spatially resolved (with a beam of , kpc, Fig. 1). There is no detection of continuum near [C ii] with an upper limit of in the far-infrared dust emission (Béthermin et al. 2020). With a molecular gas fraction of (derived from the [C ii] luminosity, Dessauges-Zavadsky et al. 2020), GS-14 is the [C ii]-detected source with the lowest of the entire ALPINE sample.
In this work we exploit the multi-wavelength spectro-photometric coverage of GS-14 to investigate the physical origin of its emission. In §2 we report the spectral analysis of GS-14, and compare the observed lines with sources from the literature and with model predictions. The photometric analysis and SED-fitting is reported in §3. We discuss our results and draw the conclusions in §4. Throughout this paper, we adopt a Chabrier (2003) initial stellar mass function and the following cosmological parameters: H, and (Spergel et al. 2003).
2 Spectral Analysis
2.1 Spectroscopic data
Different rest-UV spectroscopic observations are available for GS-14 in terms of depth and resolution: a 4 hours FORS2 spectrum (Vanzella et al. 2010), a 20 hours VIMOS spectrum (ID 194.A-2003, McLure et al. 2018), and a 49 hours X-SHOOTER spectrum obtained under two observing programs (384.A-0886 and 089.A-0679). We focus on the VIMOS spectrum, as it has the best S/N among the three available spectra, and it allows for the first time to detect the rest-frame UV continuum of this galaxy at at a (as computed in the observed-frame wavelength range).
Figure 2 shows four windows of the one dimensional spectrum of GS-14. The main features of the spectrum are the Ly line and the almost total intergalactic medium (IGM) absorption blueward of it, at wavelength . N v , and N iv] are detected at a of and , respectively (, where is the line integrated flux, is the spectrum noise, and are the line centroid and width). O vi and C ii∗ are detected at a of and , respectively. C iv is not detected, as this line falls at the edge of the VIMOS spectral range and over a sky emission line.

2.2 Spectral fitting
The latest release of the VIMOS spectrum reaches a continuum of , high enough to show for the first time a clear P-Cygni N v line profile. P-Cygni profiles in N v are not unheard of (Jaskot et al. 2017; Vanzella et al. 2018; Matthee et al. 2022) and can be produced by stellar winds of very young and massive stars (e.g. Prinja & Howarth 1986) or mimicked by Broad or Narrow Absorption Line quasar (BAL/NAL QSO, Bentz et al. 2004; Appenzeller et al. 2005). As our spectrum does not show any absorption line and there are no signs of GS-14 being a type 1 QSO (e.g. broad emission lines or high X-ray luminosity), the origins of the P-Cygni profile is likely associated with a young population of massive stars. We fitted the spectrum with the models from the STARBURST99 (S99) spectral synthesis code (Leitherer et al. 1999), adopting the same methodology as Marques-Chaves et al. (2021). S99 models allow the fitting of the stellar continuum and of the lines produced in the stellar atmosphere but not lines that are produced in the ionized gas in the interstellar medium (ISM) of the galaxy. High-resolution UV model spectra with burst ages in the Myr range and metallicities between and were rebinned and smoothed to the VIMOS spectrum resolution. To take into account dust attenuation, the Calzetti et al. (2000) extinction curve was used to match the of the models with the one measured on the spectrum of GS-14 (), from the observed-frame wavelength range). The free-from-lines spectral window was used to normalize the flux of the S99 models to the GS-14 flux. Finally, we performed a minimization on the range to find the best fit for the N v line profile. We found that the VIMOS spectrum of GS-14 is best fitted with a old stellar population, a mass of , and a metallicity of . We note that the fit of the P-cygni exhibits a bit of degeneracy with the metallicity: the N v P-cygni profile varies little with different values of metallicity, while it is extremely sensitive to the age of the stellar population (see Marques-Chaves et al. 2021). Our best-fit model is able to reproduce the absorption part of the N v line profile, as well as the continuum redwards of the Ly emission line. However, the best-fit S99 model is not able to fully reproduce the observed emission in N v and we need an additional emission component. The Gaussian fit of this component provides an emission line centered at , with a full width half maximum of FWHM and a flux of .
We also fitted the O vi, C ii∗, and N iv] emission lines using Gaussian components. Their best-fit values are reported in Table 1. Due to the IGM absorption, the measured O vi flux should be considered as a lower-limit.
We compared the EW of the N v line in absorption and emission with the Binary Population and Spectral Synthesis code (BPASS, Stanway & Eldridge 2018) and with the S99 models. We find that there are models able to reproduce the observed EW in absorption and that those have a very young stellar population, in agreement with what we find from the P-Cygni N v line profile. However, regarding the emission component, all the models have EW, far from the measured . This result tells us that there are likely two different mechanisms at the origin of the N v emission: stellar winds from young and massive stars create the absorption component and contribute to the emission, while an additional emission, not linked to stellar winds phenomena, provides the rest of the observed N v flux. This additional contribution is likely due to the ionized gas in the ISM, which are not modelled by stellar synthesis codes such as BPASS or S99.
| Line | FWHM | ||
|---|---|---|---|
| O vi | |||
| N v | |||
| C ii∗ | |||
| N iv] | |||
| N iv] |
2.3 Comparison with literature
We performed a deep search for sources in the literature with O vi , N v , or N iv] emission lines; our goal is to discern the nature (SF or AGN) of GS-14. We found eight sources with all the three lines, seven from Dietrich et al. (2003) at redshift and one from Baldwin et al. (2003) at , all of these are spectroscopically confirmed AGN. The three lines can also be found in the Hainline et al. (2011) composite spectrum of 33 narrow-line AGN at . In the collection of sources, we also checked if the flux of the N iv] was higher than that of the N v, as it is the case for GS-14. None of the above-mentioned AGN shows this characteristic. We note that the lensed galaxy of Fosbury et al. (2003) and the stacked spectrum of , EW galaxies of Le Fèvre et al. (2019) show a N iv] emission line more luminous than the N v, but both lack O vi detection. With the exception of the young SFG of Marques-Chaves et al. (2021) (which shows P-Cygni profiles in both O vi and N v, but no N iv] emission line detection), all the sources with N v and O vi detections are AGN. Being an high-ionization emission line, the O vi line is usually associated with AGN activity, although it has also been detected in emission in a small number of extreme SFG (Otte et al. 2003; Grimes et al. 2007; Hayes et al. 2016). We report in Appendix A the complete list of the sources we compared with, as well as the detected lines.
2.4 Comparison with theoretical predictions
We exploit the N iv]/N v and O vi/N v flux ratios to further investigate the origin of the additional N v emission component, as well as N iv] and O vi emission lines. Figure 3 shows the comparison of the line ratios in GS-14 (red star) with those from the AGN of §2.3 with all the three lines detected (cyan diamonds). GS-14 N iv]/N v line ratio uncertainty is shown as a black error bar, and the O vi/N v lower limit with the black arrow. The contours refer to the theoretical predictions for flux ratios driven by shocks, AGN, and SF. The shock predictions (brown contours) are from the Mexican Million Models Database (3MDBS, Morisset et al. 2015), a compilation of shock models calculated with the code MAPPINGS and evaluated with the CLOUDY (Ferland et al. 2013) photoionization code. The SF models (green contours) are from Gutkin et al. (2016) models, and refer to a cloud illuminated by a -old population, with the nebular emission computed with CLOUDY. Finally, the AGN predictions (blue contours) are from Feltre et al. (2016) and rely on CLOUDY to simulate the emission from a Narrow Line Region (NLR) cloud illuminated by the central AGN. We find that there is no shock model able to reproduce the observed flux ratios of GS-14, while both SF and AGN models are compatible with the observed values. We note that, as we must consider the O vi flux as a lower limit, in GS-14 the intrinsic O vi/N v flux ratio should be higher; in fact, the IGM attenuation at O vi wavelength for a source could be as high as a factor 4 (e.g. Inoue et al. 2014) and GS-14 should move towards the region where less SF models reside. Table 2 reports the parameter space explored by the shock, AGN, and SF models we used. While we cannot constrain the ionization parameter using the GS-14 flux ratios, we find that, for the AGN models, only hydrogen density of the cloud of and metallicity fit our data. Regarding the SF models, the observed line ratio can be reproduced only by models. With such low-metallicity, stellar models predict much weaker P-Cygni profile in the N v wind line than the observed one. This suggests that the nebular emission in GS-14 is likely powered by an AGN. In the future, observing more emission lines, like C iv and He ii , could provide a definitive answer on the origin of the emission.
| Nsample | values | ||
|---|---|---|---|
| AGN | 5 | ||
| 16 | |||
| 3 | |||
| 3 | |||
| 4 | |||
| SF | 7 | ||
| 14 | |||
| 1 | 0.3 | ||
| 1 | 2 | ||
| Shock | 37 | ||
| 7 | |||
| 8 | |||

3 Photometric analysis
3.1 Photometric data
GS-14 has been observed in several photometric bands. It has been detected with the MPG-ESO WFI (Hildebrandt et al. 2006; Erben et al. 2005), with ISAAC instrument at VLT (Nonino et al. 2009; Wuyts et al. 2008; Retzlaff et al. 2010), with CFHT WIRCam (Hsieh et al. 2012), and with the SUBARU Suprime-Cam (Cardamone et al. 2010). Regarding observations from space telescopes, GS-14 has detections with the ACS and WFC3 on board of HST (Giavalisco et al. 2004; Koekemoer et al. 2011; Grogin et al. 2011; Brammer et al. 2012; van Dokkum et al. 2013), as well as with the Spitzer IRAC (Dickinson et al. 2003; Ashby et al. 2013; Guo et al. 2013). The complete list of photometric filters adopted is reported in Appendix B. We refer to Faisst et al. (2020) for the in-depth description of the photometric data.
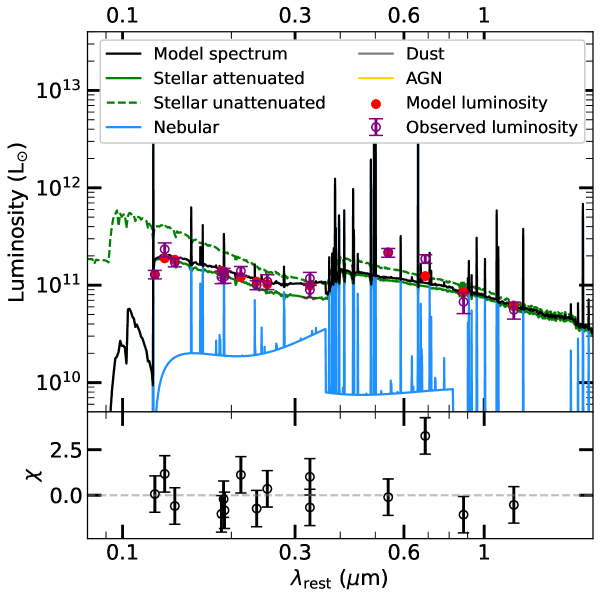
The SED of GS-14 is characterized by the evident discontinuity between the VLT/ISAAC and CFHT/WIRCAM bands and the Spitzer/IRAC bands that is consistent with being originated from the Balmer break (see Fig.4). Another peculiarity is the higher flux in the IRAC 1 and 2 bands compared to the fluxes of bands 3 and 4. This should be due to a significant contribution of the H+[O iii], and H lines to the IRAC 1 and 2 fluxes.
3.2 SED-fitting
To estimate the galaxy properties, we choose to use the X-CIGALE code (Yang et al. 2020, 2022), the latest version of the Code Investigating GALaxy Emission (CIGALE, Burgarella et al. 2005; Noll et al. 2009; Boquien et al. 2019) SED-fitting code, as it is quite flexible and allows us to fit the photometric data with and without the AGN component, as well as with a double stellar population. We use the Bruzual & Charlot (2003) population synthesis model with a Chabrier (2003) initial mass function, nebular emission lines, a Calzetti et al. (2000) dust attenuation law and the Draine et al. (2014) dust models. We test different star-formation histories (SFHs): double exponential, delayed SFH, delayed SFH plus burst or quench, and constant. The AGN emission is added via the SKIRTOR models (Stalevski et al. 2012, 2016), in which the torus is modelled as a clumpy two-phases medium (we refer to Yang et al. 2020, for further details). We report in Table 6 the complete parameter space investigated via the SED-fitting.
Figure 4 shows the best-fit model for GS-14, with a delayed SFH, a stellar mass of , a stellar age of , and a burst of SF of in the last . We find that the stellar mass, age of the galaxy and bulk of the SFH are well constrained and do not depend heavily on the presence of AGN or of a double population. Although the fitting is acceptable with a single population (), we obtain a better fit when adding a recent burst in the SFH (). In particular, the presence of a younger population allows us to better fit the higher fluxes of the IRAC 1 and 2 bands (with respect to IRAC 3 and 4) due to the H and H lines of the young stars contributing significantly to the IRAC 1 and 2 fluxes.
The fitting does not reveal any significant contribution from an AGN. When AGN models are used, the SED-fitting constantly prefers low-luminosity type 2 AGN models, with an AGN contribution to the optical-UV six order of magnitude lower than the stellar emission. We note, however, that we do not have any coverage in the mid-IR, where the warm dust heated by the AGN should contribute the most. The SED-fitting, nevertheless, allows us to exclude the presence of a type 1 AGN, as it would contribute significantly in the optical-UV where we have an optimal photometric coverage, but leaves open the possibility of a moderate- or low-luminosity obscured AGN. This is consistent with the narrow line profiles observed in GS-14 (Ly, N v).
As sanity check, we also perform SED-fitting with the SED3FIT code (Berta et al. 2013; da Cunha et al. 2008), although without the option of a double population. We find that the stellar mass and SFR are compatible with those from X-CIGALE within the uncertainties. And similarly, no significant AGN contribution is detected.
| Photometric | Spectral | |
|---|---|---|
| age(Myr) | ||
| age(Myr) | ||
| SFR (M | ||
| SFRMS (M | ||
| SFR (M | ||
| SFRUV (M | ||
| 0.5 | ||
| 0.05 | 0.05 | |
| ¡44.5 | ||
| ¡43.5 |
4 Discussion and conclusions
We find several clues indicating that GS-14 has a double stellar population. The P-Cygni profile in the N v line suggests the presence of a young population of massive stars. The fitting of the line profile provides an age of and a mass of . Moreover, the best SED-fitting is obtained for a double population, with a old population of and a young ( old) one of (see Table 3). In this scenario, the old population dominates and accounts for most of the stellar mass of the galaxy (similar to what was found by Laporte et al. 2021; Harikane et al. 2022; Matthee et al. 2022). It is responsible for the Balmer break and for the continuum at . The young population is linked to the ongoing SF and produces the P-Cygni profile and most of the continuum at . The low cold-gas fraction of GS-14 of , derived from the [C ii] emission (see Dessauges-Zavadsky et al. 2020) and the SED-fitting stellar mass, favors the scenario of GS-14 being composed mostly of an old and evolved stellar population formed Myr after the Big Bang, that has already consumed or expelled most of its original gas reservoir. We exclude the alternative origin of the N v P-Cygni profile, i.e. BAL-QSO absorption feature mimicking a P-Cygni profile, as there is no observational evidence that GS-14 could be a type 1 QSO and the spectra show no signs of absorption features (e.g. Ly, C iv , O vi , Si iv; Vito et al. 2022; Vietri et al. 2022).
The specific SFR () of GS-14 is . At this redshift, and considering the mass from SED-fitting, the SFR for a MS galaxy is (Speagle et al. 2014), with the lower boundary of its dispersion at ; hence GS-14 with its , while below the average MS, is still within its dispersion. From the SED-fitting derived SFH, without considering the recent episode of SF, the SFR should be , thus GS-14 would be below the MS, in the locus of quiescent galaxies. The new episode of SF has moved GS-14 up towards the MS, altought it should last only a few tens of Myr due to its short depletion time (t). This kind of up-and-down movement in the SFR-M∗ plane is expected: in fact, Tacchella et al. (2016), and Orr et al. (2019) simulations suggest that the MS dispersion can be originated by similar oscillations in sSFR on time-scales .
The GS-14 N v line profile shows, on top of the fitted P-Cygni profile, an additional emission component. The comparison of the observed N v EW with N v equivalent widths from BPASS and S99 models, allows us to exclude that the origin of the whole N v emission is from stellar winds. This additional emission component, thus, comes from nebular emission, but it can have various origins, depending on which process originates the radiation field that illuminates the gas. On the one hand, the shock origin can be excluded, as the GS-14 flux ratios of N iv]/N v and O vi/N v are not compatible with shocks-related models (Figure 3). On the other hand, models of AGN or SF are both able to reproduce the observed flux ratios, as shown in Figure 3. However, we note that an AGN origin is more likely, as the high-ionization potential of the O vi requires extreme conditions to be of stellar origin. Moreover, we have found in the literature just one star-forming galaxy (Marques-Chaves et al. 2021) with both O vi and N v, all the remaining sources with these two lines are AGN. Finally, all the sources with all the three O vi, N v, and N iv] lines are AGN (Table 4). While none of these is a sufficient proof, they strongly point towards an AGN origin for the GS-14 nebular emission. The lack of X-ray detection for GS-14 in deep Chandra data and the fact that the SED-fitting does not show a significant contribution from the AGN reveal that this AGN should be a type 2. Obscured (type 2) AGN are more difficult to detect in the X-rays, but can be identified by their high-ionization lines and/or by their mid-IR emission. Exploiting the X-ray flux upper limit and assuming a power-law spectrum (without AGN obscuration) for the X-ray emission with a photon index of () , we derive a upper limit on the rest frame keV luminosity of the AGN: . Assuming the bolometric correction of Lusso et al. (2012), we have an upper limit on the AGN bolometric luminosity of . The upper limit on the AGN bolometric luminosity derived from the SED-fitting is . AGN activity could also be a possible explanation for GS-14 extreme low content of molecular gas. A strong past phase of nuclear activity, possibly triggered by the first episode of SF, may have expelled or heated up the molecular gas, hence lowered significantly the fmol and quenched the SF. The low-power AGN signature we are now witnessing could be the last remnant of this past, more powerful, AGN activity.
Our interpretation paints an intriguing picture of GS-14: this source is an already evolved galaxy possibly formed Myr after the Big Bang that is now experiencing a second burst of SF, and is also carrying signatures of obscured AGN activity.
Future observations could shed more light on the AGN contribution in GS-14, especially if those observations would target the mid- and far-IR part of the SED ( observer-frame), where its emission should peak, or at least could be disentangled from that of SF. GS-14 deserves also additional high-resolution observations with ALMA: the [C ii] detected but not resolved, and the far-IR continuum detection (which is missing for now) would place more stringent constraints to the SF emission and the AGN contribution. Furthermore, GS-14 is the only ALPINE source with hints of obscured AGN activity, which makes its follow-up with deeper and higher-resolution ALMA observations even more important and rewarding. Finally, deep rest-UV spectroscopy, targeting mid- and high-ionization lines, such as C iv , He ii , and C iii] , and exploiting their line ratio diagram, could provide the final evidence of whether the radiation field in GS-14 is dominated by the AGN activity or by a young stellar population. GS-14 was recently observed with the NIRSpec aboard the James Webb Space Telescope as part of the GTO program n.1216, and hopefully the mystery of the origin of its emission will be definitively unveiled.
Acknowledgements.
G.C.J. acknowledges funding from ERC Advanced Grant 789056 “FirstGalaxies” under the European Union’s Horizon 2020 research and innovation programme. A.F. acknowledges the support from grant PRIN MIUR 2017-20173ML3WW_001. E.I. acknowledge funding by ANID FONDECYT Regular 1221846. M.R. acknowledges support from the Narodowe Centrum Nauki (UMO-2020/38/E/ST9/00077).References
- Appenzeller et al. (2005) Appenzeller, I., Stahl, O., Tapken, C., Mehlert, D., & Noll, S. 2005, A&A, 435, 465
- Ashby et al. (2013) Ashby, M. L. N., Willner, S. P., Fazio, G. G., et al. 2013, ApJ, 769, 80
- Bañados et al. (2016) Bañados, E., Venemans, B. P., Decarli, R., et al. 2016, ApJS, 227, 11
- Baldwin et al. (2003) Baldwin, J. A., Hamann, F., Korista, K. T., et al. 2003, ApJ, 583, 649
- Barchiesi et al. (2021) Barchiesi, L., Pozzi, F., Vignali, C., et al. 2021, PASA, 38, e033
- Bentz et al. (2004) Bentz, M. C., Osmer, P. S., & Weinberg, D. H. 2004, in The Interplay Among Black Holes, Stars and ISM in Galactic Nuclei, ed. T. Storchi-Bergmann, L. C. Ho, & H. R. Schmitt, Vol. 222, 515–516
- Berta et al. (2013) Berta, S., Lutz, D., Santini, P., et al. 2013, A&A, 551, A100
- Béthermin et al. (2020) Béthermin, M., Fudamoto, Y., Ginolfi, M., et al. 2020, A&A, 643, A2
- Bischetti et al. (2022) Bischetti, M., Feruglio, C., D’Odorico, V., et al. 2022, Nature, 605, 244
- Boquien et al. (2019) Boquien, M., Burgarella, D., Roehlly, Y., et al. 2019, A&A, 622, A103
- Borguet et al. (2012) Borguet, B. C. J., Edmonds, D., Arav, N., Benn, C., & Chamberlain, C. 2012, ApJ, 758, 69
- Brammer et al. (2012) Brammer, G. B., van Dokkum, P. G., Franx, M., et al. 2012, ApJS, 200, 13
- Bruzual & Charlot (2003) Bruzual, G. & Charlot, S. 2003, MNRAS, 344, 1000
- Burgarella et al. (2005) Burgarella, D., Buat, V., & Iglesias-Páramo, J. 2005, MNRAS, 360, 1413
- Calzetti et al. (2000) Calzetti, D., Armus, L., Bohlin, R. C., et al. 2000, ApJ, 533, 682
- Cardamone et al. (2010) Cardamone, C. N., van Dokkum, P. G., Urry, C. M., et al. 2010, ApJS, 189, 270
- Cassata et al. (2020) Cassata, P., Morselli, L., Faisst, A., et al. 2020, A&A, 643, A6
- Chabrier (2003) Chabrier, G. 2003, PASP, 115, 763
- Cicone et al. (2014) Cicone, C., Maiolino, R., Sturm, E., et al. 2014, A&A, 562, A21
- da Cunha et al. (2008) da Cunha, E., Charlot, S., & Elbaz, D. 2008, MNRAS, 388, 1595
- Dessauges-Zavadsky et al. (2020) Dessauges-Zavadsky, M., Ginolfi, M., Pozzi, F., et al. 2020, A&A, 643, A5
- Dhanda et al. (2007) Dhanda, N., Baldwin, J. A., Bentz, M. C., & Osmer, P. S. 2007, ApJ, 658, 804
- Dickinson et al. (2003) Dickinson, M., Giavalisco, M., & GOODS Team. 2003, in The Mass of Galaxies at Low and High Redshift, ed. R. Bender & A. Renzini, 324
- Dietrich et al. (2003) Dietrich, M., Appenzeller, I., Hamann, F., et al. 2003, A&A, 398, 891
- Dietrich & Wilhelm-Erkens (2000) Dietrich, M. & Wilhelm-Erkens, U. 2000, A&A, 354, 17
- Dors et al. (2014) Dors, O. L., Cardaci, M. V., Hägele, G. F., & Krabbe, Â. C. 2014, MNRAS, 443, 1291
- Draine et al. (2014) Draine, B. T., Aniano, G., Krause, O., et al. 2014, ApJ, 780, 172
- Erben et al. (2005) Erben, T., Schirmer, M., Dietrich, J. P., et al. 2005, Astronomische Nachrichten, 326, 432
- Faisst et al. (2020) Faisst, A. L., Schaerer, D., Lemaux, B. C., et al. 2020, ApJS, 247, 61
- Fan et al. (2006) Fan, X., Strauss, M. A., Richards, G. T., et al. 2006, The Astronomical Journal, 131, 1203
- Feltre et al. (2016) Feltre, A., Charlot, S., & Gutkin, J. 2016, MNRAS, 456, 3354
- Ferland et al. (2013) Ferland, G. J., Porter, R. L., van Hoof, P. A. M., et al. 2013, Rev. Mexicana Astron. Astrofis., 49, 137
- Ferrarese & Merritt (2000) Ferrarese, L. & Merritt, D. 2000, ApJ, 539, L9
- Feruglio et al. (2010) Feruglio, C., Maiolino, R., Piconcelli, E., et al. 2010, A&A, 518, L155
- Fontanot et al. (2007) Fontanot, F., Cristiani, S., Monaco, P., et al. 2007, A&A, 461, 39
- Fosbury et al. (2003) Fosbury, R. A. E., Humphrey, A., Villar-Martín, M., et al. 2003, in The Mass of Galaxies at Low and High Redshift, ed. R. Bender & A. Renzini, 308
- Gebhardt et al. (2000) Gebhardt, K., Bender, R., Bower, G., et al. 2000, ApJ, 539, L13
- Giacconi et al. (2002) Giacconi, R., Zirm, A., Wang, J., et al. 2002, ApJS, 139, 369
- Giallongo et al. (2019) Giallongo, E., Grazian, A., Fiore, F., et al. 2019, ApJ, 884, 19
- Giavalisco et al. (2004) Giavalisco, M., Ferguson, H. C., Koekemoer, A. M., et al. 2004, ApJ, 600, L93
- Glikman et al. (2007) Glikman, E., Djorgovski, S. G., Stern, D., Bogosavljević, M., & Mahabal, A. 2007, ApJ, 663, L73
- Grazian et al. (2020) Grazian, A., Giallongo, E., Fiore, F., et al. 2020, ApJ, 897, 94
- Grimes et al. (2007) Grimes, J. P., Heckman, T., Strickland, D., et al. 2007, ApJ, 668, 891
- Grogin et al. (2011) Grogin, N. A., Kocevski, D. D., Faber, S. M., et al. 2011, ApJS, 197, 35
- Gruppioni et al. (2013) Gruppioni, C., Pozzi, F., Rodighiero, G., et al. 2013, MNRAS, 432, 23
- Guo et al. (2013) Guo, Y., Ferguson, H. C., Giavalisco, M., et al. 2013, ApJS, 207, 24
- Gutkin et al. (2016) Gutkin, J., Charlot, S., & Bruzual, G. 2016, MNRAS, 462, 1757
- Hainline et al. (2011) Hainline, K. N., Shapley, A. E., Greene, J. E., & Steidel, C. C. 2011, ApJ, 733, 31
- Harikane et al. (2022) Harikane, Y., Inoue, A. K., Mawatari, K., et al. 2022, ApJ, 929, 1
- Hayes et al. (2016) Hayes, M., Melinder, J., Östlin, G., et al. 2016, ApJ, 828, 49
- Hildebrandt et al. (2006) Hildebrandt, H., Erben, T., Dietrich, J. P., et al. 2006, A&A, 452, 1121
- Hopkins et al. (2007) Hopkins, P. F., Lidz, A., Hernquist, L., et al. 2007, ApJ, 662, 110
- Hsieh et al. (2012) Hsieh, B.-C., Wang, W.-H., Hsieh, C.-C., et al. 2012, ApJS, 203, 23
- Inoue et al. (2014) Inoue, A. K., Shimizu, I., Iwata, I., & Tanaka, M. 2014, MNRAS, 442, 1805
- Jaskot et al. (2017) Jaskot, A. E., Oey, M. S., Scarlata, C., & Dowd, T. 2017, ApJ, 851, L9
- Koekemoer et al. (2011) Koekemoer, A. M., Faber, S. M., Ferguson, H. C., et al. 2011, ApJS, 197, 36
- Koptelova et al. (2019) Koptelova, E., Hwang, C.-Y., Malkan, M. A., & Yu, P.-C. 2019, ApJ, 882, 144
- Kormendy & Ho (2013) Kormendy, J. & Ho, L. C. 2013, ARA&A, 51, 511
- Kormendy & Richstone (1995) Kormendy, J. & Richstone, D. 1995, ARA&A, 33, 581
- Laporte et al. (2021) Laporte, N., Meyer, R. A., Ellis, R. S., et al. 2021, MNRAS, 505, 3336
- Le Fèvre et al. (2020) Le Fèvre, O., Béthermin, M., Faisst, A., et al. 2020, A&A, 643, A1
- Le Fèvre et al. (2019) Le Fèvre, O., Lemaux, B. C., Nakajima, K., et al. 2019, A&A, 625, A51
- Leitherer et al. (1999) Leitherer, C., Schaerer, D., Goldader, J. D., et al. 1999, ApJS, 123, 3
- Lin et al. (2022) Lin, Y.-H., Scarlata, C., Hayes, M., et al. 2022, MNRAS, 509, 489
- Lusso et al. (2012) Lusso, E., Comastri, A., Simmons, B. D., et al. 2012, MNRAS, 425, 623
- Magorrian et al. (1998) Magorrian, J., Tremaine, S., Richstone, D., et al. 1998, AJ, 115, 2285
- Marques-Chaves et al. (2021) Marques-Chaves, R., Schaerer, D., Álvarez-Márquez, J., et al. 2021, MNRAS, 507, 524
- Matthee et al. (2022) Matthee, J., Feltre, A., Maseda, M., et al. 2022, A&A, 660, A10
- McGreer et al. (2018) McGreer, I. D., Clément, B., Mainali, R., et al. 2018, MNRAS, 479, 435
- McKernan et al. (2007) McKernan, B., Yaqoob, T., & Reynolds, C. S. 2007, MNRAS, 379, 1359
- McLure et al. (2018) McLure, R. J., Pentericci, L., Cimatti, A., et al. 2018, MNRAS, 479, 25
- Morisset et al. (2015) Morisset, C., Delgado-Inglada, G., & Flores-Fajardo, N. 2015, Rev. Mexicana Astron. Astrofis., 51, 103
- Noll et al. (2009) Noll, S., Burgarella, D., Giovannoli, E., et al. 2009, A&A, 507, 1793
- Nonino et al. (2009) Nonino, M., Dickinson, M., Rosati, P., et al. 2009, ApJS, 183, 244
- Orr et al. (2019) Orr, M. E., Hayward, C. C., & Hopkins, P. F. 2019, MNRAS, 486, 4724
- Otte et al. (2003) Otte, B., Murphy, E. M., Howk, J. C., et al. 2003, ApJ, 591, 821
- Patrício et al. (2016) Patrício, V., Richard, J., Verhamme, A., et al. 2016, MNRAS, 456, 4191
- Prinja & Howarth (1986) Prinja, R. K. & Howarth, I. D. 1986, ApJS, 61, 357
- Raiter et al. (2010) Raiter, A., Fosbury, R. A. E., & Teimoorinia, H. 2010, A&A, 510, A109
- Retzlaff et al. (2010) Retzlaff, J., Rosati, P., Dickinson, M., et al. 2010, A&A, 511, A50
- Rupke et al. (2005) Rupke, D. S., Veilleux, S., & Sanders, D. B. 2005, ApJS, 160, 115
- Schaerer et al. (2020) Schaerer, D., Ginolfi, M., Béthermin, M., et al. 2020, A&A, 643, A3
- Schartmann et al. (2005) Schartmann, M., Meisenheimer, K., Camenzind, M., Wolf, S., & Henning, T. 2005, A&A, 437, 861
- Speagle et al. (2014) Speagle, J. S., Steinhardt, C. L., Capak, P. L., & Silverman, J. D. 2014, ApJS, 214, 15
- Spergel et al. (2003) Spergel, D. N., Verde, L., Peiris, H. V., et al. 2003, ApJS, 148, 175
- Stalevski et al. (2012) Stalevski, M., Fritz, J., Baes, M., Nakos, T., & Popovic, L. C. 2012, Publications de l’Observatoire Astronomique de Beograd, 91, 235
- Stalevski et al. (2016) Stalevski, M., Ricci, C., Ueda, Y., et al. 2016, MNRAS, 458, 2288
- Stanway & Eldridge (2018) Stanway, E. R. & Eldridge, J. J. 2018, MNRAS, 479, 75
- Stark et al. (2014) Stark, D. P., Richard, J., Siana, B., et al. 2014, MNRAS, 445, 3200
- Tacchella et al. (2016) Tacchella, S., Dekel, A., Carollo, C. M., et al. 2016, MNRAS, 458, 242
- Tang et al. (2021) Tang, M., Stark, D. P., Chevallard, J., et al. 2021, MNRAS, 501, 3238
- van Dokkum et al. (2013) van Dokkum, P., Brammer, G., Momcheva, I., Skelton, R. E., & Whitaker, K. E. 2013, arXiv e-prints, arXiv:1305.2140
- Vanzella et al. (2006) Vanzella, E., Cristiani, S., Dickinson, M., et al. 2006, A&A, 454, 423
- Vanzella et al. (2010) Vanzella, E., Grazian, A., Hayes, M., et al. 2010, A&A, 513, A20
- Vanzella et al. (2018) Vanzella, E., Nonino, M., Cupani, G., et al. 2018, MNRAS, 476, L15
- Vietri et al. (2022) Vietri, G., Misawa, T., Piconcelli, E., et al. 2022, arXiv e-prints, arXiv:2205.06832
- Vito et al. (2022) Vito, F., Mignoli, M., Gilli, R., et al. 2022, A&A, 663, A159
- Weymann et al. (1991) Weymann, R. J., Morris, S. L., Foltz, C. B., & Hewett, P. C. 1991, ApJ, 373, 23
- Wiklind et al. (2008) Wiklind, T., Dickinson, M., Ferguson, H. C., et al. 2008, ApJ, 676, 781
- Wuyts et al. (2008) Wuyts, S., Labbé, I., Förster Schreiber, N. M., et al. 2008, ApJ, 682, 985
- Yang et al. (2022) Yang, G., Boquien, M., Brandt, W. N., et al. 2022, ApJ, 927, 192
- Yang et al. (2020) Yang, G., Boquien, M., Buat, V., et al. 2020, MNRAS, 491, 740
- Zana et al. (2022) Zana, T., Gallerani, S., Carniani, S., et al. 2022, MNRAS, 513, 2118
Appendix A O vi, N v, N iv] literature sources
| ID | O vi | N v | N iv] | Ref | ||
| GS+14 | 5.55 | ✓ | ✓p | ✓ | This work | |
| AGN | Q0353-383 | 1.96 | ✓ | ✓ | ✓ | Baldwin et al. (2003) |
| DLS1053-0528 | 4.02 | ✓ | Glikman et al. (2007) | |||
| NDWFS1433 | 3.88 | ✓ | ✓ | Glikman et al. (2007) | ||
| UDS24561 | 3.21 | ✓ | Tang et al. (2021) | |||
| 33 NL AGN | ✓ | ✓ | ✓ | Hainline et al. (2011) | ||
| 12 Seyfert 2 | ✓ | Dors et al. (2014) | ||||
| 59 radio-galaxies | ✓ | Dors et al. (2014) | ||||
| 10 QSO2 | ✓ | Dors et al. (2014) | ||||
| S82-20 | 3.08 | ✓ | ✓ | Lin et al. (2022) | ||
| J1254+0241 | 1.8 | ✓ | ✓ | Dhanda et al. (2007) | ||
| J1546-5253 | 2.0 | ✓ | ✓ | Dhanda et al. (2007) | ||
| J1553+0056 | 2.63 | ✓p | Appenzeller et al. (2005) | |||
| 16 QSO | ✓ | ✓ | Dietrich & Wilhelm-Erkens (2000) | |||
| 11 QSO | ✓ | ✓ | ✓ | Dietrich et al. (2003) | ||
| PSO J006+39 | 6.61 | ✓ | Koptelova et al. (2019) | |||
| J1512+119 | 2.11 | ✓ | Borguet et al. (2012) | |||
| J000239+255034 | 5.80 | ✓ | Fan et al. (2006) | |||
| 124 QSO stack | ✓ | Bañados et al. (2016) | ||||
| 13 AGN stack | ✓ | ✓ | (Le Fèvre et al. 2019) | |||
| galaxy | Lynx Arc | 3.36 | ✓ | Fosbury et al. (2003) | ||
| 31 stack EW | ✓ | ✓ | Le Fèvre et al. (2019) | |||
| 120 stack | ✓ | ✓ | Le Fèvre et al. (2019) | |||
| J141445+544631 | 5.42 | ✓ | McGreer et al. (2018) | |||
| J160810+352809 | 0.03 | ✓p | Jaskot et al. (2017) | |||
| Ion3 | 4.0 | ✓p | Vanzella et al. (2018) | |||
| 17 low mass galaxies stack | ✓ | ✓ | Stark et al. (2014) | |||
| L∗ lensed galaxy | 3.5 | ✓ | ✓ | Patrício et al. (2016) | ||
| J0121+0025 | 3.24 | ✓p | ✓p | Marques-Chaves et al. (2021) |
Appendix B Photometry
We summarise here the ground- and space- based photometric data used in this work for the SED-fitting (see §3.2). The adopted filters, as well as their wavelengths and references to the measurements, are reported in Table 5. The photometry of all ALPINE sources has been collected and calibrated by Faisst et al. (2020). It comes primarily from the 3D-HST catalog and has been corrected for Galactic extinction, PSF size and other biases. Some additional data, not present in the 3D-HST catalog, comes from various observation programs in the Extended Chandra Deep Field South Giacconi et al. (2002, ECDFS,) and has been measured and calibrated by Faisst et al. (2020). GS-14 has not been detected by MPG-ESO/WFI in band , , and , in HST/ACS band, by Subaru/Suprime-Cam , , , , , , , and filters, and by Spitzer/MIPS at m. Regarding the X-ray bands, GS-14 is undetected in the ultradeep 7 Ms X-ray image by Chandra with a flux limit of in the observed-frame keV band (Giallongo et al. 2019). We refer to Faisst et al. (2020) for further details.
| Observatory | Filter | Central | Ref. |
|---|---|---|---|
| /Instrument | [Å] | ||
| MPG-ESO/WFI | I | 3633.3 | 1 |
| VLT/ISAAC | 12492.2 | 2 | |
| 16519.9 | 2 | ||
| 21638.3 | 2 | ||
| CFHT/WIRCam | 12544.6 | 3 | |
| 21590.4 | 3 | ||
| Subaru/Suprime-Cam | 8566.0 | 4 | |
| HST/ACS | 8058.2 | 5 | |
| 9181.2 | 6 | ||
| HST/WFC3 | 12516.3 | 7 | |
| 13969.4 | 8 | ||
| 15391.1 | 7 | ||
| Spitzer/IRAC | ch1 | 35634.3 | 9 |
| ch2 | 45110.1 | 9 | |
| ch3 | 57593.4 | 10 | |
| ch4 | 79594.9 | 10 |
Appendix C X-CIGALE SED-fitting parameter space
| Nsample | values | description | |
| SFH | sfh2exp; sfhdelayed; | double exponential; delayed SFH with optional exponential burst; | |
| sfhdelayedbq; sfhperiodic | delayed SFH with optional constant burst/quench; periodic SFH. | ||
| 3 | e-folding time of the main stellar population model in Myr. | ||
| agemain | 6 | Age of the main stellar population in the galaxy in Myr. | |
| 3 | e-folding time of the late starburst population model in Myr. | ||
| ageburst | 4 | 5,10,20,50 | Age of the late burst in Myr. |
| fburst | 4 | Mass fraction of the late burst population. | |
| IMF | Chabrier | Initial Mass Function | |
| 4 | Metallicity | ||
| 2 | Nebular component: ionization parameter | ||
| Zgas | 2 | Nebular component: gas metallicity | |
| dust attenaution | Charlot&Fall 2000 | ||
| AV,ISM | 3 | V-band attenuation in the interstellar medium. | |
| 3 | AV,ISM / (AV,BC+AV,ISM) | ||
| Dust emission | Draine+2014 | ||
| qPAH | 3 | Mass fraction of PAH. | |
| Umin | 4 | Minimum radiation field. | |
| 1 | Powerlaw slope dU/dM Uα. | ||
| 2 | Fraction illuminated from Umin to Umax. | ||
| AGN | Skirtor16 | ||
| 5 | Average edge-on optical depth at 9.7m. | ||
| p | 1 | 1.0 | Power-law index of radial gradient of dust density. |
| q | 1 | 1.0 | Power-law index of angular gradient of dust density. |
| oa | 1 | 40° | Torus half-opening angle. |
| Rratio | 1 | Ratio of the maximum to minimum radii of the dust torus. | |
| Mcl | 1 | 0.97 | Mass fraction of dust inside clumps. |
| 6 | 0°, 20°, 40°, 60°, 70°, 90° | Viewing angle (w.r.t. the AGN axis). | |
| disk type | 1 | Schartmann et al. (2005) | Disk spectrum. |
| 1 | -0.36 | Power-law index modifying the optical slope of the disk. | |
| fAGN | 4 | m AGN fraction. | |
| law | 1 | SMC | Extinction law of polar dust. |
| E(B-V) | 1 | 0.03 | E(B-V) for the extinction in the polar direction in magnitudes. |
| T | 1 | K | Temperature of the polar dust. |
| 1 | 1.6 | Emissivity index of the polar dust. |