The galaxy mass-size relation in CARLA clusters and proto-clusters at : larger cluster galaxy sizes
We study the galaxy mass-size relation in 15 spectroscopically confirmed clusters at from the CARLA survey. Our clusters span a total stellar mass in the range (with an approximate halo mass in the range ). Our main finding is that cluster passive early-type galaxies (ETGs) at with a mass are systematically larger () than field ETGs at a similar redshift and mass from the CANDELS survey. The passive ETG average size evolution with redshift is slower at when compared to the field. This could be explained by early-epoch differences in the formation and early evolution of galaxies in haloes of a different mass, as predicted by models. It does not exclude that other physical mechanisms, such as strong compaction and gas dissipation in field galaxies, followed by a sequence of mergers may have also played a significant role in the field ETG evolution, but not necessarily in the evolution of cluster galaxies. Our passive ETG mass-size relation shows a tendency to flatten at , where the average size is , which is broadly consistent with galaxy sizes in the field and in the local Universe. This implies that galaxies in the low end of the mass-size relation do not evolve much from to the present, and that their sizes evolve in a similar way in clusters and in the field. Brightest cluster galaxies lie on the same mass-size relation as satellites, suggesting that their size evolution is not different from satellites at redshift z 2. Half of the active early-type galaxies, which are of our ETG sample, follow the field passive galaxy mass-size relation, and the other half follow the field active galaxy mass-size relation. These galaxies likely went through a recent merger or neighbor galaxy interaction, and would most probably quench at a later epoch and increase the fraction of passive ETGs in clusters. We do not observe a large population of compact galaxies (only one), as is observed in the field at these redshifts, implying that the galaxies in our clusters are not observed in an epoch close to their compaction.
Key Words.:
Galaxies: formation, Galaxies: evolution, Galaxies: clusters: general, Galaxies: fundamental parameters, Galaxies: structure, Galaxies: star formation, Galaxies: elliptical and lenticular, cD, Cosmology: observations1 Introduction
In the local Universe and up to , the most massive galaxies are also among the largest (Kauffmann et al., 2003; Gadotti, 2009; Poggianti et al., 2013; Huertas-Company et al., 2013a; Fernández Lorenzo et al., 2013; Delaye et al., 2014; Belli et al., 2014; van Dokkum et al., 2015). For example, local elliptical galaxies follow a rather tight relation with an intrinsic scatter of less than 0.3 dex (Nair et al., 2011; Bernardi et al., 2011a, b, 2014). This dependence is called the galaxy mass-size relation (MSR), and provides insight into the past and present evolution of galaxies.
The first results on the mass-size and size-luminosity relation at and beyond were reported by Trujillo et al. (2004, 2006) and McIntosh et al. (2005), who initially did not find strong size differences for massive () galaxies at compared to , but they later reported that galaxies at are two times smaller on average. Later results (Trujillo et al., 2011; Mosleh et al., 2011; Dutton et al., 2011; Szomoru et al., 2012) confirm that the stellar MSR was already in place at , but its normalization increased at low redshift.
The arrival of the new data, such as the Cosmic Assembly Near-infrared Deep Extragalactic Legacy Survey (CANDELS; PI: S. Faber, H. Ferguson; Koekemoer et al., 2011; Grogin et al., 2011), and new observational techniques, such as strong lensing (Yang et al., 2021), confirm this view. van der Wel et al. (2012, 2014) measure the MSR redshift evolution for both passive and star-forming galaxies in the field in the redshift range . They demonstrate that the slope of the MSR does not evolve for either population. However, galaxies become more compact with increasing redshift, which is explained by Carollo et al. (2013) by the fact that the Universe was more dense in earlier times, and the galaxy density evolves approximately as the density of the Universe. Dimauro et al. (2019) analyze the MSR of bulges and disks, and find that they follow different MSRs. Their MSR weakly depends on the morphology of the host galaxy, and the sizes of disks do not depend on their star-formation activity. They conclude that quenching did not affect disk structures.
The shape of the MSR is consistent with a scenario in which galaxy growth is dominated by star formation due to cold gas accretion up to a certain mass (which is redshift- and size-dependent, corresponding to at and kpc approximately) and by galaxy mergers at higher masses (e.g., Shankar et al., 2013; van Dokkum et al., 2015; Zanisi et al., 2020) In fact, hierarchical models could explain the fast size growth of giant elliptical galaxies only by sequential minor dry mergers since (Naab et al., 2009; Trujillo et al., 2011; Newman et al., 2012; van Dokkum et al., 2015). On the other hand, spiral galaxies do not require minor mergers since their growth can be attributed to cold gas accretion (Dekel et al., 2009).
It is less clear though if galaxies in clusters and in the field evolved in the same way. In the local Universe, semi-analytical models predict a moderate to strong environmental dependence (Shankar et al., 2014); however most of the observational results agree that this relation is independent of environment (e.g., Guo et al., 2009; Weinmann et al., 2009; Cappellari, 2013; Huertas-Company et al., 2013b; Mosleh et al., 2018). Poggianti et al. (2013) find that cluster early-type galaxies (ETGs) are smaller than those in the field; however, they included a large fraction of S0 galaxies which appear to have smaller radii than elliptical galaxies at a fixed stellar mass (Bernardi et al., 2013; Huertas-Company et al., 2013a) and different environmental relations (Erwin et al., 2012; Sil’chenko et al., 2018). In another work, Huang et al. (2018) find that massive galaxies in clusters are as much as 20%-40% larger than in the field based on deep observations with the Hyper Suprime-Cam (see also Yoon et al., 2017). For spiral galaxies, the environmental dependence of the MSR is more pronounced: its scatter is much larger (Maltby et al., 2010; Cappellari, 2013; Lange et al., 2015) and disks are smaller in clusters (Kuchner et al., 2017; Demers et al., 2019). This means that dense environments either destroy disks or inhibit their growth, for example through tidal interactions, ram-pressure, and/or strangulation (Boselli & Gavazzi, 2006).
At intermediate redshift, several works have shown that the average size of the quiescent ETGs at is the same for galaxies in the field and dense environments (e.g., Rettura et al., 2010; Huertas-Company et al., 2013a; Kelkar et al., 2015; Saracco et al., 2017), and for stellar mass . Instead, smaller galaxy sizes in clusters are found by Raichoor et al., 2012 for bulge-dominated galaxies in the Lynx superstructure at , in the galaxy mass range log), and by Matharu et al. (2019) at .
At higher redshift, , most works find larger quiescent ETG sizes in clusters at both high (Papovich et al., 2012; Strazzullo et al., 2013; Delaye et al., 2014; Chan et al., 2018; Noordeh et al., 2021, log) and low (Mei et al., 2015, log) mass. These results are also stable when using different galaxy mass proxies (Andreon, 2020). However, Allen et al. (2015), find larger cluster star-forming galaxies and similar cluster quiescent galaxy sizes compared to the field, in the mass range log. It has to be noticed that their results are limited by their sample size, and they point out that they are only sensitive to differences in size of 0.7 kpc or greater. Strazzullo et al. (2022) also find similar cluster quiescent galaxy sizes compared to the field, in massive galaxy clusters from South Pole Telescope Sunyaev-Zeldovich effect survey at and galaxy stellar masses of log.
There is also some evidence that the MSR flattens out at low masses, log, in the local Universe Bernardi et al. (2011b), and up to (Saracco et al., 2017; Nedkova et al., 2021), as predicted by models (Shankar et al., 2014).
Finally, several studies find high percentages of compact post-starburst (Maltby et al., 2018; Socolovsky et al., 2019; Matharu et al., 2020; Wilkinson et al., 2021) and massive compact galaxies (Lu et al., 2019; Gu et al., 2020; Tadaki et al., 2020) in dense environments at .
In this paper, we extended MSR studies in a unique sample of galaxy clusters at redshift from the Clusters Around Radio-Loud AGN (CARLA; Wylezalek et al., 2013, 2014) survey. We find that passive ETGs in clusters are larger () than in the field at these redshifts, while late-type galaxies (LTGs) have similar sizes. Combining our results with other cluster studies, we demonstrate that cluster passive ETGs have much slower size evolution than their field counterparts. The brightest bluster galaxies (BCG) lie on the same MSR as satellites. Half of the ETGs with active star-formation lie on the LTGs MSR. The MSR flattens at low mass, and we do not observe large percentages of very compact galaxies in our sample.
The structure of this paper is as follows. We describe our observations in Section 2. The galaxy property measurements and our sample selection are presented in Section 3. Our results are presented in Section 4, and discussed in Section 5. Section 6 summarizes the paper.
Throughout this paper, we adopt a - cold dark matter () cosmology with , , , and , and assume a Chabrier initial mass function (IMF) (Chabrier, 2003). The photometry and structural parameters in this paper were measured adopting the 3D-HST empirical PSF model 111https://archive.stsci.edu/prepds/3d-hst/ for the HST/WFC3 GOODS-S images in the F140W () band. Hereafter, we call star-forming galaxies ”active”, not to confuse with active galactic nuclei.
2 The CARLA survey
2.1 CARLA cluster candidates
CARLA is a 408h Warm Spitzer IRAC survey of galaxy overdensities around 420 radio-loud AGN (RLAGN). The AGN were selected across the full sky and in the redshift range of . Approximately half of them are radio-loud quasars (RLQs) and the other half are high-redshift radio galaxies (HzRGs). With the aim to detect galaxy cluster candidates, Wylezalek et al. (2013) selected galaxies at around the AGN, using a color selection in the IRAC channel 1 (; IRAC1, hereafter) and channel 2 (; IRAC2, hereafter). They found that of the selected RLAGN reside in dense environments with respect to a field sample in the Spitzer UKIDSS Ultra Deep Survey (SpUDS, Rieke et al., 2004), with the majority () of them being overdense at a level, and of them at a level.
From their IRAC luminosity function, Wylezalek et al. (2014) showed that CARLA overdensity galaxies have probably quenched faster and earlier than field galaxies. Some of the CARLA northern overdensities were also observed in either deep z-band or deep i-band, with Gemini/GMOS, VLT/ISAAC and WHT/ACAM (P.I. Hatch (see below); Cooke et al., 2015). These observations permitted them to estimate galaxy star formation rate histories, and to deduce that, on average, the star formation of galaxies in these targets had been rapidly quenched (Cooke et al., 2015).
The twenty highest overdensitiy CARLA Spitzer candidates were followed by a Hubble Space Telescope Wide Field Camera 3 (HST/WFC3) observations (P.I. Stern (see below); Noirot et al., 2016, 2018), and sixteen of them were spectroscopically confirmed at , together with seven spectroscopically confirmed serendipitous structures at (Noirot et al., 2018). The structure members were confirmed as line-emitters in H, H, [OII], and/or [OIII], depending on the redshift, and have star formation estimates from the line fluxes (Noirot et al., 2018). The galaxy star-formation (for stellar mass ) is below the star-forming main sequence (MS) of field galaxies at a similar redshift. Star-forming galaxies are mostly found within the central regions (Noirot et al., 2018).
Mei et al. (2022, hereafter, M22) performed an in-depth study of the morphology, quiescence and merger incidence of CARLA clusters. They found that the galaxy morphology-density and passive-density relations are already in place at . The cluster ETG and passive fractions depend on local environment and mildly on galaxy mass. Active ETGs are 30 of the total ETG population. Cluster merger fractions are significantly higher than in the CANDELS fields, as predicted from previous studies to explain high quiescent fractions at . Their findings confirm that all the spectroscopically confirmed CARLA overdensities have properties consistent with clusters and proto-clusters.
2.2 Spitzer observations
All CARLA clusters were observed with Spitzer IRAC1 and IRAC2 (Cycle 7 and 8 snapshot program; P.I.: D. Stern), with total exposure times of 800 s/1000 s in IRAC1 and 2000 s/2100 s in IRAC2, for radio galaxies at , which provided a similar depth in both channels. The IRAC cameras have InSb detector arrays with a pixel size of 1.22 arcsec and a field of view of arcmin. Wylezalek et al. (2013) performed the data calibration and mosaicing with the MOPEX package (Makovoz & Khan, 2005) and detected sources with SExtractor (Bertin & Arnouts, 1996), using the IRAC-optimized SExtractor parameters from Lacy et al. (2005). The final Spitzer IRAC1 and IRAC2 mosaic has a pixel size of 0.61 arcsec, after taking into account dithering and subpixelation. The 95% completeness limit is IRAC1=22.6 mag and IRAC2=22.9 mag.
2.3 HST observations
The HST/WFC3 imaging and grism spectroscopy were obtained with a dedicated HST follow-up program (Program ID: 13740; P.I.: D. Stern). The program consisted of F140W band (hereafter ) imaging with a field of view of at a resolution of , after taking into account dithering, and G141 grism spectroscopy with a thoughtput ¿ 10% in the wavelength range of and spectral resolution . This grism was chosen in order to permit the identification of strong emission lines at our target redshift, such as H, H, [OII] and [OIII]. Noirot et al. (2016, 2018) performed the data reduction using the aXe (Kümmel et al., 2009) pipeline, by combining the individual exposures, and removing cosmic ray and sky signal. They performed the source detection with SExtractor (Bertin & Arnouts, 1996), and extracted two-dimensional spectra for each field, based on the positions and sizes of the sources. The redshifts and emission line fluxes were determined using the python version of mpfit and are published in Noirot et al. (2018). Our HST image 5 magnitude limit within an aperture of radius of arcsec is mag.
2.4 Ground-based optical observations
Ground-based optical imaging in - or -band is available for nine of the CARLA clusters (Cooke et al., 2015). Seven clusters were observed in September 2013 - December 2014 using ACAM at 4.2m William Hershel telescope (P.I. Hatch). ACAM has a circular field of view, 8.3 arcmin in diameter with a pixel scale 0.25 arcsec pixel-1. Two other clusters were observed between February and April 2014 with GMOS-S (at the Gemini South telescope) using the EEV detectors. The field of view of GMOS-S is arcmin with a pixel scale of 0.146 arcsec pixel-1. Exposure times were calculated depending on the actual seeing, in order to reach a consistent depth across all fields. The reduction of the i-band images was performed with the publicly available THELI software (Erben et al., 2005; Schirmer, 2013). For the photometric calibration we used either available Sloan Digital Sky Survey photometry or standard stars observed before and after the cluster observations. More details on these observations and image reduction can be found in Cooke et al. (2015). CARLA J2039-2514 has archival imaging observations with VLT/ISAAC (run ID 69.A-0234) in the z-band with 4800s exposure time (see also Noirot et al., 2016).
3 Sample selection and galaxy property measurements
We focus this study on 15 of the 16 CARLA confirmed clusters in Noirot et al. (2018), those that present sufficiently high overdensities to yield low field galaxy contamination (M22).
3.1 Galaxy sample selection
Details on our cluster and galaxy selection are found in M22, and we describe below the main steps leading to our cluster and galaxy sample selection, and the galaxy property measurements.
3.1.1 Galaxy photometry and mass measurement
Our photometry was obtained from a joint analysis of IRAC1, IRAC2, and, when available, ground-based i-band or z-band images. For an efficient source deblending, M22 used the T-PHOT software (Merlin et al., 2015, 2016), with the high-resolution HST images as priors to derive PSF-matched fluxes in the lower-resolution bands.
M22 measured our CARLA galaxy stellar masses by calibrating our PSF-matched Spitzer/IRAC1 magnitudes with galaxy stellar masses from Santini et al. (2015) derived from the Guo et al. (2013) multiwavelength catalog in the CANDELS WIDE GOODS-S field. Hereafter, we use the symbol for the galaxy stellar mass. The Spitzer IRAC1 magnitudes correspond to the rest-frame near-infrared in the redshift range of the CARLA sample, and they expected them not to be biased by extinction. M22 found a very good correlation between these magnitudes and the Santini et al. (2015) mass measurements, with scatters of dex at the redshift of the clusters studied in this paper. Adding in quadrature the scatter of the relation and uncertainties from Santini et al. (2015), they obtained mass uncertainties in the range dex, and dex for log and log, respectively.
| SExtractor | Cold Mode | Hot Mode |
|---|---|---|
| DETECT_MINAREA | 5.0 | 10.0 |
| DETECT_THRESH | 0.75 | 0.7 |
| ANALYSIS_THRESH | 5.0 | 0.8 |
| FILTER_NAME | tophat_9.0_9x9 | gauss_4.0_7x7 |
| DEBLEND_NTHRESH | 16 | 64 |
| DEBLEND_MINCONT | 0.0001 | 0.001 |
| BACK_SIZE | 256 | 128 |
| BACK_FILTERSIZE | 9 | 5 |
| BACKPHOTO_THICK | 100 | 48 |
| parameter | description | constraints | units |
|---|---|---|---|
| Sérsic index | 0.2 : 8 | ||
| effective radius | 0.3 : 400 | pixel | |
| axis ratio | 0.0001 : 1 | ||
| magnitude | -3 : +3 | SExtractor mag |
3.1.2 Sample selection
M22’s sample selection aims at optimizing completeness and purity. Observations of most of the CARLA clusters and proto-clusters include three (, IRAC1, IRAC2) to five bandpasses (ground based i-band and z-band, , IRAC1, IRAC2), and they could not perform a precise photometric redshift analysis from their spectral energy distribution. Instead, they selected galaxies in color and spatial regions where they expected a low outlier contamination.
M22 selected galaxies with , mag, from which they obtained a sample pure and complete for galaxies at . To reduce the contamination from outliers with , but not at the cluster redshift, they only selected galaxies located in the densest cluster regions, in circles of radius of 0.5 arcmin ( Mpc at our redshifts), in which the background contamination is in most clusters (M22). The scale of these regions corresponds to the scale of the dense cluster cores at (Postman et al., 2005).
They also select galaxies brighter than mag. In fact, van der Wel et al. (2012) and Kartaltepe et al. (2015) showed that morphological classification and the measurement of galaxy structural parameters are dependable only for magnitudes brighter than the WFC3/F160W magnitude mag in the CANDELS Wide survey (Koekemoer et al., 2011). The CANDELS Wide survey reaches a 5 magnitude limit of mag, which is comparable to the CARLA magnitude limit of mag (both were calculated within an aperture with arcsec radius), when the different filter response functions are taken into account. For this reason, in this paper, we did not perform further simulations to assess the precision and bias of our measurements, and rely on the finding from van der Wel et al. (2012) for the choice of the magnitude limit of the galaxy sample chosen for our work. van der Wel et al. (2014) also pointed out that structural parameters measurements performed in infrared band-passes at our redshifts do not show significant differences.
M22’s final sample includes a total of 271 galaxies in fifteen CARLA confirmed clusters and nineteen overdense regions. In fact, three of our clusters are double structures (CARLAJ1358+5752, CARLAJ1018+0530, and CARLAJ2039-2514), as predicted by cosmological models for clusters assembling at (Chiang et al., 2013; Muldrew et al., 2015). Galaxies that were spectroscopically confirmed at a redshift different than the clusters by Noirot et al. (2018) and a recent photo-spectral analysis of CARLAJ1018+0530 by Werner et al. (MNRAS, submitted) were not included in the final catalog.
3.1.3 Galaxy morphological classification and passive and active galaxy selection
M22 performed a galaxy visual morphological classification using two large morphological classes, ETGs and late-type galaxies (LTGs). ETGs include spheroid and compact galaxies, and LTGs include disks and irregular galaxies. These correspond to the main morphological classes used in the CANDELS survey (Kartaltepe et al., 2015): (1) disk, these galaxies have a disk even if they do not show clear spiral arms; (2) spheroid, these galaxies are resolved spheroids and do not show a disk; (3) irregular, all extended galaxies that can be classified neither as a disk nor as a spheroid; (4) compact and unresolved, these are compact or unresolved galaxies; (5) unclassifiable. The sample used in this paper does not include any unclassifiable galaxies.
Nine of our CARLA clusters have been observed in the i or z-band from the ground (M22), which correspond to a rest-frame U/NUV band. For these clusters, M22 identified passive and active galaxies using color-color diagrams, which correspond to the UVJ diagrams used in the literature to separate passive from active dusty galaxies up to a redshift (e.g., Labbé et al., 2005; Wuyts et al., 2007; Williams et al., 2009; Whitaker et al., 2011; Fang et al., 2018). The fraction of the galaxies that could not be classified as passive and active (because of the lack of ground-based observations) corresponds to % of the galaxies. They selected passive galaxies as galaxies with specific star formation rate yr-1, using the CANDELS Santini et al. (2015) sSFR as the reference for their selection calibration. This selection permitted them to obtain passive samples that are 80-85% complete and pure, and includes recently quenched galaxies at below the field star formation main sequence.

3.2 Measurements of galaxy structural properties
We measured galaxy structural parameters using the software GALAPAGOS (Barden et al., 2012), using the high-resolution images. The channel corresponds to the rest-frame V band in all but the highest redshift cluster in our sample, CARLA J1017+6116, where instead corresponds to the rest-frame U-band. GALAPAGOS performs the following main steps: source detection; creation of image and noise cutouts for each detected source; estimation of the local background; fit of the surface brightness profile to a Sérsic profile; and compilation of all objects into a final output catalog.
The source detection is based on SExtractor (Bertin & Arnouts, 1996). Following Barden et al. (2012), we ran SExtractor on the images in the cold and hot modes, which are optimized to detect bright and faint objects, respectively. We adopted the same configuration of parameters used for the catalogs released by (CANDELS, Grogin et al., 2011; Koekemoer et al., 2011), and published by Galametz et al. (2013) and Guo et al. (2013). More specifically, we created a first catalog including all the cold sources; then we compared every source detected in the hot mode to the first catalog detections, added those whose central position did not lie inside the Kron ellipse of any cold source, discarding the others. Table 1 shows the key SExtractor parameters used in our source detection.
The photometric and structural parameter estimation was based on GALFIT (Peng et al., 2002), which fits the surface brightness profile of each detected source to a one-component Sérsic model (Sersic, 1968), defined by the following free parameters: the total magnitude , the half-light radius measured along the major axis (effective radius) , the Sérsic index , the axis ratio (the ratio between the model minor and major axis, ), the position angle , and the central position. The software uses the Levenberg-Marquardt algorithm to minimise the residual between a galaxy image and the PSF-convolved model by modifying the free parameters.
We used the same GALFIT configuration as van der Wel et al. (2012, 2014) (Table 2), given that the CANDELS Wide survey depth is comparable to the CARLA depth (see Sec. 3.2), and to have homogeneous measurements of cluster and field sizes. The conversion to physical length-scale in kiloparsec was performed using the angular distance of each cluster, assuming that all cluster galaxies have the same redshift as the average redshift of the cluster from Noirot et al. (2018).
We reran GALFIT on the 22 galaxies for which either GALAPAGOS did not converge or the resulting values had uncertainties greater than the value itself, or the parameters hit the constrains set for either , or . In those cases, we tried different values of the input parameters to find a stable global minimum of the residuals and resolve the problems listed above. We divided our sample in 3 categories: (i) Galaxies with a good quality fit; (ii) QSO, whose effective radii are uncertain due to saturation in the HST image (9 objects); (iii) Unresolved galaxies, where GALFIT converged close to the minimum constraint for the effective radius. We exclude QSO from our analysis.
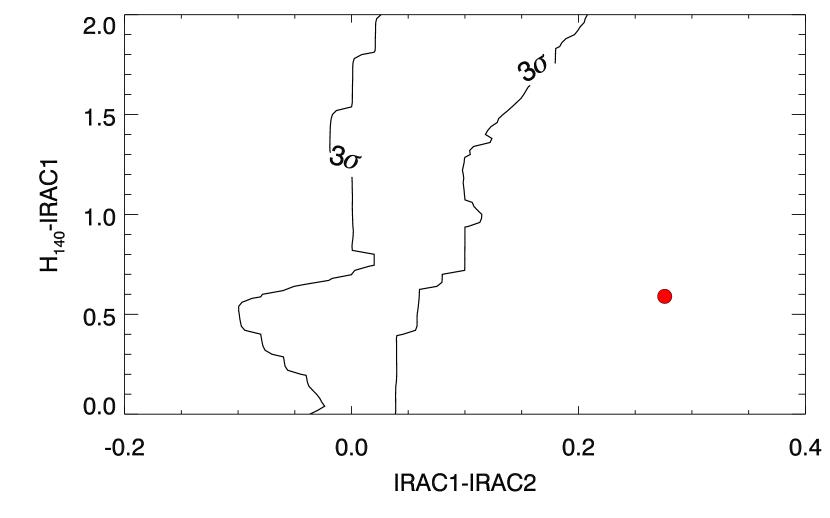
The unresolved galaxy category consists of only one object with an effective radius pix, which is close to the lower limit for the estimate used by van der Wel et al. (2012) ( arcsec or 0.3 pix in WFPC3 image). The objects with such small effective radii are essentially indistinguishable from point sources, so their is an upper limit, and they might be either a bona-fide extragalactic object, or a Milky Way star. This object is not listed in the Gaia EDR3 catalog as a star (Gaia Collaboration et al., 2021). Additionally, we used the TRILEGAL code222http://stev.oapd.inaf.it/cgi-bin/trilegal (Girardi et al., 2005) to obtain a sample of simulated stars with magnitudes IRAC1 mag at the source RA and DEC, and with standard settings for the geometry of the thin disk, the thick disk and the halo of the Milky Way, as well as for their stellar population parameters. We built a (-IRAC1) vs (IRAC1-IRAC2) diagram (see Fig. 1), to identify the locus of the synthetic star colors (see Fig. 1). The source does not lie in the star locus, and we keep it as a bona-fide galaxy.
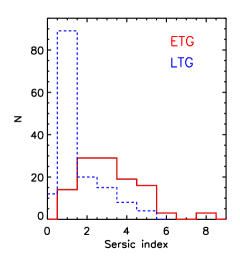
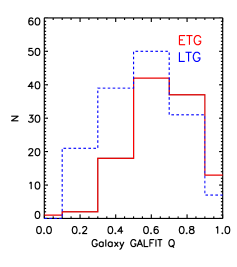
In Fig. 2, we compare our GALAPAGOS structural parameters with visual morphology from M22. The median Sérsic index for ETGs and LTGs is 3 and 1, respectively, consistent with what is expected for ETG de Vaucouleur and LTG exponential profiles. The median for early, late, asymmetric and symmetric galaxies is 0.7, 0.55, 0.7, and 0.55, respectively, with early and symmetric galaxies being rounder, as expected.
4 Results
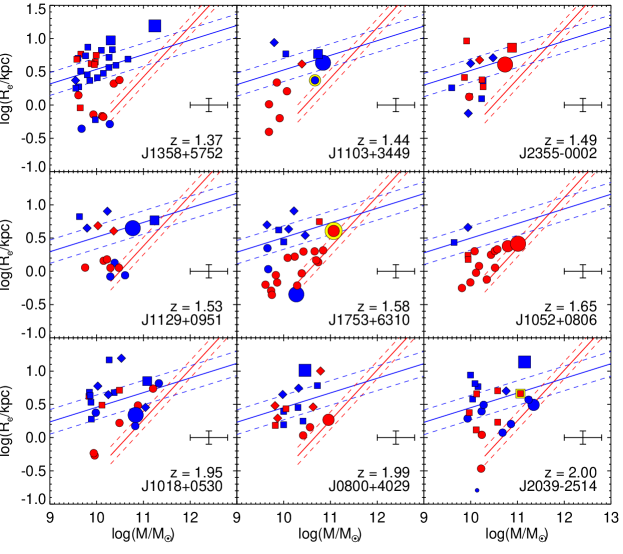
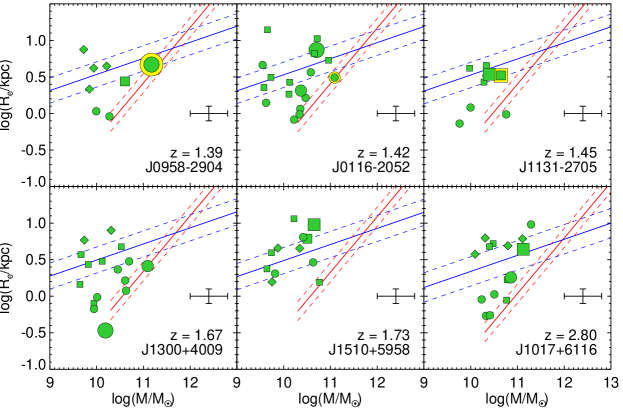
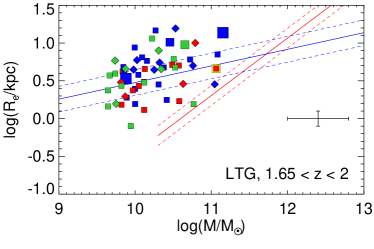
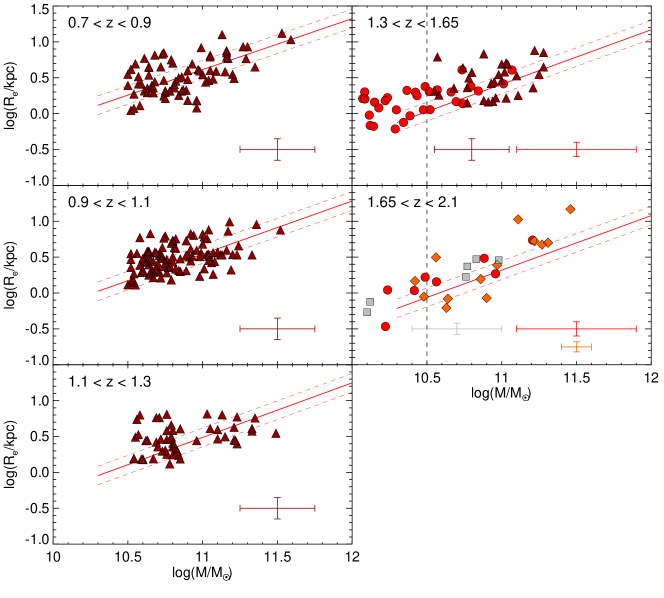
Fig. 3 shows each cluster passive and active galaxy MSR, compared to CANDELS (van der Wel et al., 2014). We interpolated the van der Wel et al. (2014) relations at each cluster redshift. While the active and LTG distributions lie on the same active galaxy MSR as van der Wel et al. (2014), the passive and ETG population systematically lie above the van der Wel et al. (2014)’s passive galaxy relation. This is also shown in Fig. 4, where we divide the sample in two redshift bins and observe a similar behavior. The relation also indicates a tendency to flatten at .
About of the cluster ETG are active, and mostly lie on the LTG galaxy MSR. The bulk of these active ETGs is found in just two clusters (J1018 and J2039, both around ; M22).
The cluster BCG and the second brightest are shown with larger symbols, and lie on the same MSR as the satellites.
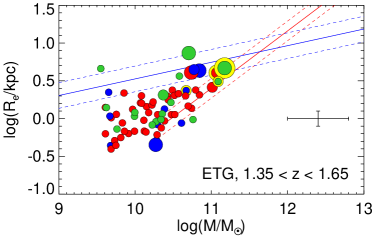
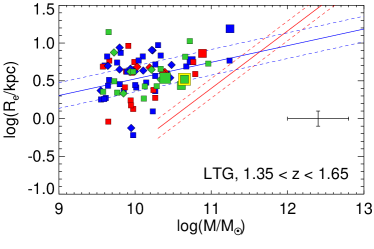
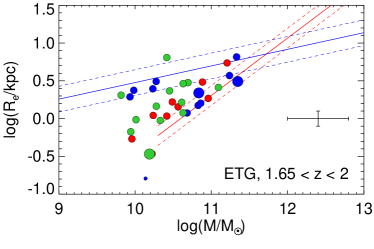
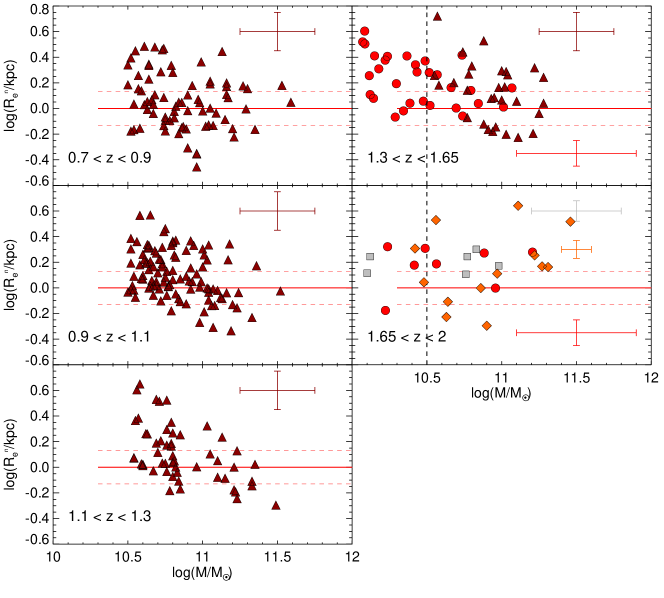
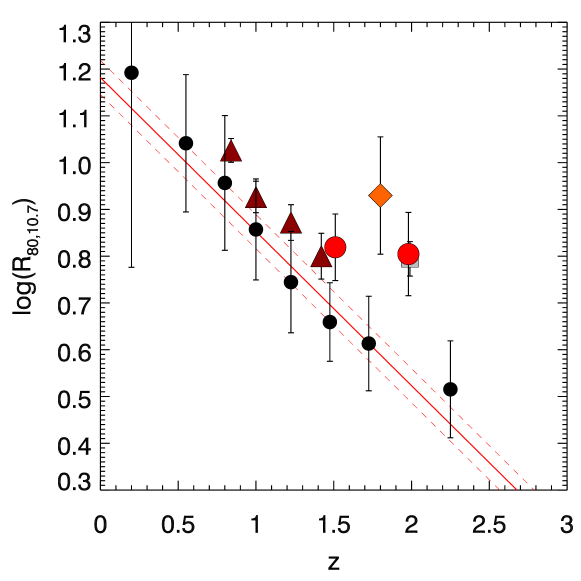
Fig. 5 shows the evolution of the passive ETG mass-size relation in clusters in the redshift range compared to the CANDELS (van der Wel et al., 2014) MSR. We added to our sample the passive ETG observations from Strazzullo et al. (2013), Delaye et al. (2014), and Newman et al. (2014), which used analyses similar to ours. When authors published circularized effective radii, defined as (e.g., Delaye et al., 2014), we convert their sizes to the Sérsic profile half-light radii along the major axis. Fig. 6 shows effective radii normalized to the passive MSR from van der Wel et al. (2014), , for the same observations as Fig. 5. Cluster galaxy sizes are on average larger.
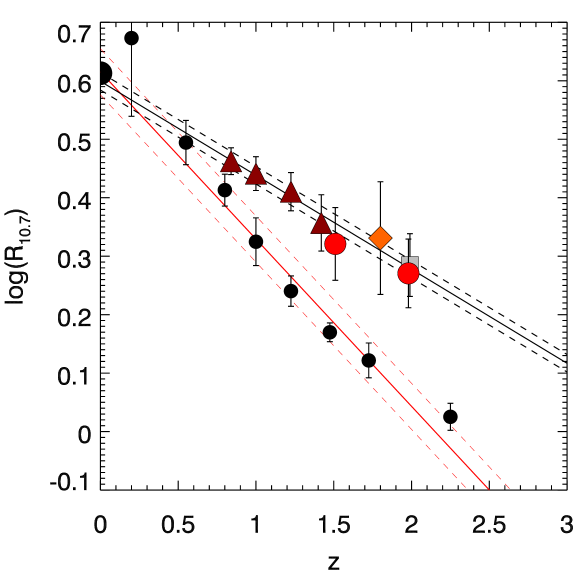
To better visualize the difference between cluster and field average sizes and study size evolution, Fig 7 shows the redshift evolution of the mass-normalized radius , defined as (van der Wel et al., 2014) :
| (1) |
In the conversion, we use the slope from van der Wel et al. (2014), interpolated to the redshifts that we are considering. Here we compute the average log in each redshift bin for Delaye et al. (2014) and our data, and in each cluster for Strazzullo et al. (2013) and Newman et al. (2014). The Delaye et al. (2014) observations are averaged over the same redshift bins (; ; and ) as in Figure 5. Our CARLA cluster observations are averaged over two redshift bins: , and . The uncertainties on are calculated using Monte Carlo simulations. For this figure, we only consider galaxies with for a homogeneous sample comparison. We select objects from van der Wel et al. (2014) applying the same color and magnitude cuts in IRAC that we applied to our sample.
While the MSR of cluster and field passive ETGs is mostly similar in the local Universe (e.g., Huertas-Company et al., 2013b), cluster ETG sizes are systematically larger than field passive galaxies for and and their evolution is slower in the range . In fact, while the cluster and field MSR are superposed within (Fig. 5), the average normalized cluster radii are larger than the field (Fig 7). We quantify this difference also by fitting the redshift evolution of the cluster for galaxy mass :
| (2) |
compared to the evolution in the field from van der Wel et al. (2014):
| (3) |
The fit was performed by taking into account the uncertainties on both axes, and the uncertainties on the fit are quantified with Monte Carlo simulations. For galaxies with , at cluster passive ETG are on average () larger than the field. At the cluster passive ETGs are 40% larger than passive galaxies in the field, and at they are larger by 120%. The passive ETG fraction in clusters is , compared to in CANDELS.
At lower mass, , the MSR is predicted (Shankar et al., 2013) and observed (Graham et al., 2006; Lange et al., 2015; Li et al., 2018; Hamadouche et al., 2022) to flatten at least up to (Nedkova et al., 2021). In the range , we measure an average cluster passive ETG size of .
5 Discussion
We observe larger passive ETG sizes in CARLA clusters () when compared to CANDELS field passive ETGs (van der Wel et al., 2014). Larger passive ETG sizes in clusters at are also observed by Strazzullo et al. (2013), Delaye et al. (2014), Newman et al. (2014), and Andreon (2020) in similar galaxy mass ranges. We obtain the evolution of the mass-normalized radius as a function of redshift, which shows that passive ETGs with and are systematically larger in clusters than in field environment. Their mass growth at is slower than in the field.
5.1 The mass-size relation at
At the lower redshift range , most of works find similar ETG/passive galaxy sizes in clusters and in the field (e.g., Rettura et al., 2010; Raichoor et al., 2012; Huertas-Company et al., 2013a; Kelkar et al., 2015; Allen et al., 2015; Saracco et al., 2017; Marsan et al., 2019). Matharu et al. (2019) find that cluster quiescent galaxies with are dex ( %) more compact than in the field (see also Raichoor et al., 2012), and are consistent within of the field MSR, which has an intrinsic scatter dex. They used a toy model to show that these galaxies will in part merge with the BCGs and in part be tidally destroyed, and new, larger, galaxies will be accreted into clusters from the field, maintaining a similar MSR in field and clusters in the redshift range . The model considers that galaxies in groups and filaments constantly fall into the cluster haloes over cosmic time (van Dokkum & Franx, 1996; Saglia et al., 2010; Shankar et al., 2015). Because of this accretion, new members are added to the original passive population. The new passive objects can form either through environmental quenching by ram-pressure (Gunn & Gott, 1972), harassment (Moore et al., 1996) or strangulation (van den Bosch et al., 2008), or they can infall already quenched, by group preprocessing (Fujita, 2004). In the first case, predominantly late-type disky galaxies are mostly transformed into lenticulars and dwarf ellipticals. In the second case, galaxies preprocessed in the group environment are larger. A part of the size growth in the clusters can be attributed to the addition of group elliptical and lenticular galaxies that mix with the native cluster ETG population and homogenize the size distribution to that of the field (see also Matteuzzi et al., 2022). This is further compounded by results by Matharu et al. (2020), that can be explained by the accretion of old compact ETGs onto BCGs or their disruption into the intracluster light. The Matharu et al. (2019) results at show larger sizes, and are consistent with this paper.
5.2 The mass-size relation at : Galaxy sizes are larger in clusters than in the field
Field galaxies at (van der Wel et al., 2014; Patel et al., 2017; Marsan et al., 2019) show larger sizes than the extrapolation of the field size evolution at lower redshift (e.g., see the highest redshift field point in Fig 7). This is explained by the transition from the epoch in which galaxy growth is dominated by gas accretion and the epoch in which minor mergers become dominant (Naab et al., 2009). On the other end, cluster galaxies are already larger than field galaxies at , then grow more slowly than field galaxies, to reach the same average sizes by and then evolve to on average in the same way as field galaxies, mainly because of accretion of field larger galaxies and disruption of the cluster more compact galaxies (Matharu et al., 2019).
Our work has highlighted a clear dichotomy in the evolution of the mean passive ETG sizes of similar stellar mass: galaxies in clusters tend to be larger at than their counterparts in the field, and evolve slower since (see also Andreon et al., 2016). Passive ETGs in the field are more compact at high redshift, show a faster growth, and eventually show a similar MSR to cluster galaxies at , as shown in the works cited above. In other words, passive ETGs of similar stellar mass appear to have a significant environmental (halo) dependence which tends to progressively disappear when approaching the local Universe.
5.2.1 Model predictions
This nontrivial evolution in the size evolution is not easily reconciled with theoretical models (see also Andreon (2020)). Mergers, especially dry mergers, have traditionally been invoked as the main driver behind the (strong) size evolution of massive galaxies, and in general of all ETGs, as confirmed by a number of cosmological theoretical (e.g., Guo et al., 2011; Shankar et al., 2013, 2014) and numerical (e.g., Naab et al., 2009; Genel et al., 2018; Furlong et al., 2017) studies.
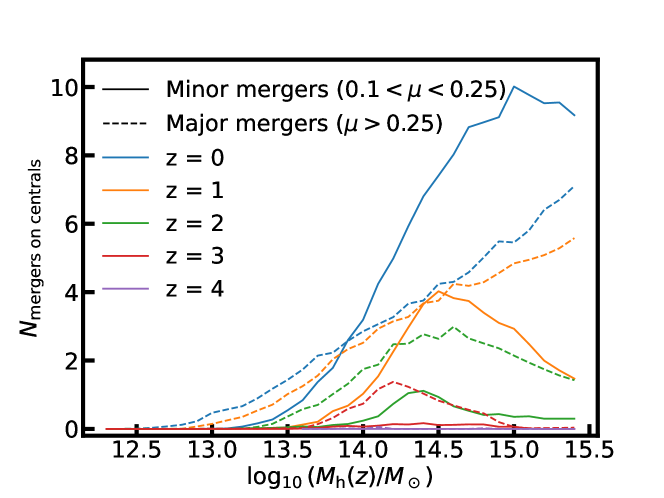
Therefore, one could hypothesize that galaxies in clusters may have undergone a more rapid size increase via mergers before infall into a larger halo. To investigate this hypothesis, Fig 8 shows the predicted cumulative number of expected mergers that a central galaxy of undergoes as a function of host dark matter halo mass from to present (as labeled) from the DECODE semi-empirical model (Fu et al., 2022). DECODE can flexibly compute the (mean) number of mergers of any central galaxy at any given redshift and host halo (cluster or field) without limits of mass or volume resolution and for any given input stellar mass-halo mass relation. Fig 8 shows that the number of both major and minor mergers undergone by central galaxies (dashed and solid lines, with thresholds as labeled) steadily increases as a function of host halo mass at all redshifts. It is interesting to observe that the model predicts that major mergers become more common in halos of mass log at , and minor mergers in halos of mass log at , exactly as it is observed for our CARLA sample in M22.
On the assumption that satellite galaxies with stellar mass in cluster environments with , were, before infall, “typical” central galaxies in host haloes of lower mass, then they should have experienced a merger history as the one reported in Fig 8. In particular, central galaxies with stellar mass typically reside in host haloes of with a weak dependence on redshift (e.g., Moster et al., 2018; Grylls et al., 2019, Fu et al. 2022). These haloes hardly go through any major or minor merger at , according to our predictions shown in Fig 8. Even allowing for more massive host haloes for more massive galaxies, the models do not predict mergers at up to , thus disfavoring early size growth via a sequence of minor or major mergers in moderately massive satellite galaxies in clusters, as long as the latter share similar properties and assembly histories to their field counterparts before infall.
Alternatively, progenitor bias could explain the difference between older, more compact and younger, more extended galaxies (e.g., Shankar & Bernardi, 2009; Lilly & Carollo, 2016), or simply the time a galaxy spends in the main sequence could make them larger (e.g., Genel et al., 2018). In our data though, this will imply that the larger cluster galaxies are younger and more extended and spent more time on the main sequence. We cannot measure the age distributions for our galaxies compared to the field, but we expect our cluster galaxies to be older and quenched (Thomas et al., 2005; Mei et al., 2022), and therefore to be smaller and not larger than field galaxies if their size would be different due to the progenitor bias.
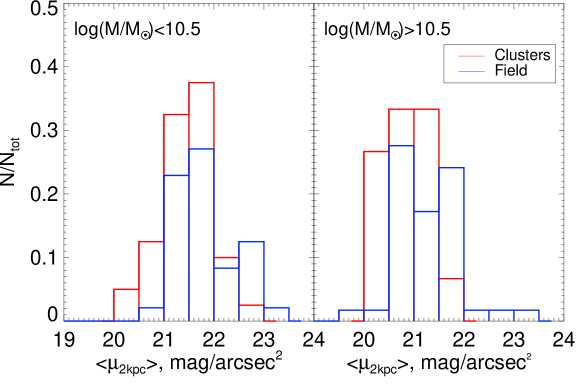
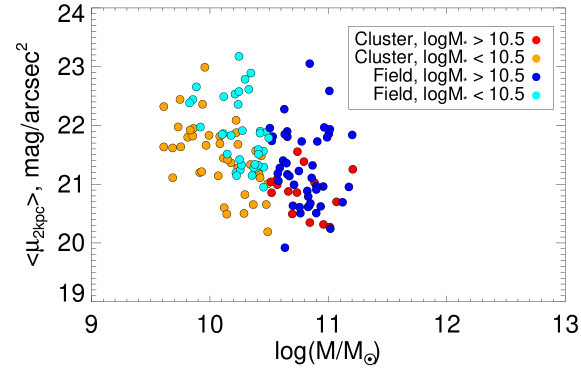
AGN feedback could induce a rapid puffing up of the host galaxy, if a proportionally significant gas mass is expelled from the central regions (Fan et al., 2008, 2010). However, it is not clear why strong AGN feedback should act only in those galaxies destined to become satellites in larger haloes and not in all galaxies of similar stellar mass at a given epoch. In addition, we inspected the central surface brightness within 2 kpc of galaxies of similar stellar mass in the field and in clusters, finding no signs of a reduced central density in cluster galaxies (see Fig. 9), which would be expected if AGN feedback had been expanding the central regions thus decreasing the central densities (Fan et al., 2010).
Kravtsov (2013) find evidence of a close linear relation between the effective radii of galaxies and their host haloes of the form , where is the host halo radius333Defined as the region containing a mass density equal to two hundred times the critical density of the Universe at a given redshift, and the constant of proportionality equal to a few percent, depending on the exact definition of host halo mass. This relation is also measured at higher redshifts (e.g., Somerville et al., 2018), confirmed in hydrodynamic simulations (e.g., Rohr et al., 2022), and it is used in analytic models to show that the size evolution and local size functions of intermediate and massive galaxies can be reproduced (e.g., Stringer et al., 2014; Zanisi et al., 2020, 2021b), along with the environmental halo dependence in the local Universe Zanisi et al. (2021a).
By using DECODE, we have assigned an effective radius to all centrals and satellite galaxies at different epochs living in the field and in clusters as those in our sample (), assuming throughout a constant 444The exact value of the constant assumed in this exercise is irrelevant as we are only interested in the relative difference between the mean sizes of field and cluster galaxies.. We found that indeed cluster galaxies have a weaker evolution than field galaxies of similar stellar mass, which catch up with their cluster counterparts at . However, for both predicted cluster and field galaxy radii we find an evolution of the type , that is as (e.g., Stringer et al., 2014), which is a weaker evolution than the one observed for ETGs (Figure 6) which is closer to , with in the field. This apparent discrepancy could be a sign that the Kravtsov relation is more appropriate to describe the bulk of the population for a given halo/stellar mass, which is represented by star-forming galaxies with . We conclude that possibly an imprint in the formation/early evolution of cluster galaxies, as mirrored in the Kravtsov relation, could explain at least in part the systematic difference observed in our sample for cluster and field ETGs, but other factors, such as strong compaction/gas dissipation in field galaxies, followed by a sequence of mergers (e.g., Dekel et al., 2009; Lapi et al., 2018) may have also played a significant role in shaping field, but not necessarily cluster, ETGs.
5.2.2 Galaxy size proxy and possible bias
The difference in the average galaxy size evolution might also be due to the choice of the galaxy size proxy that we use. In fact, the half-light radii can be biased by the way the galaxy light is distributed, and, for example, might not correspond to the galaxy sizes measured using mass distribution or other mass proxies (Miller et al., 2019; Suess et al., 2019; Miller et al., 2022), and might bias the quantification of size evolution if galaxies change concentration while changing size (Andreon, 2020).
Mass-to–light ratio gradients in galaxies could have a nonnegligible impact in the calibration and interpretation of the apparent size evolution of galaxies across cosmic time (e.g., Hopkins et al., 2009a, and references therein). Mass-to-light ratio gradients can be physically caused by gradients in the galaxy stellar populations, with older, more metal-poor, or dustier stellar populations having higher mass-to-light ratios than younger or more metal-rich ones. Suess et al. (2019) measure CANDELS galaxy half-mass radii and find that the redshift evolution of galaxy half-mass radii is much slower than that of half-light radii, as also pointed out by Miller et al. (2022). They showed that mass-to-light gradients are stronger for more massive, larger and redder galaxies. Bernardi et al. (2022) also discuss that stellar Initial Mass Function (IMF)-driven gradients might be even stronger than those driven by age and metallicity, and have a larger impact in galaxy size measurement, especially in ETGs.
While Fig.9 shows that our cluster and field samples cover a similar range in galaxy stellar mass, and similar central surface brightness, unfortunately we cannot measure half-mass radii for our cluster sample and study in depth possible bias due to the choice of our mass proxy. However, if galaxies in clusters experienced a different formation and assembly history than their field counterparts, then they could have generated nontrivial mass-to-light or IMF gradients that could induce an apparently weaker size evolution than field galaxies. In particular, our cluster half-light radii seem to better trace mass because they show a slower size evolution that is also observed for field half-mass radii (Suess et al., 2019). This suggests that our cluster galaxies might possess less pronounced mass-to-light ratio gradients than galaxies in the field.
Another way to understand bias due to the choice of using as a size proxy is to measure (a radius enclosing of the galaxy luminosity (see Miller et al., 2019; Mowla et al., 2019a; Andreon, 2020), which relates to the galaxy stellar mass in the same way as the dark matter halo mass (e.g., Mowla et al., 2019b). For a best-fitting Sérsic profile of each galaxy, the value can be calculated analytically (Miller et al., 2019). Figure 10 shows the mass-normalized evolution with redshift. The cluster passive ETG sizes are still 0.3 dex larger () than the field at . This is confirmed by Andreon (2020) in the redshift range for a sample of cluster ETG more massive than those selected in our work ()). This result also shows a clear dependence of galaxy size on the host halo mass (Kravtsov, 2013), independently of which light radius proxy is used.
5.3 BCG sizes
Our cluster BCGs and the second brightest cluster galaxies lie on the same MSR as the satellite galaxies. Our observations would suggest that the size evolution of BCGs should be similar to other ETG galaxies of similar stellar mass, and quite modest ( dex) at (see also Andreon, 2018). Cosmological models that include size evolution tend to predict, on average, a slightly larger increase (0.15-0.3 dex) since , depending on the exact model, the selection, and the physical assumptions made during the merger (e.g., Hopkins et al., 2009b; Shankar et al., 2013, 2015; Zoldan et al., 2019). Some models also predict that BCGs evolve from normal galaxies at , which then become larger due to different merger histories (Zhao et al., 2017). This latter work also finds that the most massive cluster galaxy at is a true progenitor of a local BCG less than of the time. Our observations agree with this last scenario, and suggest that BCG sizes evolved as those of the other cluster galaxies at .
5.4 Active ETGs that lie on the passive MSR
We observe active ETGs that follow the passive ETG MSR in four of our five clusters at (M22). The presence of active ETGs in clusters has been observed at (e.g., Sheen et al., 2016) and up to (Ferreras & Silk, 2000; Mei et al., 2006, 2015; Jaffé et al., 2011; Mansheim et al., 2017).
At the CARLA active ETGs that lie on the passive MSR are % of all ETGs, of which % lie within of the van der Wel et al. (2014)’s passive MSR (% for 2.5). At active ETG are % of all ETG, of which % lie within of the passive MSR (% for 2.5). About half of the active ETGs are mergers or asymmetric (M22).
The active ETGs that are not mergers and interactions mostly lie on the van der Wel et al. (2014)’s passive galaxy MSR as we would expect if their star formation activity did not change their size. Instead, the active ETGs that are mergers or asymmetric lie on the van der Wel et al. (2014)’s active galaxy MSR. For these last galaxies, the interactions with other galaxies might have triggered star formation. This might mean that their interactions or asymmetric shapes might have lead to our larger size measurements or that they are misclassified.
In the local Universe (), active ETGs are thought to have gone through recent gas-rich minor merger events or interactions with neighboring gas-rich galaxies, and are to become passive when their gas would be exhausted (e.g., Lee et al., 2006; Huertas-Company et al., 2010; George & Zingade, 2015; George, 2017). Half of our active ETGs are experiencing (M22), and the others very likely have experienced, a recent merger or galaxy interaction, and would most probably quench at a later epoch, thereby increasing the fraction of passive ETGs in the cluster population. Since the higher redshift end of our sample shows high percentage of active ETG that lie within 2.5 of the passive MSR, this suggests that the incidence of recent mergers or neighbor galaxy interactions might have been higher in higher redshift clusters. Since M22 do not observe higher merger fractions in the redshift range that we probe with the CARLA sample, observations at higher redshift are needed to test this hypothesis.
5.5 The MSR flattening for
Our MSR indicates a tendency to flatten at . In the range , we measure an average cluster passive ETG size of . This is a trend observed in passive ETGs in clusters and in the field in the local Universe (e.g., Bernardi et al., 2014; Nedkova et al., 2021) and at (e.g., Nedkova et al., 2021) for galaxies in the mass range . It is predicted in semi-analytical models (e.g., Shankar et al., 2013), where it occurs at the transitional mass , below which galaxy growth is dominated by both disk instabilities and mergers, and above which galaxy growth is dominated by minor mergers. Our average cluster passive ETG size is dex smaller than the average size from Nedkova et al. (2021), and consistent within . This suggests that the low mass end of the MSR does not evolve much from to present.
6 Summary
We studied the MSR of galaxies in a sample of 15 spectroscopically confirmed clusters from the CARLA survey (Wylezalek et al., 2013, 2014; Noirot et al., 2018). Our cluster total stellar mass spans ithe range , which corresponds to an approximate halo mass in the range (M22).
Our main results are:
-
•
Cluster LTGs at lie on the same MSR as active field galaxies from CANDELS (van der Wel et al., 2014).
-
•
Cluster ETGs at show sizes that are dex () systematically larger than passive field galaxies from CANDELS (van der Wel et al., 2014). The evolution of cluster passive ETG sizes is slower at when compared to the field. We fit the average evolution for the mass-normalized radius as:
(4) compared to the evolution in the field from van der Wel et al. (2014):
(5) -
•
BCGs lie on the same MSR as the satellites.
-
•
Half of the active ETGs follow the field passive galaxy MSR, and the other half the active galaxy MSR.
-
•
In the range , our passive ETG MSR is consistent with flattening, with an average . It is dex smaller than the field studies in the similar mass range at (Nedkova et al., 2021), but the two results are consistent within .
-
•
We do not observe a large population of compact galaxies (only one), in contrast with field studies at these redshifts (e.g., Barro et al., 2013), and studies that found high percentages of compact post-starburst (Maltby et al., 2018; Socolovsky et al., 2019; Matharu et al., 2020; Wilkinson et al., 2021).
In conclusion, the systematic difference in size that we observe between cluster and field passive ETG galaxies could most probably be explained by early-epoch differences in the formation and early evolution of galaxies in haloes of different mass, as predicted by models (Kravtsov, 2013). However, other physical mechanisms, such as strong compaction/gas dissipation in field galaxies, followed by a sequence of mergers (e.g., Hopkins et al., 2009b; Lapi et al., 2018) could play a role in field ETG galaxy evolution, but not necessarily in the evolution of cluster galaxies. The low-mass end of the MSR () did not evolve much from to the present and does not show significant environmental dependence. This suggests that the physical mechanisms that govern these low-mass galaxies are similar in clusters and in the field. We also find that the BCGs lie on the same MSR as the other cluster galaxies, implying that their size evolution is not very different from the other cluster galaxies at .
Our active ETGs that are not mergers and interactions mostly lie on the van der Wel et al. (2014)’s passive galaxy MSR as we would expect if their star formation activity did not change their size. Instead, the active ETGs that lie on the van der Wel et al. (2014)’s active galaxy MSR are mostly mergers and asymmetric, where the interactions with other galaxies might have triggered star formation. This might mean that their interactions or asymmetric shapes might have lead to our larger size measurements or that they were misclassified. These ETGs would most probably quench at a later epoch thereby increasing the fraction of passive ETGs in the cluster. Our sample also shows a lack of compact galaxies. This implies that the galaxies in our clusters are not observed at an epoch close to their compaction (e.g., Dekel et al., 2009; Barro et al., 2013), which might have happened at higher redshift in the rich cluster environments (e.g., Lustig et al., 2021).
Acknowledgements.
This work is based on observations made with the NASA/ESA Hubble Space Telescope, obtained at the Space Telescope Science Institute, which is operated by the Association of Universities for Research in Astronomy Inc., under NASA contract NAS 5-26555. These observations are associated with program GO-13740. Support for program GO-13740 was provided by NASA through a grant from the Space Telescope Science Institute, which is operated by the Association of Universities for Research in Astronomy Inc., under NASA contract NAS 5-26555. HF and FS acknowledge support from the European Union’s Horizon 2020 research and innovation programme under the Marie Skłodowska-Curie grant agreement No. 860744. This work is based on observations made with the Spitzer Space Telescope, which is operated by the Jet Propulsion Laboratory, California Institute of Technology, under a contract with NASA. We thank Ignacio Trujillo, Arjen van der Wel, Igor Chilingarian, and Francoise Combes for useful comments. We thank Leo Girardi for his help with the TRILEGAL model. We thank Université Paris Cité, which founded AA’ s Ph.D. research. SM thanks Jet Propulsion Laboratory, California Institute of Technology, for hosting her in the context of this project. The work of DS was carried out at the Jet Propulsion Laboratory, California Institute of Technology, under a contract with NASA. GN acknowledges funding support from the Natural Sciences and Engineering Research Council (NSERC) of Canada through a Discovery Grant and Discovery Accelerator Supplement, and from the Canadian Space Agency through grant 18JWST-GTO1. NAH thanks the Science and Technology Facilities Council, UK, consolidated grant ST/T000171/1. This work was supported by the French Space Agency (CNES). We thank the anonymous referee for her/his careful reading of the manuscript and useful suggestions that helped to improve the paper.References
- Allen et al. (2015) Allen, R. J., Kacprzak, G. G., Spitler, L. R., et al. 2015, ApJ, 806, 3
- Andreon (2018) Andreon, S. 2018, A&A, 617, A53
- Andreon (2020) Andreon, S. 2020, A&A, 640, A34
- Andreon et al. (2016) Andreon, S., Dong, H., & Raichoor, A. 2016, A&A, 593, A2
- Barden et al. (2012) Barden, M., Häußler, B., Peng, C. Y., McIntosh, D. H., & Guo, Y. 2012, MNRAS, 422, 449
- Barro et al. (2013) Barro, G., Faber, S. M., Pérez-González, P. G., et al. 2013, ApJ, 765, 104
- Belli et al. (2014) Belli, S., Newman, A. B., & Ellis, R. S. 2014, ApJ, 783, 117
- Bernardi (2009) Bernardi, M. 2009, MNRAS, 395, 1491
- Bernardi et al. (2013) Bernardi, M., Meert, A., Sheth, R. K., et al. 2013, MNRAS, 436, 697
- Bernardi et al. (2014) Bernardi, M., Meert, A., Vikram, V., et al. 2014, MNRAS, 443, 874
- Bernardi et al. (2011a) Bernardi, M., Roche, N., Shankar, F., & Sheth, R. K. 2011a, MNRAS, 412, 684
- Bernardi et al. (2011b) Bernardi, M., Roche, N., Shankar, F., & Sheth, R. K. 2011b, MNRAS, 412, L6
- Bernardi et al. (2022) Bernardi, M., Sheth, R. K., Sánchez, H. D., et al. 2022, MNRAS[arXiv:2201.07810]
- Bertin & Arnouts (1996) Bertin, E. & Arnouts, S. 1996, A&AS, 117, 393
- Boselli & Gavazzi (2006) Boselli, A. & Gavazzi, G. 2006, PASP, 118, 517
- Cappellari (2013) Cappellari, M. 2013, ApJ, 778, L2
- Carollo et al. (2013) Carollo, C. M., Bschorr, T. J., Renzini, A., et al. 2013, ApJ, 773, 112
- Chabrier (2003) Chabrier, G. 2003, PASP, 115, 763
- Chan et al. (2018) Chan, J. C. C., Beifiori, A., Saglia, R. P., et al. 2018, ApJ, 856, 8
- Chiang et al. (2013) Chiang, Y.-K., Overzier, R., & Gebhardt, K. 2013, ApJ, 779, 127
- Cooke et al. (2015) Cooke, E. A., Hatch, N. A., Rettura, A., et al. 2015, MNRAS, 452, 2318
- Dekel et al. (2009) Dekel, A., Birnboim, Y., Engel, G., et al. 2009, Nature, 457, 451
- Delaye et al. (2014) Delaye, L., Huertas-Company, M., Mei, S., et al. 2014, MNRAS, 441, 203
- Demers et al. (2019) Demers, M. L., Parker, L. C., & Roberts, I. D. 2019, MNRAS, 489, 2216
- Dimauro et al. (2019) Dimauro, P., Huertas-Company, M., Daddi, E., et al. 2019, MNRAS, 489, 4135
- Dutton et al. (2011) Dutton, A. A., van den Bosch, F. C., Faber, S. M., et al. 2011, MNRAS, 410, 1660
- Erben et al. (2005) Erben, T., Schirmer, M., Dietrich, J. P., et al. 2005, Astronomische Nachrichten, 326, 432
- Erwin et al. (2012) Erwin, P., Gutiérrez, L., & Beckman, J. E. 2012, ApJ, 744, L11
- Fan et al. (2010) Fan, L., Lapi, A., Bressan, A., et al. 2010, ApJ, 718, 1460
- Fan et al. (2008) Fan, L., Lapi, A., De Zotti, G., & Danese, L. 2008, ApJ, 689, L101
- Fang et al. (2018) Fang, J. J., Faber, S. M., Koo, D. C., et al. 2018, ApJ, 858, 100
- Fernández Lorenzo et al. (2013) Fernández Lorenzo, M., Sulentic, J., Verdes-Montenegro, L., & Argudo-Fernández, M. 2013, MNRAS, 434, 325
- Ferreras & Silk (2000) Ferreras, I. & Silk, J. 2000, ApJ, 541, L37
- Fu et al. (2022) Fu, H., Shankar, F., Ayromlou, M., et al. 2022, MNRAS, 516, 3206
- Fujita (2004) Fujita, Y. 2004, PASJ, 56, 29
- Furlong et al. (2017) Furlong, M., Bower, R. G., Crain, R. A., et al. 2017, MNRAS, 465, 722
- Gadotti (2009) Gadotti, D. A. 2009, MNRAS, 393, 1531
- Gaia Collaboration et al. (2021) Gaia Collaboration, Brown, A. G. A., Vallenari, A., et al. 2021, A&A, 649, A1
- Galametz et al. (2013) Galametz, A., Grazian, A., Fontana, A., et al. 2013, ApJS, 206, 10
- Genel et al. (2018) Genel, S., Nelson, D., Pillepich, A., et al. 2018, MNRAS, 474, 3976
- George (2017) George, K. 2017, A&A, 598, A45
- George & Zingade (2015) George, K. & Zingade, K. 2015, A&A, 583, A103
- Girardi et al. (2005) Girardi, L., Groenewegen, M. A. T., Hatziminaoglou, E., & da Costa, L. 2005, A&A, 436, 895
- Graham et al. (2006) Graham, A. W., Merritt, D., Moore, B., Diemand, J., & Terzić, B. 2006, AJ, 132, 2711
- Grogin et al. (2011) Grogin, N. A., Kocevski, D. D., Faber, S. M., et al. 2011, ApJS, 197, 35
- Grylls et al. (2019) Grylls, P. J., Shankar, F., Zanisi, L., & Bernardi, M. 2019, MNRAS, 483, 2506
- Gu et al. (2020) Gu, Y., Fang, G., Yuan, Q., & Lu, S. 2020, PASP, 132, 054101
- Gunn & Gott (1972) Gunn, J. E. & Gott, III, J. R. 1972, ApJ, 176, 1
- Guo et al. (2011) Guo, Q., White, S., Boylan-Kolchin, M., et al. 2011, MNRAS, 413, 101
- Guo et al. (2013) Guo, Y., Ferguson, H. C., Giavalisco, M., et al. 2013, ApJS, 207, 24
- Guo et al. (2009) Guo, Y., McIntosh, D. H., Mo, H. J., et al. 2009, MNRAS, 398, 1129
- Hamadouche et al. (2022) Hamadouche, M. L., Carnall, A. C., McLure, R. J., et al. 2022, MNRAS, 512, 1262
- Hopkins et al. (2009a) Hopkins, P. F., Bundy, K., Murray, N., et al. 2009a, MNRAS, 398, 898
- Hopkins et al. (2009b) Hopkins, P. F., Hernquist, L., Cox, T. J., Keres, D., & Wuyts, S. 2009b, ApJ, 691, 1424
- Huang et al. (2018) Huang, S., Leauthaud, A., Greene, J., et al. 2018, MNRAS, 480, 521
- Huertas-Company et al. (2010) Huertas-Company, M., Aguerri, J. A. L., Tresse, L., et al. 2010, A&A, 515, A3
- Huertas-Company et al. (2013a) Huertas-Company, M., Mei, S., Shankar, F., et al. 2013a, MNRAS, 428, 1715
- Huertas-Company et al. (2013b) Huertas-Company, M., Shankar, F., Mei, S., et al. 2013b, ApJ, 779, 29
- Jaffé et al. (2011) Jaffé, Y. L., Aragón-Salamanca, A., De Lucia, G., et al. 2011, MNRAS, 410, 280
- Kartaltepe et al. (2015) Kartaltepe, J. S., Mozena, M., Kocevski, D., et al. 2015, ApJS, 221, 11
- Kauffmann et al. (2003) Kauffmann, G., Heckman, T. M., White, S. D. M., et al. 2003, MNRAS, 341, 33
- Kelkar et al. (2015) Kelkar, K., Aragón-Salamanca, A., Gray, M. E., et al. 2015, MNRAS, 450, 1246
- Koekemoer et al. (2011) Koekemoer, A. M., Faber, S. M., Ferguson, H. C., et al. 2011, ApJS, 197, 36
- Kravtsov (2013) Kravtsov, A. V. 2013, ApJ, 764, L31
- Kuchner et al. (2017) Kuchner, U., Ziegler, B., Verdugo, M., Bamford, S., & Häußler, B. 2017, A&A, 604, A54
- Kümmel et al. (2009) Kümmel, M., Walsh, J. R., Pirzkal, N., Kuntschner, H., & Pasquali, A. 2009, PASP, 121, 59
- Labbé et al. (2005) Labbé, I., Huang, J., Franx, M., et al. 2005, ApJ, 624, L81
- Lacy et al. (2005) Lacy, M., Wilson, G., Masci, F., et al. 2005, ApJS, 161, 41
- Lange et al. (2015) Lange, R., Driver, S. P., Robotham, A. S. G., et al. 2015, MNRAS, 447, 2603
- Lapi et al. (2018) Lapi, A., Pantoni, L., Zanisi, L., et al. 2018, ApJ, 857, 22
- Lee et al. (2006) Lee, J. H., Lee, M. G., & Hwang, H. S. 2006, ApJ, 650, 148
- Li et al. (2018) Li, H., Mao, S., Cappellari, M., et al. 2018, MNRAS, 476, 1765
- Lilly & Carollo (2016) Lilly, S. J. & Carollo, C. M. 2016, ApJ, 833, 1
- Lu et al. (2019) Lu, S.-Y., Gu, Y.-Z., Fang, G.-W., & Yuan, Q.-R. 2019, Research in Astronomy and Astrophysics, 19, 150
- Lustig et al. (2021) Lustig, P., Strazzullo, V., D’Eugenio, C., et al. 2021, MNRAS, 501, 2659
- Makovoz & Khan (2005) Makovoz, D. & Khan, I. 2005, in Astronomical Society of the Pacific Conference Series, Vol. 347, Astronomical Data Analysis Software and Systems XIV, ed. P. Shopbell, M. Britton, & R. Ebert, 81
- Maltby et al. (2018) Maltby, D. T., Almaini, O., Wild, V., et al. 2018, MNRAS, 480, 381
- Maltby et al. (2010) Maltby, D. T., Aragón-Salamanca, A., Gray, M. E., et al. 2010, MNRAS, 402, 282
- Mansheim et al. (2017) Mansheim, A. S., Lemaux, B. C., Dawson, W. A., et al. 2017, ApJ, 834, 205
- Marsan et al. (2019) Marsan, Z. C., Marchesini, D., Muzzin, A., et al. 2019, ApJ, 871, 201
- Matharu et al. (2020) Matharu, J., Muzzin, A., Brammer, G. B., et al. 2020, MNRAS, 493, 6011
- Matharu et al. (2019) Matharu, J., Muzzin, A., Brammer, G. B., et al. 2019, MNRAS, 484, 595
- Matteuzzi et al. (2022) Matteuzzi, M., Marinacci, F., Nipoti, C., & Andreon, S. 2022, MNRAS, 513, 3893
- McIntosh et al. (2005) McIntosh, D. H., Bell, E. F., Rix, H.-W., et al. 2005, ApJ, 632, 191
- Mei et al. (2006) Mei, S., Blakeslee, J. P., Stanford, S. A., et al. 2006, ApJ, 639, 81
- Mei et al. (2022) Mei, S., Hatch, N. A., Amodeo, S., et al. 2022, arXiv e-prints, arXiv:2209.02078
- Mei et al. (2015) Mei, S., Scarlata, C., Pentericci, L., et al. 2015, ApJ, 804, 117
- Merlin et al. (2016) Merlin, E., Bourne, N., Castellano, M., et al. 2016, A&A, 595, A97
- Merlin et al. (2015) Merlin, E., Fontana, A., Ferguson, H. C., et al. 2015, A&A, 582, A15
- Miller et al. (2022) Miller, T. B., van Dokkum, P., & Mowla, L. 2022, arXiv e-prints, arXiv:2207.05895
- Miller et al. (2019) Miller, T. B., van Dokkum, P., Mowla, L., & van der Wel, A. 2019, ApJ, 872, L14
- Moore et al. (1996) Moore, B., Katz, N., Lake, G., Dressler, A., & Oemler, A. 1996, Nature, 379, 613
- Mosleh et al. (2018) Mosleh, M., Tavasoli, S., & Tacchella, S. 2018, ApJ, 861, 101
- Mosleh et al. (2011) Mosleh, M., Williams, R. J., Franx, M., & Kriek, M. 2011, ApJ, 727, 5
- Moster et al. (2018) Moster, B. P., Naab, T., & White, S. D. M. 2018, MNRAS, 477, 1822
- Mowla et al. (2019a) Mowla, L., van der Wel, A., van Dokkum, P., & Miller, T. B. 2019a, ApJ, 872, L13
- Mowla et al. (2019b) Mowla, L. A., van Dokkum, P., Brammer, G. B., et al. 2019b, ApJ, 880, 57
- Muldrew et al. (2015) Muldrew, S. I., Hatch, N. A., & Cooke, E. A. 2015, MNRAS, 452, 2528
- Naab et al. (2009) Naab, T., Johansson, P. H., & Ostriker, J. P. 2009, ApJ, 699, L178
- Nair et al. (2011) Nair, P., van den Bergh, S., & Abraham, R. G. 2011, ApJ, 734, L31
- Nedkova et al. (2021) Nedkova, K. V., Häußler, B., Marchesini, D., et al. 2021, MNRAS, 506, 928
- Newman et al. (2014) Newman, A. B., Ellis, R. S., Andreon, S., et al. 2014, ApJ, 788, 51
- Newman et al. (2012) Newman, A. B., Ellis, R. S., Bundy, K., & Treu, T. 2012, ApJ, 746, 162
- Noirot et al. (2018) Noirot, G., Stern, D., Mei, S., et al. 2018, ApJ, 859, 38
- Noirot et al. (2016) Noirot, G., Vernet, J., De Breuck, C., et al. 2016, ApJ, 830, 90
- Noordeh et al. (2021) Noordeh, E., Canning, R. E. A., Willis, J. P., et al. 2021, MNRAS, 507, 5272
- Papovich et al. (2012) Papovich, C., Bassett, R., Lotz, J. M., et al. 2012, ApJ, 750, 93
- Patel et al. (2017) Patel, S. G., Hong, Y. X., Quadri, R. F., Holden, B. P., & Williams, R. J. 2017, ApJ, 839, 127
- Peng et al. (2002) Peng, C. Y., Ho, L. C., Impey, C. D., & Rix, H.-W. 2002, AJ, 124, 266
- Poggianti et al. (2013) Poggianti, B. M., Calvi, R., Bindoni, D., et al. 2013, ApJ, 762, 77
- Postman et al. (2005) Postman, M., Franx, M., Cross, N. J. G., et al. 2005, ApJ, 623, 721
- Raichoor et al. (2012) Raichoor, A., Mei, S., Stanford, S. A., et al. 2012, ApJ, 745, 130
- Rettura et al. (2010) Rettura, A., Rosati, P., Nonino, M., et al. 2010, ApJ, 709, 512
- Rieke et al. (2004) Rieke, G. H., Young, E. T., Engelbracht, C. W., et al. 2004, ApJS, 154, 25
- Rohr et al. (2022) Rohr, E., Feldmann, R., Bullock, J. S., et al. 2022, MNRAS, 510, 3967
- Saglia et al. (2010) Saglia, R. P., Sánchez-Blázquez, P., Bender, R., et al. 2010, A&A, 524, A6
- Santini et al. (2015) Santini, P., Ferguson, H. C., Fontana, A., et al. 2015, ApJ, 801, 97
- Saracco et al. (2017) Saracco, P., Gargiulo, A., Ciocca, F., & Marchesini, D. 2017, A&A, 597, A122
- Schirmer (2013) Schirmer, M. 2013, ApJS, 209, 21
- Sersic (1968) Sersic, J. L. 1968, Atlas de Galaxias Australes
- Shankar & Bernardi (2009) Shankar, F. & Bernardi, M. 2009, MNRAS, 396, L76
- Shankar et al. (2015) Shankar, F., Buchan, S., Rettura, A., et al. 2015, ApJ, 802, 73
- Shankar et al. (2013) Shankar, F., Marulli, F., Bernardi, M., et al. 2013, MNRAS, 428, 109
- Shankar et al. (2014) Shankar, F., Mei, S., Huertas-Company, M., et al. 2014, MNRAS, 439, 3189
- Sheen et al. (2016) Sheen, Y.-K., Yi, S. K., Ree, C. H., et al. 2016, ApJ, 827, 32
- Sil’chenko et al. (2018) Sil’chenko, O. K., Kniazev, A. Y., & Chudakova, E. M. 2018, AJ, 156, 118
- Socolovsky et al. (2019) Socolovsky, M., Maltby, D. T., Hatch, N. A., et al. 2019, MNRAS, 482, 1640
- Somerville et al. (2018) Somerville, R. S., Behroozi, P., Pandya, V., et al. 2018, MNRAS, 473, 2714
- Strazzullo et al. (2013) Strazzullo, V., Gobat, R., Daddi, E., et al. 2013, ApJ, 772, 118
- Strazzullo et al. (2022) Strazzullo, V., Pannella, M., Mohr, J. J., et al. 2022, arXiv e-prints, arXiv:2212.06853
- Stringer et al. (2014) Stringer, M. J., Shankar, F., Novak, G. S., et al. 2014, MNRAS, 441, 1570
- Suess et al. (2019) Suess, K. A., Kriek, M., Price, S. H., & Barro, G. 2019, ApJ, 877, 103
- Szomoru et al. (2012) Szomoru, D., Franx, M., & van Dokkum, P. G. 2012, ApJ, 749, 121
- Tadaki et al. (2020) Tadaki, K.-i., Belli, S., Burkert, A., et al. 2020, ApJ, 901, 74
- Thomas et al. (2005) Thomas, D., Maraston, C., Bender, R., & Mendes de Oliveira, C. 2005, ApJ, 621, 673
- Trujillo et al. (2011) Trujillo, I., Ferreras, I., & de La Rosa, I. G. 2011, MNRAS, 415, 3903
- Trujillo et al. (2006) Trujillo, I., Förster Schreiber, N. M., Rudnick, G., et al. 2006, ApJ, 650, 18
- Trujillo et al. (2004) Trujillo, I., Rudnick, G., Rix, H.-W., et al. 2004, ApJ, 604, 521
- van den Bosch et al. (2008) van den Bosch, F. C., Aquino, D., Yang, X., et al. 2008, MNRAS, 387, 79
- van der Wel et al. (2012) van der Wel, A., Bell, E. F., Häussler, B., et al. 2012, ApJS, 203, 24
- van der Wel et al. (2014) van der Wel, A., Franx, M., van Dokkum, P. G., et al. 2014, ApJ, 788, 28
- van Dokkum & Franx (1996) van Dokkum, P. G. & Franx, M. 1996, MNRAS, 281, 985
- van Dokkum et al. (2015) van Dokkum, P. G., Nelson, E. J., Franx, M., et al. 2015, ApJ, 813, 23
- Weinmann et al. (2009) Weinmann, S. M., Kauffmann, G., van den Bosch, F. C., et al. 2009, MNRAS, 394, 1213
- Whitaker et al. (2011) Whitaker, K. E., Labbé, I., van Dokkum, P. G., et al. 2011, ApJ, 735, 86
- Wilkinson et al. (2021) Wilkinson, A., Almaini, O., Wild, V., et al. 2021, MNRAS, 504, 4533
- Williams et al. (2009) Williams, R. J., Quadri, R. F., Franx, M., van Dokkum, P., & Labbé, I. 2009, ApJ, 691, 1879
- Wuyts et al. (2007) Wuyts, S., Labbé, I., Franx, M., et al. 2007, ApJ, 655, 51
- Wylezalek et al. (2013) Wylezalek, D., Galametz, A., Stern, D., et al. 2013, ApJ, 769, 79
- Wylezalek et al. (2014) Wylezalek, D., Vernet, J., De Breuck, C., et al. 2014, ApJ, 786, 17
- Yang et al. (2021) Yang, L., Roberts-Borsani, G., Treu, T., et al. 2021, MNRAS, 501, 1028
- Yoon et al. (2017) Yoon, Y., Im, M., & Kim, J.-W. 2017, ApJ, 834, 73
- Zanisi et al. (2021a) Zanisi, L., Shankar, F., Bernardi, M., Mei, S., & Huertas-Company, M. 2021a, MNRAS, 505, L84
- Zanisi et al. (2021b) Zanisi, L., Shankar, F., Fu, H., et al. 2021b, MNRAS, 505, 4555
- Zanisi et al. (2020) Zanisi, L., Shankar, F., Lapi, A., et al. 2020, MNRAS, 492, 1671
- Zhao et al. (2017) Zhao, D., Conselice, C. J., Aragón-Salamanca, A., et al. 2017, MNRAS, 464, 1393
- Zoldan et al. (2019) Zoldan, A., De Lucia, G., Xie, L., Fontanot, F., & Hirschmann, M. 2019, MNRAS, 487, 5649