ifaamas \acmConference[AAMAS ’23]Proc. of the 22nd International Conference on Autonomous Agents and Multiagent Systems (AAMAS 2023)May 29 – June 2, 2023 London, United KingdomA. Ricci, W. Yeoh, N. Agmon, B. An (eds.) \copyrightyear2023 \acmYear2023 \acmDOI \acmPrice \acmISBN \affiliation \institutionPennsylvania State University \cityState College \countryUSA \affiliation \institutionPennsylvania State University \cityState College \countryUSA \affiliation \institutionPennsylvania State University \cityState College \countryUSA \affiliation \institutionPennsylvania State University \cityState College \countryUSA \affiliation \institutionPennsylvania State University \cityState College \countryUSA \affiliation \institutionPennsylvania State University \cityState College \countryUSA \affiliation \institutionPennsylvania State University \cityState College \countryUSA \affiliation \institutionRutgers University \cityNew Jersey \countryUSA \affiliation \institutionPennsylvania State University \cityState College \countryUSA
Artificial prediction markets present a novel opportunity for human-AI collaboration
Abstract.
Despite high-profile successes in the field of Artificial Intelligence, machine-driven technologies still suffer important limitations, particularly for complex tasks where creativity, planning, common sense, intuition, or learning from limited data is required. These limitations motivate effective methods for human-machine collaboration. Our work makes two primary contributions. We thoroughly experiment with an artificial prediction market model to understand the effects of market parameters on model performance for benchmark classification tasks. We then demonstrate, through simulation, the impact of exogenous agents in the market, where these exogenous agents represent primitive human behaviors. This work lays the foundation for a novel set of hybrid human-AI machine learning algorithms.
Key words and phrases:
prediction markets; machine learning; artificial intelligence; human-AI collaboration1. Introduction
A body of work on artificial prediction markets is emerging. These are numerically simulated markets, populated by artificial agents (bot-traders) for the purpose of supervised learning of probability estimators Barbu et al. (2012). While nascent, this literature has demonstrated the plausibility of using a trained market as a supervised learning algorithm, achieving comparable performance to standard approaches on simple classification tasks Barbu et al. (2012); Barbu and Lay (2013); Jahedpari et al. (2014); Nakshatri et al. (2021). In fact, these results are sensible given the deep mathematical connections between prediction markets and learning Chen et al. (2008); Chen and Vaughan (2010); Abernethy et al. (2011).
Like other machine learning algorithms, functioning of an artificial prediction market depends on several researcher-determined parameters: number of agents; liquidity; initial cash; alongside parameters related to training processes. Scenarios in which performance is robust or brittle to these settings is yet unclear. Prior work has observed that artificial markets may suffer from lack of participation Rajtmajer et al. (2022). That is, like their human counterparts in traditional prediction markets, agents may not invest in the market if they do not have sufficient information Arrow et al. (2008); Tetlock (2008); Rothschild and Pennock (2014); in practice, this occurs when an asset representing test data point is too dissimilar to training examples.
In our view, the most promising opportunity afforded by artificial prediction markets is eventual human-AI collaboration – a market framework should theoretically support human traders participating alongside agents to evaluate outcomes. Whether and how artificial prediction markets might benefit from this hybrid scenario is an open question. The work we undertake here provides, through simulation, initial support for this opportunity in the context of a simple artificial market and primitive human behaviors.
Our work is framed by two primary research questions.
RQ1: How does performance of a simple artificial prediction market depend on hyper-parameter selection?
RQ2: What impact does the inclusion of exogenous agents representing simple (human-like) behaviors have on market performance?
Our findings support those of prior recent work indicating the promise of artificial prediction markets for classification tasks. We demonstrate the sensitivity of this approach to hyper-parameter selection and highlight, in particular, the role of liquidity in moderating performance. Finally, we demonstrate the exciting opportunity for hybrid prediction markets to serve as a framework for human-AI collaboration. We suggest that this approach may be particularly valuable in contexts where machine learning falls short (e.g., lack of training data, complex tasks) and potential for human-only approaches is either undesirable or infeasible.
2. Related Work
Our work builds upon and contributes to two primary literatures, namely, work on artificial prediction markets and work in collaborative human-AI technologies.
2.1. Artificial Prediction Markets
Prediction markets are simple futures markets used to aggregate disperse information into efficient forecasts of uncertain future events Wolfers and Zitzewitz (2004); Hanson et al. (2006); Manski (2006); Wolfers and Zitzewitz (2006). Specifically, market participants buy and sell contracts that pay out based on the outcomes of future events. Market prices generated from these contracts can be understood as a collective prediction among market participants. Prediction markets have been successfully used, e.g., for forecasting election outcomes Berg et al. (2008), sports betting Spann and Skiera (2009), forecasting infectious disease activity Polgreen et al. (2007), and aggregating employee wisdom in corporate settings Cowgill et al. (2009); Gillen et al. (2012).
Artificial prediction markets are a variation on this idea, wherein numerically simulated markets populated by trained agents (bot-traders) are used for the purpose of supervised learning of probability estimators Barbu et al. (2012); Barbu and Lay (2013). In initial formulations by Barbu and Lay Lay and Barbu (2010); Barbu et al. (2012); Lay and Barbu (2012), each agent is represented as a budget and a simple betting function. During training, each agent’s budget is updated based on the accuracies of its predictions over a training dataset. Authors found that these markets outperformed standard approaches on benchmark classification and regression tasks. Later, Storkey and colleagues Storkey (2011); Storkey et al. (2012) developed the so-called machine learning market, also for the purpose of classification. In their formulation, each agent purchases contracts in order to maximize a utility function. Most recently, Nakshatri et al. Nakshatri et al. (2021) proposed an artificial prediction market wherein agent purchase logic is defined geometrically, in particular, by a convex semi-algebraic set in feature space. Time varying asset prices affect the structure of the semi-algebraic sets leading to time-varying agent purchase rules. Agent parameters are trained using an evolutionary algorithm. Authors show that their approach has desirable properties, e.g., the market satisfies certain universal approximation properties, and there exist sufficient conditions for convergence. Our work builds on this approach.
Like their human-populated counterparts, artificial prediction markets have found a number of real-world applications Barbu and Lay (2013); Jahedpari et al. (2014). Ongoing theoretical work has offered support for these promising experimental findings, highlighting the mathematical connections between artificial markets and machine learning Chen et al. (2008); Chen and Pennock ([n.d.]); Abernethy et al. (2011); Hu and Storkey (2014).
2.2. Human-AI Collaboration
Despite high-profile successes in the field of Artificial intelligence (AI) He et al. (2015); Brown and Sandholm (2019); Kleinberg et al. (2018); Zhu et al. (2018), machine-driven solutions still suffer important limitations particularly for complex tasks where creativity, common sense, intuition or learning from limited data is required Jarrahi (2018); Lai and Tan (2019); Green and Chen (2019); Li et al. (2016); Kamar (2016); Amershi et al. (2019); Müller-Schloer and Tomforde (2017). Both the promises and challenges of AI have motivated work on human-machine collaboration Dellermann et al. (2021); Wang et al. (2019); Nunes et al. (2015); Puig et al. (2020); Wu et al. (2022). The hope is that we can eventually develop hybrid systems that bring together human intuition and machine rationality to effectively and efficiently tackle today’s grand challenges.
Recent work in hybrid intelligence systems has demonstrated the feasibility and highlighted the potential of integrating human input into AI systems Kamar (2016), or even, of human-AI collaboration Wang et al. (2020). The spectrum of these efforts range from accounting for human factors in technology design Bansal et al. (2019); Canonico et al. (2019); Harper (2019) to efficiently utilizing human inputs for training data Amershi et al. (2014) in applications as diverse as business Nagar and Malone (2011); Sowa et al. (2021), civic welfare Fogliato et al. (2022), criminal justice Travaini et al. (2022), and healthcare Tschandl et al. (2020); Lee et al. (2021); Rajpurkar et al. (2022).
The work we describe here brings together the bodies of prior work on artificial prediction markets and hybrid intelligence, proposing hybrid prediction markets for direct integration of human wisdom into the deployment of a machine learning algorithm.
3. Data
We consider three classification tasks. The first two are benchmark tasks used broadly to compare performance of machine learning algorithms. The third is the task of classifying scientific research outcomes as replicable or not replicable – a challenging, complex task on which both machine learning algorithms Altmejd et al. (2019); Yang et al. (2020); Pawel and Held (2020); Wu et al. (2021) and human assessment Dreber et al. (2015); Camerer et al. (2016, 2018); Forsell et al. (2019); Gordon et al. (2020); Gordon et al. (2021) have achieved respectable but not excellent performance. The replication prediction task, we suggest, is an example of the type of problem well-suited to hybrid human-AI approaches.
3.1. Benchmark Machine Learning Datasets
The Iris dataset Fisher (1988) was one the earliest datasets used for evaluation of classification methodologies. The dataset contains three classes of instances each, where each class refers to a type of iris plant. One class is linearly separable from the others; the latter are not linearly separable from one another. For evaluation using the binary market, we have combined the latter two classes (iris virginica and iris versicolor). Prior approaches for classification of the Iris dataset based on support vector classification Mohan et al. (2020), random forest classification Mishina et al. (2015); Chicho et al. (2021), and logisitc regression Pinto et al. (2018) have reported or near- accuracy on the task.
In addition to the Iris dataset, we consider the Heart Disease dataset Janosi et al. (1988). The Heart Disease dataset is also a multivariate dataset used for benchmark classification algorithms. Fourteen patient attributes are used to predict presence or absence of heart disease. Random forest Singh et al. (2016), Xgboost Rajadevi et al. (2021), and logistic regression Desai et al. (2019) achieve performance just under accuracy. While, support vector classification achieves Rajadevi et al. (2021).
3.2. Replication Studies Outcomes
In the last decade, several large-scale replication projects have been undertaken across psychology, economics, political science, cancer biology and other domains Open Science Collaboration (2015); Camerer et al. (2016, 2018); Klein et al. (2014); Klein et al. (2018); Cova et al. (2021); Errington et al. (2014). Amongst their important impacts, these studies have created small ground-truth datasets of replication studies outcomes that can be used for train and test of automated approaches for replication prediction. Specifically, we use the dataset and extracted features considered by Rajtmajer et al. (2022) for ease of comparison. The dataset containes 192 findings in the social and behavioral sciences, each labeled either Replicable or Not Replicable, and a set of 41 features extracted from each associated paper representing biblometric, venue-related, author-related, statistical and semantic information. See Wu et al. (2021) for further detail on feature extraction processes.
Of note, authors in Rajtmajer et al. (2022) achieve accuracy, remarkable for the task of replication prediction. However, accuracy is calculated based on the approximately one-third of the test data that gets evaluated by the market. Because agent participation is voluntary and agents do not participate if they do not have sufficient information about a test point, some (or much) of the data can be left unclassified. Our work uses the same data and market structure described in Rajtmajer et al. (2022). This allows us to explore the effects of hyper-parameters (RQ1) and the inclusion of exogenous agents (RQ2) on these performance/participation trade-offs.
4. Prediction Market Model
We use as a base model the artificial binary prediction market described in Nakshatri et al. (2021). The state of the prediction market is defined by a pair of integers giving the number of units of the two asset classes that have been sold. For simplicity we refer to the assets as and . Traders are agents who buy assets and using policies . Also following Nakshatri et al. (2021), we assume for simplicity that agents cannot sell. If agent purchase policy is conditioned on exogenous information then, and agent purchases units of and units of , thus causing a state update. In what follows, we assume that agents specialize in the purchase of either Asset or Asset so that if , then .
Asset prices are computed using a logarithmic market scoring rule (LMSR):
This is the softmax function of . Liquidity adjusts the price change given a change in asset quantities Lekwijit and Sutivong (2018). The fact that prices vary as a function of ensures that the policy need not take spot price into consideration explicitly. It is often more convenient to work in units of as can become arbitrarily close to zero. Experimental results are therefore reported for this quantity as the liquidity factor.
To start the market, all agents may purchase assets at time . After this, we assume that agents arrive at the market with arrival rate and inter-arrival time governed by an exponential distribution. This allows us to avoid scenarios in the hybrid setting where the synthetic traders swamp the market.
The LMSR imposes a market maker price, so that actual trade costs are given by:
Here is the cost to a trader for purchasing units of Asset (with at time . For small values of (large values of ) the cost of purchase approaches the spot-price Nakshatri et al. (2021).
Agent purchase logic is governed by a time-varying bank value and a characteristic function to reason about information and its decision to buy an asset in class is governed by:
| (1) |
Here is a sigmoid function and is the unit step function defined as at . The expression defines the value Agent places on Asset as a function of the market state (and hence spot-prices) and the information in the external information . If Agent places more value on Asset than its present price , then and just in case the agent has sufficient funds given by . That is, Agent purchases a share of Asset . Notice we are assume that agents may buy one share of an asset at a time. This both simplifies the agent logic and also would prevent the agents from out-competing humans in the market in the hybrid scenario. The vector is a set of parameters that define the specific outputs of and thus affect the agent purchase logic.
Let be the (matrix) of all parameter vectors for the agents. After running for time units with input information , the spot price for Asset is . If we are given input information with class information , then training the market is the process of solving:
This problem is solved in Nakshatri et al. (2021) using a genetic algorithm to obtain a market that can classify external information .
At the close of the market, the price of a each asset is taken as a proxy for the market’s confidence in the corresponding outcome. In our binary market model, there are two mutually exclusive possible outcomes and so the (normalized) prices should sum to . In this way, the market can be used for regression or classification. In the three examples we consider here, the market is used for classification. A separate market is run for each point in the test set and the asset with the higher price is considered the market’s classification decision for that test point.
We note, critically, that based on this model, agent participation is voluntary and decision to participate is driven by from Equation 1. If this condition is not met during the course of the market for any agents, there will be no market activity and thus no classification decision for that test point. Authors in Rajtmajer et al. (2022) have noted that this may occur frequently, particularly in cases where the training data set is small or points in the test set are significant different from training the data. Accordingly, we calculate accuracy and F1 based on the scored subset of the data, while also reporting the percentage of scored test data as a performance metric.
The artificial prediction market includes five hyper-parameters that are not optimized by the genetic algorithm discussed in Nakshatri et al. (2021):
-
(1)
Agent inter-arrival rate ();
-
(2)
Agent initial bank value ();
-
(3)
Market liquidity ();
-
(4)
Simulation running time () or duration;
-
(5)
Number of generations in the genetic (training) algorithm.
As such, these parameters are researcher-determined and warrant further study (RQ1). Our first set of experiments, described below, explore the specific roles of agent inter-arrival rate (), agent initial bank value () (or, “cash”), and market liquidity () on performance. We explore the robustness of performance to selection of these hyper-parameters, highlighting accuracy and F1 score but also trade-offs with agent participation.
In experiments that follow, the genetic algorithm is trained over five generations. The objective function of the genetic algorithm maximizes root mean square error of the estimated score. Agent performance is evaluated based on profit; nonprofitable agents are deleted from the pool. The ten most profitable agents are retained and, amongst them, the seven most profitable agents are selected for mutation and crossover.
5. Experimental Design
The following experiments support the two primary research questions we have put forward. First, we capture the effects of different combinations of hyper-parameters on market performance (RQ1). Second, we explore the impact of exogenous agents not trained through the evolutionary training process, but rather who adopt one of a set of three simple purchasing rules meant to represent primitive human inputs (RQ2).
5.1. Market robustness to hyper-parameters
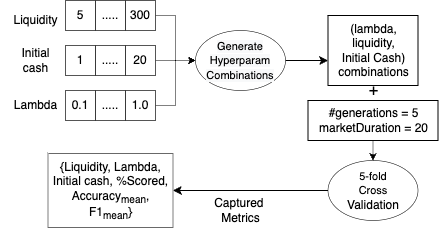
We study the effects of inter-arrival rate , agent initial bank value (or, “cash”), and market liquidity factor on artificial market performance. As mentioned, number of generations is fixed at five during training; while, market duration is fixed at 20. These parameters were fixed (vs. manipulated) to avoid combinatorial complexity during this initial study; however, they should be further studied in future work. In practice, we have found these values to be sufficient for market behavior to converge while also offering reasonable run time. Liquidity factor is tested for the set of values . Initial cash is tested for ; is tested for . Our experiments consider all combinations of these hyper-parameter values, total, and measure corresponding performance in terms of accuracy, F1 score, and percentage of scored test points. Performance for each hyper-parameter set is determined based on 5-fold cross validation with 80/20 train/test splits and performance metrics are averaged over the folds. From these outcomes, we select best and worst-performing hyper-parameter sets to be used for downstream analyses. This process is outlined in Figure 1.
5.2. Market behavior with exogenous agents
We introduce three classes of exogenous agents representing simple, fundamental behaviors which operate fully separate from the agent logic and feature-based training protocol used for the other agents in the market. These classes of behavior are intended to represent behavioral primitives that, in combination, would underlie the actions of human participants in a hybrid scenario. The first, ground truth agents (GT) have perfect knowledge of the correct outcome and always buy contracts corresponding to the correct outcome whenever they have the opportunity to participate (which is moderated by their arrival rate, ). The second are ground truth inverse agents (GTinv). These agents also know the correct outcome but always buy contracts corresponding to the incorrect outcome whenever they have an opportunity to participate. This scenario is equivalent to the case where agents are simply certain but incorrect in their forecast. Finally, our third class of agents are random agents which purchase contracts corresponding to one or the other outcome randomly. Understanding that the decisions of human participants in the hybrid prediction market would not fall squarely into these three categories, these simulations are intended to draw initial boundaries around the impacts human participants might have on the performance of an artificial market depending on the complexity of the task, e.g., there are some tasks which are very easy for humans but difficult for algorithms wherein we would expect near-perfect performance from human participants.
Our experiments measure impact of exogenous agents on market performance measured, as before, by accuracy, F1 score, and percentage of scored test points. Because exogenous agents are not trained, they are not subject to the genetic algorithm. Rather, exogenous agents are added directly to the agent pool during test. We test the impact of adding varying number of agents from each class. We specify this number based on percentage of the total agent pool. Specifically, we test hybrid market performance with the inclusion of GT and GTinv agents. We test hybrid market performance with the inclusion of random agents accounting for of the total agent pool. Random agents are included at a higher rate given the comparatively lesser impact they have on asset prices. All RQ2 experiments are run with an 80/20 train/test split. This process is diagrammed in Supplemental Materials.
All experiments with exogenous agents are based on the third of the three datasets studied in RQ1 for hyper-parameter assessment, namely, the replication outcomes data. This is the type of task where would expect the greatest gain from human-AI collaboration. Namely, this is an extremely challenging task for which (1) neither machine learning nor human judgement alone is likely to guarantee satisfactory performance, and for which (2) algorithmic and human assessments likely consider very different information/feature sets.
6. Results
Following, we detail experimental findings in support of RQ1 and RQ2, respectively.
6.1. Market robustness to hyper-parameters
Market robustness to hyper-parameter settings is explored for the Iris and Heart Disease benchmark classification tasks, and for the prediction of replication studies outcomes. These experiments offer the opportunity to compare/contrast the impact of hyper-parameters across three contexts.
6.1.1. Iris classification
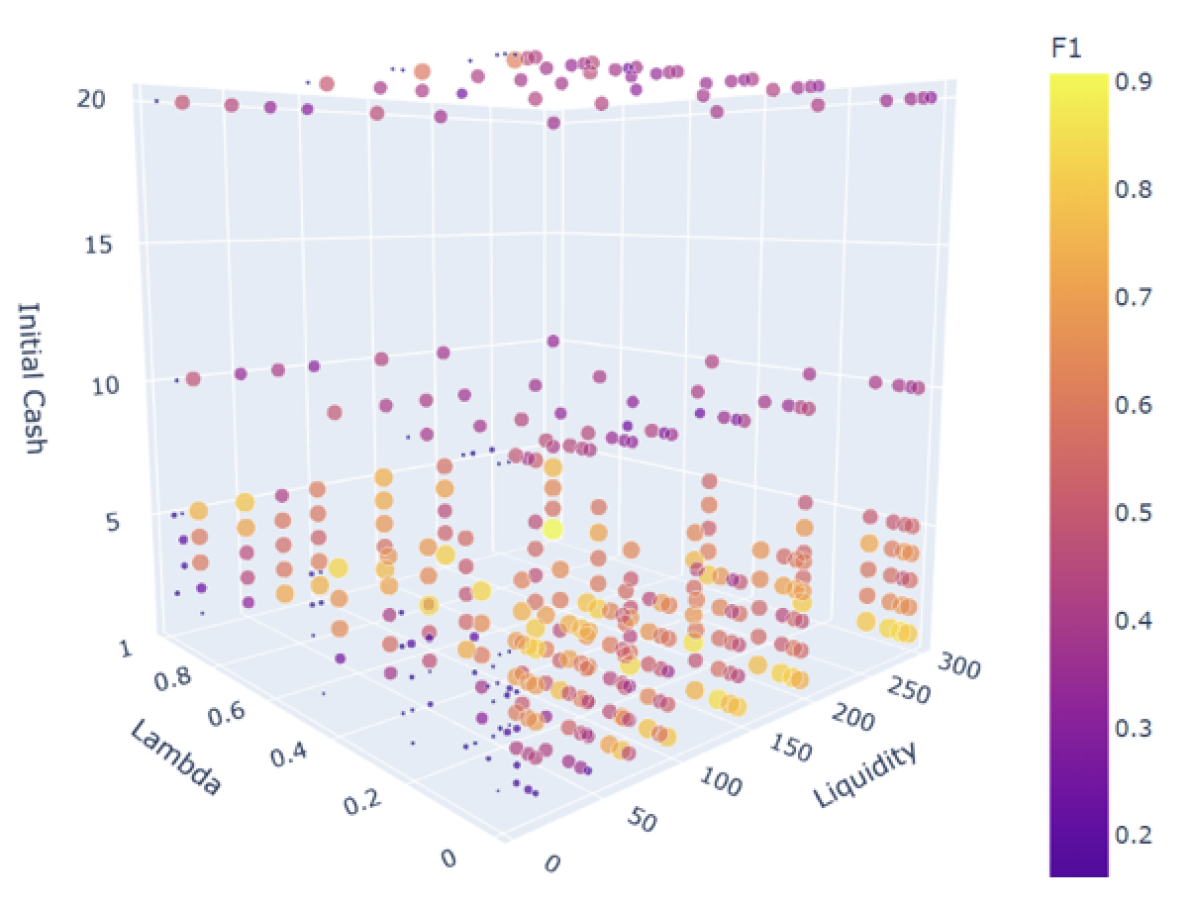
Figure 2 highlights average F1 score over combinations of initial cash, , and liquidity factor. Generally, better F1 scores are obtained when initial cash ranges between and and when liquidity is greater than . Choice of does not appear to significantly impact F1 score. Best F1 of 0.91 is achieved for {liquidity factor , , initial cash }. In this setting, accuracy is and of the data is scored.
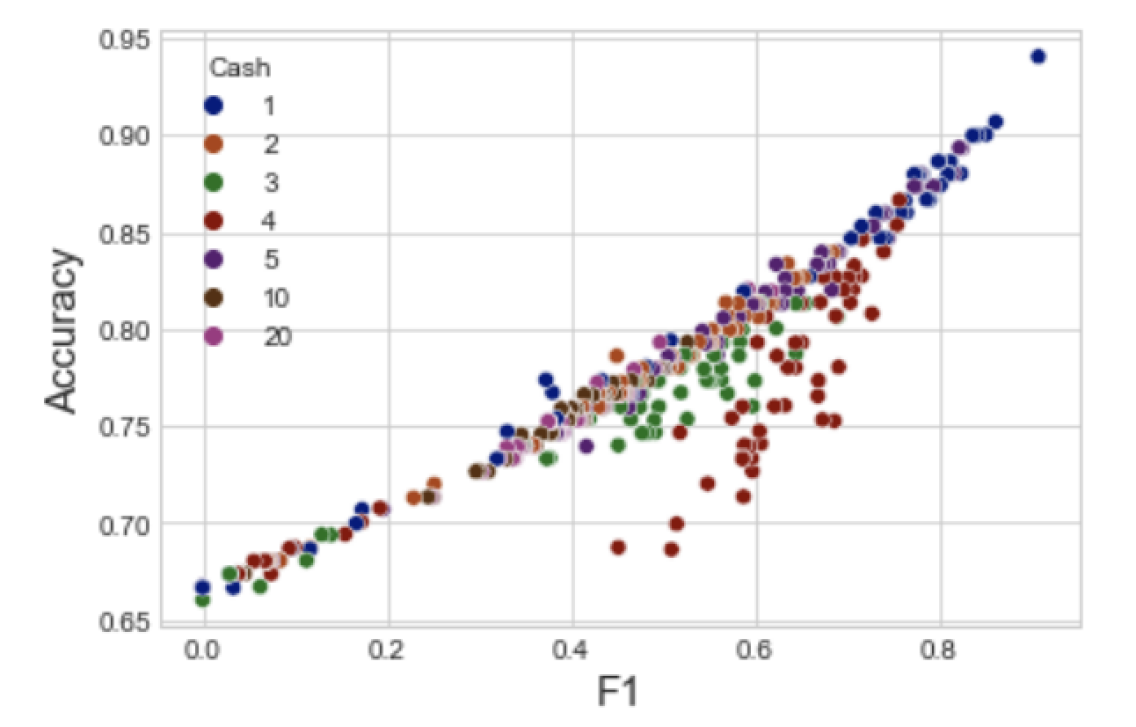
Tables and 1, 2, and 3 report market performance holding each one of the three hyper-parameters fixed and varying the other two. Performance metrics are averaged over folds. The data suggests that market performance increases as liquidity increases and decreases with initial cash. While, the effect of reveals no clear pattern. Figure 3 shows F1 vs. accuracy for different values of initial cash. F1 score increases with accuracy and best performance for both is achieved when initial cash is . Similar plots of F1 vs. accuracy for liquidity and are provided in Supplemental Materials.
| Cash | Liquidity | Accuracy | F1 | Scored % | |
|---|---|---|---|---|---|
| 1 | 300 | 1.0 | 0.94 | 0.91 | 100 |
| 2 | 300 | 1.0 | 0.81 | 0.58 | 100 |
| 3 | 300 | 1.0 | 0.81 | 0.64 | 100 |
| 4 | 300 | 1.0 | 0.87 | 0.76 | 100 |
| 5 | 300 | 1.0 | 0.76 | 0.42 | 100 |
| 10 | 300 | 1.0 | 0.75 | 0.35 | 100 |
| 20 | 300 | 1.0 | 0.75 | 0.37 | 100 |
| Liquidity | Cash | Accuracy | F1 | Scored % | |
|---|---|---|---|---|---|
| 0.010 | 300 | 1 | 0.87 | 0.79 | 100 |
| 0.025 | 300 | 1 | 0.91 | 0.86 | 100 |
| 0.050 | 300 | 1 | 0.88 | 0.82 | 100 |
| 0.100 | 300 | 1 | 0.87 | 0.79 | 100 |
| 0.250 | 300 | 1 | 0.87 | 0.80 | 100 |
| 0.500 | 300 | 1 | 0.87 | 0.78 | 100 |
| 1.000 | 300 | 1 | 0.94 | 0.91 | 100 |
| Liquidity | Cash | Accuracy | F1 | Scored % | |
|---|---|---|---|---|---|
| 5 | 1.0 | 1 | 0.67 | 0.00 | 100 |
| 10 | 1.0 | 1 | 0.67 | 0.00 | 100 |
| 20 | 1.0 | 1 | 0.67 | 0.03 | 100 |
| 50 | 1.0 | 1 | 0.75 | 0.33 | 100 |
| 75 | 1.0 | 1 | 0.85 | 0.72 | 100 |
| 100 | 1.0 | 1 | 0.86 | 0.74 | 100 |
| 150 | 1.0 | 1 | 0.86 | 0.76 | 100 |
| 200 | 1.0 | 1 | 0.88 | 0.81 | 100 |
| 300 | 1.0 | 1 | 0.94 | 0.91 | 100 |
6.1.2. Heart Disease classification
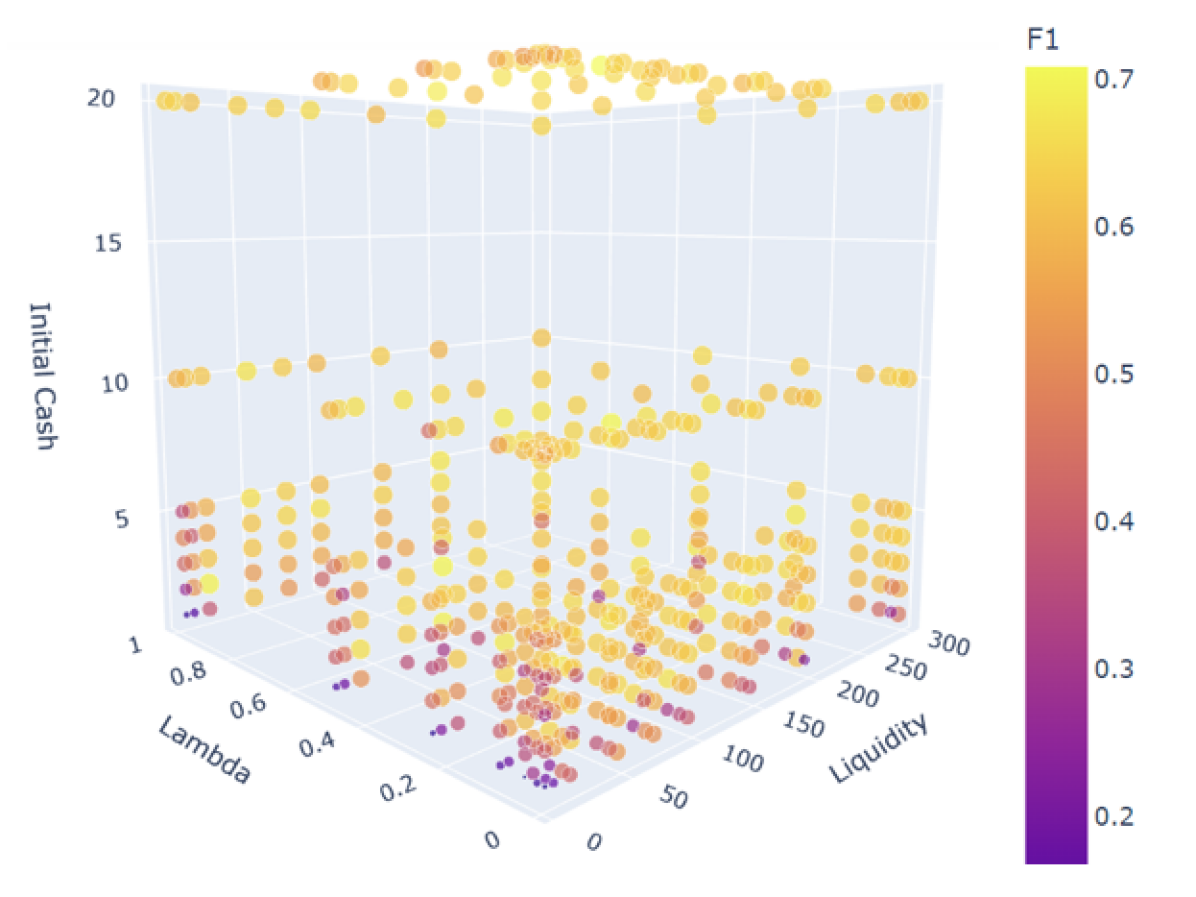
Figure 4 shows average F1 score for all hyper-parameter combinations. Performance is generally poorer than for the Iris classification task, and there is also not as clear a region of best performance in hyper-parameter space. Highest F1 of 0.71 is achieved for (liquidity factor , , initial cash ). In this setting, accuracy is and of the data is scored (exactly one test point is left unscored by the market).
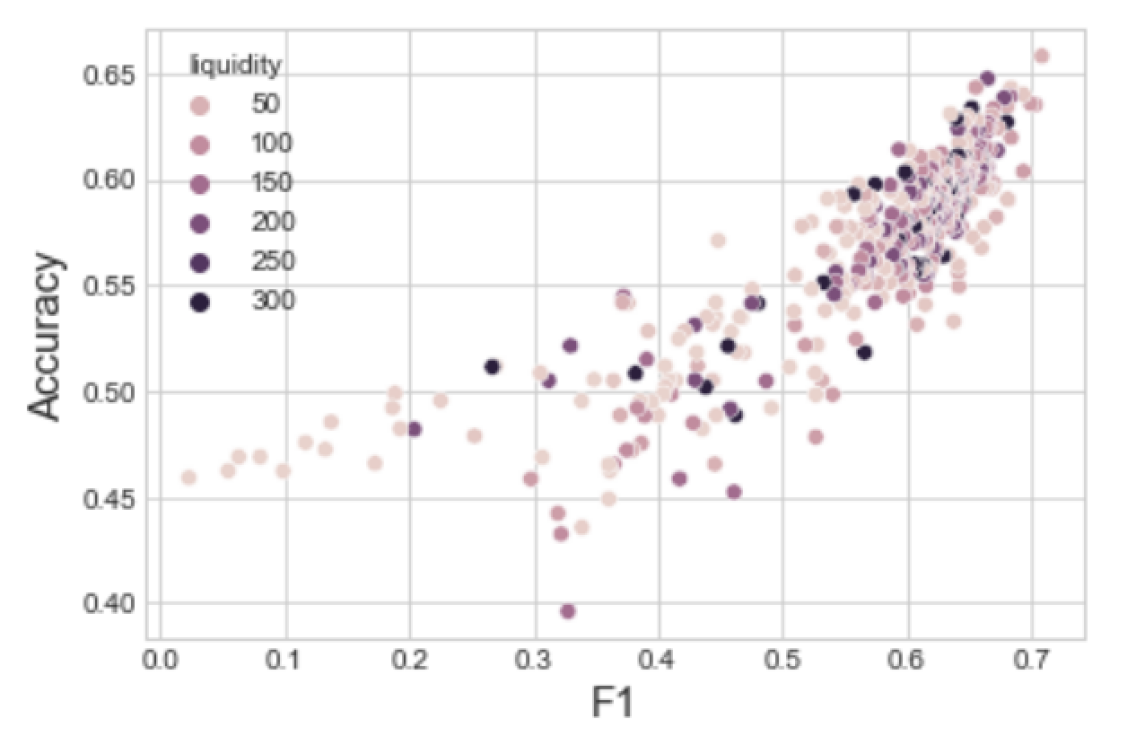
As above, we report performance for varying liquidity in Table 4, holding and cash fixed. Similar tables are provided for varying and cash in Supplemental Materials, as are plots of F1 vs. accuracy for , cash and liquidity. Similar to our finding on the Iris dataset, liquidity appears to be the primary driver of performance gains and losses on the Heart Disease classification task. Figure 5 shows the average F1 vs. accuracy for all the combinations from where we took subsets to show more in-depth impact of liquidity.
Of note, despite modest F1 and accuracy scores for this task, the percentage of scored test points is very high. This stands in contrast to results on the replication prediction task which follows. In other words, agents in this case are sufficiently confident (have learned from sufficiently similar points in the training dataset) to invest. However, they are incorrect. While, in the replication prediction task which follows, agents are not sufficiently confident and do not invest – i.e., they “know what they don’t know”.
| Liquidity | Cash | Accuracy | F1 | Scored % | |
|---|---|---|---|---|---|
| 5 | 0.05 | 20 | 0.59 | 0.54 | 100 |
| 10 | 0.05 | 20 | 0.54 | 0.56 | 99.67 |
| 20 | 0.05 | 20 | 0.60 | 0.66 | 99.01 |
| 50 | 0.05 | 20 | 0.66 | 0.71 | 99.67 |
| 75 | 0.05 | 20 | 0.61 | 0.64 | 99.67 |
| 100 | 0.05 | 20 | 0.58 | 0.62 | 99.34 |
| 150 | 0.05 | 20 | 0.58 | 0.59 | 99.01 |
| 200 | 0.05 | 20 | 0.57 | 0.62 | 99.34 |
| 300 | 0.05 | 20 | 0.59 | 0.61 | 99.34 |
6.1.3. Replication outcomes prediction
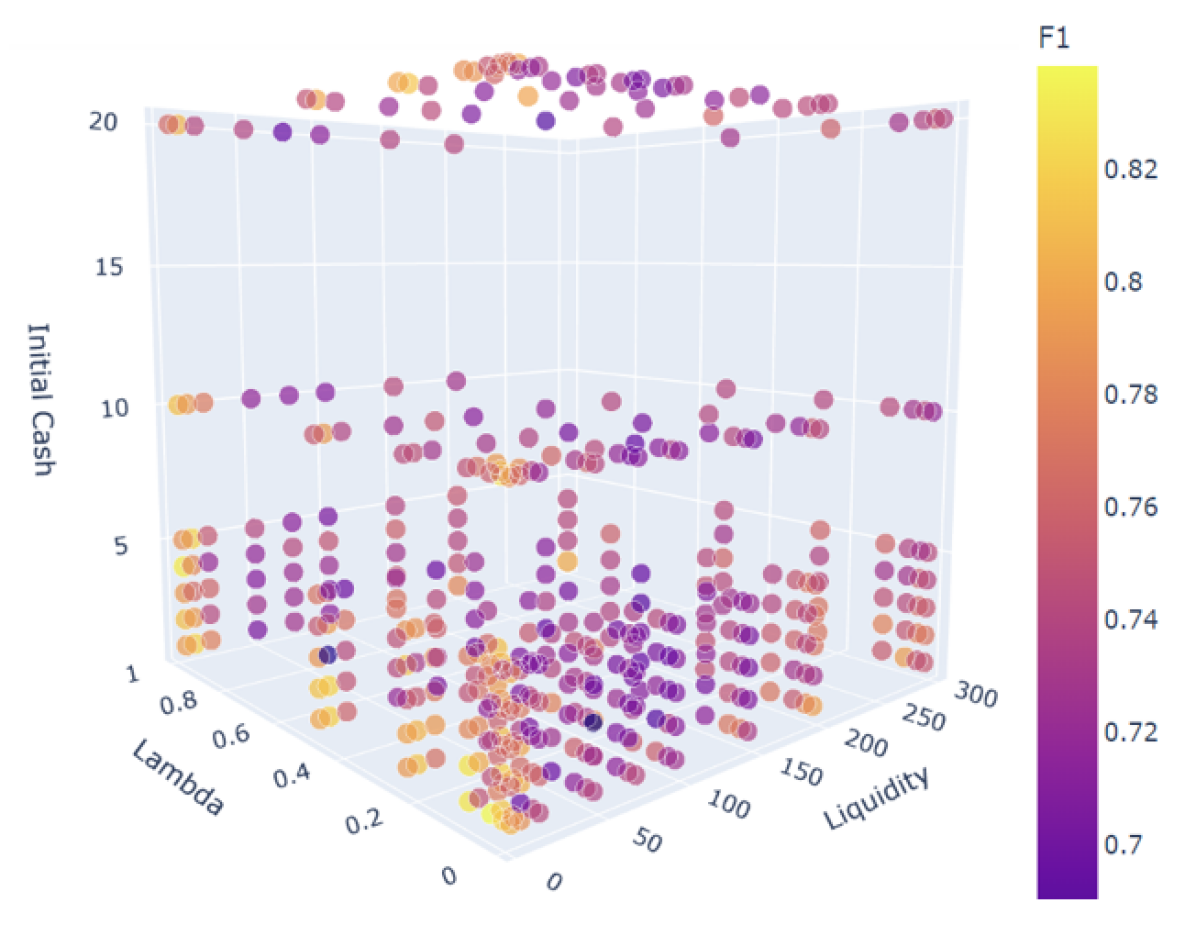
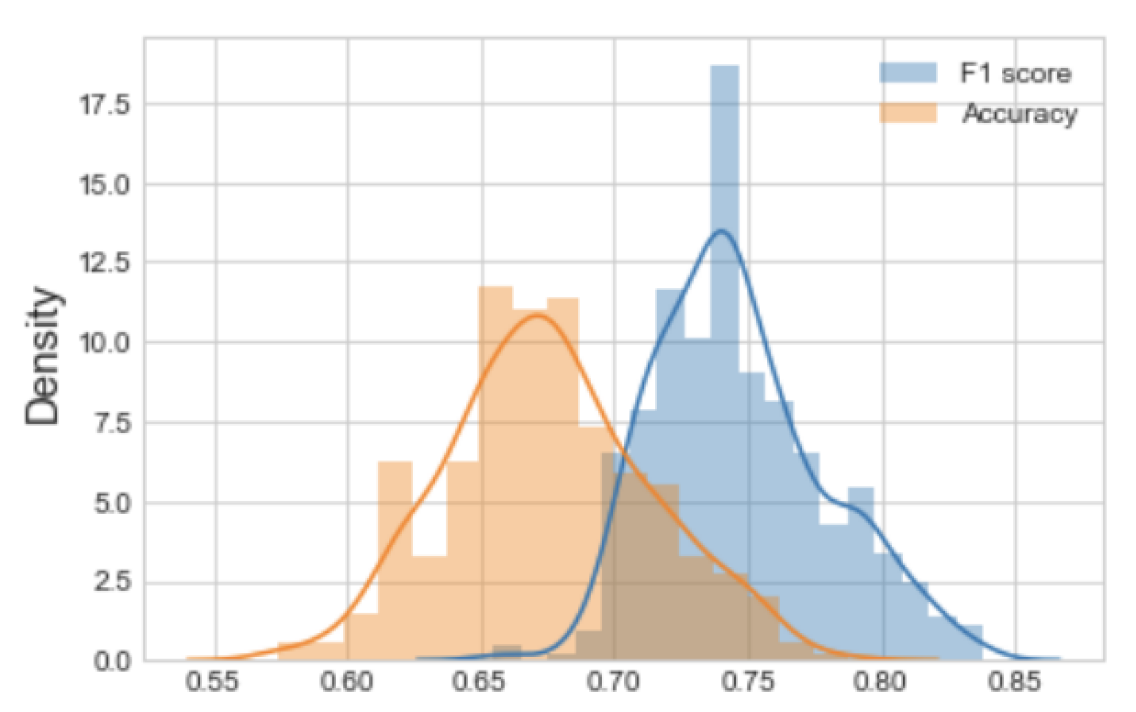
Finally, we explore the impact of hyper-parameter selection in the context of replication outcomes prediction. Figure 6 gives average F1 scores over all hyper-parameter combinations. Best F1 of 0.84 is achieved for {liquidity factor , , initial cash }. In this setting, accuracy is and of the test data is scored. Figure 7 provides another view of this data via the density plot of F1 and accuracy scores, across all hyper-parameter sets. Tables detailing F1, accuracy and percentage of scored test points, varying individual hyper-parameters, are provided in Supplemental Materials.
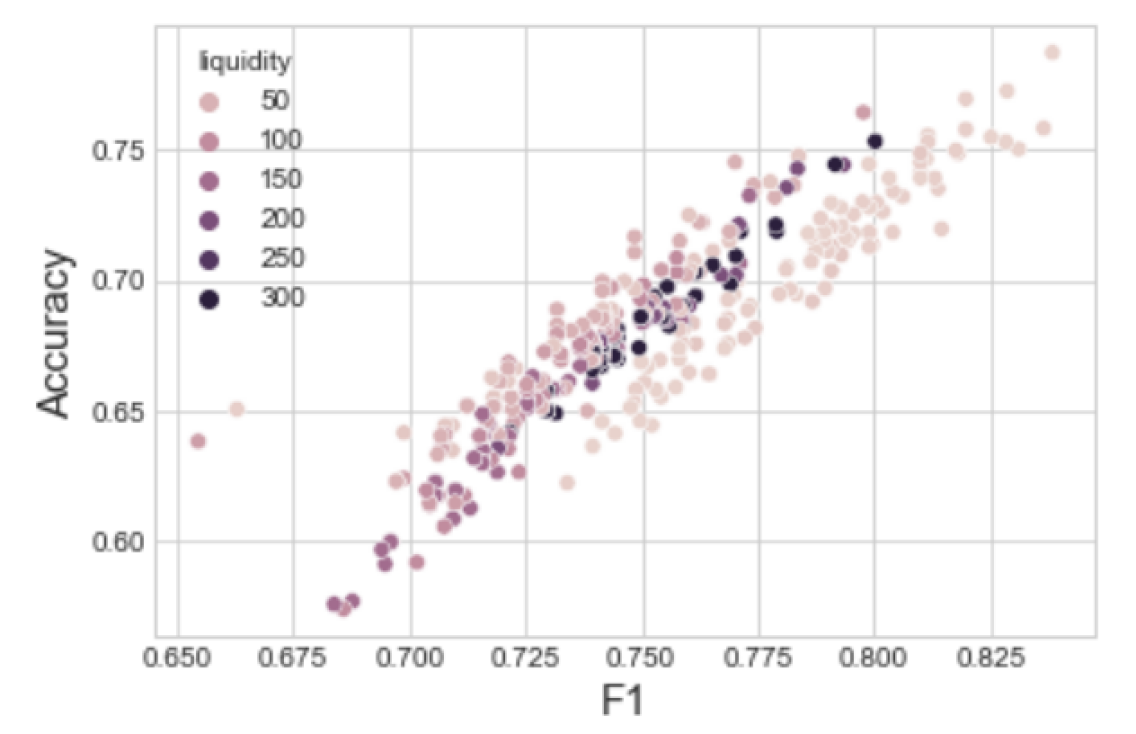
Figure 8 shows the average F1 vs. accuracy scores on the replication prediction task, for varying liquidity. As was the case with both benchmark classification tasks, liquidity appears to drive performance here too. In this case, market performance improves as liquidity factor decreases. While, there are no clear best and worst-performing values for initial cash and . Supporting plots are shared in Supplemental Materials.
| Liquidity | #Agents | Cash | #Agents | #Agents | |
|---|---|---|---|---|---|
| 5 | 24.49 | 1 | 35.39 | 0.01 | 35.08 |
| 10 | 26.15 | 2 | 35.87 | 0.025 | 34.93 |
| 20 | 29.13 | 3 | 35.22 | 0.05 | 35.06 |
| 50 | 35.43 | 4 | 34.96 | 0.1 | 35.13 |
| 75 | 37.48 | 5 | 34.79 | 0.25 | 35.18 |
| 100 | 38.88 | 10 | 34.90 | 0.5 | 35.06 |
| 150 | 40.57 | 20 | 34.73 | 1 | 35.41 |
| 200 | 41.51 | - | - | - | - |
| 300 | 42.45 | - | - | - | - |
As noted, the artificial prediction market algorithm struggles with agent participation on the replication prediction task. The hyper-parameter set associated with highest F1 score leaves of the data unscored. In fact, all except two hyper-parameter combinations leave more than of the test data unscored (see Supplemental Materials). Liquidity factor here too appears to play a critical role. Table 5 provides the average number of participating agents per market, for fixed values of each hyper-parameter. Liquidity has the greatest impact on participation. Liquidity controls the magnitude of shifts in asset price with each buy/sell. Agents’ participation depends on movements in asset price, and as such, this behavior is in line with expectations.
6.2. Market behavior with exogenous agents
Our experiments in support of RQ2 introduce simulated, exogenous agents representing ground truth (GT), ground truth inverse (GTinv), and random behavioral primitives into the market. These additional agents operate outside of the training process and, as such, represent complementary actions that may underlie simple human participant inputs. Exogenous agents are introduced into the general agent pool and are subject to the same arrival rate, , as trained agents.
| Liquidity | Cash | F1 | Accuracy | Scored % | |
|---|---|---|---|---|---|
| 5 | 0.05 | 1 | 0.84 | 0.79 | 36 |
| 10 | 0.05 | 10 | 0.84 | 0.76 | 35 |
| 5 | 1 | 4 | 0.83 | 0.75 | 37 |
| 5 | 0.1 | 1 | 0.83 | 0.77 | 36 |
| 5 | 0.1 | 2 | 0.83 | 0.75 | 37 |
| 150 | 0.25 | 4 | 0.69 | 0.58 | 35 |
| 100 | 0.05 | 2 | 0.68 | 0.0.57 | 35 |
| 150 | 0.5 | 20 | 0.68 | 0.58 | 35 |
| 10 | 0.5 | 3 | 0.65 | 0.66 | 55 |
| 75 | 0.1 | 2 | 0.64 | 0.65 | 52 |
Our simulations with exogenous agents are run over the replication prediction task as baseline. In particular, we consider the five best- and five worst-performing hyper-parameter settings, sorted by F1 score (Table 6). We use these markets as baselines to study the impacts on performance of including GT, GTinv and random agents into the market. Changes to F1 scores after the introduction of each of the three exogenous agent populations, in varying amounts, into the replication prediction markets are detailed in Table 7. Gains in accuracy follow similarly, see Supplemental Materials.
| None | GT 0.1% | GT 0.5% | GT 1% | GTinv 0.1% | GTinv 0.5% | GTinv 1% | Random 1% | Random 5% | Random 10% | Random 50% |
|---|---|---|---|---|---|---|---|---|---|---|
| 0.84 | 0.93 | 1 | 1 | 0.34 | 0.23 | 0.09 | 0.79 | 0.81 | 0.80 | 0.82 |
| 0.84 | 0.91 | 0.96 | 0.97 | 0.34 | 0.31 | 0.28 | 0.74 | 0.76 | 0.75 | 0.75 |
| 0.83 | 0.94 | 1 | 1 | 0.32 | 0.25 | 0.06 | 0.79 | 0.81 | 0.83 | 0.78 |
| 0.83 | 0.90 | 0.95 | 0.99 | 0.33 | 0.28 | 0.24 | 0.76 | 0.74 | 0.82 | 0.77 |
| 0.83 | 0.88 | 0.91 | 0.94 | 0.33 | 0.32 | 0.29 | 0.75 | 0.77 | 0.79 | 0.73 |
| 0.69 | 0.89 | 0.94 | 0.96 | 0.34 | 0.31 | 0.28 | 0.76 | 0.77 | 0.81 | 0.77 |
| 0.69 | 0.91 | 0.97 | 0.96 | 0.34 | 0.29 | 0.29 | 0.78 | 0.77 | 0.77 | 0.78 |
| 0.68 | 0.90 | 0.95 | 0.96 | 0.33 | 0.29 | 0.29 | 0.78 | 0.78 | 0.79 | 0.76 |
| 0.66 | 0.89 | 0.90 | 0.94 | 0.33 | 0.33 | 0.29 | 0.76 | 0.76 | 0.79 | 0.74 |
| 0.65 | 0.90 | 0.91 | 0.94 | 0.34 | 0.32 | 0.30 | 0.77 | 0.75 | 0.81 | 0.74 |
6.2.1. Introduction of GT agents into the agent pool
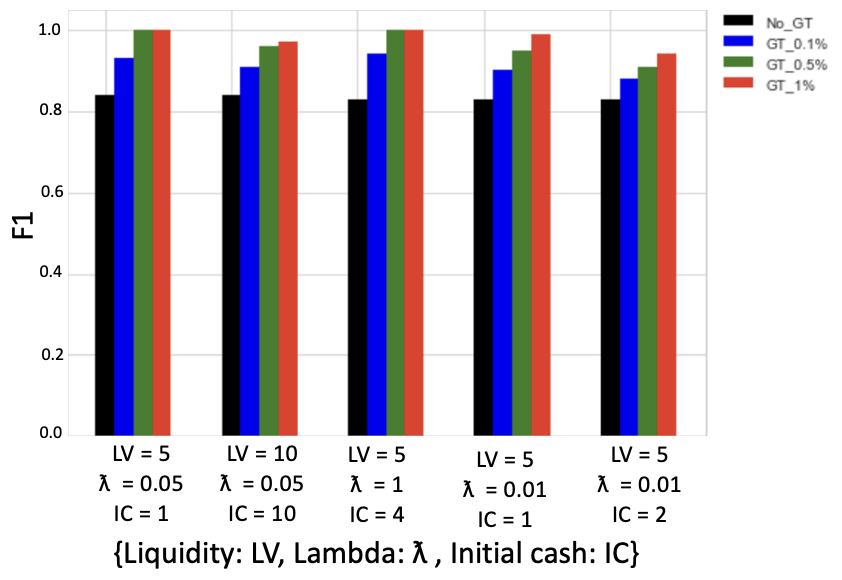
Notably, the inclusion of even a very small population of GT agents improves market performance substantially. Figure 9 shows the incremental improvements in F1 score derived with as little as GT agents, i.e., GT agent for each trained agents in the pool, for each of the five best hyper-parameter settings from the baseline replication outcomes experiments. Inclusion of GT agents brings F1 up to in two cases of the five, and over in all five.
| None | GT | GT | GT | GTinv | GTinv | GTinv |
|---|---|---|---|---|---|---|
| 0.1% | 0.5% | 1% | 0.1% | 0.5% | 1% | |
| 28.35 | 31.33 | 32.21 | 36.91 | 29.54 | 37.06 | 46.79 |
| 22.62 | 25.97 | 29.42 | 36.82 | 25.07 | 31.11 | 37.82 |
| 23.66 | 22.93 | 29.98 | 35.39 | 27.08 | 32.16 | 36.54 |
| 28.56 | 30.63 | 36.16 | 37.90 | 28.17 | 35.64 | 48.34 |
| 24.70 | 27.51 | 31.99 | 34.64 | 28.04 | 33.67 | 44.20 |
| 41.12 | 44.56 | 47.82 | 52.02 | 42.80 | 44.23 | 53.81 |
| 40.01 | 39.89 | 43.83 | 48.46 | 41.27 | 42.57 | 51.36 |
| 41.90 | 42.06 | 46.83 | 51.55 | 42.88 | 45.02 | 51.24 |
| 26.93 | 28.02 | 29.56 | 35.72 | 28.17 | 34.77 | 41.71 |
| 44.47 | 37.49 | 40.50 | 46.66 | 38.66 | 42.20 | 49.84 |
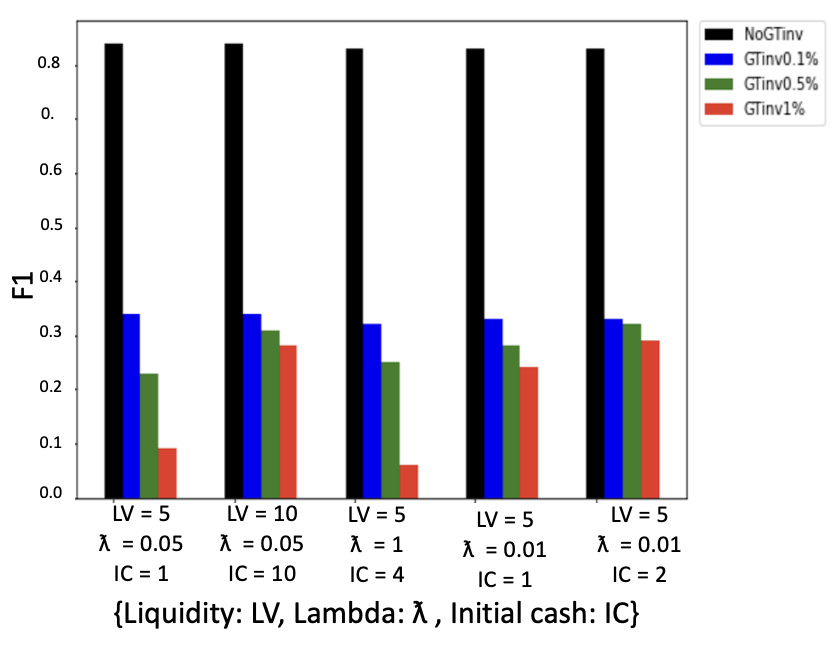
6.2.2. Introduction of GTinv agents into the agent pool
The introduction of GTinv agents into the agent pool has even greater impact on F1, see Figure 10. The addition of just 0.1% GTinv agents drops average F1 below 0.35 for all markets. While, inclusion of 1% GTinv agents brings the best-performing baseline market from F1 of 0.84 to F1 of 0.09.
The significant impact of very small numbers of GT and GTinv agents has important implications for the promise of future hybrid prediction markets with human participants. For a task which a human participant would very likely perform accurately but for which scaling is a concern, for example, this suggests that a trained, artificial prediction market might perform very well with minimal human input.
6.2.3. Introduction of random agents into the agent pool
Finally, and as an additional baseline, we experiment with the inclusion of agents who randomly buy and sell assets corresponding to future outcomes into the artifical prediction market framework. Because the impact of these agents is relatively lesser in magnitude than that of GT and GTinv agents, we experiment with adding more of them into the agent pool. In all cases, the inclusion of exogenous random agents into the agent pool degrades performance. However, in many cases, the change in performance is modest. These results are detailed in Supplemental Materials.
6.2.4. Impact of exogenous agents on (trained) agent participation
The inclusion of exogeneous agents into the agent pool has impact beyond their own asset purchases. The investments of exogeneous agents in the market drives asset prices above and/or beyond where they were in the baseline case, and in doing so, has the impact of increasing participation amongst the trained agents in the pool. Table 8 gives the average number of participating trained agents, for each of the markets under study in RQ2, for each experimental condition. These trends are visualized in additional plots in Supplemental Materials. We note that increased participation is similarly observed for inclusion of GT and GTinv agents. Given the losses in F1 and accuracy when GTinv agents are present, it is clear that increased participation of trained agents is not necessarily a goal. However, these findings highlight the possible impacts, both good and bad, of participation exogenous to the trained artificial market.
7. Conclusions
The comprehensive study of a simple artificial prediction market we undertake here highlights a promising new machine learning algorithm, which achieves respectable performance on benchmark machine learning tasks but which, we argue, affords unique opportunities for human-AI collaboration.
The performance of this very simple, initial market model is encouraging. There is likely great room for improvement: other agent training schemes may be more efficient that the genetic algorithm; more sophisticated agent logic can likely be devised; agents need not be homogeneous - rather, specialized agents populations may be trained with different and complementary expertise. These improvements, building on an already-functional baseline algorithm, may offer new avenues of creative artificial intelligence.
Beyond the potential of an artificial prediction market as an AI, future work should take the next step and introduce human participants into a hybrid prediction market model. This process will require research into best mechanisms and practices for human-agent collaboration in the context of markets. E.g., Should agents and human participants be given the same amount of cash? What is the appropriate duration of such a market? At what rate should agents be permitted to transact? Which tasks are best suited to hybrid intelligence? Ultimately, one goal might be to train a class of agents in the presence of human participants but be able to deploy those agents offline for scalability.
References
- (1)
- Abernethy et al. (2011) Jacob Abernethy, Yiling Chen, and Jennifer Wortman Vaughan. 2011. An optimization-based framework for automated market-making. In Proceedings of the 12th ACM conference on Electronic commerce. 297–306.
- Altmejd et al. (2019) Adam Altmejd, Anna Dreber, Eskil Forsell, Juergen Huber, Taisuke Imai, Magnus Johannesson, Michael Kirchler, Gideon Nave, and Colin Camerer. 2019. Predicting the replicability of social science lab experiments. PloS one 14, 12 (2019), e0225826.
- Amershi et al. (2014) Saleema Amershi, Maya Cakmak, William Bradley Knox, and Todd Kulesza. 2014. Power to the people: The role of humans in interactive machine learning. Ai Magazine 35, 4 (2014), 105–120.
- Amershi et al. (2019) Saleema Amershi, Dan Weld, Mihaela Vorvoreanu, Adam Fourney, Besmira Nushi, Penny Collisson, Jina Suh, Shamsi Iqbal, Paul N Bennett, Kori Inkpen, et al. 2019. Guidelines for human-AI interaction. In Proceedings of the 2019 chi conference on human factors in computing systems. 1–13.
- Arrow et al. (2008) Kenneth J. Arrow, Robert Forsythe, Michael Gorham, Robert Hahn, Robin Hanson, John O. Ledyard, Saul Levmore, Robert Litan, Paul Milgrom, Forrest D. Nelson, George R. Neumann, Marco Ottaviani, Thomas C. Schelling, Robert J. Shiller, Vernon L. Smith, Erik Snowberg, Cass R. Sunstein, Paul C. Tetlock, Philip E. Tetlock, Hal R. Varian, Justin Wolfers, and Eric Zitzewitz. 2008. The Promise of Prediction Markets. Science 320, 5878 (May 2008), 877–878.
- Bansal et al. (2019) Gagan Bansal, Besmira Nushi, Ece Kamar, Walter S Lasecki, Daniel S Weld, and Eric Horvitz. 2019. Beyond accuracy: The role of mental models in human-AI team performance. In Proceedings of the AAAI Conference on Human Computation and Crowdsourcing, Vol. 7. 2–11.
- Barbu and Lay (2013) Adrian Barbu and Nathan Lay. 2013. Artificial prediction markets for lymph node detection. In 2013 E-Health and Bioengineering Conference (EHB). IEEE, 1–7.
- Barbu et al. (2012) Adrian Barbu, Nathan Lay, and Shie Mannor. 2012. An Introduction to Artificial Prediction Markets for Classification. Journal of Machine Learning Research 13, 7 (2012).
- Berg et al. (2008) Joyce E Berg, Forrest D Nelson, and Thomas A Rietz. 2008. Prediction market accuracy in the long run. International Journal of Forecasting 24, 2 (2008), 285–300.
- Brown and Sandholm (2019) Noam Brown and Tuomas Sandholm. 2019. Superhuman AI for multiplayer poker. Science 365, 6456 (2019), 885–890.
- Camerer et al. (2016) Colin F Camerer, Anna Dreber, Eskil Forsell, Teck-Hua Ho, Jürgen Huber, Magnus Johannesson, Michael Kirchler, Johan Almenberg, Adam Altmejd, Taizan Chan, et al. 2016. Evaluating replicability of laboratory experiments in economics. Science 351, 6280 (2016), 1433–1436.
- Camerer et al. (2018) Colin F Camerer, Anna Dreber, Felix Holzmeister, Teck-Hua Ho, Jürgen Huber, Magnus Johannesson, Michael Kirchler, Gideon Nave, Brian A Nosek, Thomas Pfeiffer, et al. 2018. Evaluating the replicability of social science experiments in Nature and Science between 2010 and 2015. Nature Human Behaviour 2, 9 (2018), 637–644. https://doi.org/10.1038/s41562-018-0399-z
- Canonico et al. (2019) Lorenzo Barberis Canonico, Christopher Flathmann, and Nathan McNeese. 2019. The wisdom of the market: Using human factors to design prediction markets for collective intelligence. In Proceedings of the Human Factors and Ergonomics Society Annual Meeting, Vol. 63. SAGE Publications Sage CA: Los Angeles, CA, 1471–1475.
- Chen et al. (2008) Yiling Chen, Lance Fortnow, Nicolas Lambert, David M Pennock, and Jennifer Wortman. 2008. Complexity of combinatorial market makers. In Proceedings of the 9th ACM Conference on Electronic Commerce. 190–199.
- Chen and Pennock ([n.d.]) Yiling Chen and David M. Pennock. [n.d.]. Designing markets for prediction. AI Magazine 31, 4 ([n. d.]), 42––52.
- Chen and Vaughan (2010) Yiling Chen and Jennifer Wortman Vaughan. 2010. A new understanding of prediction markets via no-regret learning. In Proceedings of the 11th ACM conference on Electronic commerce. 189–198.
- Chicho et al. (2021) Bahzad Taha Chicho, Adnan Mohsin Abdulazeez, Diyar Qader Zeebaree, and Dilovan Assad Zebari. 2021. Machine learning classifiers based classification for IRIS recognition. Qubahan Academic Journal 1, 2 (2021), 106–118.
- Cova et al. (2021) Florian Cova, Brent Strickland, Angela Abatista, Aurélien Allard, James Andow, Mario Attie, James Beebe, Renatas Berniūnas, Jordane Boudesseul, Matteo Colombo, et al. 2021. Estimating the reproducibility of experimental philosophy. Review of Philosophy and Psychology 12, 1 (2021), 9–44.
- Cowgill et al. (2009) Bo Cowgill, Justin Wolfers, and Eric Zitzewitz. 2009. Using Prediction Markets to Track Information Flows: Evidence from Google.. In amma. 3.
- Dellermann et al. (2021) Dominik Dellermann, Adrian Calma, Nikolaus Lipusch, Thorsten Weber, Sascha Weigel, and Philipp Ebel. 2021. The future of human-AI collaboration: a taxonomy of design knowledge for hybrid intelligence systems. arXiv preprint arXiv:2105.03354 (2021).
- Desai et al. (2019) Shrinivas D Desai, Shantala Giraddi, Prashant Narayankar, Neha R Pudakalakatti, and Shreya Sulegaon. 2019. Back-propagation neural network versus logistic regression in heart disease classification. In Advanced computing and communication technologies. Springer, 133–144.
- Dreber et al. (2015) Anna Dreber, Thomas Pfeiffer, Johan Almenberg, Siri Isaksson, Brad Wilson, Yiling Chen, Brian A Nosek, and Magnus Johannesson. 2015. Using prediction markets to estimate the reproducibility of scientific research. Proceedings of the National Academy of Sciences 112, 50 (2015), 15343–15347.
- Errington et al. (2014) Timothy M Errington, Elizabeth Iorns, William Gunn, Fraser Elisabeth Tan, Joelle Lomax, and Brian A Nosek. 2014. An open investigation of the reproducibility of cancer biology research. Elife 3 (2014).
- Fisher (1988) R.A. Fisher. 1988. Iris. UCI Machine Learning Repository.
- Fogliato et al. (2022) Riccardo Fogliato, Maria De-Arteaga, and Alexandra Chouldechova. 2022. A Case for Humans-in-the-Loop: Decisions in the Presence of Misestimated Algorithmic Scores. Available at SSRN 4050125 (2022).
- Forsell et al. (2019) Eskil Forsell, Domenico Viganola, Thomas Pfeiffer, Johan Almenberg, Brad Wilson, Yiling Chen, Brian A Nosek, Magnus Johannesson, and Anna Dreber. 2019. Predicting replication outcomes in the Many Labs 2 study. Journal of Economic Psychology 75 (2019), 102117.
- Gillen et al. (2012) Benjamin J Gillen, Charles R Plott, and Matthew Shum. 2012. Information aggregation mechanisms in the field: Sales forecasting inside intel. In Working paper.
- Gordon et al. (2020) Michael Gordon, Domenico Viganola, Michael Bishop, Yiling Chen, Anna Dreber, Brandon Goldfedder, Felix Holzmeister, Magnus Johannesson, Yang Liu, Charles Twardy, et al. 2020. Are replication rates the same across academic fields? Community forecasts from the DARPA SCORE programme. Royal Society open science (2020).
- Gordon et al. (2021) Michael Gordon, Domenico Viganola, Anna Dreber, Magnus Johannesson, and Thomas Pfeiffer. 2021. Predicting replicability—Analysis of survey and prediction market data from large-scale forecasting projects. Plos one 16, 4 (2021), e0248780.
- Green and Chen (2019) Ben Green and Yiling Chen. 2019. The principles and limits of algorithm-in-the-loop decision making. Proceedings of the ACM on Human-Computer Interaction 3, CSCW (2019), 1–24.
- Hanson et al. (2006) Robin Hanson, Ryan Oprea, and David Porter. 2006. Information aggregation and manipulation in an experimental market. Journal of Economic Behavior & Organization 60, 4 (2006), 449–459.
- Harper (2019) Richard HR Harper. 2019. The Role of HCI in the Age of AI. International Journal of Human–Computer Interaction 35, 15 (2019), 1331–1344.
- He et al. (2015) Kaiming He, Xiangyu Zhang, Shaoqing Ren, and Jian Sun. 2015. Delving deep into rectifiers: Surpassing human-level performance on imagenet classification. In Proceedings of the IEEE international conference on computer vision. 1026–1034.
- Hu and Storkey (2014) Jinli Hu and Amos Storkey. 2014. Multi-period trading prediction markets with connections to machine learning. In International Conference on Machine Learning. 1773–1781.
- Jahedpari et al. (2014) Fatemeh Jahedpari, Julian Padget, Marina De Vos, and Benjamin Hirsch. 2014. Artificial prediction markets as a tool for syndromic surveillance. Crowd Intelligence: Foundations, Methods and Practices (2014).
- Janosi et al. (1988) Andras Janosi, William Steinbrunn, Matthias Pfisterer, and Robert Detrano. 1988. Heart disease data set. The UCI KDD Archive (1988).
- Jarrahi (2018) Mohammad Hossein Jarrahi. 2018. Artificial intelligence and the future of work: Human-AI symbiosis in organizational decision making. Business horizons 61, 4 (2018), 577–586.
- Kamar (2016) Ece Kamar. 2016. Directions in Hybrid Intelligence: Complementing AI Systems with Human Intelligence. In IJCAI. 4070–4073.
- Klein et al. (2014) Richard A Klein, Kate A Ratliff, Michelangelo Vianello, Reginald B Adams Jr, Štěpán Bahník, Michael J Bernstein, Konrad Bocian, Mark J Brandt, Beach Brooks, Claudia Chloe Brumbaugh, et al. 2014. Investigating variation in replicability. Social psychology (2014).
- Klein et al. (2018) Richard A Klein, Michelangelo Vianello, Fred Hasselman, Byron G Adams, Reginald B Adams Jr, Sinan Alper, Mark Aveyard, Jordan R Axt, Mayowa T Babalola, Štěpán Bahník, et al. 2018. Many Labs 2: Investigating variation in replicability across samples and settings. Advances in Methods and Practices in Psychological Science 1, 4 (2018), 443–490.
- Kleinberg et al. (2018) Jon Kleinberg, Himabindu Lakkaraju, Jure Leskovec, Jens Ludwig, and Sendhil Mullainathan. 2018. Human decisions and machine predictions. The quarterly journal of economics 133, 1 (2018), 237–293.
- Lai and Tan (2019) Vivian Lai and Chenhao Tan. 2019. On human predictions with explanations and predictions of machine learning models: A case study on deception detection. In Proceedings of the conference on fairness, accountability, and transparency. 29–38.
- Lay and Barbu (2010) Nathan Lay and Adrian Barbu. 2010. Supervised aggregation of classifiers using artificial prediction markets. In ICML.
- Lay and Barbu (2012) Nathan Lay and Adrian Barbu. 2012. The artificial regression market. arXiv preprint arXiv:1204.4154 (2012).
- Lee et al. (2021) Min Hun Lee, Daniel P Siewiorek, Asim Smailagic, Alexandre Bernardino, and Sergi Bermúdez i Badia. 2021. A human-ai collaborative approach for clinical decision making on rehabilitation assessment. In Proceedings of the 2021 CHI Conference on Human Factors in Computing Systems. 1–14.
- Lekwijit and Sutivong (2018) Suparerk Lekwijit and Daricha Sutivong. 2018. Optimizing the liquidity parameter of logarithmic market scoring rules prediction markets. Journal of Modelling in Management (2018).
- Li et al. (2016) Guoliang Li, Jiannan Wang, Yudian Zheng, and Michael J Franklin. 2016. Crowdsourced data management: A survey. IEEE Transactions on Knowledge and Data Engineering 28, 9 (2016), 2296–2319.
- Manski (2006) Charles F Manski. 2006. Interpreting the predictions of prediction markets. economics letters 91, 3 (2006), 425–429.
- Mishina et al. (2015) Yohei Mishina, Ryuei Murata, Yuji Yamauchi, Takayoshi Yamashita, and Hironobu Fujiyoshi. 2015. Boosted random forest. IEICE TRANSACTIONS on Information and Systems 98, 9 (2015), 1630–1636.
- Mohan et al. (2020) Lalit Mohan, Janmejay Pant, Priyanka Suyal, and Arvind Kumar. 2020. Support vector machine accuracy improvement with classification. In 2020 12th International Conference on Computational Intelligence and Communication Networks (CICN). IEEE, 477–481.
- Müller-Schloer and Tomforde (2017) Christian Müller-Schloer and Sven Tomforde. 2017. Organic Computing-Technical Systems for Survival in the Real World. Springer.
- Nagar and Malone (2011) Yiftach Nagar and Thomas W Malone. 2011. Making business predictions by combining human and machine intelligence in prediction markets. Association for Information Systems.
- Nakshatri et al. (2021) Nishanth Nakshatri, Arjun Menon, C Lee Giles, Sarah Rajtmajer, and Christopher Griffin. 2021. Design and Analysis of a Synthetic Prediction Market using Dynamic Convex Sets. arXiv preprint arXiv:2101.01787 (2021).
- Nunes et al. (2015) David Sousa Nunes, Pei Zhang, and Jorge Sá Silva. 2015. A survey on human-in-the-loop applications towards an internet of all. IEEE Communications Surveys & Tutorials 17, 2 (2015), 944–965.
- Open Science Collaboration (2015) Open Science Collaboration. 2015. Estimating the reproducibility of psychological science. Science 349, 6251 (2015). https://doi.org/10.1126/science.aac4716 arXiv:https://science.sciencemag.org/content/349/6251/aac4716.full.pdf
- Pawel and Held (2020) Samuel Pawel and Leonhard Held. 2020. Probabilistic forecasting of replication studies. PloS one 15, 4 (2020), e0231416.
- Pinto et al. (2018) Joylin Priya Pinto, Soumya Kelur, and Jyothi Shetty. 2018. Iris flower species identification using machine learning approach. In 2018 4th International Conference for Convergence in Technology (I2CT). IEEE, 1–4.
- Polgreen et al. (2007) Philip M Polgreen, Forrest D Nelson, George R Neumann, and Robert A Weinstein. 2007. Use of prediction markets to forecast infectious disease activity. Clinical Infectious Diseases 44, 2 (2007), 272–279.
- Puig et al. (2020) Xavier Puig, Tianmin Shu, Shuang Li, Zilin Wang, Yuan-Hong Liao, Joshua B Tenenbaum, Sanja Fidler, and Antonio Torralba. 2020. Watch-and-help: A challenge for social perception and human-ai collaboration. arXiv preprint arXiv:2010.09890 (2020).
- Rajadevi et al. (2021) R Rajadevi, EM Roopa Devi, R Shanthakumari, RS Latha, N Anitha, and R Devipriya. 2021. Feature Selection for Predicting Heart Disease Using Black Hole Optimization Algorithm and XGBoost Classifier. In 2021 International Conference on Computer Communication and Informatics (ICCCI). IEEE, 1–7.
- Rajpurkar et al. (2022) Pranav Rajpurkar, Emma Chen, Oishi Banerjee, and Eric J Topol. 2022. AI in health and medicine. Nature Medicine 28, 1 (2022), 31–38.
- Rajtmajer et al. (2022) Sarah Rajtmajer, Christopher Griffin, Jian Wu, Robert Fraleigh, Laxmaan Balaji, Anna Squicciarini, Anthony Kwasnica, David Pennock, Michael McLaughlin, Timothy Fritton, et al. 2022. A synthetic prediction market for estimating confidence in published work. In Proceedings of the AAAI Conference on Artificial Intelligence, Vol. 36. 13218–13220.
- Rothschild and Pennock (2014) David Rothschild and David M Pennock. 2014. The extent of price misalignment in prediction markets. Algorithmic Finance 3, 1-2 (2014), 3–20.
- Singh et al. (2016) Yeshvendra K Singh, Nikhil Sinha, and Sanjay K Singh. 2016. Heart disease prediction system using random forest. In International Conference on Advances in Computing and Data Sciences. Springer, 613–623.
- Sowa et al. (2021) Konrad Sowa, Aleksandra Przegalinska, and Leon Ciechanowski. 2021. Cobots in knowledge work: Human–AI collaboration in managerial professions. Journal of Business Research 125 (2021), 135–142.
- Spann and Skiera (2009) Martin Spann and Bernd Skiera. 2009. Sports forecasting: a comparison of the forecast accuracy of prediction markets, betting odds and tipsters. Journal of Forecasting 28, 1 (2009), 55–72.
- Storkey (2011) Amos Storkey. 2011. Machine learning markets. In Proceedings of the Fourteenth International Conference on Artificial Intelligence and Statistics. 716–724.
- Storkey et al. (2012) Amos Storkey, Jono Millin, and Krzysztof Geras. 2012. Isoelastic agents and wealth updates in machine learning markets. arXiv preprint arXiv:1206.6443 (2012).
- Tetlock (2008) Paul C Tetlock. 2008. Liquidity and prediction market efficiency. Available at SSRN 929916 (2008).
- Travaini et al. (2022) Guido Vittorio Travaini, Federico Pacchioni, Silvia Bellumore, Marta Bosia, and Francesco De Micco. 2022. Machine learning and criminal justice: a systematic review of advanced methodology for recidivism risk prediction. International journal of environmental research and public health 19, 17 (2022), 10594.
- Tschandl et al. (2020) Philipp Tschandl, Christoph Rinner, Zoe Apalla, Giuseppe Argenziano, Noel Codella, Allan Halpern, Monika Janda, Aimilios Lallas, Caterina Longo, Josep Malvehy, et al. 2020. Human–computer collaboration for skin cancer recognition. Nature Medicine 26, 8 (2020), 1229–1234.
- Wang et al. (2020) Dakuo Wang, Elizabeth Churchill, Pattie Maes, Xiangmin Fan, Ben Shneiderman, Yuanchun Shi, and Qianying Wang. 2020. From human-human collaboration to Human-AI collaboration: Designing AI systems that can work together with people. In Extended abstracts of the 2020 CHI conference on human factors in computing systems. 1–6.
- Wang et al. (2019) Dakuo Wang, Justin D Weisz, Michael Muller, Parikshit Ram, Werner Geyer, Casey Dugan, Yla Tausczik, Horst Samulowitz, and Alexander Gray. 2019. Human-AI collaboration in data science: Exploring data scientists’ perceptions of automated AI. Proceedings of the ACM on Human-Computer Interaction 3, CSCW (2019), 1–24.
- Wolfers and Zitzewitz (2004) Justin Wolfers and Eric Zitzewitz. 2004. Prediction markets. Journal of economic perspectives 18, 2 (2004), 107–126.
- Wolfers and Zitzewitz (2006) Justin Wolfers and Eric Zitzewitz. 2006. Interpreting prediction market prices as probabilities. Technical Report. National Bureau of Economic Research.
- Wu et al. (2021) Jian Wu, Rajal Nivargi, Sree Sai Teja Lanka, Arjun Manoj Menon, Sai Ajay Modukuri, Nishanth Nakshatri, Xin Wei, Zhuoer Wang, James Caverlee, Sarah M Rajtmajer, et al. 2021. Predicting the Reproducibility of Social and Behavioral Science Papers Using Supervised Learning Models. arXiv preprint arXiv:2104.04580 (2021).
- Wu et al. (2022) Xingjiao Wu, Luwei Xiao, Yixuan Sun, Junhang Zhang, Tianlong Ma, and Liang He. 2022. A survey of human-in-the-loop for machine learning. Future Generation Computer Systems (2022).
- Yang et al. (2020) Yang Yang, Wu Youyou, and Brian Uzzi. 2020. Estimating the deep replicability of scientific findings using human and artificial intelligence. Proceedings of the National Academy of Sciences 117, 20 (2020), 10762–10768.
- Zhu et al. (2018) Meixin Zhu, Xuesong Wang, and Yinhai Wang. 2018. Human-like autonomous car-following model with deep reinforcement learning. Transportation research part C: emerging technologies 97 (2018), 348–368.