A localized kinematic structure detected in atomic carbon emission spatially coincident with a proposed protoplanet in the HD 163296 disk
Abstract
Over the last five years, studies of the kinematics in protoplanetary disks have led to the discovery of new protoplanet candidates and several structures linked to possible planet-disk interactions. We detect a localized kinematic bipolar structure in the HD 163296 disk present inside the deepest dust gap at 48 au from atomic carbon line emission. HD 163296’s stellar jet and molecular winds have been described in detail in the literature; however, the kinematic anomaly in C I emission is not associated with either of them. Further, the velocity of the kinematic structure points indicates a component fast enough to differentiate it from the Keplerian profile of the disk; and its atomic nature hints at a localized UV source strong enough to dissociate CO and launch a C I outflow, or a strong polar flow from the upper layers of the disk. By discarding the stellar jet and previously observed molecular winds, we explore different sources for this kinematic feature in C I emission that could be associated with a protoplanet inflow/outflow, or disk winds.
1 Introduction
Over the past few years, the analysis of gas kinematic features traced by the emission of millimetric rotational lines has been proposed as a useful method to detect putative forming-planets in circumstellar disks (Pinte et al., 2022). Embedded planets in protoplanetary disk generate kinematic footprints in the Keplerian pattern traced by molecular emission (Perez et al., 2015). Such footprints, either in pressure profiles or velocity deviations, have been observed in a handful of cases, thanks to the Atacama Large Millimeter and sub-millimeter Array (ALMA), proving the usefulness of the method (Teague et al., 2018; Pinte et al., 2018, 2022; Izquierdo et al., 2022a).
Much of the focus on disk kinematics have been related to the observation of planetary wakes. However, there are other possible kinematic features due to planets that could be observed. This includes meridional flows, and the inflow of material towards the accreting protoplanet (Fung & Chiang, 2016; Rabago & Zhu, 2021). Meridional flows and surface infall has been isolated in HD 163296 and HD 169142 (Teague et al., 2019; Yu et al., 2021), but other protoplanet-induced features remain undetected at present. There is the possibility of molecular outflows and/or jets powered by the circumplanetary accretion disk and its internal angular momentum transport (Pudritz et al., 2007a). Such outflows linked to accreting protoplanets have been proposed in the literature, although without observed detections so far (Wolk & Beck, 1990; Quillen & Trilling, 1998; Fendt, 2003; Lubow & Martin, 2012; Gressel et al., 2013).
HD 163296 disk stands out as one of the most comprehensively studied disks to date, having been extensively observed and modeled in detail. It has a rich dust millimeter continuum structure showing gaps, rings and a dust crescent that has been associated with an unseen giant planet (Isella et al., 2018). Several models have proposed that massive planets are responsible for carving such structures (Liu et al., 2018; Zhang et al., 2018). Moreover, studies of its gas kinematics structure have been able to infer the presence of planets through Keplerian deviations (Teague et al., 2018, 2021; Pinte et al., 2018; Izquierdo et al., 2022b; Calcino et al., 2022). Thus, the HD 163296 disk is one of the best candidates to study planet formation in action.
In this paper, we present the detection of a strong kinematic deviation in the HD 163296 disk traced by C I line emission which has not been observed in other molecular tracers (Thi et al., 2004; Law et al., 2021; Teague et al., 2021; Guzmán et al., 2021). We argue that such a kinematic feature can be tentatively associated with a protoplanet candidate or a disk wind that has not been observed before. We organize the present paper as follows. In Section 2 we describe the datasets used from the ALMA Archive and the methodology used for the gas kinematics analysis. We present the results of our data analysis in Section 3. In Section 4 we discuss the possible sources of the kinematic structure observed in C I emission. Finally, we summarize the findings of this paper in Sect. 5
.
2 Observations and Data Reduction
We used archival ALMA observations of the HD 163296 disk from the 2013.1.00527.S and 2015.1.01137.S projects. The 2013.1.00527.S project observed HD 163296 for 13 minutes with 37 antennas, while the 2015.1.01137.S project targeted the HD 163296 disk with an integration time of 4 minutes. We combined the datasets before imaging the C I 3P1-3P0 line observation in Band 8 with a rest frequency 492.161 GHz using the CASA software (McMullin et al., 2007). To properly combine them, both datasets were phase-centered in the celestial coordinates J2000 17°56′21′′ -21°57′22.545′′. The dataset was self-calibrated in two rounds with a solution interval of 30 s. The continuum was subtracted in the UV space with the uvcontsub routine and the images were reconstructed using the tclean algorithm in the CASA software. Different Briggs weighting values were explored during the imaging process to find an optimal trade-off between sensitivity and spatial resolution. The final chosen weighting value was equal to 0.5. The channel spacing of the final cube was 600 m s-1 to match the minimum independent spectral resolution of the initial datasets. The final RMS noise value was 33 mJy beam-1 for a beam size of 065040 with a position angle of 798 for each channel. Using those beam dimensions and signal-to-noise ratio, we obtained an astrometry precision 019, equivalent to 20 au in the HD 163296 disk.
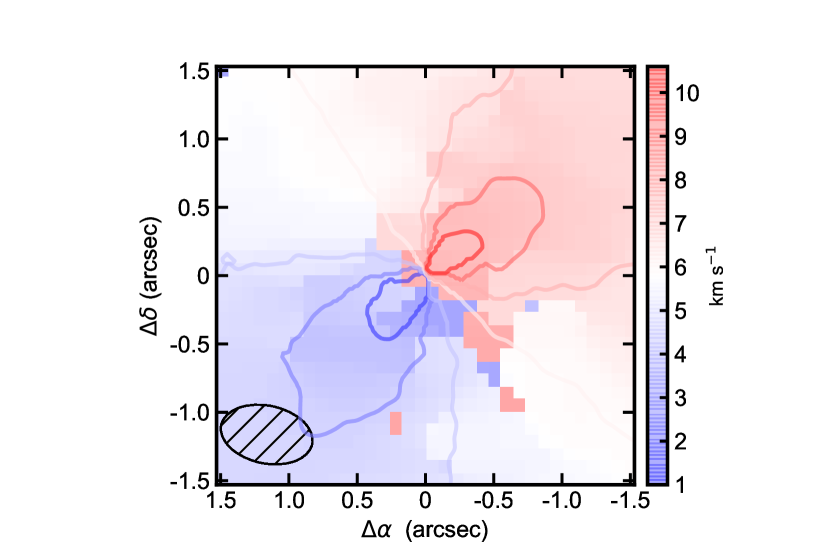
After the datasets were combined, we analyzed the kinematics features in the C I line emission using the bettermoments module (Teague & Foreman-Mackey, 2018), eddy (Teague, 2019), disksurf (Teague et al., 2021) and GoFish (Teague, 2019) python packages. By using those tools, we calculated the velocity-centroid maps and spectra from the disk using the C I line emission. The velocity-centroid map in Figure 1 was calculated by doing a Gaussian fitting inside the bettermoments module. For completeness, the velocity-centroid maps obtained from the Gaussian fit were compared to the ones from the quadratic fitting, showing the same localized kinematic feature. Given the spatial resolution of the observations, it was not possible to recover the emission height of the C I line. Nevertheless, we were able to compare the C I velocity-centroid map with the CO velocity-centroid from the MAPS data (Teague et al., 2021) by subtracting them.
3 Results
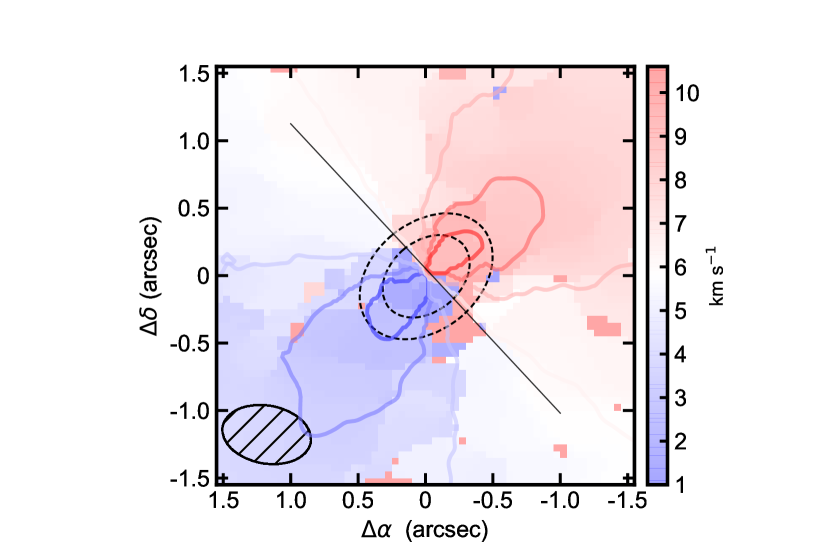
Figure 1 shows the contours of the velocity-centroid maps of the 13CO J=2-1 line emission overlaid on the velocity-centroid map of the C I line emission. In the Figure, the CO contours show the systemic rotational profile in the disk, while the C I velocity-centroid map has a clear redshifted lobe located 50 au to the SW of the star. The redshifted component has a velocity offset 2 km s-1, which suggests that is not linked to the Keplerian rotation of the disk. The redshifted lobe could be either a fast radially outwards component or vertical motion in the disk.
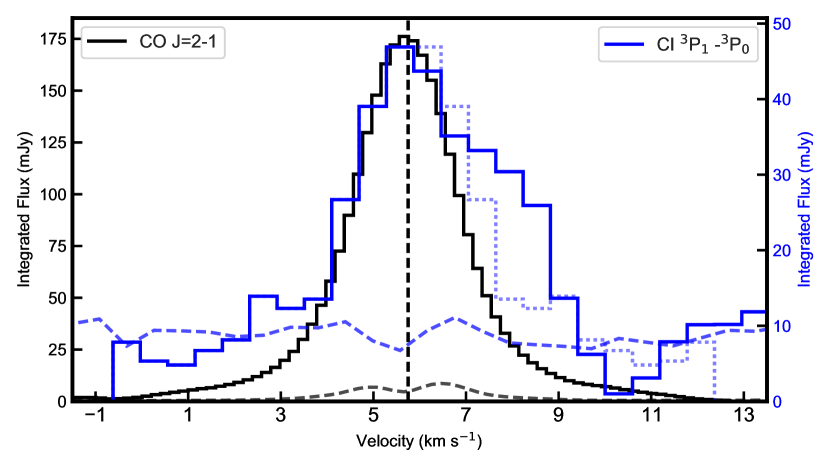
We provide the C I and CO J=2-1 integrated spectrum of a 60° wedge with a 60 au radial extension centered in the gap at 48 au on the SW side of the minor axis of the disk in Fig. 2. Given that the wedge is centered on the minor axis, a Keplerian disk should be symmetric around the systemic velocity of the star, 5.76 km s-1 (Teague et al., 2021). As expected, the CO spectrum is symmetric around the stellar systemic velocity, while the C I emission has a bright redshifted component when compared with the blueshifted Keplerian component. This asymmetry hints at an extra velocity component in the disk which is reflected in the velocity-centroid maps shown in Fig. 1.
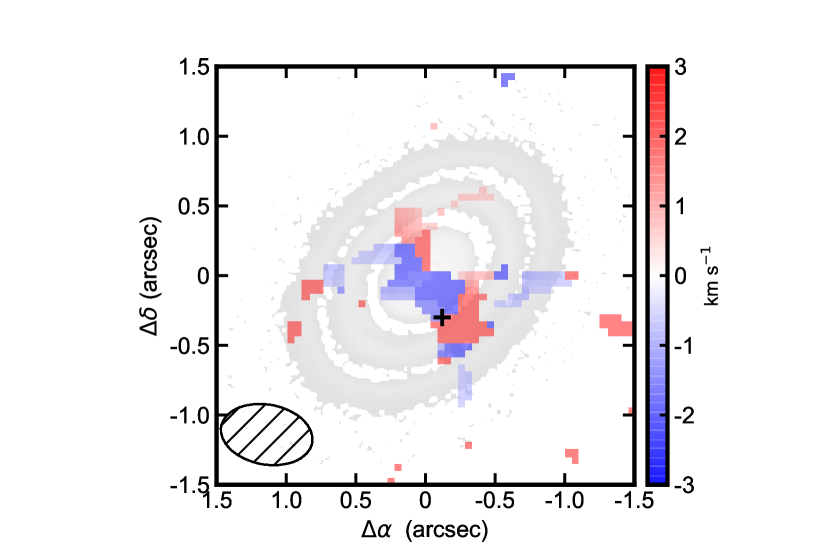
We show the subtraction of the C I velocity-centroid map with the one from the CO J=2-1 MAPS data in Figure 3 imaged at the same spatial and spectral resolution. By doing that we isolate the gas motion that is not associated with molecular tracers or the Keplerian disk. In the Figure, we also overlay the 1.3 millimeter dust continuum emission from the DSHARP survey (Andrews et al., 2018; Isella et al., 2018) to show the location of the bipolar blob when compared with the dust continuum emission structure. In addition, the cross represents the proposed location of a putative planet as suggested by Isella et al. (2018). A planet at this location would be able to create the dust continuum crescent observed within the gap at 48 au. This putative planet appears to be spatially coincident with the C I kinematic anomaly, both radially and azimuthally. There is an extra strong velocity deviation in the region close to the star. In that case, however, it is harder to isolate the emission from the inner disk given the beam size.
Finally, we note that this kinematic feature is not detected in other species as this is not found in the emission maps of any other species with resolved data. For this purpose we searched the emission images of CO, C2H, CN, HCO+ and numerous other species/transitions observed in the MAPS program (Law et al., 2021; Guzmán et al., 2021) for evidence of a similar anomaly. No evidence is present in these deep datasets. In additional support of its localized nature, no feature from HD 163296 at that velocity is observed in large-scale emission spectra from organic molecules with IRAM (Thi et al., 2004).
4 Discussion
Given its brightness, HD 163296 is one of the most well-characterized protoplanetary disks to date. This system is associated with a well-characterized stellar jet that is also aligned along the NE-SW minor axis, coinciding with the localized kinematic anomaly (Xie et al., 2021). However, the velocities of the stellar jet have values ranging over 100 km s-1; in contrast, the C I feature is spread over only a couple km s-1. More importantly, the jet observed to the SW of the disk is blueshifted (Günther et al., 2013; Ellerbroek et al., 2014; Xie et al., 2021; Kirwan et al., 2022), which is expected given the orientation of the HD 163296 disk on the sky, i.e., the NE side being the closest to us (Teague et al., 2021). On the contrary, the C I feature at we observe at 50 au toward the SW is redshifted. At this location, such a feature could be interpreted as a vertical inflow/outflow, or a radial flow going outwards. A connection between the C I kinematic feature and the slower molecular winds observed by Klaassen et al. (2013) and Booth et al. (2021) is also unlikely as they are also blueshifted, with a velocity offset from the star -18 km s-1. At the location closest to the disk in the SW direction, the wind observed in CO emission is blue-shifted to -13 km s-1; excess C I emission is at 8-10 km s-1. Thus, the source of the C I feature is kinematically decoupled from either the stellar jet or the observed CO molecular wind given its velocity and its localized nature. Another potential origin for this feature could be the detection of a planetary wake. However, the kinematic deviations associated with wakes are of order a few hundreds of m s-1 for planets less massive than 1 Jupiter mass, and the Doppler flip would be azimuthally inverted to the one we observed (Pérez et al., 2018), i.e., negative and positive velocity deviations are azimuthally switched given the disk rotation.
The atomic nature of the kinematic feature requires a source of UV photons, strong enough to photodissociate CO. If the kinematic feature is tracing C I flows from the upper layers of the disk, it requires a physical source to launch outflows at that speed that far from the star, which can be linked to planets. Conversely, if the feature traces C I emission in the midplane, the UV photons need to be produced locally deep in the disk since CO self-shields UV photons coming from the star and the Interstellar Medium (see Appendix A). Such a source can be linked to a circumplanetary disk actively accreting in the midplane. We are not able to discard a stellar wind for the blue lobe, as it is closer to the star and also blueshifted; however, if the blueshifted lobe traces the disk wind, that still would not explain the source of the localized redshifted lobe at 50 au.
Given that the C I velocity deviation is 2 km s-1, i.e. , for the anomaly to be associated with a planet, it has to be around 10 MJup for (see Figure 7 in Rabago & Zhu (2021)). This estimate can be compared to previously reported values in the literature using observations of the disk at different wavelengths, e.g., Zhang et al. (2018) provide an estimate of a 2.18 MJup planet with using dust millimeter continuum. Further, Mesa et al. (2019) put an upper limit of 7 MJup for any possible companion with direct imaging observations.
4.1 Potential Solution #1: Protoplanet Infall
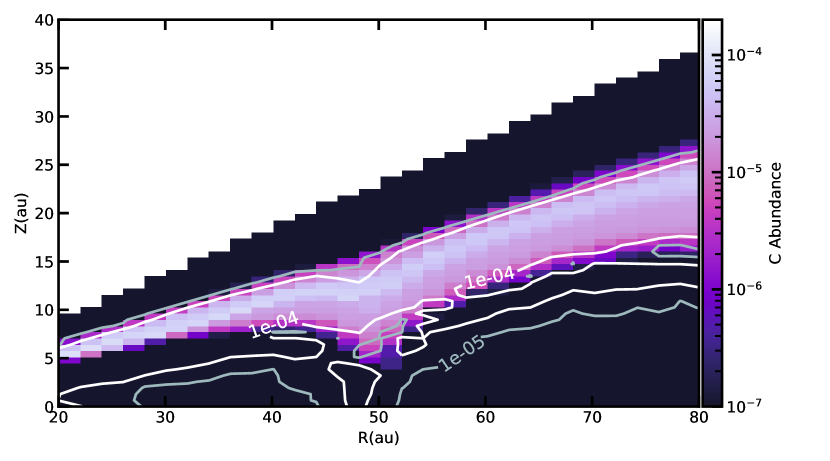
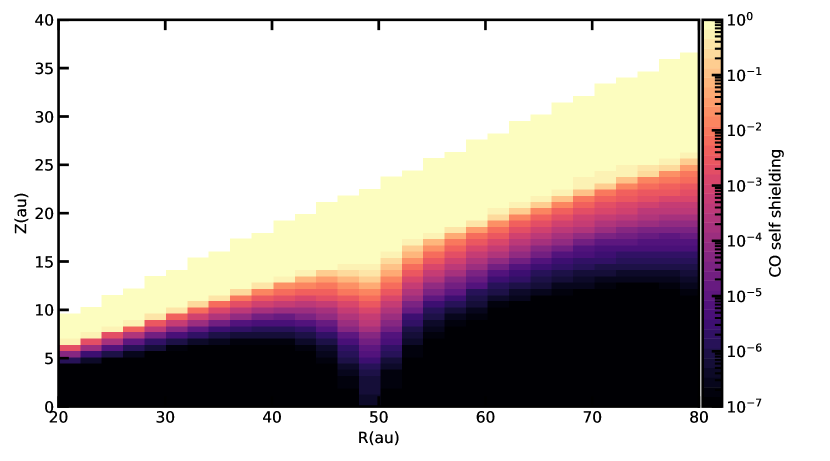
Vertical infall of material is expected in the presence of a massive planet, reaching levels even comparable to the local sound speed (Fung & Chiang, 2016). Tracing the infall through C I line emission might be possible if it were dominated by disk surface gas directly exposed to stellar ultraviolet (UV) radiation, as the photodissociation of molecules becomes important. In the case of an embedded massive planet, it could carve a gap deep enough so the local pressure gradient dominates the gas flow even in the presence of disk winds (Weber et al., 2022). Moreover, the depleted gap will increase the penetration of the stellar UV flux into the disk (Facchini et al., 2018; Alarcón et al., 2020). In that case, we expect the C I abundance to increase in layers closer to the midplane, such that neutral atomic carbon might be a tracer of protoplanet infall. Figure 4 shows the C I abundance in a thermochemical model of HD 163296 including its dust substructure. The Figure shows that C I remains abundant at lower layers in the disk, closer to the midplane within the gap near 50 au. Moreover, the contours showing the CO abundance illustrate that as that region is more exposed to UV radiation, the photodissociation rate increases. If we assume the feature is tracing the surface of the disk, we can also put further constraints on the putative planet’s mass by using the local sound speed in the disk. The sound speed in our thermochemical model at the C I layer is km s-1, so the meridional speed of the C I inflow agrees with the models of Fung & Chiang (2016) for 1 to 4 Jupiter mass planets, i.e., , at the location of the planet.
Our model shows that C I is clearly present in the gap, but the effects of photodissociation via stellar photons do not destroy enough CO in the midplane to raise the C I abundance to values significant enough to be observable. From thermochemical models of HD 163296 with rac2d (Du & Bergin, 2014a), the predicted C I emission for the 3P1-3P0 line matching the beam size of the observations is 40 mJy beam-1, which is not detectable given the noise value.
The peak intensity at the kinematic anomaly allows us to provide estimates of the vertical gas flow. By using the redshifted velocity, 2 km s and the disk inclination, 46.7 deg (Öberg et al., 2021), we can estimate a lower limit for the infall velocity, km s-1. Then, we can estimate the infall timescale using , where , is the emission height of C I. From Figure 4, we use au as a tentative C I emission height, where most of the C I is concentrated. Then, the estimated infall timescale is yr. With the inferred C I column density and the area of the redshifted anomaly we can estimate the mass accretion rate by using the following relationship:
| (1) |
where is the area of the redshifted anomaly, the hydrogen mass, the inferred C I column density, the C I abundance, and the infall timescale. Using the peak intensity at the velocity anomaly, Jy beam-1, the inferred C I column density is 3.5 x 1017 cm-2 for an excitation temperature Texc = 45 K (see Appendix B). Taking into account a transverse area, au2, and , the accretion rate is: , which is within the expected range of accretion rates for growing planets from the literature (Kley et al., 2001; Szulágyi et al., 2014; Tanigawa & Tanaka, 2016).
An additional point in favor of this scenario (and Solution #2) is that the dust crescent is located in what would be the L5 Lagrangian point of the planet. It is expected that a massive planet, such as the one proposed to carve the dust gap at 48 au, can cause a dust pile-up in the L4 and L5 Lagrangian points (Montesinos et al., 2020), which has also been observed in the LkCa 15 disk (Long et al., 2022). Therefore, the azimuthal and radial location of the kinematic C I feature agrees with the presence of multiple substructures in the disk.
4.2 Potential Solution #2: Protoplanet Outflow or Radial De-cretion
If the C I emission is arising from within deeper layers in the disk, there might be a local UV source generated by the protoplanetary accretion. This would answer one puzzling aspect of this anomaly - why it is not seen in molecular emission (see § 3). If a UV source is present to dissociate CO, then other species, which are more easily photodestroyed, would be as well. In the presence of optically thin C18O emission, it is possible that a localized emission gap caused by CO photodissociation would be expected, although there will be an interplay between temperature and optical depth. However, the C18O J=2-1 emission is still optically thick at 50 au in the HD 163296 disk, so it does not trace the midplane at 50 au.
If the C I kinematic feature is not associated with infall onto a protoplanet, then it could be a localized source of outflow from an accreting protoplanet, and the kinematic feature is tracing an outflow behind the disk. It is clear that protoplanets are born with accretion disks and emission from H has been detected towards PDS 70 (Haffert et al., 2019), which is associated with accretion onto the young protoplanets. Recently, a faint point source emission of H has been observed in the HD 163296 disk (Huélamo et al., 2022) at the minor axis in the SW of the disk, although at a closer radius, 171 mas. Given the presence of accretion disks, subsequent outflows or possible jets are expected in order to produce the loss of angular momentum (Pudritz et al., 2007b; Pascucci et al., 2022). Given that the planet-disk interactions are strong enough, the C I emission feature can also be tracing the radial de-cretion flows in the midplane towards the gap’s edges (Fung & Chiang, 2016; Rabago & Zhu, 2021; Calcino et al., 2022).
Here the gas flow rate from Section 4.1 would reflect the outflow mass loss rate. Since we are tracing the backside of the disk, the diameter of the emitting area is constrained by the width of the dust gap, which is 20 au (Huang et al., 2018), so we assume the area of the anomaly to be, 102 au2. This emitting area is a factor of four smaller than the one assumed in our Potential Solution #1, so the inferred accretion rate is also a factor of four smaller. We can then use the relationship (Pudritz et al., 2007b), leading to an estimated accretion rate of . Even though this value is still within the possible solutions for planetary accretion rates, it would be for a very strong accretor. This solution would also require the presence of a localized UV field to account for the lack of detection of a molecular counterpart.
4.3 Potential Solution #3: Disk Wind
Another possibility is that the C I feature is associated with disk winds. Disk winds are associated with the jets and magnetic activity of the central star or radiation-driven in the outer regions of disks. In detriment of this scenario, the stellar jet is blueshifted to the SW (Xie et al., 2021), which is the closest part of the disk. For the observed molecular wind in the disk, the velocity offset being at least a few tens of km s-1 (Booth et al., 2021). Additionally, theoretical and observational evidence have shown that disk winds associated with magnetic fields are launched from the inner disk, 10 au for Class II disks (Goodson et al., 1999; Matt & Pudritz, 2005; Pascucci et al., 2022). There is a possibility that the feature is tracing an FUV-driven wind on the far side of the disk, although it is expected that this would be observed as a diffused extended emission as well. Additionally, the bipolar nature of the feature offset from the central star makes this scenario less likely. Nevertheless, the blueshifted lobe is close to the stellar location, without additional high-resolution data we cannot discard that the blueshifted lobe is tracing a stellar wind. However, this scenario does not provide an origin for the offset of the bipolar structure and the localized redshifted lobe at 50 au.
Further, observations with the APEX telescope did not show strong C I emission in HD 163296 (Kama et al., 2016). This points out that the observed kinematic feature is local rather than a large-scale emission, which is usually the case for disk winds. Nevertheless, molecular winds launched from the disk surface at a few km s-1 are still possible.
5 Summary
In this work, we have presented the detection of a strong kinematic deviation in C I line emission in the HD 163296 protoplanetary disk. We proposed that such structure is linked to either the presence of a strong UV source in the midplane of the disk, dissociating surrounding CO, which would explain the strong feature in C I ; or the feature is coming from the disk atmosphere and is tracing inflow of gas into the midplane. The fact that is not observed in CO or other molecular tracers, such as the ones observed by the MAPS program, suggests that this kinematic component is mostly atomic in nature and not molecular. Its atomic nature constrains the expected local physical and chemical conditions at the source of this feature. The evidence for this feature is given below:
-
1.
It is located in the strongly depleted inner dust gap, which has been proposed to be carved by a massive Jovian planet.
-
2.
The projection of kinematic structure is parallel to the disk minor axis.
-
3.
The structure is observed in two independent datasets (see Appendix C).
-
4.
The kinematic structure appears to be atomic in composition, requiring a localized UV source.
-
5.
The dust continuum crescent at the inner dust gap in HD 163296 is located in one of the dust pile-up Lagrangian points of the putative planet.
-
6.
Planetary wakes from hydrodynamic simulations are at the level of a few hundreds of m s-1. Both the molecular wind and the stellar jet’s component to the SW of the disk are blueshifted, while the strongest emission in the C I kinematic structure is redshifted. The velocity of the molecular wind in HD 163296 ranges between -20 and -18 km s-1 offset from the stellar velocity (Booth et al., 2021), while the blue-shifted component of the stellar jet has a velocity, km s-1 (Xie et al., 2021). Therefore, we discard other sources of velocity structure.
Deeper observations of C I 3P1-3P0 line emission at higher spatial resolution and precision are needed to confirm the link between the C I kinematic feature in the HD 163296 disk and a putative protoplanet. If a protoplanet nature is confirmed, the C I kinematic feature would be the first detection of an atomic carbon protoplanetary footprint, introducing a novel technique of protoplanet detection, while providing further constraints in the planet formation process and composition of the planet-feeding gas. If the source of the C I feature is coming from either a disk wind or planetary accretion, both of which require a local UV source, it would produce a distinctive feature in atomic forbidden lines, some of which are potentially detectable with JWST. Additionally, a more robust velocity-centroid map of the HD 163296 disk in C I emission with ALMA would provide further evidence to disentangle the different possible scenarios.
Appendix A CO Self-Shielding
One of the proposed solutions for the C I kinematic feature is due to protoplanet infall from the upper layers of the disk. However, since the feature is not observed in molecular tracers, it requires that the inflow is actually coming from the very top layers of the disk, or the atomic layer of the disk is pushed down due to dust depletion. Another important factor to consider, in particular for C I is CO self-shielding (Visser et al., 2009). As CO self-shields itself it avoids its own destruction due to high-energy photons. We show the CO self-shielding factor in Figure 5. It shows that in a 99% dust-depleted gap, the CO self-shielding layer is pushed down. However, that push is not significant enough to put the C I layer inside the Hill’s sphere of a 3 Jupiter mass planet at that location. if the inflow scenario is the source of the kinematic asymmetry, it points to a chemical mixing between the upper layers of the disk and planet-feeding gas. If the source of the C I emission is in the upper layers, it points to an additional UV source in the midplane. This requires a powerful source of high-energy photons, which could be an accretion disk around a protoplanet.
Appendix B Calculation of the C I Column Density
We use the peak intensity to calculate the C I column density in the kinematic anomaly, in order to estimate the mass flow. From radiative transfer equations for continuum subtracted line emission, the observed intensity is given by the following:
| (B1) |
where is the mean intensity at the line peak, the excitation temperature, which we set to 45 K, and the optical depth at the line peak.
The optical depth at the line peak is given by:
| (B2) |
with the speed of light, the Planck’s constant, the Boltzmann’s constant, the Einstein coefficient for the respective line, the value of the line profile at the peak of the line, and the column density of the targeted species at the excited state.
The value of the line profile at the peak is given by:
| (B3) |
with:
| (B4) |
where is the mass of C I , a turbulent velocity component, which we set to 200 m s-1, and the temperature.
Assuming , the blackbody emission, and combining it with Eqs. B1, B2 and B3; the excited column density of C I is recovered. To estimate the total C I column density, we used the partition function as follows:
| (B5) |
with the degeneracy of the upper level, the partition function, the energy of the upper level, and the excitation temperature. Above 30 K, the brightness of the C I 3P1-3P0 line is relatively insensitive to temperature. Excitation temperatures between 40 K and 100 K produce column densities, NCI, in the range 3.2-3.9 1017 cm-2, i.e, only a 22% change. Thus, adopting a value of 45 K for the column density retrieval does not produce significant changes in the column density given the other sources of uncertainty. All the specific constant values for the C I 3P1-3P0 line are taken from the Leiden Atomic and Molecular Database, LAMDA (Schöier et al., 2005).
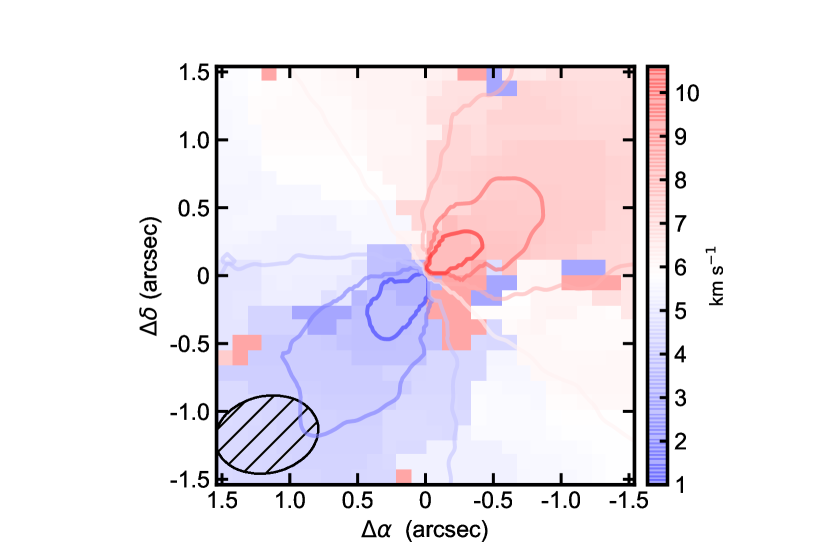
Appendix C Velocity Centroid in different Datasets
For completeness, we also show the velocity centroids in Figure 6. Both datasets show the kinematic feature, although the statistical significance of the feature for each dataset independently is not high enough to assure the presence of the feature.
References
- Alarcón et al. (2020) Alarcón, F., Teague, R., Zhang, K., Bergin, E. A., & Barraza-Alfaro, M. 2020, ApJ, 905, 68, doi: 10.3847/1538-4357/abc1d6
- Andrews et al. (2018) Andrews, S. M., Huang, J., Pérez, L. M., et al. 2018, ApJ, 869, L41, doi: 10.3847/2041-8213/aaf741
- Astropy Collaboration et al. (2013) Astropy Collaboration, Robitaille, T. P., Tollerud, E. J., et al. 2013, A&A, 558, A33, doi: 10.1051/0004-6361/201322068
- Astropy Collaboration et al. (2018) Astropy Collaboration, Price-Whelan, A. M., Sipőcz, B. M., et al. 2018, AJ, 156, 123, doi: 10.3847/1538-3881/aabc4f
- Booth et al. (2021) Booth, A. S., Tabone, B., Ilee, J. D., et al. 2021, ApJS, 257, 16, doi: 10.3847/1538-4365/ac1ad4
- Calcino et al. (2022) Calcino, J., Hilder, T., Price, D. J., et al. 2022, ApJ, 929, L25, doi: 10.3847/2041-8213/ac64a7
- Du & Bergin (2014a) Du, F., & Bergin, E. A. 2014a, ApJ, 792, 2, doi: 10.1088/0004-637X/792/1/2
- Du & Bergin (2014b) —. 2014b, ApJ, 792, 2, doi: 10.1088/0004-637X/792/1/2
- Ellerbroek et al. (2014) Ellerbroek, L. E., Podio, L., Dougados, C., et al. 2014, A&A, 563, A87, doi: 10.1051/0004-6361/201323092
- Facchini et al. (2018) Facchini, S., Pinilla, P., van Dishoeck, E. F., & de Juan Ovelar, M. 2018, A&A, 612, A104, doi: 10.1051/0004-6361/201731390
- Fendt (2003) Fendt, C. 2003, A&A, 411, 623, doi: 10.1051/0004-6361:20034154
- Fung & Chiang (2016) Fung, J., & Chiang, E. 2016, ApJ, 832, 105, doi: 10.3847/0004-637X/832/2/105
- Goodson et al. (1999) Goodson, A. P., Böhm, K.-H., & Winglee, R. M. 1999, ApJ, 524, 142, doi: 10.1086/307779
- Gressel et al. (2013) Gressel, O., Nelson, R. P., Turner, N. J., & Ziegler, U. 2013, ApJ, 779, 59, doi: 10.1088/0004-637X/779/1/59
- Günther et al. (2013) Günther, H. M., Schneider, P. C., & Li, Z. Y. 2013, A&A, 552, A142, doi: 10.1051/0004-6361/201220772
- Guzmán et al. (2021) Guzmán, V. V., Bergner, J. B., Law, C. J., et al. 2021, ApJS, 257, 6, doi: 10.3847/1538-4365/ac1440
- Haffert et al. (2019) Haffert, S. Y., Bohn, A. J., de Boer, J., et al. 2019, Nature Astronomy, 3, 749, doi: 10.1038/s41550-019-0780-5
- Huang et al. (2018) Huang, J., Andrews, S. M., Dullemond, C. P., et al. 2018, ApJ, 869, L42, doi: 10.3847/2041-8213/aaf740
- Huélamo et al. (2022) Huélamo, N., Chauvin, G., Mendigutía, I., et al. 2022, arXiv e-prints, arXiv:2210.02212. https://arxiv.org/abs/2210.02212
- Isella et al. (2018) Isella, A., Huang, J., Andrews, S. M., et al. 2018, ApJ, 869, L49, doi: 10.3847/2041-8213/aaf747
- Izquierdo et al. (2022a) Izquierdo, A. F., Facchini, S., Rosotti, G. P., van Dishoeck, E. F., & Testi, L. 2022a, ApJ, 928, 2, doi: 10.3847/1538-4357/ac474d
- Izquierdo et al. (2022b) —. 2022b, ApJ, 928, 2, doi: 10.3847/1538-4357/ac474d
- Kama et al. (2016) Kama, M., Bruderer, S., Carney, M., et al. 2016, A&A, 588, A108, doi: 10.1051/0004-6361/201526791
- Kirwan et al. (2022) Kirwan, A., Murphy, A., Schneider, P. C., et al. 2022, arXiv e-prints, arXiv:2205.06569. https://arxiv.org/abs/2205.06569
- Klaassen et al. (2013) Klaassen, P. D., Juhasz, A., Mathews, G. S., et al. 2013, A&A, 555, A73, doi: 10.1051/0004-6361/201321129
- Kley et al. (2001) Kley, W., D’Angelo, G., & Henning, T. 2001, ApJ, 547, 457, doi: 10.1086/318345
- Law et al. (2021) Law, C. J., Loomis, R. A., Teague, R., et al. 2021, ApJS, 257, 3, doi: 10.3847/1538-4365/ac1434
- Liu et al. (2018) Liu, S.-F., Jin, S., Li, S., Isella, A., & Li, H. 2018, ApJ, 857, 87, doi: 10.3847/1538-4357/aab718
- Long et al. (2022) Long, F., Andrews, S. M., Zhang, S., et al. 2022, ApJ, 937, L1, doi: 10.3847/2041-8213/ac8b10
- Lubow & Martin (2012) Lubow, S. H., & Martin, R. G. 2012, ApJ, 749, L37, doi: 10.1088/2041-8205/749/2/L37
- Matt & Pudritz (2005) Matt, S., & Pudritz, R. E. 2005, ApJ, 632, L135, doi: 10.1086/498066
- McMullin et al. (2007) McMullin, J. P., Waters, B., Schiebel, D., Young, W., & Golap, K. 2007, in Astronomical Society of the Pacific Conference Series, Vol. 376, Astronomical Data Analysis Software and Systems XVI, ed. R. A. Shaw, F. Hill, & D. J. Bell, 127
- Mesa et al. (2019) Mesa, D., Langlois, M., Garufi, A., et al. 2019, MNRAS, 488, 37, doi: 10.1093/mnras/stz1662
- Montesinos et al. (2020) Montesinos, M., Garrido-Deutelmoser, J., Olofsson, J., et al. 2020, A&A, 642, A224, doi: 10.1051/0004-6361/202038758
- Öberg et al. (2021) Öberg, K. I., Guzmán, V. V., Walsh, C., et al. 2021, ApJS, 257, 1, doi: 10.3847/1538-4365/ac1432
- Pascucci et al. (2022) Pascucci, I., Cabrit, S., Edwards, S., et al. 2022, arXiv e-prints, arXiv:2203.10068. https://arxiv.org/abs/2203.10068
- Pérez et al. (2018) Pérez, S., Casassus, S., & Benítez-Llambay, P. 2018, MNRAS, 480, L12, doi: 10.1093/mnrasl/sly109
- Perez et al. (2015) Perez, S., Dunhill, A., Casassus, S., et al. 2015, ApJ, 811, L5, doi: 10.1088/2041-8205/811/1/L5
- Pinte et al. (2022) Pinte, C., Teague, R., Flaherty, K., et al. 2022, arXiv e-prints, arXiv:2203.09528. https://arxiv.org/abs/2203.09528
- Pinte et al. (2018) Pinte, C., Price, D. J., Ménard, F., et al. 2018, ApJ, 860, L13, doi: 10.3847/2041-8213/aac6dc
- Pudritz et al. (2007a) Pudritz, R. E., Ouyed, R., Fendt, C., & Brandenburg, A. 2007a, in Protostars and Planets V, ed. B. Reipurth, D. Jewitt, & K. Keil, 277. https://arxiv.org/abs/astro-ph/0603592
- Pudritz et al. (2007b) Pudritz, R. E., Ouyed, R., Fendt, C., & Brandenburg, A. 2007b, in Protostars and Planets V, ed. B. Reipurth, D. Jewitt, & K. Keil, 277. https://arxiv.org/abs/astro-ph/0603592
- Quillen & Trilling (1998) Quillen, A. C., & Trilling, D. E. 1998, ApJ, 508, 707, doi: 10.1086/306421
- Rabago & Zhu (2021) Rabago, I., & Zhu, Z. 2021, MNRAS, 502, 5325, doi: 10.1093/mnras/stab447
- Schöier et al. (2005) Schöier, F. L., van der Tak, F. F. S., van Dishoeck, E. F., & Black, J. H. 2005, A&A, 432, 369, doi: 10.1051/0004-6361:20041729
- Szulágyi et al. (2014) Szulágyi, J., Morbidelli, A., Crida, A., & Masset, F. 2014, ApJ, 782, 65, doi: 10.1088/0004-637X/782/2/65
- Tanigawa & Tanaka (2016) Tanigawa, T., & Tanaka, H. 2016, ApJ, 823, 48, doi: 10.3847/0004-637X/823/1/48
- Teague (2019) Teague, R. 2019, The Journal of Open Source Software, 4, 1220, doi: 10.21105/joss.01220
- Teague (2019) Teague, R. 2019, The Journal of Open Source Software, 4, 1632, doi: 10.21105/joss.01632
- Teague et al. (2019) Teague, R., Bae, J., & Bergin, E. A. 2019, Nature, 574, 378, doi: 10.1038/s41586-019-1642-0
- Teague et al. (2018) Teague, R., Bae, J., Bergin, E. A., Birnstiel, T., & Foreman-Mackey, D. 2018, ApJ, 860, L12, doi: 10.3847/2041-8213/aac6d7
- Teague & Foreman-Mackey (2018) Teague, R., & Foreman-Mackey, D. 2018, Research Notes of the American Astronomical Society, 2, 173, doi: 10.3847/2515-5172/aae265
- Teague et al. (2021) Teague, R., Law, C. J., Huang, J., & Meng, F. 2021, Journal of Open Source Software, 6, 3827, doi: 10.21105/joss.03827
- Teague et al. (2021) Teague, R., Bae, J., Aikawa, Y., et al. 2021, ApJS, 257, 18, doi: 10.3847/1538-4365/ac1438
- Thi et al. (2004) Thi, W. F., van Zadelhoff, G. J., & van Dishoeck, E. F. 2004, A&A, 425, 955, doi: 10.1051/0004-6361:200400026
- Visser et al. (2009) Visser, R., van Dishoeck, E. F., & Black, J. H. 2009, A&A, 503, 323, doi: 10.1051/0004-6361/200912129
- Weber et al. (2022) Weber, M. L., Ercolano, B., Picogna, G., & Rab, C. 2022, MNRAS, 517, 3598, doi: 10.1093/mnras/stac2954
- Wolk & Beck (1990) Wolk, S. J., & Beck, S. C. 1990, PASP, 102, 745, doi: 10.1086/132697
- Xie et al. (2021) Xie, C., Haffert, S. Y., de Boer, J., et al. 2021, A&A, 650, L6, doi: 10.1051/0004-6361/202140602
- Yu et al. (2021) Yu, H., Teague, R., Bae, J., & Öberg, K. 2021, ApJ, 920, L33, doi: 10.3847/2041-8213/ac283e
- Zhang et al. (2018) Zhang, S., Zhu, Z., Huang, J., et al. 2018, ApJ, 869, L47, doi: 10.3847/2041-8213/aaf744