Observational studies of high-mass star formation
Abstract
We present a review of observational studies of high-mass star formation, based mainly on our own research. It includes surveys of high-mass star-forming regions in various molecular lines and in continuum, investigations of filamentary infrared dark clouds, which represent the earliest phases of massive star formation, detailed studies of individual high-mass star-forming regions, dense cores and disks harboring massive (proto)stars, and associated outflows. Chemistry in these regions is discussed, too.
Key words: ISM: clouds, ISM: molecules, ISM: jets and outflows, stars: formation, stars: massive, radio lines: ISM, astrochemistry
1 Introduction
Massive stars ( M⊙) play a very important role in the life of the Universe. However the process of their formation is still puzzling in many respects. Both theoretical and observational studies of this process face serious difficulties. The process of formation of massive stars seems to be more complicated than the formation of low-mass stars, and there are still many unclear points in it (e.g. McKee and Ostriker, 2007; Zinnecker and Yorke, 2007; Tan et al., 2014; Motte et al., 2018; Rosen et al., 2020) related to the fact that nuclear reactions in massive protostars begin much earlier than they reach the final mass. Radiation pressure can stop further influx of matter. It is also not entirely clear how to explain the fact that massive cores do not break up into smaller fragments. Observational studies of HMSF regions are hampered by the fact that they are rare and are located much farther from us than the dark clouds in which stars of small mass are formed. The nearest such region is at a distance of pc, and typical distances are several kiloparsecs. Interferometers are required for their detailed study.
Here we present a brief review of observational studies of high-mass star formation with an emphasis on our own results.
2 Surveys of star-forming regions in the Milky Way galaxy
Studies of the general characteristics of star-forming regions are based on surveys of these objects. To date, quite a few such surveys have been carried out. A good example of such work is the survey of the Galactic plane in the CO line (Dame et al., 2001), which served as the basis for many further studies. Such a survey gives a general idea of the distribution and kinematics of interstellar matter, but has a rather low angular resolution and makes it difficult to identify and study compact star formation regions. For such problems, surveys of significant parts of the Galactic plane with a much higher resolution in the continuum and in the lines of some molecules, carried out with the help of ground-based and space instruments, are very useful. Among them, one can note ground surveys in the continuum at wavelengths mm ATLASGAL (The APEX telescope large area survey of the galaxy at 870 m) (Schuller et al., 2009; Csengeri et al., 2014) and BOLOCAM (Aguirre et al., 2011), as well as the survey in the 13CO line GRS (The Boston University-Five College Radio Astronomy Observatory Galactic Ring Survey) (Jackson et al., 2006). A lot of useful information was given by spacecraft operating at wavelengths from the far IR to the near IR ranges (for example, Spitzer Galactic Legacy Infrared Mid-Plane Survey Extraordinaire — GLIMPSE Benjamin et al. 2003 and MIPS Inner Galactic Plane Survey — MIPSGAL Carey et al. 2005, Herschel Pilbratt et al. 2010 infrared Galactic Plane Survey — Hi-GAL Molinari et al. 2016, Wide Field Infrared Survey Explorer — WISE Wright et al. 2010). The results of these surveys are now actively used in the study of star-forming regions.
Another type of such work is surveys of samples of objects selected according to certain criteria, which may represent various types of star-forming regions or may be indicators of such regions. Surveys are carried out in the continuum at millimeter and submillimeter wavelengths, as well as in the lines of common molecules such as CO, CS, NH3, HCN, HCO+, N2H+ and some others. As a prominent example of such studies, one can note a series of works by Philip Myers and co-authors on the study of dense cores in dark clouds, carried out quite a long time ago (Myers et al., 1983; Myers and Benson, 1983; Myers, 1983; Benson and Myers, 1983; Myers et al., 1988, 1991; Fuller and Myers, 1992; Goodman et al., 1993; Vilas-Boas et al., 1994; Ladd et al., 1994; Benson et al., 1998; Vilas-Boas et al., 2000; Caselli et al., 2002; Myers, 1985; Benson and Myers, 1989; Goodman et al., 1990). As a result of these works, the main physical characteristics of such cores were determined, the chemical composition was studied, and the correlations between the parameters were studied.
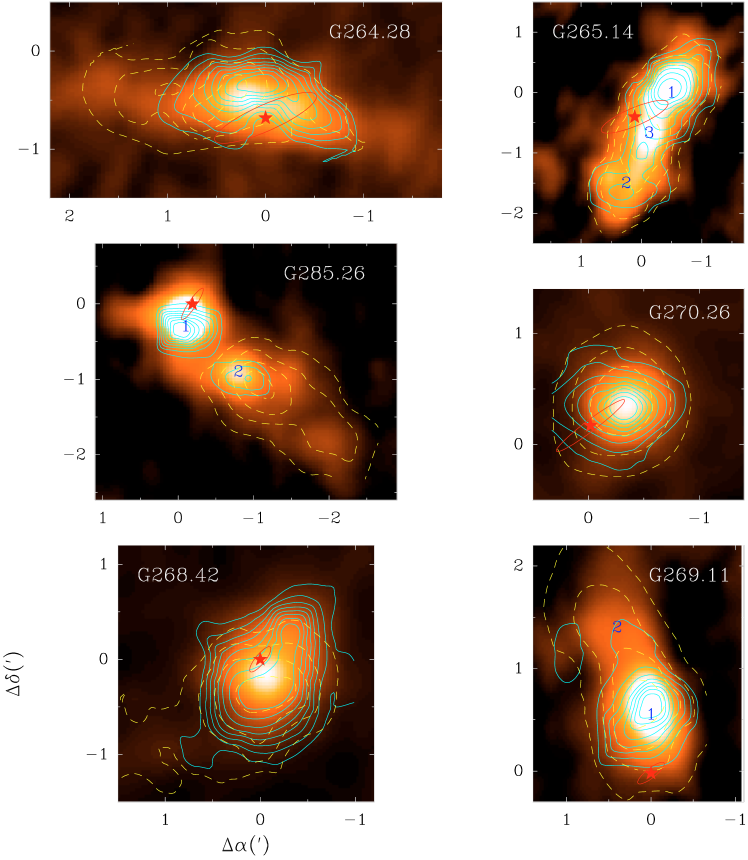
In these dark clouds, stars of low mass form, of the order of the mass of the Sun and less. Similar work has been carried out and is being carried out in the direction of HMSF regions. Among the many works on surveys of such areas, we note a series of our studies that began in the 80s of the last century on the RT-22 of the Crimean Astrophysical Observatory (Burov et al., 1988; Zinchenko et al., 1989, 1990) and then continued on various instruments worldwide (Zinchenko et al., 1994, 1995; Zinchenko, 1995; Pirogov et al., 1996; Zinchenko et al., 1997; Lapinov et al., 1998; Zinchenko et al., 1998, 2000; Pirogov et al., 2003, 2007; Zinchenko et al., 2009; Zinchenko and Henkel, 2018). In these papers, surveys were made of several dozen HMSF regions in the lines of such molecules as HCN, HCO+, CS, NH3, N2H+, HNCO, C18O, SO, etc. An example of such a survey is presented in Fig. 1. This made it possible to obtain statistical distributions of the main physical parameters for these objects, in particular, sizes, masses, density, velocity dispersion. The kinetic temperature of the gas was estimated from the observations of NH3 and CH3CCH (Zinchenko et al., 1997; Malafeev et al., 2005; Malafeev and Zinchenko, 2006).
One of the interesting results was the discovery of a decrease in the average cloud density with increasing galactocentric distance (Zinchenko, 1995; Zinchenko et al., 1998). Similar changes in the properties of the interstellar gas were also noted in other papers. For example, Sakamoto et al. (1997) found a strong decrease in the ratio of CO line intensities and with distance from the center of the Galaxy, which most likely indicates a decrease in gas density (and possibly temperature). Such studies are best, of course, carried out on the basis of observations of neighboring galaxies. Observations of HCN and HCO+ in M31 (Brouillet et al., 2005) demonstrate a noticeable drop in the intensity ratios and with increasing galactocentric distance, which is interpreted as a result of changing the excitation conditions of molecules. With the advent of new tools, such work can give new important results.
3 The earliest phases of massive star formation
Various criteria can be used to identify the early stages of massive star formation. Shortly after the appearance of IRAS survey data, Wood and Churchwell (1989) proposed a method for identifying massive stars embedded in molecular clouds (i.e., at a relatively early stage of evolution) by their emission spectrum in the far IR range (based on the so-called “two-color diagrams”. A characteristic spectrum is given by the ultracompact H ii zones associated with these stars.
Further it was shown that earlier stages can be marked by maser emission of some molecules (H2O, CH3OH) (Plume et al., 1997; Walsh et al., 1997). A number of surveys of maser sources in the lines of various molecules, including ours (Zinchenko et al., 1995, 1998), have been carried out, which made it possible to determine the main characteristics of molecular clumps associated with these masers.
A number of authors (e.g. Molinari et al., 1996; Sridharan et al., 2002) proposed to use approximately the same IR colors criterion, but with the additional condition of the absence of radio emission in the continuum at relatively low frequencies (which is usually generated due to bremsstrahlung of ionized gas). Thus, one can hope to identify objects that are at the stage preceding the formation of the ultracompact H ii zone.
Samples of objects that meet these criteria have been actively studied, but it is obvious that in all of them the process of star formation is already underway. And one would like to find for massive stars some kind of pre-stellar cloud, where it has not yet begun. For low-mass stars, such prestellar objects are dark cold clouds, which are located relatively close to us (100 pc) and are observed in optics as dark dips against the background of stars. More than 20 years ago, infrared dark clouds were discovered, which are probably the objects where stars of large mass will be formed in the future or are already beginning to form.
In much of the infrared range, observations from the Earth’s surface are practically impossible. Infrared astronomy began to develop actively only with the advent of appropriate space facilities. In the mid-1990s, images of a significant part of the Galactic plane were obtained in the mid-IR range. These images revealed a large amount of dark details (Perault et al., 1996; Egan et al., 1998), which, obviously, were created by fairly dense cold clouds that absorb background radiation from the disk of the Galaxy. It was immediately suggested that they are the sought-after massive prestellar objects in which stars of high mass can form. In recent years, infrared dark clouds (IRDC) have been the subject of detailed studies in various wavelength ranges, thanks to which their main physical characteristics and chemical composition have been determined.
The first molecular observations of infrared dark clouds (in formaldehyde lines (Carey et al., 1998)) showed that they are far from us – at distances from 1 to 8 kpc, and their sizes range from 0.4 to 15 pc. Formaldehyde excitation analysis gave density ( cm-3) and temperature ( K) estimates.
Further studies in the continuum and in molecular lines made it possible to refine the values of the physical parameters of the clouds. It was found, in particular, that their masses are from hundreds to thousands of solar masses, the H2 column density is from 2 to cm-2 (e.g. Rathborne et al., 2006; Vasyunina et al., 2009; Ragan et al., 2009).
Reliable temperature estimates (10–20 K) have been obtained from observations of lines of ammonia (Pillai et al., 2006), which, like a number of other molecules of the symmetrical top type, is a good indicator of temperature in dense interstellar clouds. The linewidths, which are determined by the dispersion of gas velocities, range from 0.5 to 3 km s-1 in IRDC (e.g. Vasyunina et al., 2011). In terms of this parameter, infrared dark clouds occupy an intermediate position between cold dark clouds of low mass and warm massive clouds that already contain high-luminosity young stars.
Much attention is paid to the study of the chemical composition of infrared dark clouds. Features of this composition may indicate their evolutionary status, since this composition must change over time. The results of these studies are somewhat contradictory so far. Based on very low values of the abundance ratio CCS/N2H+, Sakai et al. (2008) concluded that infrared dark clouds are at a later stage of chemical evolution than prestellar low-mass clouds. At the same time, Gibson et al. (2009), from the analysis of data on the abundance of C18O, CS and N2H+, found that the chemical age of clouds is small and in some cases does not exceed 100 years. Studies of 15 infrared dark clouds in the lines of 13 different molecules Vasyunina et al. (2011) have shown that they are closer in chemical composition to low-mass prestellar clouds than to massive protostellar objects (clouds containing young massive stars).
Many Infrared Dark Clouds are filamentous (Schisano et al., 2020). Filamentous structures have long been observed and studied in the interstellar medium (see, for example, reviews in André et al., 2014; Myers, 2009). They are visible in optical images of dark nebulae, in the structure of clouds of neutral atomic hydrogen observed in the 21 cm line, in molecular clouds of various types.
In recent years, thanks to the emergence of a large amount of new observational data, primarily obtained from the Herschel space observatory (Pilbratt et al., 2010), it has become clear that interstellar filaments play a key role in the formation of stars (André et al., 2014). The formation of filaments apparently precedes the onset of active star formation, since a filamentous structure is also observed in clouds where there are no signs of this process (for example, Polaris Flare – Ward-Thompson et al., 2010).
Studies of filaments at the Herschel observatory were limited to objects relatively close to us. Subsequently, investigations of filamentous structures on the scales of the Galaxy were carried out, in particular, based on the analysis of data from the ASTROGAL survey (Li et al., 2016). In this work, about 500 filamentous structures were identified at distances up to kpc. To select filaments on extended maps of interstellar clouds, automated algorithms such as getfilaments (Men’shchikov, 2013) are usually used.
The observed filaments exhibit a wide range of physical parameters. At the same time, a characteristic feature of filaments in clouds close to us is the constancy of their width ( pc) in different objects (André et al., 2014). However, the more distant filaments identified in the Li et al. (2016) survey mentioned above have, on average, a substantially larger width pc. At the same time, much narrower structures with a width of pc have also been identified in the Orion Nebula (Hacar et al., 2018). In addition, some filaments have been found to be composed of many smaller fibers whose properties vary considerably (Hacar et al., 2013). Some of these small filaments are actively star-forming, while others are not.
Almost perpendicular to the main filaments, thinner similar formations often adjoin, which are called striations. Polarization measurements show that the magnetic field, as a rule, is oriented perpendicular to the main filaments and, accordingly, parallel to the striations (André et al., 2014). It is assumed that along these striations there is an influx of substance onto the filaments. There are even smaller similar formations that can be called “strands” (Cox et al., 2016). For the Musca filament studied in detail, the column density of hydrogen is cm-2 for the main filament, cm-2 for striations, while for strands it takes intermediate values cm-2 (Cox et al., 2016).
The radial filament density profile is well described by the Plummer function:
| (1) |
where is the central density and is the radius of the central flat part. Such a profile is obtained by solving the problem of hydrostatic equilibrium of an infinite self-gravitating isothermal cylinder (Stodólkiewicz, 1963; Ostriker, 1964). The theoretical value of for an isothermal cylinder is 4. At the same time, observations give values close to 2 (André et al., 2014). The reason for the discrepancies may be the non-isothermal nature of the filaments. The value of is
| (2) |
where is the speed of sound, is the gravitational constant, is the surface density (Larson, 1985; Hartmann, 2002).
The gravitational stability of filaments is determined by the amount of mass per unit length. The critical value of this parameter is
| (3) |
Taking into account non-thermal motions, the speed of sound should be replaced by (Fiege and Pudritz, 2000). Filaments whose mass per unit length exceeds the critical value fragment and collapse. Jeans length along the axis is (Larson, 1985; Hartmann, 2002)
| (4) |
For a more realistic description of filaments, it is also necessary to take into account the external pressure (Fischera and Martin, 2012). In some cases, the observations are well described by the model of a pressure-limited filament surrounded by a low-density shell (Kainulainen et al., 2016).
It was noted above that when the critical value of mass per unit length is exceeded, the process of its fragmentation can begin to develop in the filament. Such a phenomenon is actually observed in interstellar filaments at different scales (for example, André et al., 2010; Offner et al., 2014; Sánchez-Monge et al., 2014; Beuther et al., 2015; Samal et al., 2015; Kainulainen et al., 2017; Lu et al., 2018; Ryabukhina et al., 2018). In some cases, there are signs of longitudinal collapse of the substance in the filaments (Hacar et al., 2013; Peretto et al., 2014; Hacar et al., 2017; Kirsanova et al., 2017; Ryabukhina et al., 2018; Ryabukhina and Zinchenko, 2021). Fragmentation of filaments may be the key to understanding the initial mass function of stars, since it allows explaining the position of the peak and the shape of this function (André et al., 2010, 2017).
An example of our study of the filamentous IRDC G351.78–0.54 is shown in Fig. 2 (Ryabukhina and Zinchenko, 2021). The total mass of the filament is estimated at M⊙. The mass per unit length ( = 529 M⊙/pc) is close to the critical value. However, both values represent upper limits. The presence of several dense clumps along the filament shows that the process of fragmentation is going on. Six dense clumps are identified in the N2H+ (3–2) map. All clumps except one appear gravitationally unstable.
Observations show that in some cases the process of star formation proceeds faster at the ends of filaments (Beuther et al., 2015; Kainulainen et al., 2016; Dewangan et al., 2019), which may be due to the acceleration of matter in these regions (Clarke and Whitworth, 2015).
In many cases, the most active star formation is observed at the intersections of the filaments. There are indications that this process may be initiated by filament collision (e.g. Nakamura et al., 2014; Fukui et al., 2015; Dewangan et al., 2017). In addition, Myers (2009) drew attention to the fact that many star-forming regions have a structure that can be described as a “hub” (an object with an increased radial density of matter and an axes ratio close to unity) and filaments. In this work, a model was proposed for the formation of such structures, in which it develops from an initially inhomogeneous medium of low density, which is compressed into a self-gravitating layer under the influence of external factors. The filamentous structure arises under the action of shock waves associated with compression or gravitational instabilities.
In general, numerous studies show that filaments naturally arise as a result of supersonic turbulence and shock waves (e.g. André et al., 2014; Inoue et al., 2018). They can also arise as a result of fragmentation of planar structures (for example, shells around H ii zones, old supernova remnants, etc.). A number of papers consider the mechanisms of formation of “striations” adjacent to filaments. A recent analysis of several possible mechanisms has shown that the most probable is the nonlinear interaction of MHD waves (Tritsis and Tassis, 2016).
4 General structure of HMSF regions
The general structure of HMSF regions is usually very complicated. They may contain many dense cores, filamentary structures, H ii regions, outflows. There are numerous investigations of such regions. Here we briefly describe several regions covered by our studies.
4.1 S187
The S187 H ii region (Fig. 3) at a distance of 1.40.26 kpc from photometry (Russeil et al., 2007) or 0.9 kpc from Gaia DR2 data is surrounded by a molecular and atomic gas shell (Joncas et al., 1992; Arvidsson and Kerton, 2011). A number of young stellar objects and molecular masers were detected towards the shell (Kang et al., 2017; Richards et al., 2012; Engels and Bunzel, 2015; Valdettaro et al., 2001), indicating ongoing star formation. The 1.2 mm continuum map and data on C18O, CS, C34S, HCN, H13CN, HNC, HN13C, HCO+, H13CO+, N2H+ molecular emission are presented by Zinchenko et al. (2009).
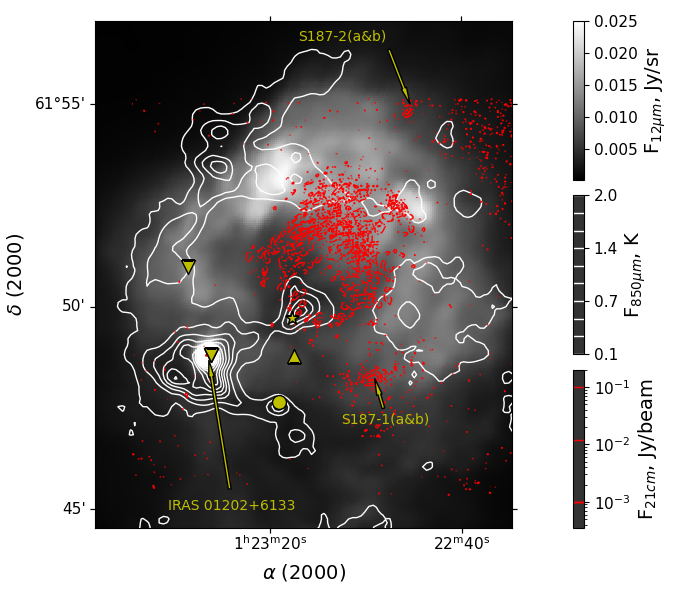
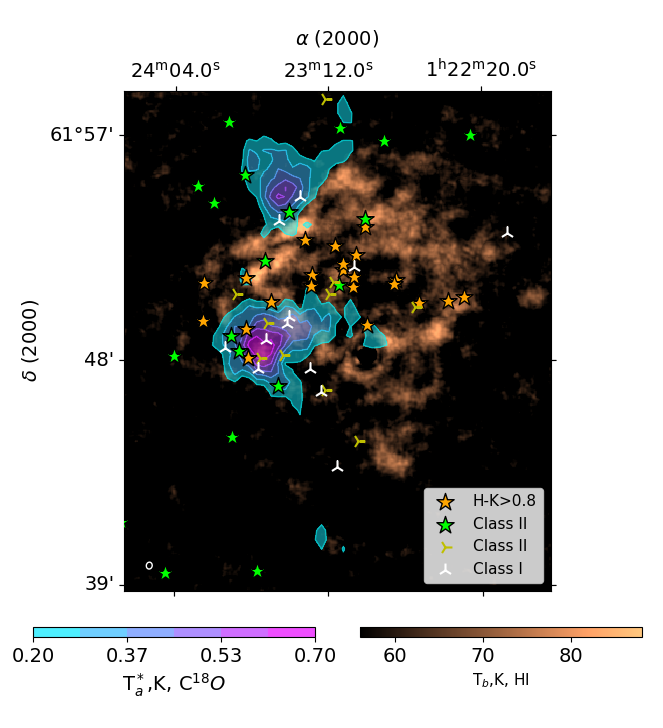
Recently we performed a detailed high resolution study of this region in the H i line at 21 cm with the Indian Giant Metrewave Radio Telescope (GMRT) (Zemlyanukha et al., 2022). The achieved angular resolution is 8 arcsec (0.06 pc), which is the highest resolution available of the H i emission observations of Galactic regions. Such observations are challenging due to a large amount of atomic hydrogen on the line of sight. Main parameters (mass, spin temperature) of the atomic gas were determined. It was found that the atomic shell is highly inhomogeneous (Fig. 3) and contains 100 fragments of median mass around 1.1 M⊙. The index of the mass-size power-law relationship is 2.33–2.6, which is close to values for molecular gas clumps and clouds. Two molecular cores at different stages of evolution are identified. The data indicate an interaction between the atomic shell and the molecular core.
4.2 S255
The distance to the S255 star-forming region derived from the annual parallax measurements of water masers is kpc (Burns et al., 2016). It looks as a ridge of the molecular and dust emission sandwiched between the two evolved H ii regions S255 and S257 (Fig. 4.
The NIR observations show that the sources associated with the gas ridge are younger than the sources outside the gas ridge, which hints at induced star formation (Ojha et al., 2011). This ridge contains two major clumps, S255IR and S255N (e.g. Wang et al., 2011; Zinchenko et al., 2012). Both of these clumps represent sites of massive star formation and contain several dense cores. Detailed studies of these clumps are presented in Zinchenko et al. (2015); Zinchenko et al. (2018a, b); Zinchenko et al. (2020); Liu et al. (2018, 2020); Zemlyanukha et al. (2018).
In S255IR the ALMA observations reveal a very narrow (1000–1800 AU) and dense ( cm-3 assuming the cylindrical geometry) filamentary structure with at least two velocity components (Zinchenko et al., 2020). The mass estimated from the continuum emission is about 35 M⊙. Two star-forming cores are apparently associated with this structure. There are molecular outflows originating in these cores (see Sect. 5.2). The most massive core, S255IR-SMA1, contains a 20 M⊙ protostar, which shows signs of episodic accretion. It is surrounded by a rotating and infalling envelope. Several new low-mass prestellar cores are discovered.
The S255N clump contains several large fragments at different velocities (Zemlyanukha et al., 2018). The central core, S255N-SMA1, is resolved into two components with significantly different temperatures (150 K and 25 K). The bipolar outflow is associated with the hot source. It is surrounded by a large torus (Sect. 5.2). There are several other cores with very young outflows in this area.
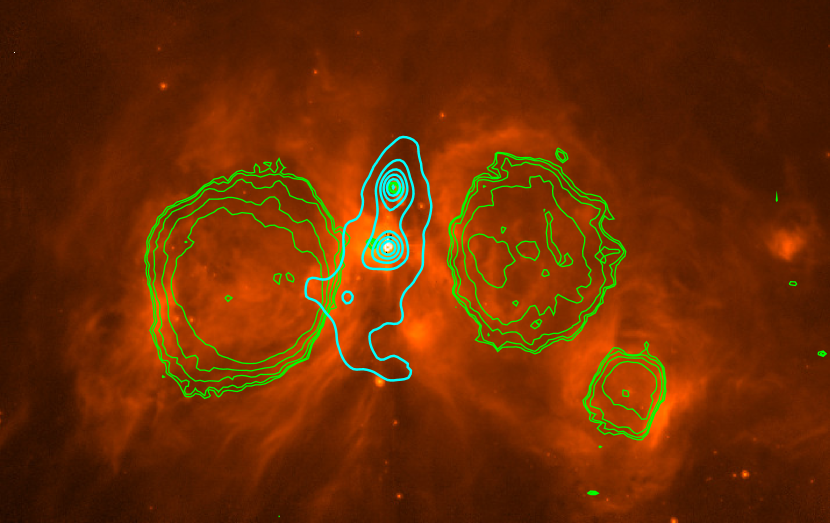
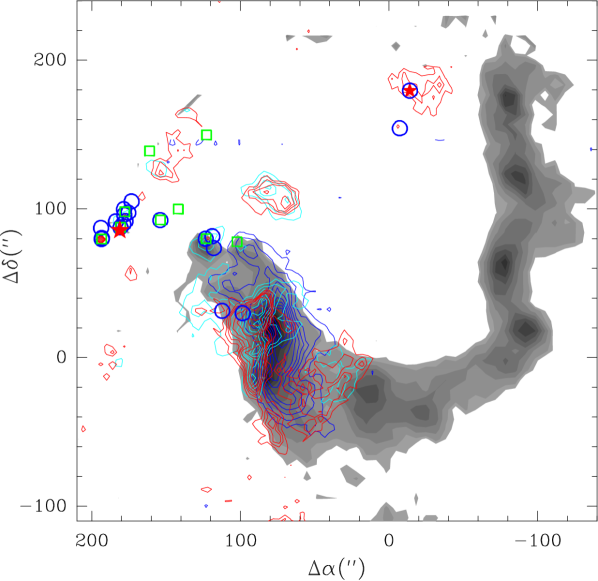
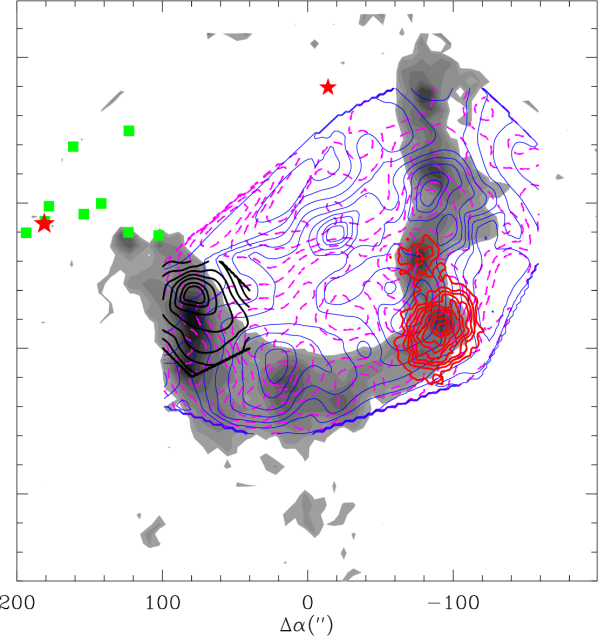
4.3 W40
The nearby H ii region W40 was investigated in detail by Mallick et al. (2013); Pirogov et al. (2013). The data include the dust continuum, line molecular emission and observations of the ionized gas. A clumpy dust ring is revealed (Fig. 5), which is probably formed by the collect-and-collapse process due to expansion of the neighbouring H ii region. Nine dust clumps in the ring have been identified. The distributions of the dust and molecular emission are very different and a strong molecular chemical differentiation is observed. Molecular and electron abundances in different parts of the source are estimated. There are signs of triggered star formation in a part of the ring.
4.4 W42
The W42 region at a distance of 3.8 kpc contains a rare O-type protostar W42-MME (mass: 194 M⊙). The area around this protostar was investigated in various molecular lines and in continuum with the Atacama Large Millimeter/ submillimeter Array (ALMA), Submillimeter Array, and Very Large Array at a high angular resolution of 03–35 (Dewangan et al., 2022).
The data show no H ii zone around W42-MME, which confirms its protostellar nature. There is an elongated structure with a signature of Keplerian rotation in the center, associated with the bipolar molecular outflow observed in the CO and SiO lines. However the angular resolution is insufficient to resolve the probable disk. Several knots of the SiO emission hint at episodic ejections. The temperature estimates from the CH3CN observations (220 K) indicate the presence of a hot core. The core hosting W42-MME appears to gain mass from the envelope and also from the immediate surrounding cores.
5 Prestellar and protostellar cores, disks and bipolar outflows
5.1 Properties of dense cores
Ultimately, the process of star formation occurs in the so-called dense cores, which can be formed, for example, as a result of the fragmentation of interstellar filaments. In Section 2 we described the search and study of such cores. At present, a certain classification of such cores has been developed, based on the data on the presence of (proto)stellar objects in them and on their spectral characteristics. It has been developed in most detail for cores in low-mass star formation regions. They are usually divided into several main categories: starless, prestellar, protostellar (di Francesco et al., 2007). Prestellar, unlike stellarless ones, are gravitationally bound and can later form a protostar. In protostellar, such a protostar already exists. For protostellar cores, there is a well-established division into 4 classes - from Class 0 to Class III, based on their spectral characteristics and obviously corresponding to the evolutionary sequence (Lada, 1987; Andre et al., 1993, 2000).
A lot of effort has gone into searching for massive prestellar cores (with a mass of M⊙ within a radius of pc) that could form a massive protostar. The discovery of such cores could serve as an argument in support of the monolithic collapse model during the formation of massive stars. So far, only a few candidates for such cores have been discovered (Louvet, 2018). The absence of a noticeable number of massive prestellar cores can be explained by their short lifetime, on the order of free fall time.
Many works are devoted to the study of statistical distributions of the parameters of cores. In particular, the mass distribution of low-mass prestellar cores is very similar to the initial mass function of stars (André et al., 2010). This indicates an approximately constant star formation efficiency across the mass spectrum. The core mass function itself can be explained by filament fragmentation, taking into account turbulence (André et al., 2017).
Of great importance for understanding the processes in interstellar clouds are the so-called Larson’s laws, obtained by him from the analysis of observational data in the early 80s (Larson, 1981). The first one is the relation between velocity dispersion and size, , where . The second law says that clouds are gravitationally bound, the virial parameter . According to the third law, the column density in clouds is approximately the same. These relations are not independent, each of them follows from the other two. These ratios are most likely a consequence of turbulence in interstellar clouds.
Larson’s laws were originally derived for giant molecular clouds and their applicability to dense clumps was investigated separately. It was found in Fuller and Myers (1992); Caselli and Myers (1995) that the Larson relation between nonthermal velocity dispersion and size is well satisfied for dense cores in dark clouds.
As for massive cores, the results here are rather contradictory. Caselli and Myers (1995) derived the exponent for . Plume et al. (1997) did not find any relationship between velocity dispersion and size, while Pirogov and Zinchenko (1998) obtained the exponent .
The radial density profile for cores in dark clouds is well described by the Bonnor-Ebert model, with starless cores close to the Bonnor-Ebert critical sphere, and protostellar cores corresponding to the supercritical case (Alves et al., 2001; Kirk et al., 2005; McKee and Ostriker, 2007). Similar results were also obtained for massive cores (Pirogov, 2009).
The radial gas temperature profile for several massive cores was investigated by Zinchenko et al. (2005); Malafeev and Zinchenko (2006) on the basis of CH3CCH observations. They found that it can be fitted by a power law with –0.3 … –0.4 indices. This dependence is in agreement with the theoretically expected one for a centrally heated optically thin cloud. The dust temperature profiles were analyzed recently by Pirogov (2022). He found that they are also consistent with heating by the central source.
5.2 Observations of disks and bipolar outflows
At present, it is generally accepted that the formation of stars with a mass of the order of the sun occurs by disk accretion of matter, accompanied by bipolar outflows. There are observations of a large number of disks in low mass star formation regions (e.g. Andrews and Williams, 2005, 2007). There are also observations of disk candidates or toroidal structures around several dozen massive protostars (Beltrán and de Wit, 2017), although convincing cases are still very rare. High-velocity bipolar outflows are observed everywhere. A detailed review of their characteristics and models is presented in Arce et al. (2007).
Of particular interest are observations of disks and outflows in HMSF regions, since they allow a better understanding of the mechanism of formation of such stars. This mechanism is still unclear and is actively debated (e.g. McKee and Ostriker, 2007; Tan et al., 2014). The main models discussed are the monolithic collapse of a massive dense core and competitive accretion. Quite exotic models are proposed, in which massive stars are formed by merging stars of smaller mass (Bonnell et al., 1998).
Recently, several events have been recorded that support disk accretion as a mechanism for the formation of stars with masses up to at least 20 M⊙. The first two are outbursts of the luminosity of objects NGC6334I-MM1 (Hunter et al., 2017) and S255IR NIRS3/SMA1 (Caratti O Garatti et al., 2017; Liu et al., 2018). They were accompanied by maser bursts (Fujisawa et al., 2015; Moscadelli et al., 2017; Zinchenko et al., 2017a; Hunter et al., 2018). These events have been interpreted as the result of episodic accretion of matter onto a central massive protostar, similar to that observed in the formation of low-mass stars, but on a much larger scale. This roughly corresponds to some theoretical models of fragmented disks around massive protostars (Meyer et al., 2017).
Another example of a disk-outflow system around a massive YSO, which shows signs of episodic accretion, is the O-type protostar W42-MME (Dewangan et al., 2022).
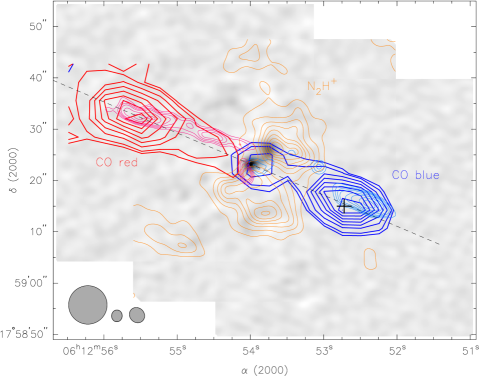
For S255IR NIRS3/SMA1, modeling with radiative transfer calculations the kinematics of the CH3CN gas shows that the CH3CN emission is best described by a flattened rotating envelope with infalling motion (Liu et al., 2020). A mass infall rate of a few M⊙ yr-1 is derived. This object drives a fast collimated jet and a molecular outflow with a wide opening angle, surrounded by dense walls observed in the C34S line (Zinchenko et al., 2020). There is another outflow from the nearby SMA2 core. The large-scale view of these outflows is presented in Fig. 6.
A combination of a fast jet and a slower outflow has been rarely observed in HMSF regions (e.g., Torrelles et al., 2011), while it is known in low-mass stars (e.g., Arce et al., 2007) and theoretical models of such event have been developed. In addition to S255IR NIRS3/SMA1, another example of such combination was discovered recently in MYSO G18.88MME (Zinchenko et al., 2021). The gas density in the fast component is very high since a rather strong HC3N emission is observed in the high velocity gas. The critical density for this transition is cm-3. Both components seem to be rotating and, if this interpretation of the transverse velocity gradient is correct, the specific angular momentum for the fast component is very high, AU km s-1.
Rotating structures around very massive stars may represent toroids (e.g. Cesaroni et al., 2007; Beltrán et al., 2011; Beltrán and de Wit, 2016). A large torus with the inner radius of 8000 AU and the outer radius of 12000 AU was identified in the S255N region by Zemlyanukha et al. (2018). They argue that it plays an important role in the process of mass accumulation by the central protostar.
6 Chemistry in high-mass star-forming regions
6.1 Chemical differentiation
Maps of star-forming regions (and HMSF regions in particular) in lines of different molecules are frequently very different. Although these differences can be partly caused by different excitation of these molecules and opacity effects, in most cases they reflect variations of relative molecular abundances. This molecular chemical differentiation can be related to variations of the physical parameters and to evolution of the chemical content with time. Examples of such differentiation in our observations are presented in Zinchenko et al. (2005, 2009, 2011); Zinchenko et al. (2018b); Zinchenko et al. (2022); Lintott et al. (2005); Pirogov et al. (2007, 2013).
In particular, it was found that the CS emission correlates well with the dust continuum emission, while the N2H+ intensity drops towards the CS peaks (associated with luminous IR sources) for most of the HMSF regions, which can be due to an N2H+ abundance decrease (Pirogov et al., 2007). A drop of the N2H+ abundance towards the luminous IRAS source in the filamentary IRDC G351.78–0.54 was reported recently by Ryabukhina and Zinchenko (2021). Zinchenko et al. (2009) found that the abundances of CO, CS and HCN are more or less constant, while the abundances of HCO+, HNC and especially N2H+ strongly vary in HMSF regions. They anticorrelate with the ionization fraction and as a result decrease towards the embedded YSOs. For N2H+ this can be explained by dissociative recombination to be the dominant destroying process.
A strong chemical differentiation in the W40 region (Sect. 4.3) was reported by Pirogov et al. (2013). The CS abundance is enhanced towards the eastern dust clump 2, while the NH3, N2H+ and H13CO+ abundances are enhanced towards the western clumps. HCN and HCO+ do not correlate with the dust, probably tracing the surrounding gas.
6.2 Deuteration
The effect of deuterium fractionation in dense interstellar clouds (i.e., an increase of the relative abundance of deuterated molecules) has been investigated for a long time already. It is explained by the exothermicity of the reactions of replacing a proton with deuteron in molecules, which underlie the chains of the chemical reactions leading to the formation of most other molecules, at first H (e.g. Roueff et al., 2007). In addition, at low temperatures, freezing of molecules which destroy H2D+, in particular CO, on dust grains is important, as well as the decreased ionization degree which reduces the recombination rate of H2D+.
This effect is temperature dependent and has been mostly investigated in cold clouds. however recent studies show that it is rather efficient in warmer clouds, where massive stars form (e.g. Gerner et al., 2015). In order to investigate it in HMSF regions in more detail we performed a survey of about 50 such regions in the lines of deuterated molecules at 3–4 mm with the 20-m Onsala radio telescope (Trofimova et al., 2020). The transitions of DCN, DNC, DCO+, N2D+ and the ortho-NH2D line were observed. DCO+, DCN, DNC and NH2D were detected in about 1/3 of the observed sources, while N2D+ was only seen in two. The dependencies of the abundances of these molecules on temperature and velocity dispersion were analyzed taking into account data represented by upper and lower limits. A statistically significant decrease of the DCO+ abundance with increasing temperature was found, while the DCN abundance remains nearly constant. There is a noticeable decrease of the DCO+ abundance with increasing line width. The DCN/HCN ratio is 10-2 for the sources detected in the DCN line and remains nearly constant in the temperature range K. The NH2D/NH3 ratio also remains practically constant (10-2) in this temperature range (Trofimova et al., in preparation), which contradicts the chemical model for ammonia deuteration presented in Roueff et al. (2005), predicting its drop to at 50 K.
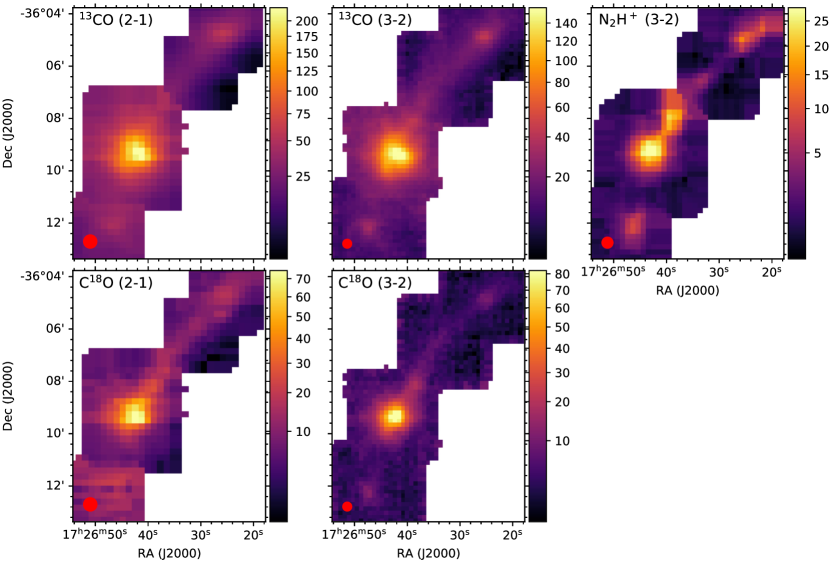
Later several sources were mapped in these lines and in the lines of higher transitions of these molecules at 2 mm with the 30-m IRAM radio telescope (Zinchenko et al., 2022). These maps show significant differences between distributions of the targeted molecules (see an example in Fig. 7).
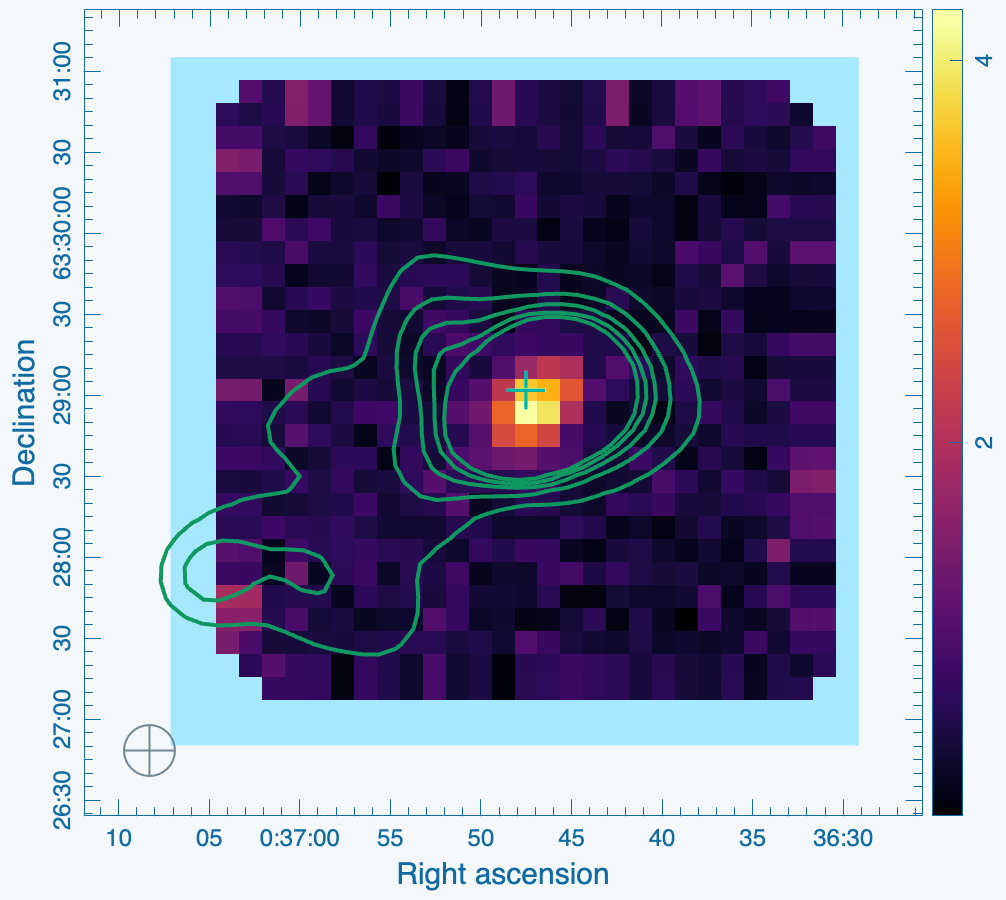
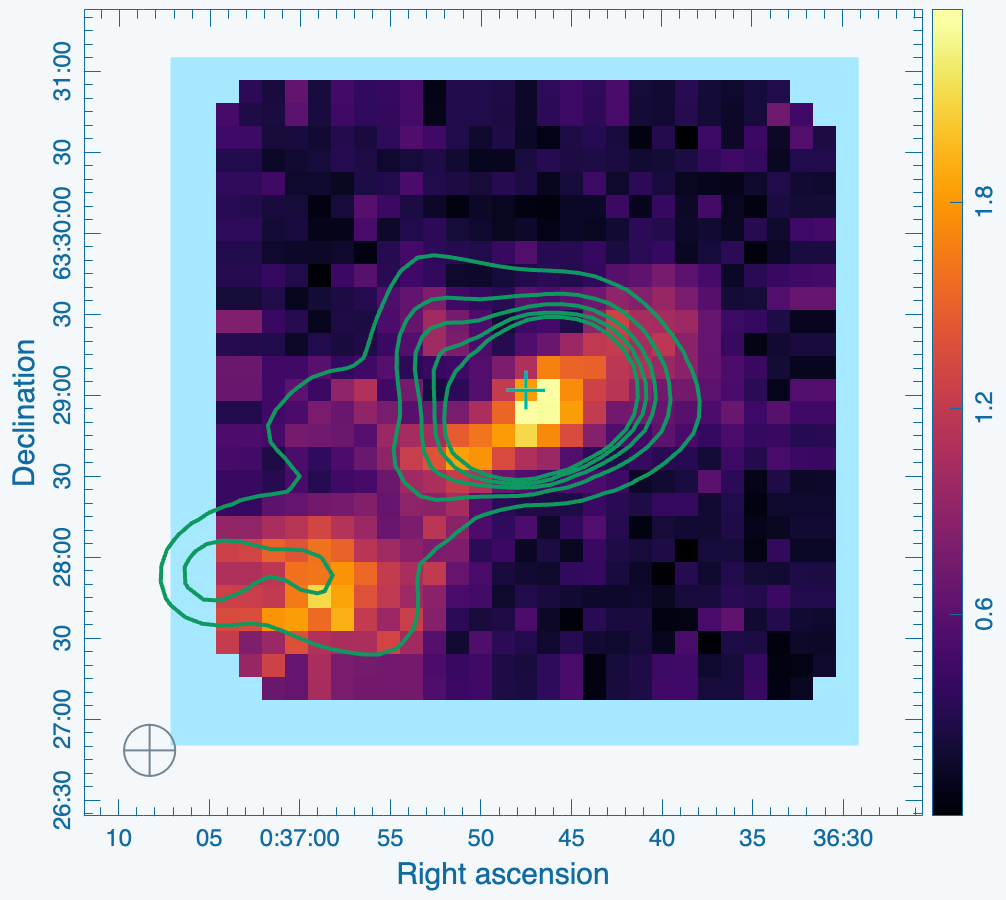
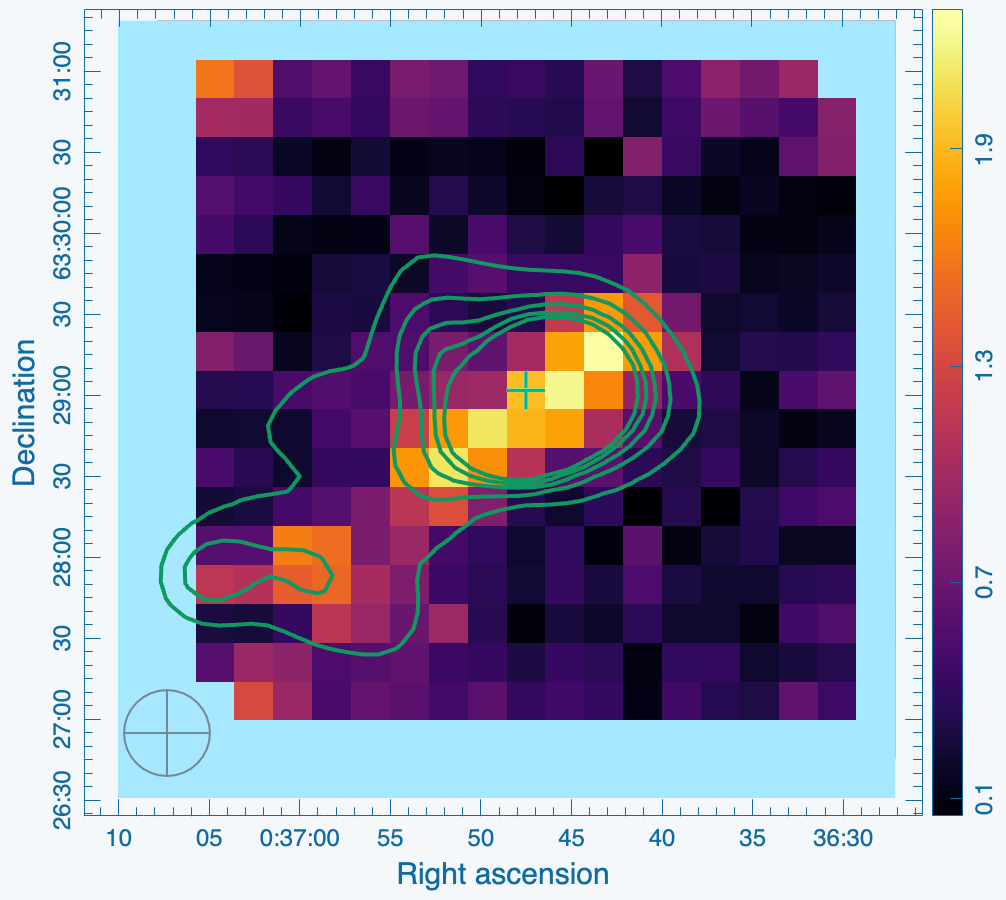
In general, the DCN peaks are observed towards the temperature peaks, which coincide with locations of luminous IR sources, while other deuterated molecules trace colder regions. We derived the gas volume density and molecular column densities from the and transitions of DCN, DNC and DCO+ by non-LTE modeling with RADEX. Then, deuteration degrees for these species were obtained. The deuteration degrees for HCO+ and HNC drop with increasing temperature, while for HCN it is more or less constant.
7 Conclusions
Studies of high mass star formation remain a hot topic of astrophysical research. There are many open questions in this area and the general scenario of this process is still under debate. New facilities provide an inflow of new important data, which creates good prospects for new discoveries.
This research was partly supported by the IAP RAS state program 0030-2021-0005 and by the Russian Science Foundation grant No. 22-22-00809 (Sect. 6).
References
- Aguirre et al. (2011) Aguirre J.E., Ginsburg A.G., Dunham M.K., et al. (2011) ApJS192, 4
- Alves et al. (2001) Alves J.F., Lada C.J., Lada E.A. (2001) Nature409, 159
- André et al. (2014) André P., Di Francesco J., Ward-Thompson D., et al. (2014) In: Protostars and Planets VI, eds. H. Beuther, R.S. Klessen, C.P. Dullemond, T. Henning. 27
- André et al. (2017) André P., Könyves V., Arzoumanian D., et al. (2017) Mem. Soc. Astron. Italiana88, 521
- André et al. (2010) André P., Men’shchikov A., Bontemps S., et al. (2010) A&A518, L102
- Andre et al. (1993) Andre P., Ward-Thompson D., Barsony M. (1993) ApJ406, 122
- Andre et al. (2000) Andre P., Ward-Thompson D., Barsony M. (2000) In: Protostars and Planets IV, eds. V. Mannings, A.P. Boss, S.S. Russell. 59
- Andrews and Williams (2005) Andrews S.M., Williams J.P. (2005) ApJ631, 1134
- Andrews and Williams (2007) Andrews S.M., Williams J.P. (2007) ApJ659, 705
- Arce et al. (2007) Arce H.G., Shepherd D., Gueth F., et al. (2007) In: Protostars and Planets V, eds. B. Reipurth, D. Jewitt, K. Keil. 245
- Arvidsson and Kerton (2011) Arvidsson K., Kerton C.R. (2011) AJ141, 153
- Beltrán et al. (2011) Beltrán M.T., Cesaroni R., Neri R., et al. (2011) A&A525, A151
- Beltrán and de Wit (2016) Beltrán M.T., de Wit W.J. (2016) A&A Rev.24, 6
- Beltrán and de Wit (2017) Beltrán M.T., de Wit W.J. (2017) Mem. Soc. Astron. Italiana88, 581
- Benjamin et al. (2003) Benjamin R.A., Churchwell E., Babler B.L., et al. (2003) PASP115, 953
- Benson et al. (1998) Benson P.J., Caselli P., Myers P.C. (1998) ApJ506, 743
- Benson and Myers (1983) Benson P.J., Myers P.C. (1983) ApJ270, 589
- Benson and Myers (1989) Benson P.J., Myers P.C. (1989) ApJS71, 89
- Beuther et al. (2015) Beuther H., Ragan S.E., Johnston K., et al. (2015) A&A584, A67
- Bonnell et al. (1998) Bonnell I.A., Bate M.R., Zinnecker H. (1998) MNRAS298, 93
- Brouillet et al. (2005) Brouillet N., Muller S., Herpin F., et al. (2005) A&A429, 153
- Burns et al. (2016) Burns R.A., Handa T., Nagayama T., et al. (2016) MNRAS460, 283
- Burov et al. (1988) Burov A.B., Vdovin V.F., Zinchenko I.I., et al. (1988) Pisma v Astronomicheskii Zhurnal 14, 492
- Caratti O Garatti et al. (2017) Caratti O Garatti A., Stecklum B., Garcia Lopez R., et al. (2017) Nature Physics 13, 276
- Carey et al. (1998) Carey S.J., Clark F.O., Egan M.P., et al. (1998) ApJ508, 721
- Carey et al. (2005) Carey S.J., Noriega-Crespo A., Price S.D., et al. (2005) In: American Astronomical Society Meeting Abstracts, vol. 37 of Bulletin of the American Astronomical Society. 1252
- Caselli et al. (2002) Caselli P., Benson P.J., Myers P.C., et al. (2002) ApJ572, 238
- Caselli and Myers (1995) Caselli P., Myers P.C. (1995) ApJ446, 665
- Cesaroni et al. (2007) Cesaroni R., Galli D., Lodato G., et al. (2007) In: Protostars and Planets V, eds. B. Reipurth, D. Jewitt, K. Keil. 197
- Clarke and Whitworth (2015) Clarke S.D., Whitworth A.P. (2015) MNRAS449, 1819
- Cox et al. (2016) Cox N.L.J., Arzoumanian D., André P., et al. (2016) A&A590, A110
- Csengeri et al. (2014) Csengeri T., Urquhart J.S., Schuller F., et al. (2014) A&A565, A75
- Dame et al. (2001) Dame T.M., Hartmann D., Thaddeus P. (2001) ApJ547, 792
- Dewangan et al. (2017) Dewangan L.K., Ojha D.K., Zinchenko I. (2017) ApJ851, 140
- Dewangan et al. (2019) Dewangan L.K., Pirogov L.E., Ryabukhina O.L., et al. (2019) ApJ877, 1
- Dewangan et al. (2022) Dewangan L.K., Zinchenko I.I., Zemlyanukha P.M., et al. (2022) ApJ925, 41
- di Francesco et al. (2007) di Francesco J., Evans N. J. I., Caselli P., et al. (2007) In: Protostars and Planets V, eds. B. Reipurth, D. Jewitt, K. Keil. 17
- Egan et al. (1998) Egan M.P., Shipman R.F., Price S.D., et al. (1998) ApJ494, L199+
- Engels and Bunzel (2015) Engels D., Bunzel F. (2015) A&A582, A68
- Fiege and Pudritz (2000) Fiege J.D., Pudritz R.E. (2000) MNRAS311, 85
- Fischera and Martin (2012) Fischera J., Martin P.G. (2012) A&A542, A77
- Fujisawa et al. (2015) Fujisawa K., Yonekura Y., Sugiyama K., et al. (2015) The Astronomer’s Telegram 8286
- Fukui et al. (2015) Fukui Y., Harada R., Tokuda K., et al. (2015) ApJ807, L4
- Fuller and Myers (1992) Fuller G.A., Myers P.C. (1992) ApJ384, 523
- Gerner et al. (2015) Gerner T., Shirley Y.L., Beuther H., et al. (2015) A&A579, A80
- Gibson et al. (2009) Gibson D., Plume R., Bergin E., et al. (2009) ApJ705, 123
- Goodman et al. (1990) Goodman A.A., Bastien P., Myers P.C., et al. (1990) ApJ359, 363
- Goodman et al. (1993) Goodman A.A., Benson P.J., Fuller G.A., et al. (1993) ApJ406, 528
- Hacar et al. (2017) Hacar A., Alves J., Tafalla M., et al. (2017) A&A602, L2
- Hacar et al. (2018) Hacar A., Tafalla M., Forbrich J., et al. (2018) A&A610, A77
- Hacar et al. (2013) Hacar A., Tafalla M., Kauffmann J., et al. (2013) A&A554, A55
- Hartmann (2002) Hartmann L. (2002) ApJ578, 914
- Hunter et al. (2017) Hunter T.R., Brogan C.L., MacLeod G., et al. (2017) ApJ837, L29
- Hunter et al. (2018) Hunter T.R., Brogan C.L., MacLeod G.C., et al. (2018) ApJ854, 170
- Inoue et al. (2018) Inoue T., Hennebelle P., Fukui Y., et al. (2018) Publications of the Astronomical Society of Japan 70, S53
- Jackson et al. (2006) Jackson J.M., Rathborne J.M., Shah R.Y., et al. (2006) ApJS163, 145
- Joncas et al. (1992) Joncas G., Durand D., Roger R.S. (1992) ApJ387, 591
- Kainulainen et al. (2016) Kainulainen J., Hacar A., Alves J., et al. (2016) A&A586, A27
- Kainulainen et al. (2017) Kainulainen J., Stutz A.M., Stanke T., et al. (2017) A&A600, A141
- Kang et al. (2017) Kang S.J., Kerton C.R., Choi M., et al. (2017) ApJ845, 21
- Kirk et al. (2005) Kirk J.M., Ward-Thompson D., André P. (2005) MNRAS360, 1506
- Kirsanova et al. (2017) Kirsanova M.S., Salii S.V., Sobolev A.M., et al. (2017) Open Astronomy 26, 99
- Lada (1987) Lada C.J. (1987) In: Star Forming Regions, eds. M. Peimbert, J. Jugaku, vol. 115 of IAU Symposium. 1
- Ladd et al. (1994) Ladd E.F., Myers P.C., Goodman A.A. (1994) ApJ433, 117
- Lapinov et al. (1998) Lapinov A.V., Schilke P., Juvela M., et al. (1998) A&A336, 1007
- Larson (1981) Larson R.B. (1981) MNRAS194, 809
- Larson (1985) Larson R.B. (1985) MNRAS214, 379
- Li et al. (2016) Li G.X., Urquhart J.S., Leurini S., et al. (2016) A&A591, A5
- Lintott et al. (2005) Lintott C.J., Viti S., Rawlings J.M.C., et al. (2005) ApJ620, 795
- Liu et al. (2018) Liu S.Y., Su Y.N., Zinchenko I., et al. (2018) ApJ863, L12
- Liu et al. (2020) Liu S.Y., Su Y.N., Zinchenko I., et al. (2020) ApJ904, 181
- Louvet (2018) Louvet F. (2018) In: SF2A-2018: Proceedings of the Annual meeting of the French Society of Astronomy and Astrophysics. Di
- Lu et al. (2018) Lu X., Zhang Q., Liu H.B., et al. (2018) ApJ855, 9
- Malafeev and Zinchenko (2006) Malafeev S.Y., Zinchenko I.I. (2006) In: ”Star Formation in the Galaxy and Beyond, Proceedings of the Conference ”Star Formation in the Galaxy and Beyond”, held in Moscow, Russia, 17-18 April 2006. Publisher: Moscow: Yanus-K, 2006. Edited by D. S. Wiebe and M. S. Kirsanova, ISBN: 05803703265 (in Russian)”. 29
- Malafeev et al. (2005) Malafeev S.Y., Zinchenko I.I., Pirogov L.E., et al. (2005) Astronomy Letters 31, 239
- Mallick et al. (2013) Mallick K.K., Kumar M.S.N., Ojha D.K., et al. (2013) ApJ779, 113
- McKee and Ostriker (2007) McKee C.F., Ostriker E.C. (2007) ARA&A45, 565
- Men’shchikov (2013) Men’shchikov A. (2013) A&A560, A63
- Meyer et al. (2017) Meyer D.M.A., Vorobyov E.I., Kuiper R., et al. (2017) MNRAS464, L90
- Molinari et al. (1996) Molinari S., Brand J., Cesaroni R., et al. (1996) A&A308, 573
- Molinari et al. (2016) Molinari S., Schisano E., Elia D., et al. (2016) A&A591, A149
- Moscadelli et al. (2017) Moscadelli L., Sanna A., Goddi C., et al. (2017) A&A600, L8
- Motte et al. (2018) Motte F., Bontemps S., Louvet F. (2018) ARA&A56, 41
- Myers (1983) Myers P.C. (1983) ApJ270, 105
- Myers (1985) Myers P.C. (1985) In: Protostars and Planets II, eds. D.C. Black, M.S. Matthews. 81–103
- Myers (2009) Myers P.C. (2009) ApJ700, 1609
- Myers and Benson (1983) Myers P.C., Benson P.J. (1983) ApJ266, 309
- Myers et al. (1991) Myers P.C., Fuller G.A., Goodman A.A., et al. (1991) ApJ376, 561
- Myers et al. (1988) Myers P.C., Heyer M., Snell R.L., et al. (1988) ApJ324, 907
- Myers et al. (1983) Myers P.C., Linke R.A., Benson P.J. (1983) ApJ264, 517
- Nakamura et al. (2014) Nakamura F., Sugitani K., Tanaka T., et al. (2014) ApJ791, L23
- Offner et al. (2014) Offner S.S.R., Clark P.C., Hennebelle P., et al. (2014) In: Protostars and Planets VI, eds. H. Beuther, R.S. Klessen, C.P. Dullemond, T. Henning. 53
- Ojha et al. (2011) Ojha D.K., Samal M.R., Pandey A.K., et al. (2011) ApJ738, 156
- Ostriker (1964) Ostriker J. (1964) ApJ140, 1056
- Perault et al. (1996) Perault M., Omont A., Simon G., et al. (1996) A&A315, L165
- Peretto et al. (2014) Peretto N., Fuller G.A., André P., et al. (2014) A&A561, A83
- Pilbratt et al. (2010) Pilbratt G.L., Riedinger J.R., Passvogel T., et al. (2010) A&A518, L1
- Pillai et al. (2006) Pillai T., Wyrowski F., Carey S.J., et al. (2006) A&A450, 569
- Pirogov et al. (1996) Pirogov L., Lapinov A., Zinchenko I., et al. (1996) Astronomical and Astrophysical Transactions 11, 287
- Pirogov et al. (2013) Pirogov L., Ojha D.K., Thomasson M., et al. (2013) MNRAS436, 3186
- Pirogov et al. (2003) Pirogov L., Zinchenko I., Caselli P., et al. (2003) A&A405, 639
- Pirogov et al. (2007) Pirogov L., Zinchenko I., Caselli P., et al. (2007) A&A461, 523
- Pirogov (2009) Pirogov L.E. (2009) Astronomy Reports 53, 1127
- Pirogov (2022) Pirogov L.E. (2022) arXiv e-prints , arXiv:2208.03166
- Pirogov and Zinchenko (1998) Pirogov L.E., Zinchenko I.I. (1998) Astronomy Reports 42, 11
- Plume et al. (1997) Plume R., Jaffe D.T., Evans II N.J., et al. (1997) ApJ476, 730
- Ragan et al. (2009) Ragan S.E., Bergin E.A., Gutermuth R.A. (2009) ApJ698, 324
- Rathborne et al. (2006) Rathborne J.M., Jackson J.M., Simon R. (2006) ApJ641, 389
- Richards et al. (2012) Richards E.E., Lang C.C., Trombley C., et al. (2012) AJ144, 89
- Rosen et al. (2020) Rosen A.L., Offner S.S.R., Sadavoy S.I., et al. (2020) Space Sci. Rev.216, 62
- Roueff et al. (2005) Roueff E., Lis D.C., van der Tak F.F.S., et al. (2005) A&A438, 585
- Roueff et al. (2007) Roueff E., Parise B., Herbst E. (2007) A&A464, 245
- Russeil et al. (2007) Russeil D., Adami C., Georgelin Y.M. (2007) A&A470, 161
- Ryabukhina and Zinchenko (2021) Ryabukhina O.L., Zinchenko I.I. (2021) MNRAS505, 726
- Ryabukhina et al. (2018) Ryabukhina O.L., Zinchenko I.I., Samal M.R., et al. (2018) Research in Astronomy and Astrophysics 18, 095
- Sakai et al. (2008) Sakai T., Sakai N., Kamegai K., et al. (2008) ApJ678, 1049
- Sakamoto et al. (1997) Sakamoto S., Hasegawa T., Handa T., et al. (1997) ApJ486, 276
- Samal et al. (2015) Samal M.R., Ojha D.K., Jose J., et al. (2015) A&A581, A5
- Sánchez-Monge et al. (2014) Sánchez-Monge Á., Beltrán M.T., Cesaroni R., et al. (2014) A&A569, A11
- Schisano et al. (2020) Schisano E., Molinari S., Elia D., et al. (2020) MNRAS492, 5420
- Schuller et al. (2009) Schuller F., Menten K.M., Contreras Y., et al. (2009) A&A504, 415
- Sridharan et al. (2002) Sridharan T.K., Beuther H., Schilke P., et al. (2002) ApJ566, 931
- Stodólkiewicz (1963) Stodólkiewicz J.S. (1963) Acta Astronomica 13, 30
- Tan et al. (2014) Tan J.C., Beltrán M.T., Caselli P., et al. (2014) In: Protostars and Planets VI, eds. H. Beuther, R.S. Klessen, C.P. Dullemond, T. Henning. 149
- Torrelles et al. (2011) Torrelles J.M., Patel N.A., Curiel S., et al. (2011) MNRAS410, 627
- Tritsis and Tassis (2016) Tritsis A., Tassis K. (2016) MNRAS462, 3602
- Trofimova et al. (2020) Trofimova E.A., Zinchenko I.I., Zemlyanukha P.M., et al. (2020) Astronomy Reports 64, 244
- Valdettaro et al. (2001) Valdettaro R., Palla F., Brand J., et al. (2001) A&A368, 845
- Vasyunina et al. (2009) Vasyunina T., Linz H., Henning T., et al. (2009) A&A499, 149
- Vasyunina et al. (2011) Vasyunina T., Linz H., Henning T., et al. (2011) A&A527, A88
- Vilas-Boas et al. (1994) Vilas-Boas J.W.S., Myers P.C., Fuller G.A. (1994) ApJ433, 96
- Vilas-Boas et al. (2000) Vilas-Boas J.W.S., Myers P.C., Fuller G.A. (2000) ApJ532, 1038
- Walsh et al. (1997) Walsh A.J., Hyland A.R., Robinson G., et al. (1997) MNRAS291, 261
- Wang et al. (2011) Wang Y., Beuther H., Bik A., et al. (2011) A&A527, A32
- Ward-Thompson et al. (2010) Ward-Thompson D., Kirk J.M., André P., et al. (2010) A&A518, L92
- Wood and Churchwell (1989) Wood D.O.S., Churchwell E. (1989) ApJ340, 265
- Wright et al. (2010) Wright E.L., Eisenhardt P.R.M., Mainzer A.K., et al. (2010) AJ140, 1868-1881
- Zemlyanukha et al. (2022) Zemlyanukha P., Zinchenko I.I., Dombek E., et al. (2022) MNRAS515, 2445
- Zemlyanukha et al. (2018) Zemlyanukha P.M., Zinchenko I.I., Salii S.V., et al. (2018) Astronomy Reports 62, 326
- Zinchenko (1995) Zinchenko I. (1995) A&A303, 554
- Zinchenko et al. (2009) Zinchenko I., Caselli P., Pirogov L. (2009) MNRAS395, 2234
- Zinchenko et al. (1994) Zinchenko I., Forsstroem V., Lapinov A., et al. (1994) A&A288, 601
- Zinchenko and Henkel (2018) Zinchenko I., Henkel C. (2018) In: IAU Symposium, eds. M. Cunningham, T. Millar, Y. Aikawa, vol. 332 of IAU Symposium. 274–277
- Zinchenko et al. (2000) Zinchenko I., Henkel C., Mao R.Q. (2000) A&A361, 1079
- Zinchenko et al. (1997) Zinchenko I., Henning T., Schreyer K. (1997) A&AS124, 385
- Zinchenko et al. (2011) Zinchenko I., Kurtz S., Liu S.Y., et al. (2011) In: The Molecular Universe, eds. J. Cernicharo, R. Bachiller, vol. 280. 392
- Zinchenko et al. (2012) Zinchenko I., Liu S.Y., Su Y.N., et al. (2012) ApJ755, 177
- Zinchenko et al. (2015) Zinchenko I., Liu S.Y., Su Y.N., et al. (2015) ApJ810, 10
- Zinchenko et al. (2017a) Zinchenko I., Liu S.Y., Su Y.N., et al. (2017a) A&A606, L6
- Zinchenko et al. (2018a) Zinchenko I., Liu S.Y., Su Y.N., et al. (2018a) Research in Astronomy and Astrophysics 18, 093
- Zinchenko et al. (2018b) Zinchenko I., Liu S.Y., Su Y.N., et al. (2018b) In: IAU Symposium, eds. M. Cunningham, T. Millar, Y. Aikawa, vol. 332. 270–273
- Zinchenko et al. (1995) Zinchenko I., Mattila K., Toriseva M. (1995) A&AS111, 95
- Zinchenko et al. (2017b) Zinchenko I., Ojha D.K., Pirogov L., et al. (2017b) In: Stars: From Collapse to Collapse, eds. Y.Y. Balega, D.O. Kudryavtsev, I.I. Romanyuk, I.A. Yakunin, vol. 510 of Astronomical Society of the Pacific Conference Series. 9
- Zinchenko et al. (2005) Zinchenko I., Pirogov L., Caselli P., et al. (2005) In: Massive Star Birth: A Crossroads of Astrophysics, eds. R. Cesaroni, M. Felli, E. Churchwell, M. Walmsley, vol. 227. 92–97
- Zinchenko et al. (1998) Zinchenko I., Pirogov L., Toriseva M. (1998) A&AS133, 337
- Zinchenko et al. (2021) Zinchenko I.I., Dewangan L.K., Baug T., et al. (2021) MNRAS506, L45
- Zinchenko et al. (1990) Zinchenko I.I., Krasil’Nikov A.A., Kukina E.P., et al. (1990) AZh67, 908
- Zinchenko et al. (1989) Zinchenko I.I., Lapinov A.V., Pirogov L.E. (1989) AZh66, 1142
- Zinchenko et al. (2020) Zinchenko I.I., Liu S.Y., Su Y.N., et al. (2020) ApJ889, 43
- Zinchenko et al. (2022) Zinchenko I.I., Pazukhin A.G., Trofimova E.A., et al. (2022) PoS MUTO2022, 038
- Zinnecker and Yorke (2007) Zinnecker H., Yorke H.W. (2007) ARA&A45, 481