: Geolocation via Guidebook Grounding
Abstract
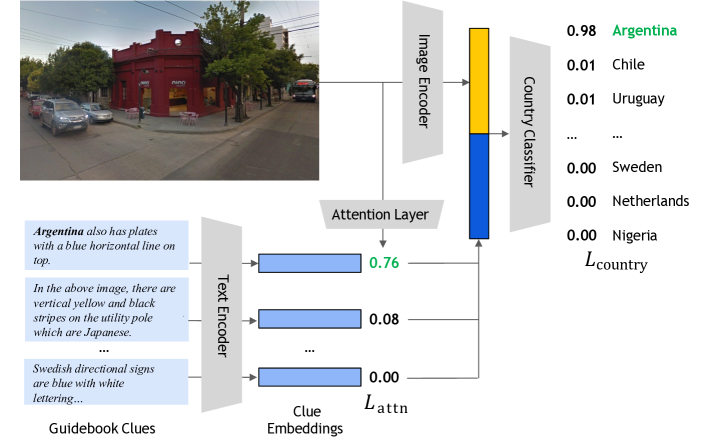
We demonstrate how language can improve geolocation: the task of predicting the location where an image was taken. Here we study explicit knowledge from human-written guidebooks that describe the salient and class-discriminative visual features humans use for geolocation. We propose the task of Geolocation via Guidebook Grounding that uses a dataset of StreetView images from a diverse set of locations and an associated textual guidebook for GeoGuessr, a popular interactive geolocation game. Our approach predicts a country for each image by attending over the clues automatically extracted from the guidebook. Supervising attention with country-level pseudo labels achieves the best performance. Our approach substantially outperforms a state-of-the-art image-only geolocation method, with an improvement of over 5% in Top-1 accuracy. Our dataset and code can be found at https://github.com/g-luo/geolocation_via_guidebook_grounding.
1 Introduction
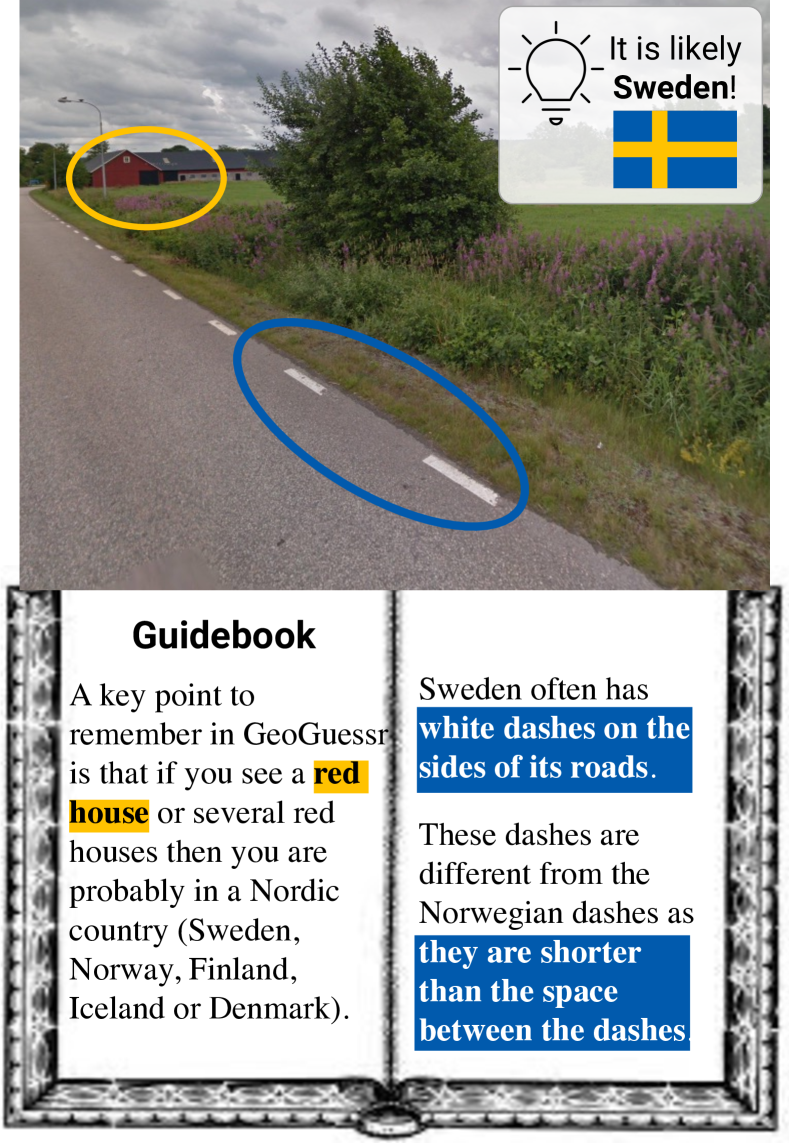
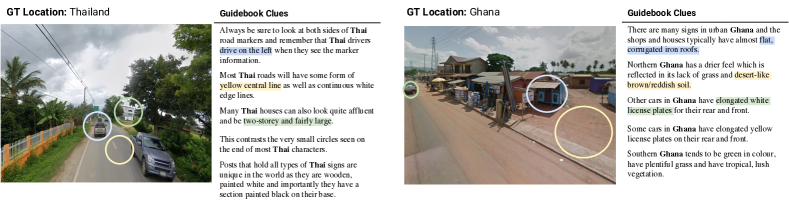
Image geolocation plays an important role in many applications, notably in fact checking and investigative journalism, as a means of verifying or debunking claims that are illustrated with images. For example, to verify the authenticity of video evidence of human rights abuses in Cameroon, an investigator manually matched the depicted roof coloring, building architecture, and sign text to StreetView imagery.111https://www.bellingcat.com/resources/case-studies/2018/11/21/geolocation-infrastructure-destruction-cameroon-case-study-kumbo-kumfutu Given the rising volume of online mis- and disinformation, it is increasingly important to develop accurate automated geolocation methods. Beyond the recent importance of geolocation in fact-checking, it has also become a popular pastime in the form of online games like GeoGuessr222http://www.geoguessr.com or Pursued.333https://www.nemesys.hu/Pursued Since these games are so popular, human experts often publish guidebooks curating the most salient and discriminative cues for geolocating an image to teach novice players. For example, a guide might state that Sweden often has white dashes on the sides of its roads (Figure 1), knowledge a human can quickly understand and apply towards all future geolocation attempts. In contrast, most prior methods rely on training vision models on millions of images paired with GPS locations in order to learn this task Kalogerakis et al. (2009); Weyand et al. (2016); Muller-Budack et al. (2018); Theiner et al. (2022). Recently, the authors of CLIP Radford et al. (2021), a large-scale multimodal model, showed that CLIP’s implicit world knowledge allows it to perform geolocation once a linear classifier is added, but it does not reach the state-of-the-art performance.
In this work we explore human-written text guides as an additional source of knowledge to complement image-based geolocation methods. Our first contribution is the new task of Geolocation via Guidebook Grounding that consists of a diverse dataset of StreetView images and an associated text guidebook created for the GeoGuessr game. The goal is to classify images into one of 90 countries, while leveraging the text clues by grounding them to the target images. Our second contribution is the proposed approach, , which learns to leverage the guidebook. Namely, we combine a state-of-the-art image-only representation with our novel textual clue representation. To obtain a clue representation, we attend over the guidebook sentences (clues), while weakly supervising attention with country-specific information. Adding the final attended clue representation substantially improves performance by more than 5% in Top-1 accuracy of a state-of-the-art geolocation model.
2 Related Work
Geolocation. One of the first image-based geolocation methods was introduced by Hays and Efros (2008), who use various handcrafted visual features to predict locations. Concretely, they use a nearest neighbor method against a database of labeled images. More recent works use convolutional neural networks (CNNs) rather than handcrafted features Weyand et al. (2016); Muller-Budack et al. (2018); Theiner et al. (2022). Many works treat geolocation as a classification problem Kalogerakis et al. (2009); Weyand et al. (2016); Muller-Budack et al. (2018); Theiner et al. (2022), which requires partitioning the world map into discrete cells.
Kalogerakis et al. (2009) discretize the map into roughly equal size rectangular bins, and Weyand et al. (2016) use a hierarchical partitioning via a Quad tree Finkel and Bentley (1974) that splits cells according to image density in order to address data imbalances. Theiner et al. (2022) uses a semantic partitioning where the cells have irregular shapes that are influenced by man-made geographies (city/country borders) and natural features (rivers, mountains, etc) in order to achieve more interpretable results. Prior works typically use large datasets of (image; GPS coordinate) pairs sourced from websites such as Flickr Hays and Efros (2008); Weyand et al. (2016); Kalogerakis et al. (2009).
Our work differs from these in several key ways. We are the first to show the usefulness of language (e.g., in the form of a guidebook) for geolocation. Moreover, in our problem statement, the task is to classify images into 90 countries. We believe this is a practical yet under-explored formulation, which allows for a more natural connection between target labels and knowledge expressed in textual form (as opposed to a somewhat arbitrary cell partitioning). Finally, our benchmark for Geolocation via Guidebook Grounding consists of StreetView images, a more focused domain than Flickr images, which allows us to leverage the human-written guidebook for the GeoGuessr game.
Learning with Knowledge. Prior works have explored using external language knowledge for various downstream tasks. For example, Yang et al. (2021) adopt GPT-3 to visual question answering (VQA) by leveraging the extensive knowledge of GPT-3 for answering questions given an image caption as input. Marino et al. (2021) use external knowledge bases and a graph neural network to boost VQA performance. Similar to a line of work in language grounding that condition on information from instructive text or game manuals to improve task performance (Eisenstein et al., 2009; Branavan et al., 2009, 2012; Narasimhan et al., 2018; Andreas et al., 2018; Zhong et al., 2020), we leverage a guidebook to improve the performance of an image-only geolocation model.
Advisable Visual Learning. A related line of work explores the use of language to advise vision models. Kim et al. (2020) show how to leverage language advice in the form of observation-action rules to better train an autonomous self-driving agent. In another work, a reinforcement learning soccer agent is trained from both the environment rewards and human-generated advice Kuhlmann et al. (2004). Rupprecht et al. (2018) use inference-time language guidance to improve a trained CNN’s performance on a segmentation task. Mu et al. (2020) use captions associated with images to define an auxiliary loss to improve visual features for few-shot image classification. Here, we leverage a human-written guidebook during training, however we do not have any specific instructions or advice aligned to individual images; instead we have a set of textual clues which we ground to images.
3 Geolocation via Guidebook Grounding
While prior works Hays and Efros (2008); Weyand et al. (2016); Larson et al. (2017) propose datasets of paired images and locations, to the best of our knowledge, none have proposed datasets with images, locations, and relevant textual knowledge. To this end, we look to guidebooks for the interactive geolocation game GeoGuessr444https://www.geoguessr.com as a source of knowledge for the specific domain of StreetView images. For our task of Geolocation via Guidebook Grounding we put together a new diverse corpus of StreetView images and an associated text from a GeoGuessr guidebook (see examples in Figure 2).
Guidebook Text:
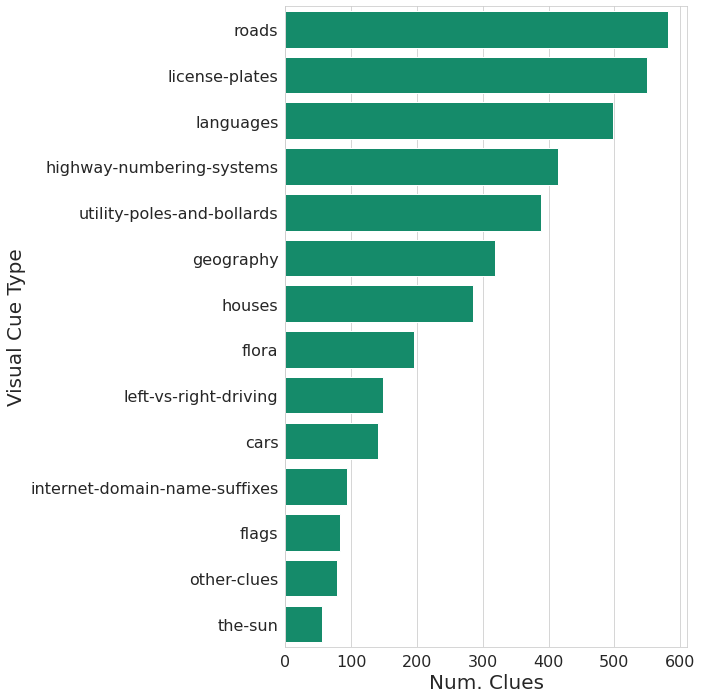
GeoGuessr is a popular geolocation game where the user is placed into a navigable StreetView scene and must predict either the GPS coordinates or the country (depending on the gameplay mode). The game is so popular that people have built a community of online forums and guidebooks where they trade strategies for gameplay. To take advantage of this wealth of human knowledge, we mine text from a popular guide for playing the GeoGuessr game.555https://somerandomstuff1.wordpress.com/2019/02/08/geoguessr-the-top-tips-tricks-and-techniques/ Some of the key features of this guide are that it has a broad country coverage, is well structured, and has a more “formal” style. The guide is meant to teach novice players visual cues that discriminate various countries, for example the fact that Dashed white lines on the edges of roads are quite common in the countries of Denmark, Norway, Iceland and Sweden. The guide is organized into sections for specific countries and specific visual cues, covering 102 countries and over 13 visual cue types (see Figure 3). For our final knowledge base, we select sentences from the guide that mention at least one location. We use NER tags predicted by spaCy Honnibal and Montani (2017) and filter for sentences with an entity tagged “GPE”, “LOC”, or “NORP”, resulting in 3,832 sentences, with an average length of 14 words. The clue sentences contain a total of 3,712 unique words and 3,182 unique lemmas.
| Train | Validation | Test | |
| Count | 322,536 | 3,888 | 3,600 |
StreetView Images:
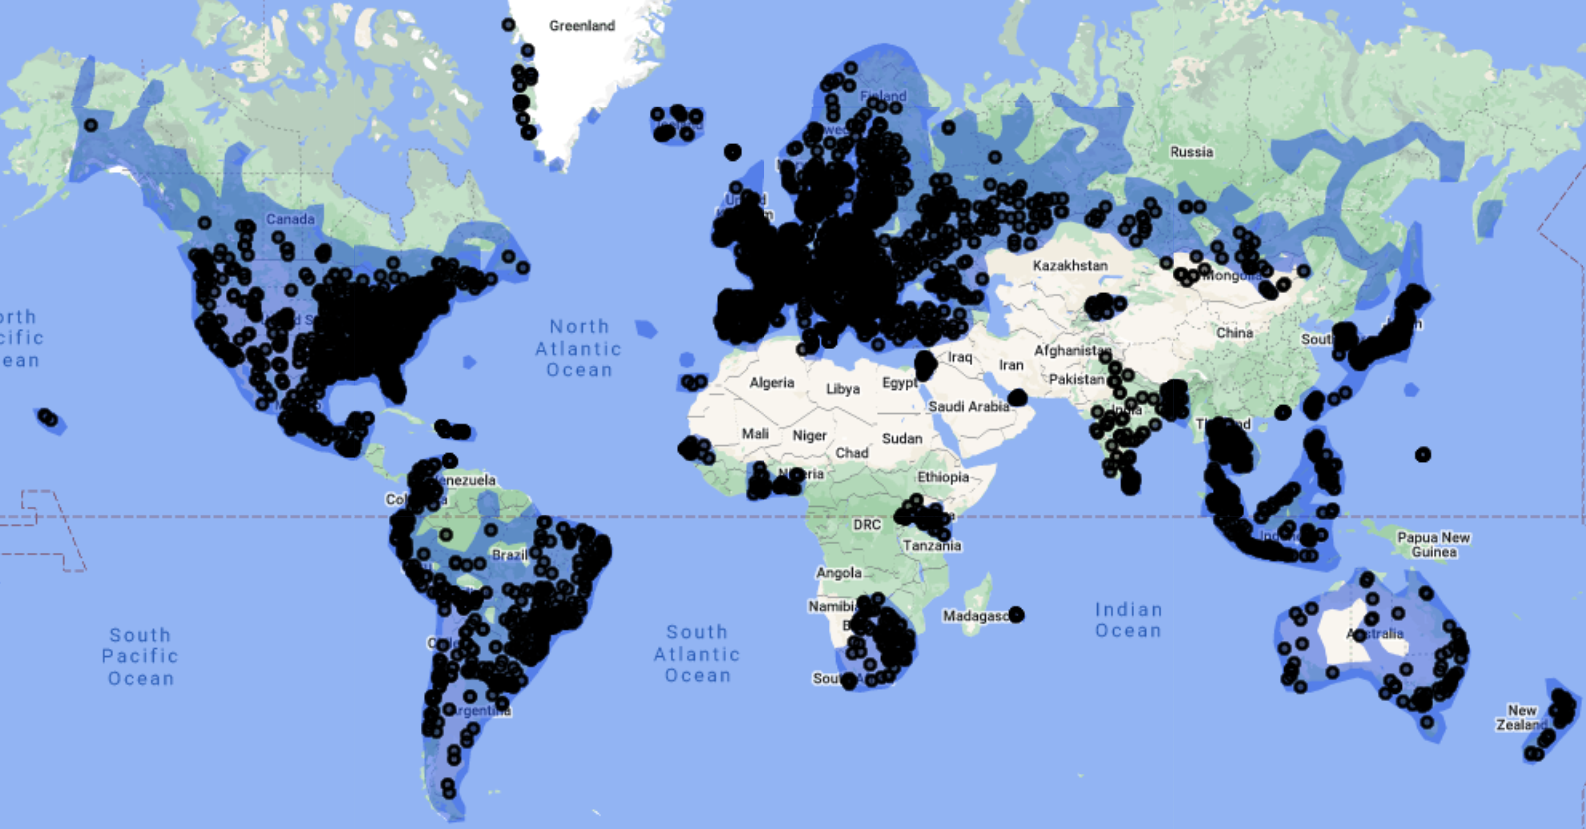
We collect a geo-diverse dataset of StreetView panoramas that covers 90 countries. The Google StreetView API’s coverage is fairly skewed, with countries in North America having some of the most extensive coverage and countries in Africa having the sparsest coverage (see Figure 4). We gather at least 426 panoramas per available country, as seen in Figure 4. We then randomly split panoramas into training / validation / test sets. Finally, we “cut” each panorama into four disjoint images, as our baseline models were pretrained on images rather than 360-degree panoramas. See Table 1 for the number of images in each split of the dataset. Our training set contains all four panorama cuts for a given image, but our validation and test sets only contain one cut to enforce independence of the evaluation samples. While our training set is imbalanced, our validation and test sets are balanced to ensure that each country is equally represented in the final classification performance.
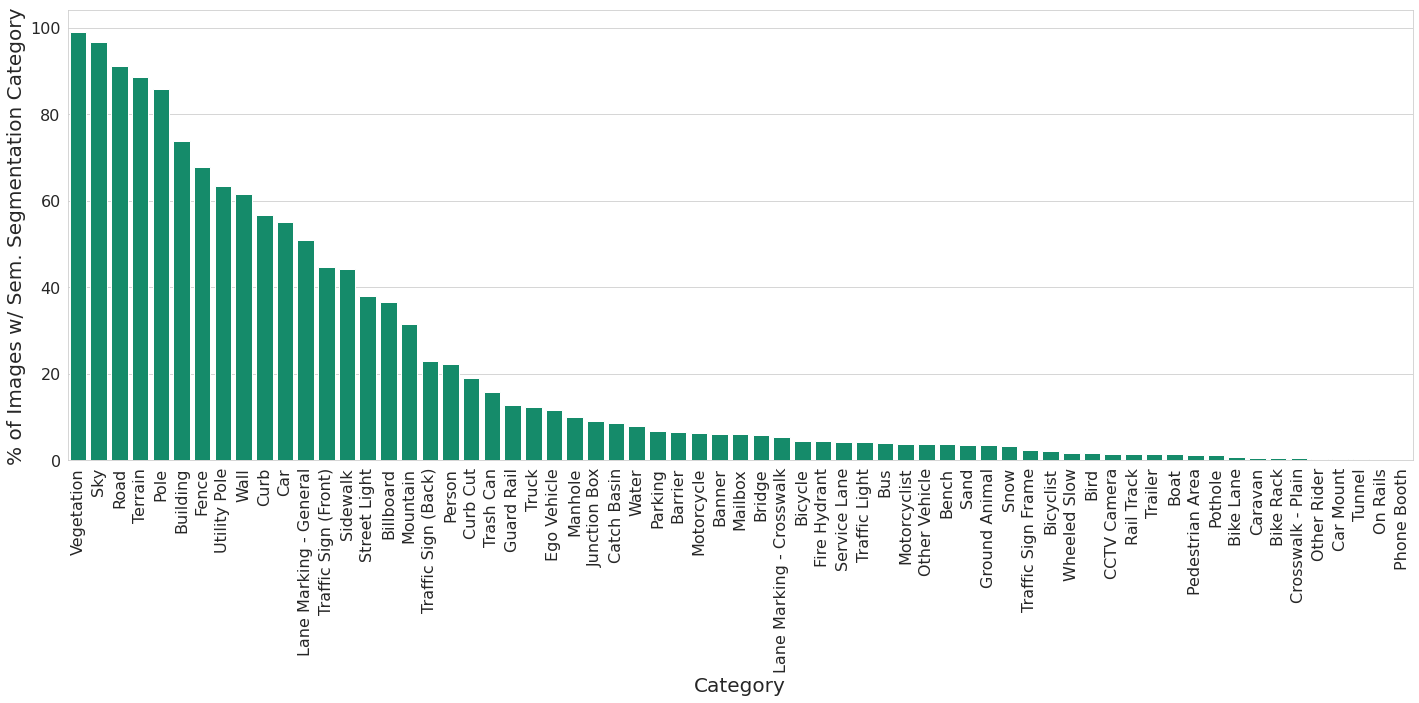
We also collect semantic segmentations to better understand the content of our StreetView images (and for potential use in future work). We use MaskFormer pretrained on Mapillary Vistas Cheng et al. (2021); Neuhold et al. (2017), which provides segmentations for 66 categories specific to street scenes. We report the distribution of these categories present in our StreetView dataset in Figure 5. As expected, most images contain “vegetation”, “sky”, “road”, many contain “cars” and “lane markings”, and fewer contain “people”, “billboards”, “mailboxes”, “fire hydrants” etc.
4 Approach
Our multimodal approach, , improves upon traditional image-only methods for geolocation with the help of guidebook text. We concatenate the visual representation of an image-only geolocation model with a relevant textual clue representation derived from our guidebook, and use it in a linear country classification layer, see Figure 6.
Textual Clue Representation:
Given an input image to geolocate, we use a soft attention layer to compute attention scores over each sentence (clue) extracted from our guidebook to indicate its relevance. We opt to use the location-based attention mechanism of Luong et al. (2015) as other attention mechanisms would take significantly more memory and time to train for a guidebook the size of ours. Our soft attention layer takes an image query , encodes it with a frozen CLIP RN50x16 image encoder , and passes it through a fully connected layer with a ReLU activation to obtain attention logits for each clue in our guidebook:
| (1) |
We precompute clue representations by applying a frozen RoBERTa Base model (Liu et al., 2019) to each clue in our guidebook.666For each sentence, we use the RoBERTa representation of the CLS token. We then take the weighted average of these clue representations to obtain , an image-specific summary textual clue representation:
| (2) |
where we apply a sigmoid activation to the attention logits and take the -th score to scale , the -th clue representation.
Guiding Attention with Pseudo Labels:
Given the large number of clues in our dataset, we use weak supervision to guide the attention mechanism during training. We create pseudo labels associating clues to images using country information. Specifically, we geoparse the clues via country demonyms and lexical matching,777We also tried the neural geoparser Mordecai (https://github.com/openeventdata/mordecai) but found that lexical matching had higher precision and recall. mapping the named entities (as predicted by spaCy, see Section 3) in the clues to country labels, and therefore associated images. For example, a clue that mentions “Japanese” would be associated with images where Japan is the ground truth label. On average each image is matched to 76 country-relevant clues (2% of all guidebook clues).
We then supervise the attention mechanism over clues with these pseudo labels. We add a binary cross entropy loss on our attention logits, where the label is a one-hot vector for each clue in our guidebook, defined by whether the clue mentions the country of the input image. Our final loss function is as follows:
| (3) |
where is the cross entropy loss for our country classification objective and is the weighting factor for our attention loss, determined using grid search on our validation set. Since each image is only associated with a handful of clues (i.e. there are significantly more negatives than positives, or clues we do not want to attend over), we also upweight the loss of positive pseudo labels.888We also tried supervising our attention with MIL-NCE Miech et al. (2020) but observed that our approach empirically outperformed MIL-NCE in early experiments.
In summary, our pseudo labels map clues (e.g. Argentina’s license plates are …) to countries (e.g. Argentina). At training time, we encourage the model to attend to the clues relevant to the image’s ground-truth country via the auxiliary loss . At test time, given an input image, G3 predicts attention weights over all guidebook clues without any access to the ground-truth information.
5 Experiments
| Model | Top-1 | Top-5 | Top-10 |
|---|---|---|---|
| CLIP Nearest Neighbor | 0.4336 | 0.6858 | 0.7806 |
| CLIP Linear Probe | 0.6081 0.001 | 0.8789 0.003 | 0.9417 0.001 |
| ISN | 0.6527 0.015 | 0.8817 0.004 | 0.9379 0.004 |
| (Ours) | 0.7031 0.002 | 0.9178 0.004 | 0.9618 0.002 |
| Model | Attn Supervision | Top-1 | Top-5 | Top-10 |
|---|---|---|---|---|
| ISN | N/A | 0.6527 0.015 | 0.8817 0.004 | 0.9379 0.004 |
| ISN + Random Text | N/A | 0.6559 0.027 | 0.8840 0.012 | 0.9403 0.010 |
| ISN + Guidebook | No | 0.6733 0.011 | 0.8927 0.008 | 0.9449 0.005 |
| ISN + Guidebook | Yes | 0.6972 0.006 | 0.9115 0.001 | 0.9561 0.002 |
| ISN + CLIP | N/A | 0.6448 0.030 | 0.8908 0.011 | 0.9470 0.006 |
| ISN + CLIP + Random Text | N/A | 0.6037 0.035 | 0.8571 0.017 | 0.9232 0.010 |
| ISN + CLIP + Guidebook | No | 0.6364 0.037 | 0.8716 0.018 | 0.9328 0.013 |
| = ISN + CLIP + Guidebook | Yes | 0.7031 0.002 | 0.9178 0.004 | 0.9618 0.002 |
Baseline Models:
For our baseline models we use ISN, a unimodal model consisting of a visual encoder and linear classification layer trained to predict a hierarchical cell on Earth given an image Muller-Budack et al. (2018), and CLIP, a multimodal model consisting of a visual and text encoder trained to maximize the cosine similarity of matched image-text pairs via contrastive learning Radford et al. (2021). We adapt the ISN ResNet50 model pretrained on millions of Flickr images Muller-Budack et al. (2018); Choi et al. (2014) by modifying the output size of the final classification layer from the number of cells on Earth to the number of countries in our dataset and further fine-tune the model on our StreetView images. While CLIP was not trained specifically for the geolocation task, Radford et al. (2021) demonstrate reasonable performance on a number of geolocation benchmarks such as Countries211 Radford et al. (2021) and Im2GPS Hays and Efros (2008) via nearest neighbors regression, zero-shot prediction, and/or linear probing. We adapt the CLIP RN50x16 model pretrained on a large-scale web image-text dataset Radford et al. (2021) by taking a frozen representation from its visual encoder and feeding it to a linear classification layer (denoted by ‘CLIP Linear Probe’). We also include the nearest neighbor version (CLIP Nearest Neighbor).
Implementation Details:
In our experiments, we either use the ISN visual representation alone or concatenated with the CLIP visual embedding (“ISN + CLIP”). We do this to study the complementarity of CLIP’s world knowledge to ISN.
Experimental Setup:
We train our visual encoder and linear classifier at a learning rate of 1e-2 and attention layer at a learning rate of 1e-3 using an SGD optimizer (following Muller-Budack et al. 2018), and batch size of 128 for 15 epochs. We upweight the loss for countries that appear more infrequently in our training data to account for its distributional imbalance. We also apply batch normalization on the inputs to the attention and linear classifier layers.
Main Results:
We report country classification accuracy on the test set of our StreetView dataset in Table 2 (we report the mean and standard deviation over five seeds). Prior approaches such as ISN and CLIP demonstrate competitive performance, with 61% and 65% top-1 performance respectively. CLIP Linear Probe provides a significant boost of 17% over the nearest neighbor prediction. Finally, we observe the best performance from our full method, , while using both the ISN and CLIP visual representations along with the domain-specific clue representations from our guidebooks, achieving a 70% Top-1 classification accuracy.
Ablations:
We further ablate the effect of the different components of our approach in Table 3.999We report the respective ablations on the validation set in the Appendix. For both ISN and ISN + CLIP as visual representations we report the effects of using no text, attending over random text, attending over guidebook text, and including weak country supervision for the latter. Our location-based attention mechanism introduces additional parameters into the prediction network. To disentangle the degree to which the improvements of our full method are due to its use of the guidebook text versus this additional parameterization, we perform an experiment that replaces guidebook sentences with the same amount of sentences from the news domain Biten et al. (2019) (“Random Text”). For the ISN model, we see that attending over random text maintains the same performance as the image-only method while guidebook text boosts the performance by 2%. For the ISN + CLIP model, random text significantly hurts performance while guidebook text maintains similar performance within 1%, which implies that random text can have an adverse effect and guidebook text can be redundant when combined with CLIP embeddings. However, when we use guidebook text and weakly-supervise the attention mechanism to encourage it to correctly select country-relevant clues, we obtain the best performance for both feature classes: 69.7% Top-1 for ISN, and 70.3% Top-1 for ISN+CLIP.
6 Analysis
Here we discuss qualitative success and failure cases of and the top clues attended over as well as comparisons with baseline image-only methods.
Success Cases:
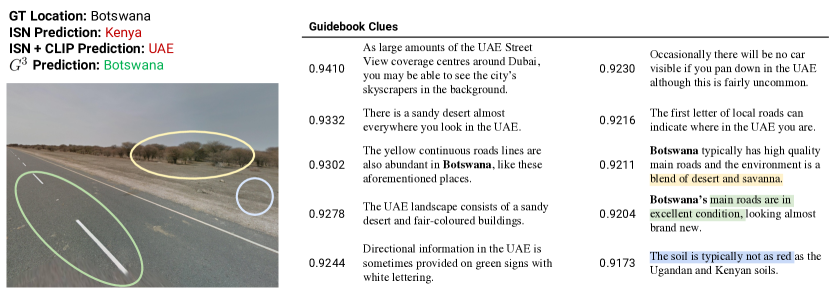
In Figure 7, we show a qualitative example where baseline methods such as ISN and ISN + CLIP incorrectly predict Kenya and the UAE when the ground truth location is Botswana. Both incorrect predictions are plausible — Kenya is geographically close to Botswana, and the UAE is also covered in desert. On the other hand correctly predicts Botswana, and we visualize the Top-10 clues retrieved by our attention mechanism. retrieves clues that mention its final prediction, Botswana, that describe how the roads are a blend of desert and savanna and in excellent condition. It also retrieves clues relevant to the countries it did not predict, such as the fact that the UAE often has skyscrapers in the background and sandy desert or Kenya often has soil that is red. As such, our guidebook demonstrates how language can efficiently communicate what locations are commonly confused (i.e. through the co-occurence of two countries in text) and key visual cues that remedy this confusion (i.e. a country may be distinct because the soil is typically not as red as its neighbors).
Failure Cases:
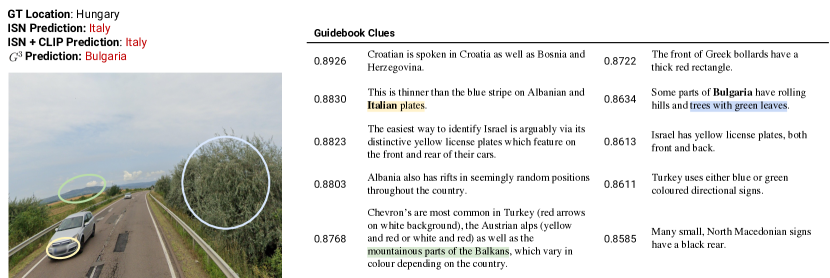
In Figure 8, we show a failure case where all three methods — ISN, ISN + CLIP, and , are unable to predict the ground truth location Hungary. Interestingly, while ISN and ISN + CLIP predict the same country — Italy — instead predicts Bulgaria. In fact, most of our attention mechanism’s top clue retrievals mention countries within the Balkan Peninsula, including Croatia, Albania, Turkey, Greece, North Macedonia, and finally Bulgaria. Many of the clues retrieved also mention objects that can be grounded in the image, including license plates, mountainous parts, and green leaves. The plausibility of many of the retrieved clues also indicates how in some cases, the geolocation task is incredibly difficult with a single image and how many different countries can all be plausible given the same visual cues. Many failure cases can be attributed to this fact, and it seems to suggest reducing the remaining errors of existing models on the geolocation task requires a setting closer to that of GeoGuessr, where a scene may be navigable and grant access to multiple views of the same location. Although this setting is less realistic in the context of real-world geolocation tasks that often involve a single social media image, this potential future evaluation setting is particularly interesting because it gives rise to methods that can model uncertainty or enumerate the additional visual cues needed for it to be more confident in its prediction.
7 Conclusion
We presented Geolocation via Guidebook Grounding, a new multimodal task that includes a geo-diverse dataset of images from StreetView and text from a guidebook for the GeoGuessr game. We demonstrated that adding clues from guidebooks via our approach, , substantially outperforms past state-of-the-art image-only geolocation models on our task, with an absolute improvement of 5% to reach 70% in Top-1 country classification.
At the same time, there is still significant room left for improvement, and we hope that other practitioners will find this task interesting and relevant. The unique feature of our dataset is that the guidebook contains references to many nuanced and detailed characteristics of the visual scenes, posing challenging grounding problems. From recognizing specific road markings and reasoning about the scene geography, to recognizing flags, languages and other symbols, there are many skills necessary to solve the task. The focused domain of street scenes enables us to study this problem, while still being conceptually rich and capturing a multitude of diverse geographic locations.
Acknowledgements.
This work was supported in part by DoD including DARPA’s SemaFor, PTG and/or LwLL programs, as well as BAIR’s industrial alliance programs.
8 Limitations, Ethics, and Broader Impacts
Dataset:
The copyright and usage rights of the StreetView dataset are subject to that of Google. Unlike prior works that train and evaluate on datasets of user uploaded data, which are often skewed towards Western and industrialized countries, we take measures to collect a minimum number of samples from a diverse set of countries and reward performance on each country equally during evaluation. That being said, our findings are limited to the 90 countries in our dataset since there exist countries that do not have Google StreetView coverage due to legal or resource reasons. However, we hope that our work contributes to a broader discussion of collecting geo-diverse data, which is important for building systems that work equally well for diverse sets of populations.
While our collection of clues used to encode human-written knowledge discusses an extensive set of countries, we note that the clues are from a guidebook with a single author and are therefore limited to the experiences of one person. We encourage future work to also consider community forums such as https://www.reddit.com/r/geoguessr/ which includes discussion from a broader range of players but contains noisier data.
Approach:
Since we build upon pretrained models such as ISN Muller-Budack et al. (2018) and CLIP Radford et al. (2021) for our visual representations, our approach is subject to the pre-existing biases learned by these models. For example, CLIP has demonstrated biases w.r.t. race and gender when classifying images of individuals Radford et al. (2021). Our final model is 27.9M total trainable parameters and its training takes on average 5 hours on one NVIDIA GeForce Titan X GPU, which is estimated to be 0.54 kgCO2eq in total emissions Lacoste et al. (2019).
Broader Impacts:
We acknowledge that approaches for the domain of geolocation can be misused in applications such as surveillance. However, we would also like to highlight that our work specifically focuses on the more coarse-level task of country classification to better align our modeling with our problem statement of language and grounding. As such, our work is less useful for fine-grained surveillance, which usually searches for locations on a city or street level. We caution against these unintended use cases, and we also emphasize that geolocation has many other positive applications in disaster response (e.g. interpreting social media imagery and appropriately directing disaster resources), arts and culture (e.g. understanding key identifying features of different locations around the world to produce more inclusive animations and films), and fact checking (e.g. determining the provenance of an image in journalism and content moderation).
References
- Andreas et al. (2018) Jacob Andreas, Dan Klein, and Sergey Levine. 2018. Learning with latent language. In Proceedings of the 2018 Conference of the North American Chapter of the Association for Computational Linguistics: Human Language Technologies, Volume 1 (Long Papers), pages 2166–2179, New Orleans, Louisiana. Association for Computational Linguistics.
- Biten et al. (2019) Ali Furkan Biten, Lluis Gomez, Marçal Rusinol, and Dimosthenis Karatzas. 2019. Good news, everyone! context driven entity-aware captioning for news images. In Proceedings of the IEEE/CVF Conference on Computer Vision and Pattern Recognition, pages 12466–12475.
- Branavan et al. (2009) S.R.K. Branavan, Harr Chen, Luke Zettlemoyer, and Regina Barzilay. 2009. Reinforcement learning for mapping instructions to actions. In Proceedings of the Joint Conference of the 47th Annual Meeting of the ACL and the 4th International Joint Conference on Natural Language Processing of the AFNLP, pages 82–90, Suntec, Singapore. Association for Computational Linguistics.
- Branavan et al. (2012) SRK Branavan, David Silver, and Regina Barzilay. 2012. Learning to win by reading manuals in a monte-carlo framework. Journal of Artificial Intelligence Research, 43:661–704.
- Cheng et al. (2021) Bowen Cheng, Alexander G. Schwing, and Alexander Kirillov. 2021. Per-pixel classification is not all you need for semantic segmentation. In NeurIPS.
- Choi et al. (2014) Jaeyoung Choi, Bart Thomee, Gerald Friedland, Liangliang Cao, Karl Ni, Damian Borth, Benjamin Elizalde, Luke Gottlieb, Carmen Carrano, Roger Pearce, et al. 2014. The placing task: A large-scale geo-estimation challenge for social-media videos and images. In Proceedings of the 3rd acm multimedia workshop on geotagging and its applications in multimedia, pages 27–31.
- Eisenstein et al. (2009) Jacob Eisenstein, James Clarke, Dan Goldwasser, and Dan Roth. 2009. Reading to learn: Constructing features from semantic abstracts. In Proceedings of the 2009 Conference on Empirical Methods in Natural Language Processing, pages 958–967, Singapore. Association for Computational Linguistics.
- Finkel and Bentley (1974) Raphael A Finkel and Jon Louis Bentley. 1974. Quad trees a data structure for retrieval on composite keys. Acta informatica, 4(1):1–9.
- Hays and Efros (2008) James Hays and Alexei A Efros. 2008. Im2gps: estimating geographic information from a single image. In 2008 ieee conference on computer vision and pattern recognition, pages 1–8. IEEE.
- Honnibal and Montani (2017) Matthew Honnibal and Ines Montani. 2017. spacy 2: Natural language understanding with bloom embeddings, convolutional neural networks and incremental parsing. To appear, 7(1):411–420.
- Kalogerakis et al. (2009) Evangelos Kalogerakis, Olga Vesselova, James Hays, Alexei A Efros, and Aaron Hertzmann. 2009. Image sequence geolocation with human travel priors. In 2009 IEEE 12th international conference on computer vision, pages 253–260. IEEE.
- Kim et al. (2020) Jinkyu Kim, Suhong Moon, Anna Rohrbach, Trevor Darrell, and John Canny. 2020. Advisable learning for self-driving vehicles by internalizing observation-to-action rules. In Proceedings of the IEEE/CVF Conference on Computer Vision and Pattern Recognition, pages 9661–9670.
- Kuhlmann et al. (2004) Gregory Kuhlmann, Peter Stone, Raymond Mooney, and Jude Shavlik. 2004. Guiding a reinforcement learner with natural language advice: Initial results in robocup soccer. In The AAAI-2004 workshop on supervisory control of learning and adaptive systems. San Jose, CA.
- Lacoste et al. (2019) Alexandre Lacoste, Alexandra Luccioni, Victor Schmidt, and Thomas Dandres. 2019. Quantifying the carbon emissions of machine learning. arXiv preprint arXiv:1910.09700.
- Larson et al. (2017) Martha Larson, Mohammad Soleymani, Guillaume Gravier, Bogdan Ionescu, and Gareth JF Jones. 2017. The benchmarking initiative for multimedia evaluation: Mediaeval 2016. IEEE MultiMedia, 24(1):93–96.
- Liu et al. (2019) Yinhan Liu, Myle Ott, Naman Goyal, Jingfei Du, Mandar Joshi, Danqi Chen, Omer Levy, Mike Lewis, Luke Zettlemoyer, and Veselin Stoyanov. 2019. Roberta: A robustly optimized bert pretraining approach.
- Luong et al. (2015) Thang Luong, Hieu Pham, and Christopher D. Manning. 2015. Effective approaches to attention-based neural machine translation. In Proceedings of the 2015 Conference on Empirical Methods in Natural Language Processing, pages 1412–1421, Lisbon, Portugal. Association for Computational Linguistics.
- Marino et al. (2021) Kenneth Marino, Xinlei Chen, Devi Parikh, Abhinav Gupta, and Marcus Rohrbach. 2021. Krisp: Integrating implicit and symbolic knowledge for open-domain knowledge-based vqa. In Proceedings of the IEEE/CVF Conference on Computer Vision and Pattern Recognition, pages 14111–14121.
- Miech et al. (2020) Antoine Miech, Jean-Baptiste Alayrac, Lucas Smaira, Ivan Laptev, Josef Sivic, and Andrew Zisserman. 2020. End-to-end learning of visual representations from uncurated instructional videos. In Proceedings of the IEEE/CVF Conference on Computer Vision and Pattern Recognition, pages 9879–9889.
- Mu et al. (2020) Jesse Mu, Percy Liang, and Noah Goodman. 2020. Shaping visual representations with language for few-shot classification. In Proceedings of the 58th Annual Meeting of the Association for Computational Linguistics, pages 4823–4830, Online. Association for Computational Linguistics.
- Muller-Budack et al. (2018) Eric Muller-Budack, Kader Pustu-Iren, and Ralph Ewerth. 2018. Geolocation estimation of photos using a hierarchical model and scene classification. In Proceedings of the European Conference on Computer Vision (ECCV), pages 563–579.
- Narasimhan et al. (2018) Karthik Narasimhan, Regina Barzilay, and Tommi Jaakkola. 2018. Grounding language for transfer in deep reinforcement learning. Journal of Artificial Intelligence Research, 63:849–874.
- Neuhold et al. (2017) Gerhard Neuhold, Tobias Ollmann, Samuel Rota Bulò, and Peter Kontschieder. 2017. The mapillary vistas dataset for semantic understanding of street scenes. In International Conference on Computer Vision (ICCV).
- Radford et al. (2021) Alec Radford, Jong Wook Kim, Chris Hallacy, Aditya Ramesh, Gabriel Goh, Sandhini Agarwal, Girish Sastry, Amanda Askell, Pamela Mishkin, Jack Clark, et al. 2021. Learning transferable visual models from natural language supervision. arXiv:2103.00020.
- Rupprecht et al. (2018) Christian Rupprecht, Iro Laina, Nassir Navab, Gregory D Hager, and Federico Tombari. 2018. Guide me: Interacting with deep networks. In Proceedings of the IEEE Conference on Computer Vision and Pattern Recognition, pages 8551–8561.
- Theiner et al. (2022) Jonas Theiner, Eric Müller-Budack, and Ralph Ewerth. 2022. Interpretable semantic photo geolocation. In Proceedings of the IEEE/CVF Winter Conference on Applications of Computer Vision, pages 750–760.
- Weyand et al. (2016) Tobias Weyand, Ilya Kostrikov, and James Philbin. 2016. Planet-photo geolocation with convolutional neural networks. In European Conference on Computer Vision, pages 37–55. Springer.
- Yang et al. (2021) Zhengyuan Yang, Zhe Gan, Jianfeng Wang, Xiaowei Hu, Yumao Lu, Zicheng Liu, and Lijuan Wang. 2021. An empirical study of gpt-3 for few-shot knowledge-based vqa. arXiv preprint arXiv:2109.05014, 3(6):7.
- Zhong et al. (2020) Victor Zhong, Tim Rocktäschel, and Edward Grefenstette. 2020. RTFM: Generalising to novel environment dynamics via reading. In International Conference on Learning Representations.
Appendix A Appendix
In Section A.1 we discuss results on our StreetView validation set. In Section A.2 we show example predictions along with the attended clues. In Section A.3 we provide details about the guidebook clues.
A.1 Validation Set Results
A.2 Example Predictions with Attended Guidebook Clues
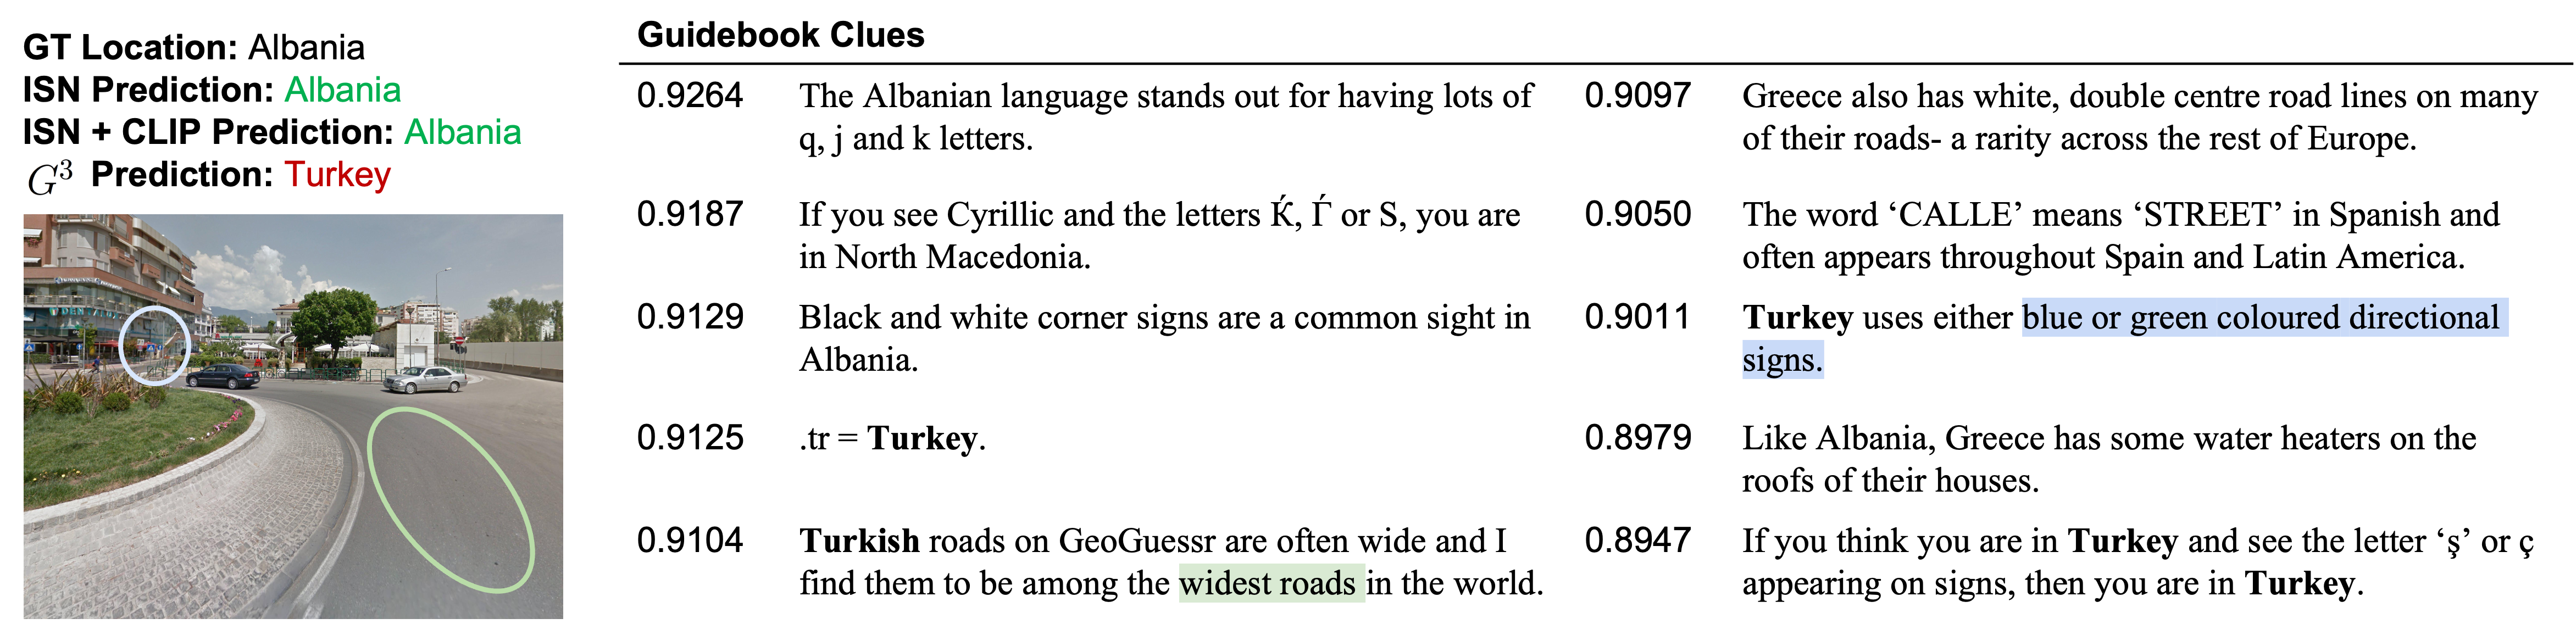
Figure 9 shows an example where ISN and ISN + CLIP both make the correct prediction but our method makes an incorrect prediction, which occurs 2% of the time in our test set (whereas the inverse, where only predicts correctly, occurs 4% of the time). attends to clues mentioning both the ground truth country (Albania) and its incorrect prediction (Turkey). In fact, some clues that mention Turkey can be grounded in the image, for example the [wide] roads and blue or green coloured directional signs. In many such failure cases, the ground truth country is mentioned in the retrieved clues but lacks visual cues that can be related to the given image.
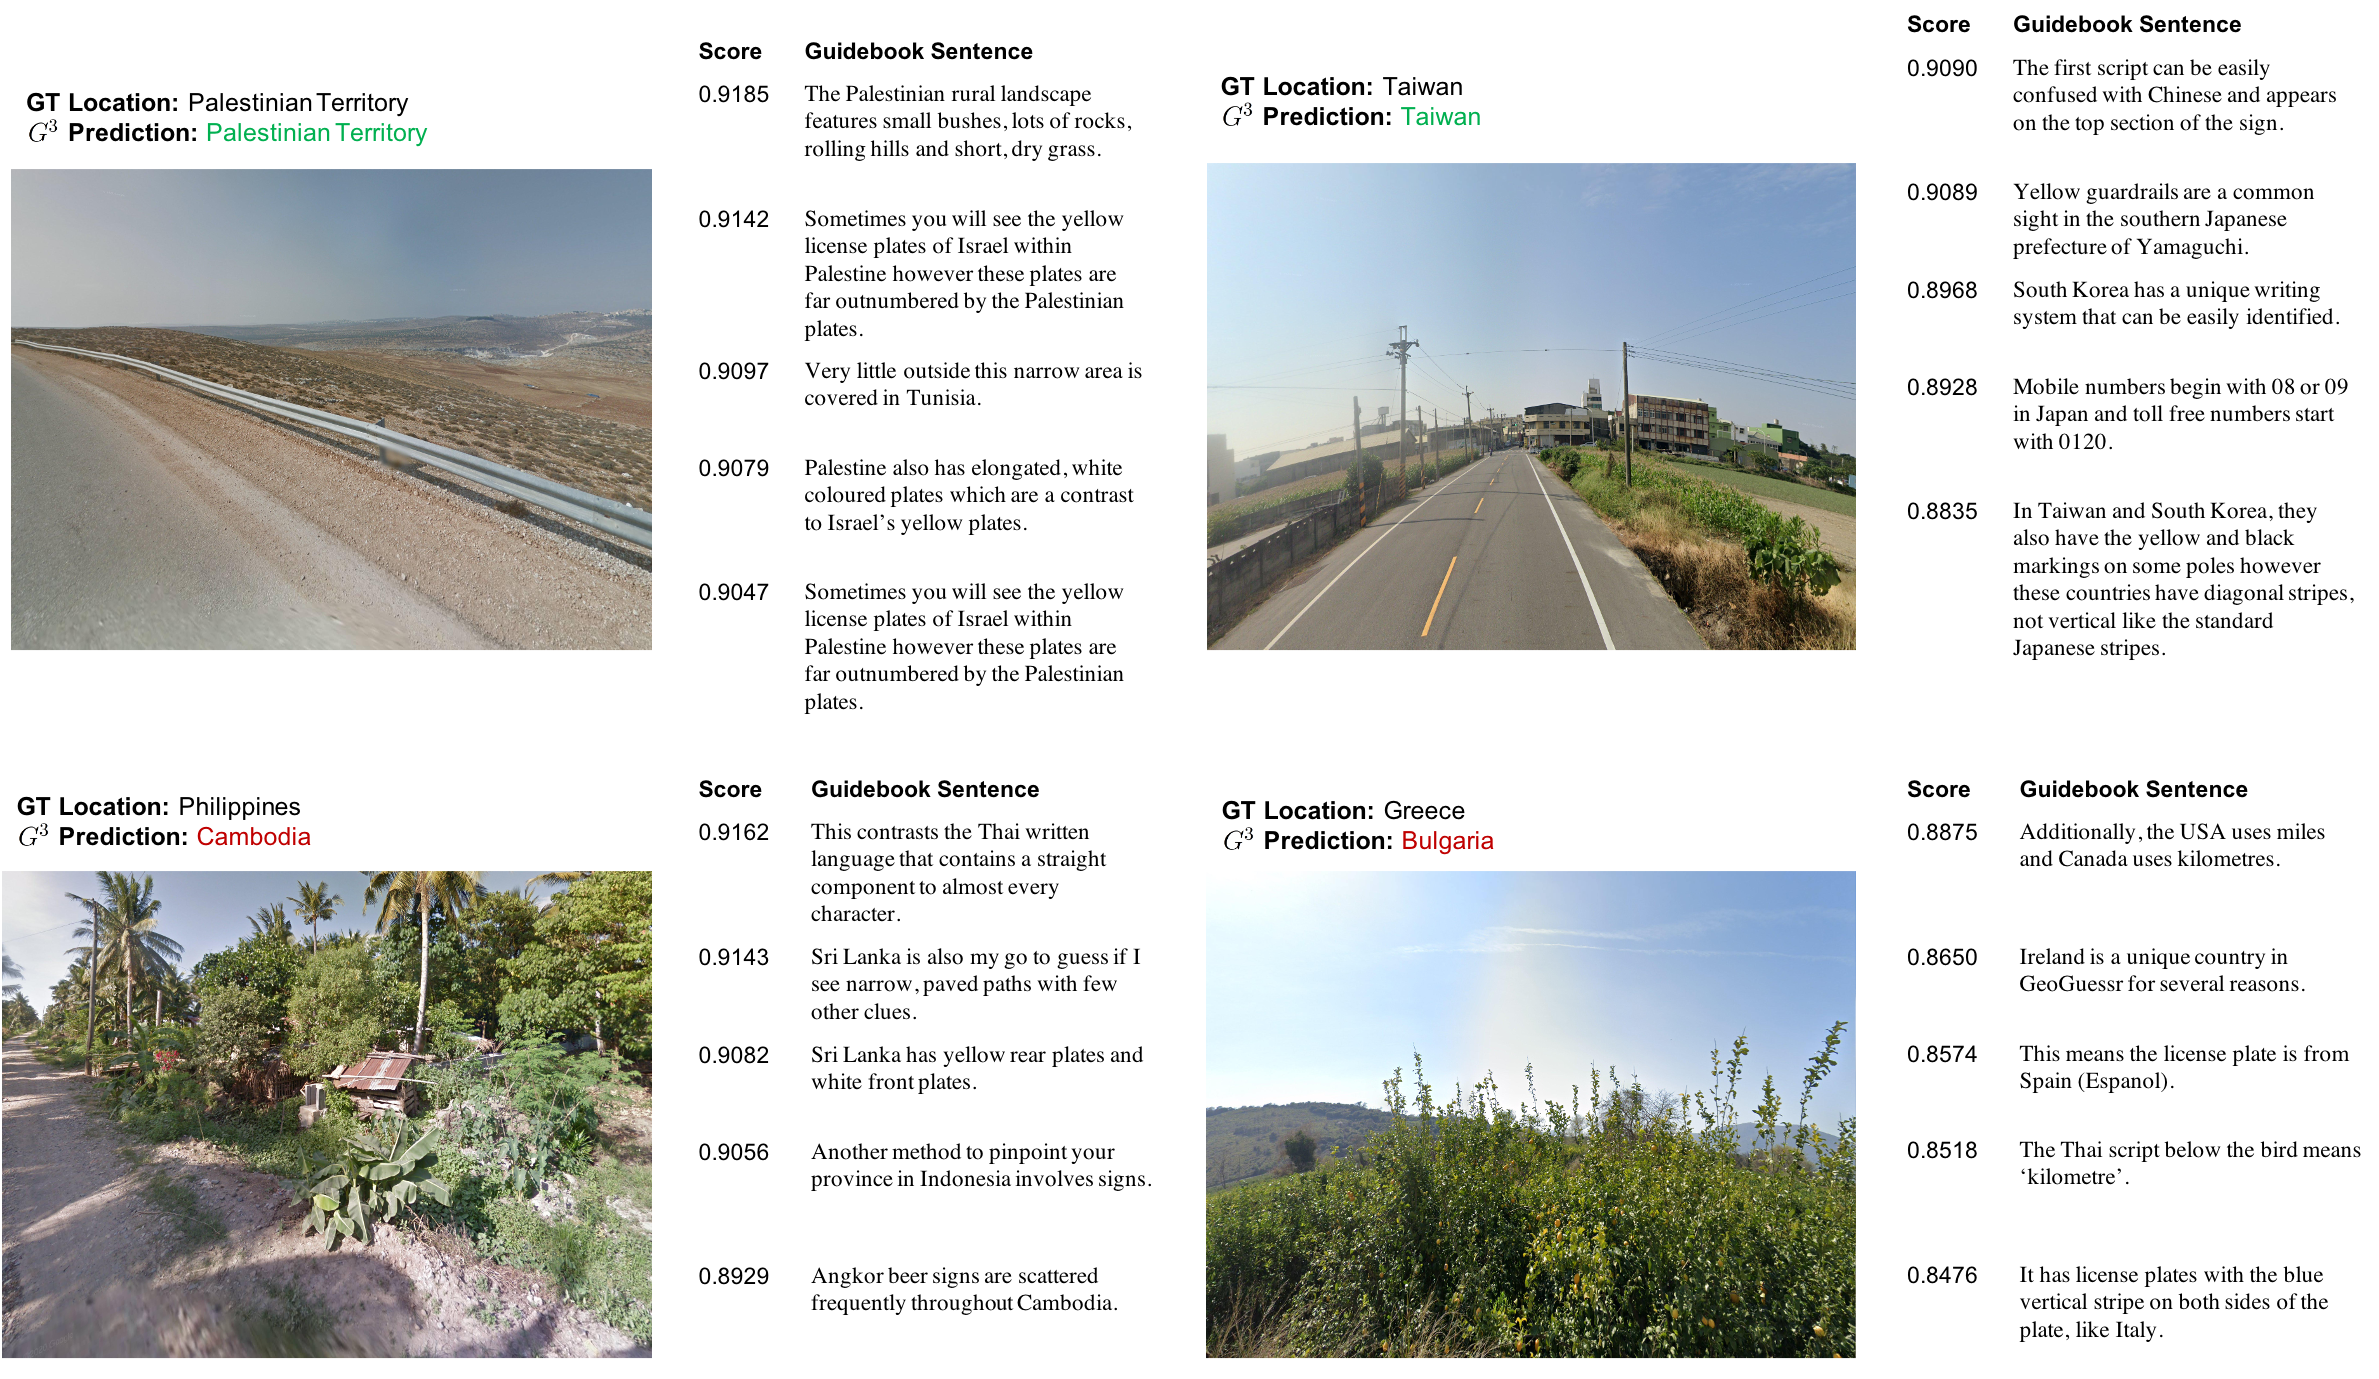
Figure 10 shows examples of random images drawn from our StreetView test set, the predictions of our model , and the Top-5 most relevant guidebook clues according to the model’s attention scores. In the top left example the model correctly predicts Palestinian Territory and four of the five top clues are related to Palestine. In the top right example the prediction is again correct (Taiwan), and while none of the clues mention Taiwan, they are all related to nearby geographic regions in Asia. In contrast, the bottom left example shows an incorrect prediction, though the clues relate to an overall correct geographic region. In the bottom right the photo shows few visual cues (i.e., only vegetation is depicted) and thus the clues mention a wide spread of countries.
A.3 Guidebook Clues
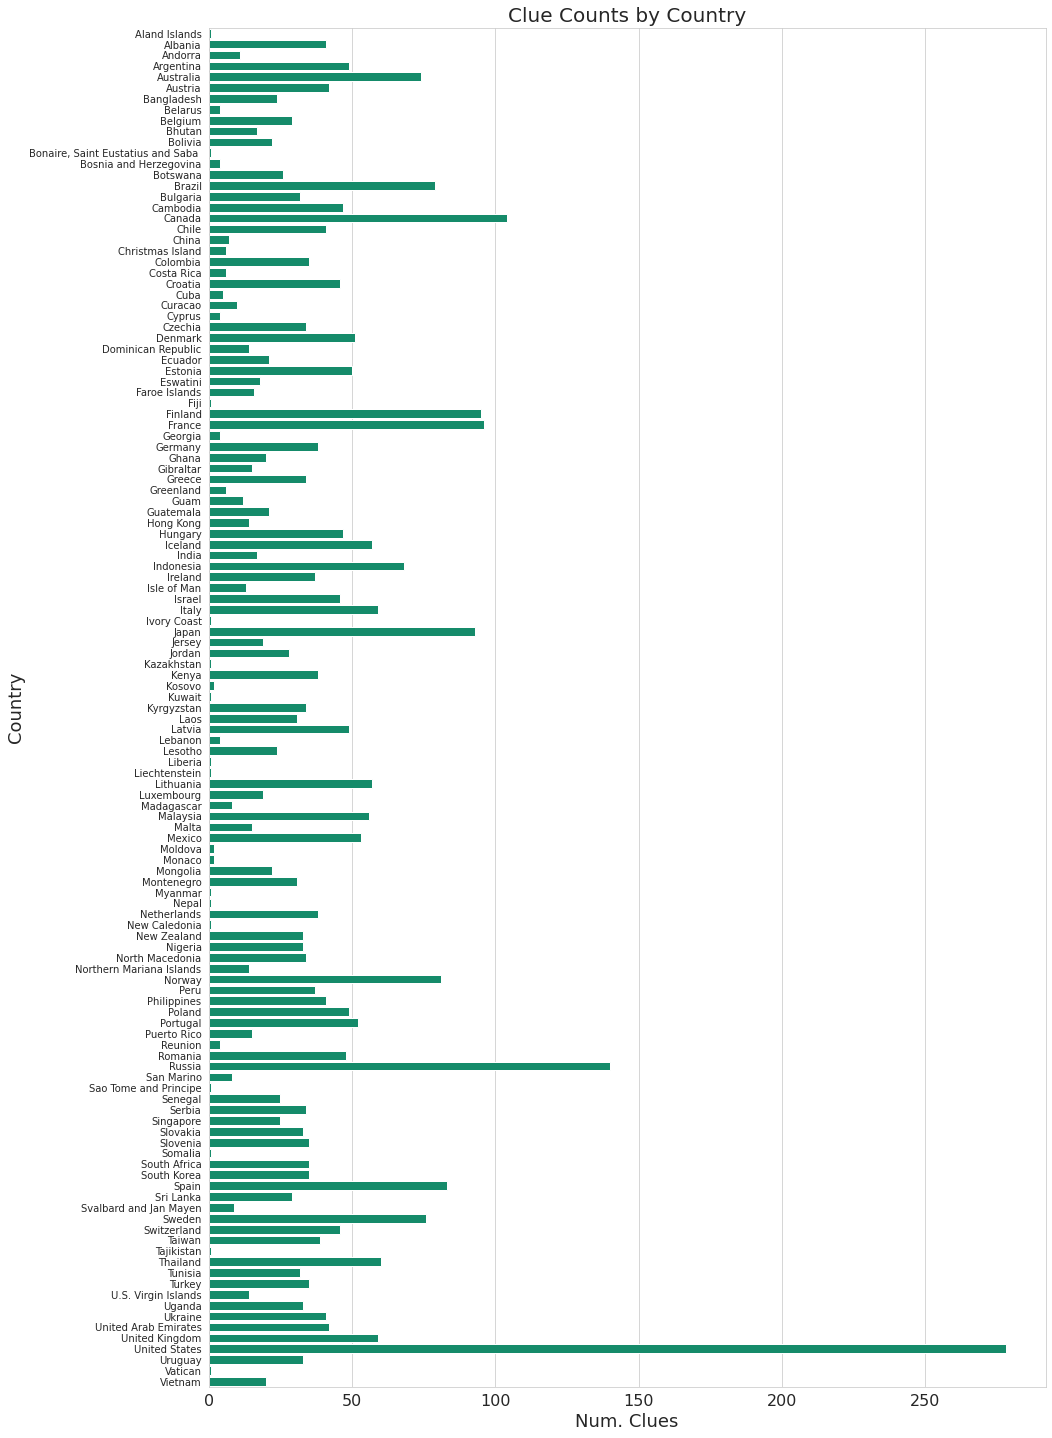
Figure 11 shows a breakdown of clue counts by country. Some clues are not matched to a country, as in the example Birch trees are only found north of the 40th parallel, because the clue applies to a broader geographical area rather than a country.
| Model | Top-1 | Top-5 | Top-10 |
|---|---|---|---|
| CLIP Nearest Neighbor | 0.4313 | 0.6826 | 0.7832 |
| CLIP Linear Probe | 0.6238 0.001 | 0.8860 0.003 | 0.9473 0.002 |
| ISN | 0.6548 0.013 | 0.8852 0.006 | 0.9442 0.005 |
| (Ours) | 0.7020 0.005 | 0.9224 0.003 | 0.9661 0.002 |
| Model | Attn Supervision | Top-1 | Top-5 | Top-10 |
|---|---|---|---|---|
| ISN | N/A | 0.6548 0.013 | 0.8852 0.006 | 0.9442 0.005 |
| ISN + Random Text | N/A | 0.6615 0.024 | 0.8932 0.012 | 0.9471 0.008 |
| ISN + Guidebook | No | 0.6776 0.013 | 0.9007 0.007 | 0.9521 0.005 |
| ISN + Guidebook | Yes | 0.6966 0.003 | 0.9193 0.003 | 0.9634 0.003 |
| ISN + CLIP | N/A | 0.6576 0.027 | 0.9000 0.010 | 0.9549 0.004 |
| ISN + CLIP + Random Text | N/A | 0.6131 0.029 | 0.8633 0.012 | 0.9315 0.010 |
| ISN + CLIP + Guidebook | No | 0.6434 0.036 | 0.8800 0.019 | 0.9392 0.013 |
| = ISN + CLIP + Guidebook | Yes | 0.7020 0.005 | 0.9224 0.003 | 0.9661 0.002 |