Abstract
The unsustainable take-make-dispose linear economy prevalent in healthcare contributes 4.4% to global Greenhouse Gas emissions. A popular but not yet widely-embraced solution is to remanufacture common single-use medical devices like electrophysiology catheters, significantly extending their lifetimes by enabling a circular life cycle. To support the adoption of catheter remanufacturing, we propose a comprehensive emission framework and carry out a holistic evaluation of virgin manufactured and remanufactured carbon emissions with Life Cycle Analysis (LCA). We followed ISO modelling standards and NHS reporting guidelines to ensure industry relevance. We conclude that remanufacturing may lead to a reduction of up to 60% per turn (1.92 kg CO2eq, burden-free) and 57% per life (1.87 kg CO2eq, burdened). Our extensive sensitivity analysis and industry-informed buy-back scheme simulation revealed long-term emission reductions of up to 48% per remanufactured catheter life (1.73 kg CO2eq). Our comprehensive results encourage the adoption of electrophysiology catheter remanufacturing, and highlight the importance of estimating long-term emissions in addition to traditional emission metrics.
keywords:
medical remanufacturing; single-use devices; life cycle analysis; greenhouse gas emissions; carbon footprint1 \issuenum1 \articlenumber0 \externaleditorAcademic Editor: Anna Trubetskaya \datereceived \daterevised \dateaccepted \datepublished \hreflinkhttps://doi.org/ \TitleAssessing Long-Term Medical Remanufacturing Emissions with Life Cycle Analysis \TitleCitationAssessing Long-Term Medical Remanufacturing Emissions with Life Cycle Analysis \AuthorJulia A. Meister \orcidA, Jack Sharp, Yan Wang *\orcidD and Khuong An Nguyen \orcidC \AuthorNamesJulia A. Meister, Jack Sharp, Yan Wang and Khuong An Nguyen \AuthorCitationMeister, J.A.; Sharp, J.; Wang, Y.; Nguyen, K.A. \corresCorrespondence: y.wang5@brighton.ac.uk
1 Introduction
Global healthcare services contribute an enormous 4.4% to the world’s Greenhouse Gas emissions, enough to place it fifth in the country carbon footprint ranking just after China, USA, India, and Russia Karliner et al. (2019). A large portion of these emissions comes from waste processes. For example, 590,000 tonnes of healthcare waste are produced annually in England alone, creating significant environmental impacts and a financial cost of over £700 m Zils et al. (2022). In 2020, the NHS became the world’s first health system committed to a legally binding net zero emissions target UK Public General Acts (2022), recognising and solidifying the importance of reducing carbon emissions in healthcare.
The NHS Net Zero plan and similar global initiatives acknowledge that the current take-make-dispose linear economy marked with single-use devices (SUDs) is a significant contributor to climate impact England and Improvement (2020). Fortunately, there are promising opportunities for improvement. A circular economy approach to retain value through reuse, remanufacturing, and recycling reduces premature device disposal and may lead to large emission and financial savings Van Boerdonk et al. (2021); Cole et al. (2018); Guzzo et al. (2020). However, remanufacturing comes with considerable challenges, as regulations understandably require that SUD medical devices are ‘reset’ before clearance for reuse (i.e., returned to a state substantially equivalent to a new device) MHRA (2016, 2021).
Because of the stringent healthcare requirements, the medical remanufacturing process requires a series of resource-heavy steps (e.g., cleaning, sterilisation, testing) Schulte et al. (2021). Therefore, careful consideration of the environmental impacts is required to ensure that it would indeed reduce emissions compared to producing a new device. To support decisions regarding linear versus circular procurement strategies, Life Cycle Analysis (LCA) is often employed to systematically assess the environmental impacts Liu et al. (2022). To ensure reliable results, comprehensive industry standards have been developed in recent years (e.g., ISO standards iso (2006) and NHS reporting guidelines Penny et al. (2012); Standard (2013)).
For remanufacturing to become a widely accepted practice, a collaboration between industry, legislation, and healthcare institutions is necessary. Previous studies have shown that successful remanufacturing is driven by engagement and support from all participating actors, who are largely motivated by triple bottom line benefits: profit, people, and planet Vadoudi et al. (2022); Jensen et al. (2019). With that in mind, in this article, we focus on evaluating the long-term emission savings of remanufactured electrophysiology catheters. They are a promising candidate for remanufacturing on a large scale because they have the potential for significant financial savings (up to £1.7 m annually in the UK Leung et al. (2019)), physician motivation is high (62% in 42 EU-based healthcare centres Boussuge-Roze et al. (2022)), and remanufacturing is promising (40% of ablation procedure emissions come from catheters Ditac et al. (2022)).
In this article, we explore three research questions related to a circular remanufacturing approach for electrophysiology catheters:
Contribution
The novelty of our work is the comprehensive and contextualised analysis of Life Cycle Analysis (LCA) emissions of medical single-use electrophysiology catheters, including the proposal of a long-term emission metric. Following on from the research questions laid out above, we identify three main objectives that this article addresses:
-
(i)
To validate a previous case study on the environmental emissions of electrophysiology catheter remanufacturing Schulte et al. (2021) by the prestigious Fraunhofer Institute.
We have developed a sophisticated, industry-informed Life Cycle Analysis model with the open source openLCA software Ciroth et al. (2019) for both virgin manufactured and remanufactured catheters (Section 3). -
(ii)
To perform a sensitivity analysis of key life cycle parameters, showcasing the magnitude of impact that model uncertainty may have on the total emission results.
After carrying out a holistic evaluation of virgin and remanufactured catheter emissions, we analysed the impact of three key circular economy life parameters: the remanufacturing location, the catheter rejection rate, and the number of remanufacturing turns (Section 4). -
(iii)
To propose a novel framework to assess the realistic, long-term emissions of adopting a circular economy approach with remanufactured medical devices.
Our proposed framework models an industry-informed buy-back scheme to evaluate long-term remanufacturing emissions (Section 4.3). We interpret the results in a healthcare context, taking industry stances and existing literature into account (Sections 5 and 6).
2 Methodology
As discussed in detail in Section 1, the purpose of this study is to develop a novel emission framework to assess the realistic, long-term emissions of a circular medical device economy. To evaluate our approach, we test the proposed framework on a use case of remanufactured single-use electrophysiology catheters and compare our results against a state-of-the-art emissions analysis in the literature. To estimate the emissions of a single medical device, we use Life Cycle Analysis (LCA) modelling, a systematic tool to analyse a product’s environmental impacts over its entire life cycle Kløverpris (2018). This makes our framework device-agnostic, and the comprehensive analysis of single-use catheter remanufacturing may be extended to other medical devices in the future. A flowchart of our methodology is presented in Figure 1.

To ensure that our comprehensive emission analysis framework maintains a high standard and may be seamlessly adopted by the industry for climate impact analysis, we incorporate widely-accepted industry guidelines. The most impactful LCA standards are ISO 14040 iso (2006) and NHS regulations Penny et al. (2012); Standard (2013). More details are given in Sections 2.1.
The following sections discuss the methodology of data collection, LCA modelling, and emission metrics in more detail.
2.1 Life Cycle Analysis Methodology
In this article, we carry out a comparative analysis of a virgin manufactured and a remanufactured electrophysiology catheter’s climate impact. We use Life Cycle Analysis (LCA) modelling to assess a single product’s emissions over the course of its life. LCA systematically quantifies the climate impact of each material and waste input and output. Subsequently, the LCA results are used as the input to our proposed emission framework, which contextualises the emission savings by calculating the realistic, long-term climate impacts of a circular catheter economy. In this section, we present a robust methodology for a comparative LCA. All models and impact calculations were carried out in openLCA version 1.10.3, an open-source LCA software Ciroth et al. (2019).
Our LCA modelling approach was heavily influenced by industry regulations. In particular, we incorporated ISO 14040 iso (2006) guidelines. Additionally, NHS England has published numerous sophisticated LCA reporting and modelling standards Penny et al. (2012); Standard (2013) which were taken into account. These standards are highly significant because they encode the unified principles of a thorough LCA impact analysis, define relevant terms, and describe best practices. The benefit of incorporating these guidelines is that they are defined on an international and national level, respectively, and therefore ensure that the LCA modelling is of high quality and comparable between studies.
ISO prescribes four essential and interconnected steps for LCAs (also visualised in Figure 1): Goal and Scope definition (Section 2), Inventory analysis (Section 3), Impact assessment (Section 4), and Results interpretation (Sections 4 and 5). In contrast, the NHS guidelines are particularly relevant for the emission analysis of medical devices. They give detailed rubrics for the quantitative life cycle materials that should be included in the LCA (see Table 1), and the qualitative assessment of LCA data quality (see Section 2.3).
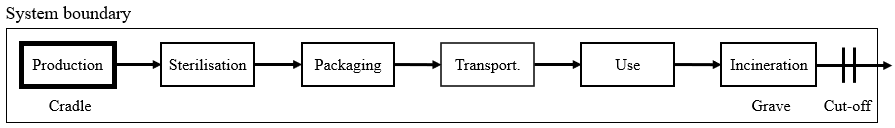
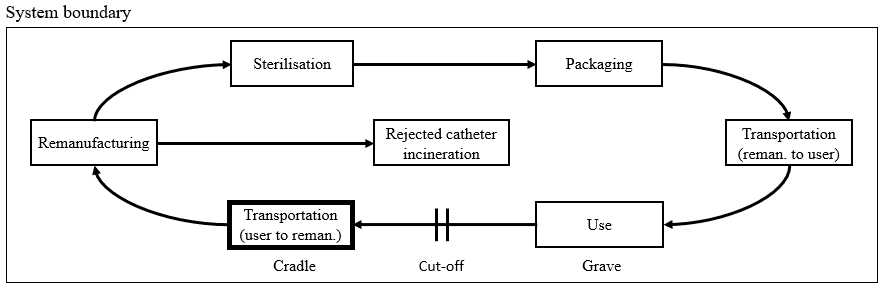
Following the guidelines discussed above, we take the cradle-to-grave modelling approach to measure the impact of a catheter over its entire life Botejara-Antúnez et al. (2022). For a virgin, newly manufactured catheter, this means from the production of the raw resources (cradle) to incineration after one use (grave). For a remanufactured catheter, we measure emissions from the pickup of a used catheter, e.g., at a hospital, to when it has been reused after a successful remanufacturing cycle (grave). The system boundary describes which attributable and non-attributable processes are included in the emission calculations. We follow the quantitative material input guidelines for medical devices as described in the NHS GHG accounting guidance Penny et al. (2012). The list of included and excluded material flows is given in Table 1. Details of the individual life stages and material inputs are described in Section 3.
| Included Processes | Excluded Processes | |
|---|---|---|
| Attributable Processes | Non-Attributable Processes | Attributable & Non-Attrib. |
| Production, processing and transport of raw materials. | Production and distribution of energy/water/chemicals for sterilisation of reusable devices. | Transport of staff involved in delivery, maintenance, refurbishment and repair. |
| Manufacture, sterilisation, packing, storage and distribution of the device. | Production and distribution of consumables required for the operation of a medical device. | Transport of patients to receive treatment. |
| Production and distribution of energy, water and materials consumed by the medical device during operation. | Sterilisation and cleaning chemicals. | General hospital/clinic/home infrastructure to support use of the medical device. |
| Production of spare parts/materials, and energy required for refurbishment and repair of devices. | Refrigerant leakage associated with product manufacturing. | Software to run medical devices. |
| Waste management activities at end-of-life, including transportation. | Ancillary products and equipment, e.g., protective clothing. | |
For a meaningful comparison between one virgin and one remanufactured catheter’s life, we choose the cut-off system model. Consequently, emissions from waste treatment after the first life are attributed to the producer Baustert et al. (2022). In other words, the used virgin catheters are burden-free for the remanufacturing process.
Finally, we forgo normalisation and weighting for the final LCA emission calculations. These techniques may be used to aggregate impact effects and evaluate the results relative to reference information Sánchez-Barroso et al. (2021), while there are benefits to such techniques, they are marked as optional in LCA ISO guidance Borglin et al. (2021) due to widespread criticism of their usefulness. We skip these steps to avoid inadvertently introducing bias through the choice of reference information and to maintain interpretability Pizzol et al. (2017).
2.2 System and Unit-Level Assumptions
The more detailed, expansive, and specific the underlying process data is, the more accurate and realistic a Life Cycle Analysis (LCA) model will be Salemdeeb et al. (2021). However, in the interest of time and cost-effectiveness, most LCA regulations acknowledge a necessary balance between model exactness and simplicity iso (2006, 2006); Penny et al. (2012); Standard (2013), while defining universally effective simplification methods is still an open problem, Gradin and Björklund (2021) suggests that meaningful LCA analysis should include a detailed description of any assumptions built into the model. To increase the interpretability of our results, the following list summarises the system-level assumptions we made.
-
(i)
Catheter producers and remanufacturers follow a Just-in-Time (JIT) inventory management system. Therefore, catheters do not need to be stored, and there are no emissions tied to the running and maintenance of a warehouse.
-
(ii)
Since OEMs produce many virgin device models, we assume that our generalised virgin device is representative of them. This position is supported by our industry collaborators.
-
(iii)
We assume that the modelled virgin single-use device is eligible for remanufacturing.
-
(iv)
We assume that all catheter production steps (e.g., production, assembly, packaging) are performed in the same manufacturing facility and, therefore, transportation of individual components is not required. Equivalently, all remanufacturing steps (e.g., disassembly, cleaning, sterilisation) are performed in the same remanufacturing facility.
-
(v)
Due to concern over the potential contamination of used medical equipment, we assume that virgin and remanufactured end-of-life devices are disposed of by incineration (e.g., rather than recycled).
-
(vi)
We assume that used catheters arriving at a remanufacturing facility are fully functional and do not require replacement components.
-
(vii)
We assume that chips embedded in catheters are not locked by the OEM after first use and therefore do not need to be unlocked during remanufacturing.
We also make the following unit-level assumptions. Concrete details are given in the description of relevant life cycle stages in Section 3 for both virgin and remanufactured single-use devices.
-
(i)
In cases where proprietary component plastics are not available in the Ecoinvent dataset, we assume that replacing these with plastics that have similar production characteristics (most importantly, melting point) will have a similar overall climate impact.
-
(ii)
We assume that some life cycle processes are carried out manually, and therefore do not include material inputs or outputs for those stages.
-
(iii)
We assume that the virgin and remanufactured catheters’ packaging and use stages are the same.
-
(iv)
We assume that ready-to-use catheters (virgin and remanufactured) are packaged manually.
-
(v)
We assume that ready-to-use catheters do not require regular maintenance because they are single-use devices.
-
(vi)
We assume that the average use duration of a catheter in surgery is 1 h, supported by primary data from AMDR.
-
(vii)
We assume that the waste-disposal facility is in the vicinity of the user, and therefore exclude transportation to the incineration site.
2.3 Data Sources and Quality Assessment
Life Cycle Analysis (LCA) models are made up of foreground and background data. Foreground data is specific to the product system that is modelled, while background data gives the context of the wider economic and technological systems Steubing and de Koning (2021). To achieve a realistic representation of the product systems, we collected primary data where possible and filled in gaps from secondary sources. The following data sources were consulted:
-
(i)
Primary foreground sources. NHS England and USA-based medical device remanufacturers AMDR and Innovative Health provided primary process activity data from 2021.
This data focused on life cycle statistics influenced by actors across the single-use catheter’s value chain. In particular, parameters such as the remanufacturing collection, rejection, and success rates. Additionally, our collaborators validated the secondary material and process data for the catheter components and life cycle processes. -
(ii)
Secondary foreground sources. A 2021 case study Schulte et al. (2021) on the life cycle impacts of electrophysiology catheter remanufacturing conducted by the prestigious Fraunhofer Institute for Environmental, Safety and Energy Technology was the source of secondary process activity.
The study provides a detailed bill of materials of the single-use catheter, provided by the Germany-based medical remanufacturer Vanguard AG. Some simplifications were made, including neglecting a filler of polyurethane in the catheter curvature and loop because details about the concentration (and therefore mass) were unknown. However, the authors suggest that this did not significantly influence the total emissions, as the curvature and loop represent only 0.7% of the catheter’s total weight. Similarly, when proprietary component materials were not available in the background dataset, the study replaced them with possible preliminary products (e.g., for the catheter shaft). The article reports that the recorded remanufacturing processes are in full compliance with the specifications of the original product and with the EU Medical Device Directive 93/42/EEC. -
(iii)
Background data sources. The established industry-standard Ecoinvent v3.8 dataset Wernet et al. (2016) provided background data and emission factors for the product processes.
Data points were collected between 2006 and 2011. Ecoinvent process details are given for each material flow data point when discussing the virgin and remanufactured catheter Life Cycle Inventory (LCI) in Section 3.
Since the quality of a Life Cycle Impact Assessment (LCIA) is directly correlated with the quality of the product system’s underlying data Edelen and Ingwersen (2018), we report the data quality for each input and output flow in Section 3. Following the NHS guideline for life cycle reporting Penny et al. (2012) we used an adjusted qualitative data quality appraisal technique (Table 2).
Furthermore, data precision is key in LCIAs, as impacts may be highly sensitive to even minor changes in a range of factors Schulte et al. (2021). Where details about process region, production details, and producers were reported, they were included in the models. Where specific information was missing or inconclusive, we used relevant alternatives to improve data quality following best practices. Details are provided as part of the LCI in Section 3 for all affected material flows and life cycle stages. Improvement methods included:
-
(i)
When data ranges were given, we calculated average values.
-
(ii)
When material producer information was not given, we selected producers from regions with similar production conditions.
-
(iii)
Proprietary plastics that were not represented in the Ecoinvent Wernet et al. (2016) dataset were replaced with alternatives. When selecting the best alternative, the focus was on matching characteristics relevant to plastic production, as plastic processing has the highest environmental impacts throughout a plastic’s life Mannheim (2021).
| Score | Technology | Age | Geography | Completeness | Reliability | Note |
|---|---|---|---|---|---|---|
| Very good | Consistent generation. | <3 years | Same area. | All relevant sites. | Verified data based on measurements. | Primary data from AMDR, Innovative Health, and NHS England. |
| Good | Similar generation. | 3–6 years | Similar area. | More than 50% of sites for an adequate time. | Non-verified data based on measurements. | Data taken directly from the Fraunhofer case study. |
| Fair | Different generation. | 6–10 years | Different areas. | Less than 50% of sites for an adequate time. | Non-verified data partly based on assumptions or a qualified estimate. | Data adapted from the Fraunhofer case study (e.g., due to data availability). |
| Poor | Unknown generation. | >10 years | Unknown area. | Less than 50% of sites for a shorter time. | Non-qualified estimate. | Not applicable. |
2.4 Sensitivity Analysis Methods
As discussed in Section 2, Life Cycle Analysis (LCA) results may be sensitive to even minor changes in the input data. Consequently, sensitivity analysis is a valuable tool to assess uncertainty in the environmental impact results McAlister et al. (2021). In collaboration with NHS England and industry remanufacturers AMDR and Innovative Health, three high-impact remanufacturing parameters were identified for analysis:
-
(i)
The remanufacturing location dictates the transportation mode and route of the used and remanufactured catheters between the user and remanufacturing facilities (studied DE, UK, USA).
-
(ii)
The rejection rate describes the percentage of used catheters discarded during remanufacturing due to their sub-par quality (studied ).
-
(iii)
The number of turns identifies the number of times a catheter may be used overall. For example, a catheter with turns is used once as a virgin catheter and twice as a remanufactured catheter before reaching the end of its life (studied ).
To assess the importance of the above life cycle parameters, we carried out a comprehensive univariate sensitivity analysis in Sections 4.2.1–4.2.3, varying one of the three parameters at a time. After analysing the individual magnitude of LCA result changes, we evaluated the combined effect of the parameter changes in three representative remanufacturing scenarios. The multivariate sensitivity analysis results are presented in Section 4.2.4.
-
(i)
Good scenario: Ideal scenario (UK, %, ).
-
(ii)
Average scenario: Approximately current (DE, %, ).
-
(iii)
Bad scenario: Approximately following Schulte et al. (2021) (USA, %, ).
2.5 Emission Metrics
We chose climate impact as the primary indicator of a catheter’s effects on the environment. Furthermore, known as Greenhouse Gas (GHG) emissions or carbon footprint, climate impact is central to many widely-circulated technical reports and regulations (e.g., the legally binding NHS net zero commitment England and Improvement (2020), EU Commissions Climate Target Plan EU Commission (2020), and the UN’s Paris Agreement Agreement (2015), to name a few). Consequently, the term is familiar to a global audience across the public, industry, and political spectrum.
To quantify a catheter’s climate impact, we followed the Environmental Footprint (EF) 3.0 methodology, a European Commission initiative to standardise the calculation of emissions during a product’s life cycle EU Commission (2013). The unit is kg CO2eq (spoken “carbon dioxide equivalent”), which allows different GHGs to be reported as one value by multiplying their weight with their Global Warming Potential (GWP) Brander and Davis (2012). For this article, the functional unit of analysis is defined as the production and potential disposal of one catheter (virgin or remanufactured) after its use in a 1-hour procedure.
An inherent challenge with circular life cycles such as catheter remanufacturing is how to attribute the total emissions across individual turns. To address this, we follow the NHS GHG reporting guidelines Penny et al. (2012); Standard (2013) on how to calculate per life and per turn emissions. We report the following values in Section 4:
-
(i)
Burden-free per turn emissions for virgin manufactured and for remanufactured catheters;
-
(ii)
Burdened per turn catheter emissions ;
-
(iii)
Furthermore, burdened per life catheter emissions .
Equations (1) and (2) define the total emissions of one virgin catheter and one remanufactured catheter as the sum of all input emissions and output emissions . The superscript indicates that the emission results are burden-free; No previous lives are accounted for. For example, the remanufactured catheter’s emissions do not include emissions from its first virgin life.
| (1) | ||||
| (2) |
In contrast, results marked with the superscript include the emissions from previous lives, i.e., the emissions are burdened. These values are dependent on the number of turns , which describes the total number of uses before a catheter reaches the end of its life and is discarded. For example, a catheter with turns is used exactly three times: once as a virgin catheter and twice as a remanufactured catheter. The formula for a catheter’s emissions across its whole life is given in Equation (3).
| (3) |
For an equivalent turn comparison between a virgin catheter’s emissions and a burdened remanufactured catheter’s emissions, we may calculate the relative per turn emissions with Equation (4).
| (4) |
2.6 Proposed Long-Term Emission Metrics
Industrial medical device remanufacturing is often carried out as a third-party service, and a common approach is to treat it as a buy-back scheme. Evaluating the long-term emissions, therefore, requires estimating the necessary number of units (i.e., catheter uses) required for a period of time, and purchasing an initial injection of virgin devices to be remanufactured until either the quality fails, or the maximum number of turns is reached.
To simulate the emission savings of a long-term buy-back scheme compared to purchasing only new virgin catheters, we must first calculate the necessary number of new catheters to prime the system. Given details of the remanufacturing process, we can solve for the initial number of virgin catheters needed to achieve total catheter uses in a buy-back scheme:
| (5) |
is dependent on the cleared number of turns (where is a catheter’s first virgin life) and the catheter rejection rate . Assuming that all used catheters are successfully collected and returned to the remanufacturer, we may calculate the initial injection of new devices. Similarly to and in Equations (3) and (4), we may define the long-term total and per turn emissions of the buy-back scheme.
| (6) | |||
| (7) |
3 Single-Use Catheter Life Cycles and Material Flows
Before analysing the environmental impacts, we provide a detailed Life Cycle Inventory (LCI). This illustrates the virgin manufactured and remanufactured catheter life cycle stages with a comprehensive description of material inputs and outputs. The start and end life cycle stages (i.e., cradle and grave) are dictated by the functional unit. A functional unit is key in LCAs, as it defines one unit of the product or service being evaluated DeMarco and Fortier (2021). In this paper, we determine it as the production, use (1-h long procedure), and disposal of one catheter. By choosing equivalent functional units for both the virgin and remanufactured scenarios, we may confidently and intuitively compare their emission results (even though catheter ‘production’ includes different processes) Furberg et al. (2022).
To decide which inputs and outputs are contained in the system boundary, we use the quantitative rubric published by NHS guidelines (see Section 2.3). Additionally, we outline the quantity, source, and data quality of each data point in this section, following the NHS guidance for life cycle reporting Standard (2013).
Since component materials and processes may vary significantly based on the catheter model, Original Equipment Manufacturer (OEM), and remanufacturer, we selected representative product systems for the virgin and remanufactured life cycles. The inputs and outputs were largely informed by a 2021 EP catheter case study Schulte et al. (2021) which was supplemented and updated with our primary data from NHS England and USA-based medical device remanufacturers AMDR and Innovative Health (see Section 2). The primary data additionally influenced our catheter use and remanufacturing locations, which were set in the UK and the USA, respectively. To account for the possible bias introduced to our emission values by the chosen representation, we include a sensitivity analysis of key process parameters in our results analysis (Section 4).
3.1 Virgin Manufactured Catheter
A catheter’s linear life cycle was tracked from the production from raw materials in the USA (cradle) to its waste disposal after use in the UK (grave), as shown in Figure 2. Because we selected the cut-off model (see Section 2.1), any energy recovered after incineration was not credited to the catheter’s life cycle. Table 3 presents an overview of the process steps, and subsequent material flows per life stage.
| Stage/Material | Quantity | Source | Quality | Time Range | Region | Description |
| Production | Component production from raw resources and assembly. | |||||
| polyamide | kg | Adjusted Schulte et al. (2021) | Fair | 2011–2021 | GLO | Pre-product for the shaft. |
| ethylene glycol | kg | Adjusted Schulte et al. (2021) | Fair | 2011–2021 | RER | Pre-product for the shaft. |
| polyethylene LD | kg | Schulte et al. (2021) | Good | 2011–2021 | GLO | Shaft stiffener. |
| polysulfone | 0.10810 kg | Adjusted Schulte et al. (2021) | Fair | 2012–2021 | GLO | Plug and handle. |
| polyurethane | kg | Schulte et al. (2021) | Good | 2018–2021 | RER | Curvature and loop. |
| electricity | 0.026 kWh | Adjusted Table 4 | Fair | 2014-2021 | US-WECC | Component assembly. |
| Sterilisation | Gas sterilisation. | |||||
| carbon dioxide | kg | Schulte et al. (2021) | Good | 2011–2021 | RER | Sterilisation gas ingredient. |
| ethylene oxide | kg | Schulte et al. (2021) | Good | 2018–2021 | GLO | Sterilisation gas ingredient. |
| electricity | 0.360 kWh | Schulte et al. (2021) | Good | 2014–2021 | US-WECC | Process electricity. |
| Packaging | Manual packaging. | |||||
| polyethylene HD | kg | Schulte et al. (2021) | Good | 2011–2021 | GLO | Primary (sterile) packaging. |
| carton box | kg | Adjusted Schulte et al. (2021) | Fair | 2011–2021 | GLO | Secondary packaging. |
| Transport | Transport from manufacturer to user. | |||||
| container ship | 0.11890 kg | Ports.com1 | Fair | 2007–2021 | GLO | USA-UK sea route. |
| 18,760 km | ||||||
| lorry | 0.11890 kg | Google maps1 | Fair | 2011–2021 | RER | UK final distribution. |
| 250 km | ||||||
| Use | Materials consumed by device. | |||||
| electricity | 0.050 kWh | AMDR, IH, Food and Drug Administration (2007) (FDA) | Very Good | 2014–2021 | GB | 1 h of use, 50 watts. |
| Incineration | End-of-life waste disposal. | |||||
| plastic incineration | 0.11890 kg | Schulte et al. (2021) | Good | 2006–2021 | CH | Municipal (100%). |
1 Accessed on 25 November 2022.
3.1.1 Production Stage
The catheter production stage consisted of the raw resource extraction, component production, and device assembly steps. We assume that all components were produced in the same facility, which is also where the catheter was assembled.
A catheter was made up of a plug, handle, curvature, loop, and shaft, and weighed a total of 118.9 g. Plastic components were modelled following the case study Schulte et al. (2021), which used a bill of materials provided by their collaborating remanufacturer, Vanguard AG. We assume that other materials were excluded because they do not significantly contribute to the catheter emissions, e.g., by the material cut-off rule presented in Penny et al. (2012). Several proprietary plastics were not available in the Ecoinvent v3.8 dataset Wernet et al. (2016) (PEI granulate and PA6). In these cases, we selected replacement materials that closely matched the manufacturing properties of the original plastics (polysulfone and polyamide, respectively). Most importantly, by ensuring a similar melting point, we expect to achieve high similarity in the overall plastic life cycle impacts on the modelled catheter. This is because the production process, undertaken at high temperatures, is one of the most energy and environmental impact-intensive stages of the material’s life (e.g., melting the plastic, pre-heating moulds and dies) Mannheim (2021), while our replacements may influence other impact categories, they will create similar results for GHG emissions, our chosen climate impact (see Section 2.5).
Once the components were manufactured (electricity and other input emissions are included in the material flows), electricity was required to assemble them into a completed catheter. Because this step was excluded in the original study, we calculated the assembly electricity as half of the electricity used to assemble and disassemble a used catheter during remanufacturing (see Section 3.2).
3.1.2 Sterilisation and Packaging Stages
Before transportation to the user, all virgin manufactured catheters were sterilised with ethylene oxide gas. According to Schulte et al. (2021), the material inputs given in Table 3 were the main identifiable components from a safety sheet provided to the authors by Vanguard AG, a medical remanufacturer based in Germany. The data was also supported by AMDR’s primary data. Apart from the gas materials, electricity was also needed to complete the procedure (e.g., gas introduction and evacuation from the sterilisation chamber).
We assume that the packaging stage is carried out manually. Therefore, only the packaging materials are required as input to the model.
3.1.3 Transportation Stage
After production, sterilisation, and packaging, the catheters were transported from the remanufacturer in the USA to an NHS end user in the UK. There were two transportation stages: A representative 18760km container ship route between the USA and UK, and a 250km lorry transport for the final distribution within the UK. The locations were updated from the case study, which used locations specific to their collaborators (USA and Germany, respectively).
3.1.4 Use Stage
A major update in our approach compared to Schulte et al. (2021) is the inclusion of emissions generated during the use stage. As shown in Table 1, NHS GHG modelling standards Penny et al. (2012) dictate that materials consumed by a medical device during the use stage should be included in the life cycle assessment. Electrophysiology catheters require only electricity to be operational. Therefore, we included a catheter’s average energy use. The total amount was calculated from the average length of an electrophysiology procedure (1-hour length, primary data from AMDR) and the average watts a catheter draws Food and Drug Administration (2007) (FDA). Because electrophysiology catheters are single-use devices, they do not need regular maintenance before being used.
3.1.5 Incineration Stage
Medical devices are most commonly incinerated after disposal to reduce contamination risk. For the end-of-life incineration after one use, we assume that the waste management facility was in the vicinity of the user, and therefore exclude transportation to the incineration site.
3.2 Remanufactured Catheter
Compared to the virgin catheter, a remanufactured catheter has a circular life cycle as shown in Figure 3. That starting life stage (cradle) is when a used catheter is transported from the previous user to the remanufacturer. The life cycle ends (grave) after a successfully remanufactured catheter is used by a healthcare provider.
The total weight of a remanufactured catheter is 118.9 g, the same as a virgin catheter. Table 4 presents an overview of the material flows per life stage.
| Stage/Material | Quantity | Source | Quality | Time Range | Region | Description |
| Transport | Transport from remanufacturer to user and back. | |||||
| container ship | 0.11890 kg | Ports.com1 | Fair | 2007–2021 | GLO | USA-UK sea route. |
| 18,760 km | ||||||
| lorry | 0.11890 kg | Google maps1 | Fair | 2011–2021 | RER | UK final distribution. |
| 250 km | ||||||
| Reman. | Dissassembly, reman., reassembly, and testing. | |||||
| hydrogen peroxide | 0.03020 kg | Schulte et al. (2021) | Good | 2018–2021 | RER | Detergent ingredient. |
| sodium bicarbonate | kg | Schulte et al. (2021) | Good | 2011–2021 | GLO | Detergent ingredient. |
| sodium cumensulph. | kg | Schulte et al. (2021) | Good | 2015–2021 | GLO | Detergent ingredient. |
| tap water | 7.00000 kg | Schulte et al. (2021) | Good | 2012–2021 | Europe | Process water. |
| water, ultrapure | 5.00000 kg | Adjusted Schulte et al. (2021) | Fair | 2009–2021 | CA-QC | Process water. |
| electricity | 0.207 kWh | Schulte et al. (2021) | Good | 2014–2021 | US-WECC | Process electricity. |
| Incineration | End-of-life waste disposal. | |||||
| plastic incineration | 0.01784 kg | AMDR, IH | Good | 2006–2021 | RoW | Municipal (15% rejection rate). |
| Sterilisation | Gas sterilisation. | |||||
| carbon dioxide | kg | Schulte et al. (2021) | Good | 2011–2021 | RER | Sterilisation gas ingredient. |
| ethylene oxide | kg | Schulte et al. (2021) | Good | 2018–2021 | RER | Sterilisation gas ingredient. |
| electricity | 0.360 kWh | Adjusted Schulte et al. (2021) | Good | 2014–2021 | US-WECC | Process electricity. |
| Packaging | Manual packaging. | |||||
| polyethylene HD | kg | Schulte et al. (2021) | Good | 2011–2021 | GLO | Primary (sterile) packaging. |
| carton box | kg | Adjusted Schulte et al. (2021) | Fair | 2011–2021 | GLO | Secondary packaging. |
| Use | Materials consumed by device. | |||||
| electricity | 0.050 kWh | AMDR, Food and Drug Administration (2007) (FDA) | Very Good | 2014–2021 | GB | 1 h of use, 50 watts. |
1 Accessed on 25 November 2022.
3.2.1 Transportation Stage
In a significant change from Schulte et al. (2021), we have doubled the transportation route between the USA and the UK. The case study assumes that the used catheters and remanufactured catheters are transported in a single round trip. However, discussions with medical device remanufacturers AMDR and Innovative Health revealed that this does not reflect current industry practice. Each transport route has two stages: A representative 18,760 km container ship route between the USA and UK, and a 250 km lorry transport for the final distribution within the UK.
3.2.2 Remanufacturing Stage
The catheter remanufacturing stage consists of the disassembly, cleaning, reassembly, and testing steps. We assume that all processes take place in the same remanufacturing facility, and therefore do not include further transportation. Additionally, we assume that the electrophysiology catheter’s software does not have to be maintained. Used catheters that failed quality control at any point of the process or passed their cleared number of maximum turns reached their end of life. For simplicity, the modelled remanufacturing process does not include replacing faulty components.
A significant difference of our model to Schulte et al. (2021) is the rejection rate. The case study assumes an almost 50% rejection rate. In other words, only one catheter is successfully reprocessed for every two used catheters that arrive at the remanufacturing facility. In comparison, medical device remanufacturers AMDR and Innovative Health confirmed that a 15% rejection rate more accurately reflects the current state of EP catheter remanufacturing in 2021.
3.2.3 Incineration Stage
As with the virgin catheter, we assume that incineration occurs near the healthcare provider and therefore exclude transportation to the waste management facility (see Section 3.1).
3.2.4 Sterilisation and Packaging Stages
The gas sterilisation and packaging processes are assumed to be exactly the same as for a virgin single-use catheter (see Section 3.1.2).
3.2.5 Use Stage
According to NHS regulations Standard (2013), medical device remanufacturing must return a used catheter to its original state to classify it as a remanufactured single-use device. Consequently, we may assume that the use stage of a fully remanufactured catheter is the same as that of a virgin manufactured catheter (see Section 3.1.4).
4 Greenhouse Gas Emission Results
This section contains our comparative analysis of virgin manufactured and remanufactured catheter emissions. All results were generated following the comprehensive methodology illustrated in Section 2. Wider-context insights and implications initiated by the results are discussed in Section 5.
The functional unit of analysis is defined as the production and potential disposal of one catheter after its use in a 1-h procedure. We report the following values:
-
(i)
Burden-free per turn emissions for virgin manufactured and for remanufactured catheters;
-
(ii)
Burdened per turn catheter emissions ;
-
(iii)
Furthermore, burdened per life catheter emissions .
Readers are referred to Section 2.5 for a more detailed treatment of the metrics with definitions, equations, and intuitions.
4.1 Burden-Free Catheter Emissions
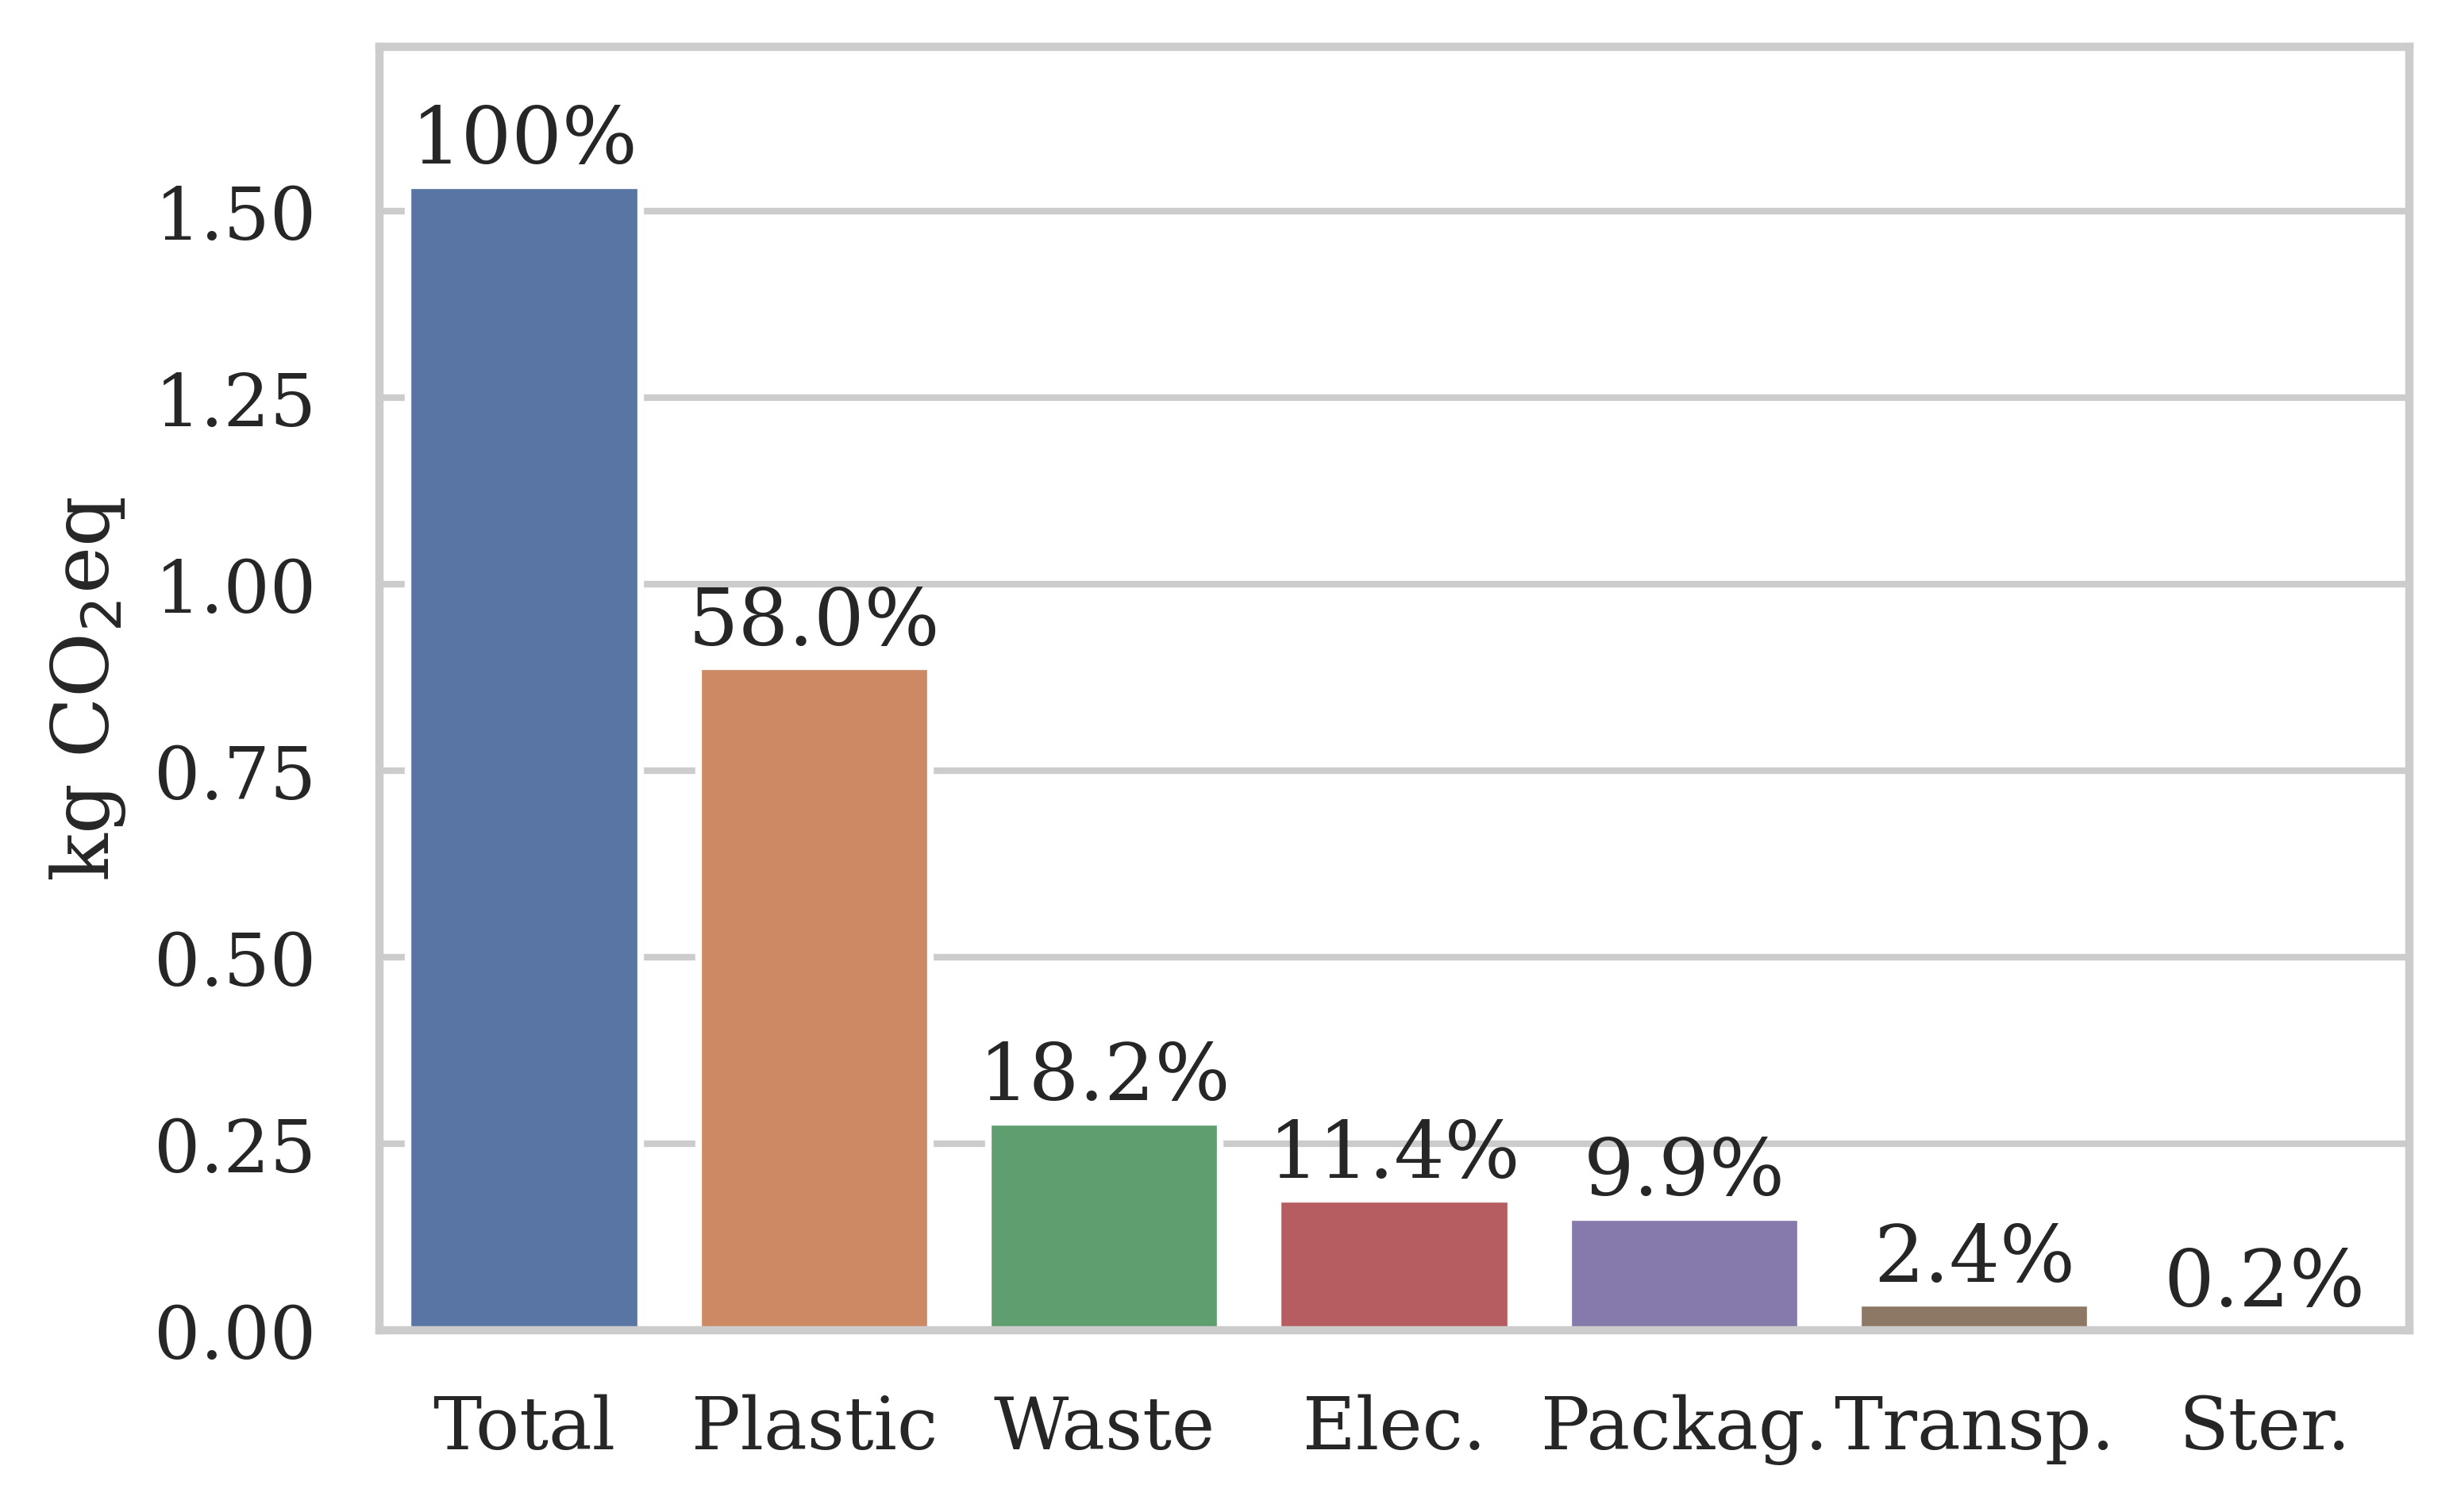
The total climate emissions generated during the production, use, and disposal of one virgin catheter is kg CO2eq (based on the material inputs shown in Table 3). Figure 4a shows how the total value is broken down into material categories. For a different perspective, interested readers are referred to Table 5a for the emissions per life stage and individual material. As expected, the procurement and manufacturing of plastic catheter components were responsible for the majority of virgin catheter emissions, coming in at 58%. Disposing of the waste plastic was also a significant contributor, covering 18%. In total, around three-quarters of virgin catheter emissions came from the production and disposal of plastic components, which implies that remanufacturing may make a consequential dent in life cycle emissions. The two lowest contributors were gas sterilisation (0.2%) and, surprisingly, transportation of catheters between the USA-based manufacturer and the UK-based user (2.4%). We will explore this figure in more detail as part of the sensitivity analysis in Section 4.2.1.
| (a) Virgin manufactured catheter | (b) Remanufactured catheter | ||||
|---|---|---|---|---|---|
| Stage/Material | Kg CO2eq | Proportion | Stage/Material | Kg CO2eq | Proportion |
| Production | 0.90018 | 58.65% | Transport 2 | 0.07223 | 11.80% |
| polyamide | 0.02934 | 1.91% | container ship | 0.04203 | 6.87% |
| ethylene glycol | 0.00261 | 0.17% | lorry | 0.03020 | 4.93% |
| polyethylene LD | 0.00077 | 0.05% | Remanufacturing | 0.14603 | 23.85% |
| polysulfone | 0.85250 | 55.55% | hydrogen peroxide | 0.03497 | 5.71% |
| polyurethane | 0.00419 | 0.27% | sodium bicarbonate | 0.01861 | 3.04% |
| electricity | 0.01077 | 0.70% | sodium cumensulph. | 0.00084 | 0.14% |
| Sterilisation | 0.15171 | 9.89% | tap water | 0.00232 | 0.38% |
| carbon dioxide | 0.00229 | 0.15% | water, ultrapure | 0.00368 | 0.60% |
| ethylene oxide | 0.00034 | 0.02% | electricity | 0.08561 | 13.98% |
| electricity | 0.14908 | 9.72% | Incineration | 0.09426 | 15.40% |
| Packaging | 0.15188 | 9.90% | plastic incineration | 0.09426 | 15.40% |
| polyethylene HD | 0.04798 | 3.13% | Sterilisation | 0.15182 | 24.80% |
| carton box | 0.10390 | 6.77% | carbon dioxide | 0.00229 | 0.37% |
| Transport | 0.03612 | 2.35% | ethylene oxide | 0.00034 | 0.06% |
| container ship | 0.02102 | 1.37% | electricity | 0.14919 | 25.24% |
| lorry | 0.01510 | 0.98% | Packaging | 0.13201 | 21.57% |
| USE | 0.01586 | 1.04% | polyethylene HD | 0.04798 | 7.84% |
| electricity | 0.01586 | 1.04% | carton box | 0.08403 | 13.73% |
| Incineration | 0.27902 | 18.18% | Use | 0.01586 | 2.59% |
| plastic incineration | 0.27902 | 18.18% | electricity | 0.01586 | 2.59% |
| 1.53477 | 100.00% | 0.61221 | 100.00% | ||
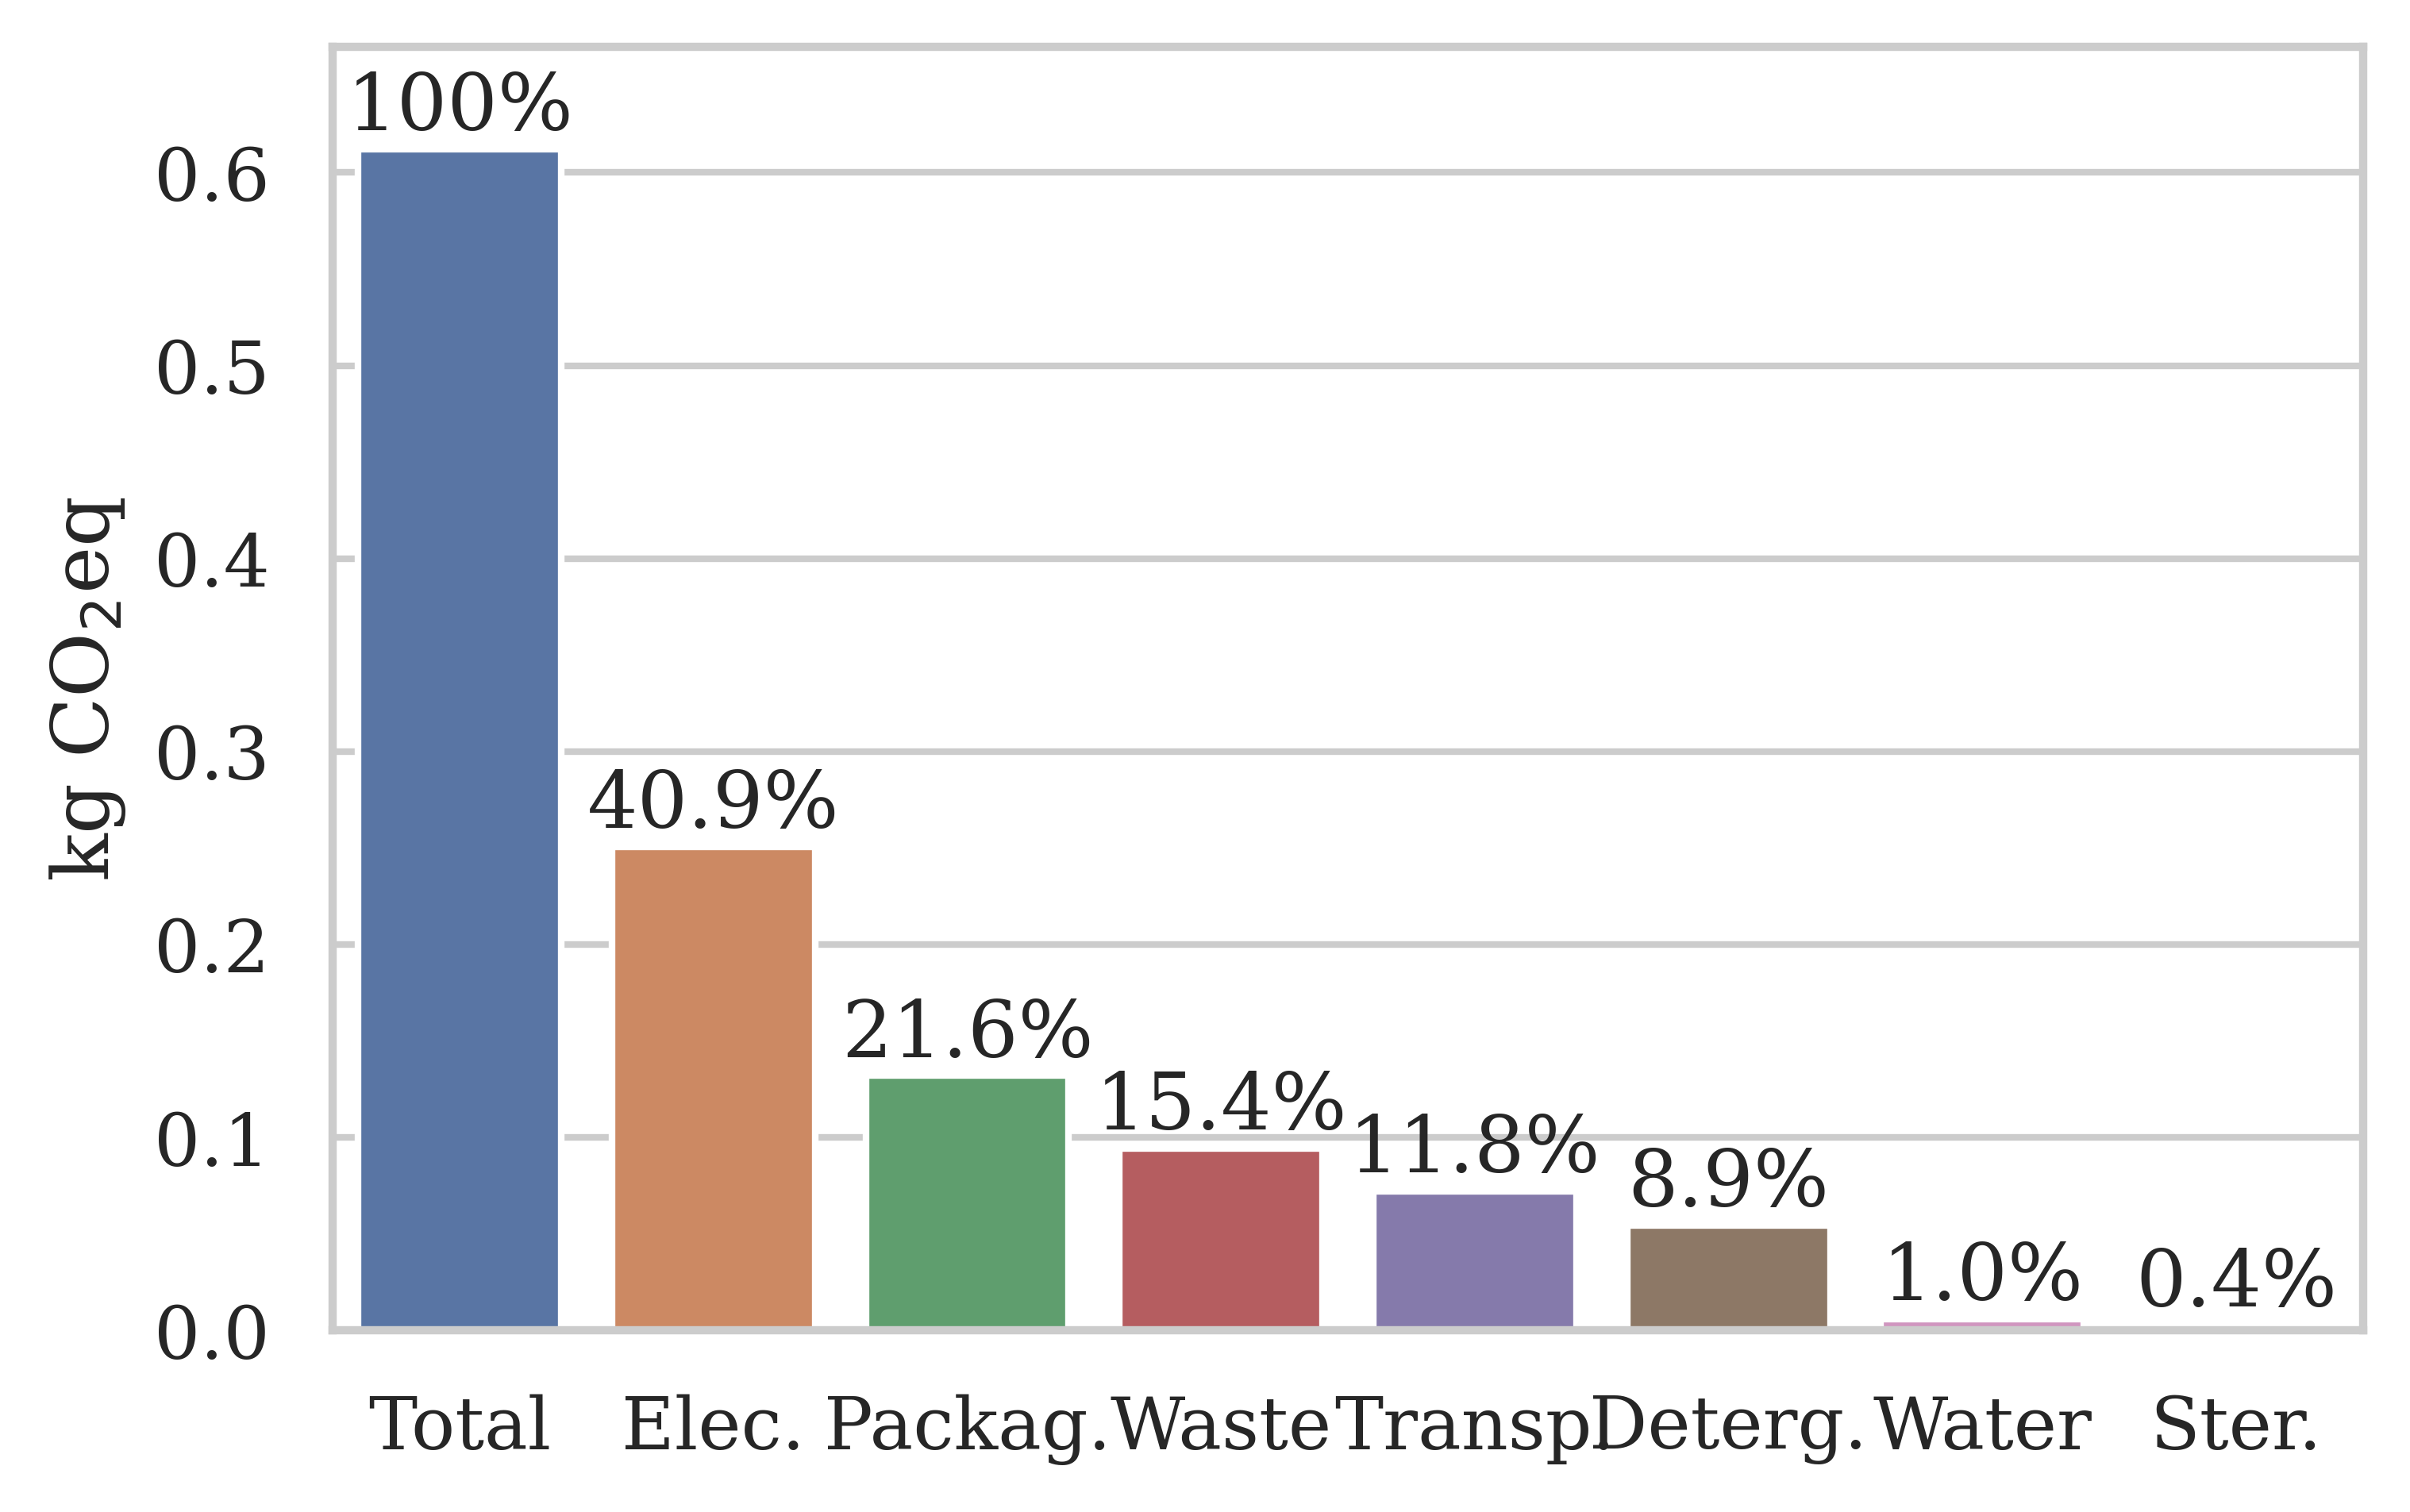
Turning to a remanufactured catheter, climate emissions totalled kg CO2eq (Note that the used catheter at the start of the remanufacturing process had no emissions tied to it, as dictated by the cut-off model we used (see Section 2)). (based on the material inputs shown in Table 4). Figure 4b illustrates the emission breakdown into categories. For more detail on the life stage and material emissions, see Table 5b. Compared to the virgin catheter, emissions were more evenly divided across categories. Electricity was the highest single contributor (41%), which suggests that the composition of energy production may be a significant factor when optimising the remanufacturing process. The lowest climate impact categories were water (1%) and sterilisation gas (0.4%).
Comparing a virgin catheter to a remanufactured catheter, we found that remanufacturing reduced climate emissions by 60% per burden-free catheter (1.92 kg CO2eq, Table 6). As expected, the single largest emission saving came from the omission of plastic processing and component manufacture (1.89 kg CO2eq) with reduced waste processing in second place (1.19 kg CO2eq). In contrast, the inclusion of cleaning inputs for remanufacturing (detergent, water, electricity) only marginally increased the emissions by +0.14 kg CO2eq. A final noteworthy change is that the transportation emissions were doubled for the remanufactured catheter, since the used catheters had to be transported to the remanufacturing facility and back to the user. However, total transportation emissions were still nominal (0.07 kg CO2eq).
| Category | Virgin | Reman. | |
|---|---|---|---|
| Plastic | 0.889 | 0 | 1.889 |
| Waste | 0.279 | 0.094 | 1.185 |
| Elec. | 0.176 | 0.251 | +0.075 |
| Packag. | 0.152 | 0.132 | 1.020 |
| Transp. | 0.036 | 0.072 | +0.036 |
| Deterg. | 0 | 0.054 | +0.054 |
| Water | 0 | 0.006 | +0.006 |
| Ster. | 0.003 | 0.003 | 0 |
| 1.535 | 0.612 | 1.923 |
4.2 Sensitivity Analysis and Burdened Catheter Emissions
In this section, we carry out a comprehensive sensitivity analysis of three high-impact remanufacturing life cycle parameters:
-
(i)
The remanufacturing location .
-
(ii)
The rejection rate .
-
(iii)
Furthermore, the number of turns .
After examining the magnitude of each key parameter’s individual effect on emissions (Sections 4.2.1–4.2.3), we contextualise the results by analysing three representative scenarios (Section 4.2.4). Readers are referred to Section 2.4 for a detailed description of the methodology and parameters.
4.2.1 Remanufacturing Location
Remanufacturing is commonly offered as a third-party service Opresnik and Taisch (2015). When comparing catheter life cycle emissions, we must consider both the absolute and relative location of the remanufacturing facility to the user because both may have wide-ranging effects: from the transport mode and distance to the origin and composition of the remanufacturing materials and processes (e.g., electricity generation, water processing, waste treatment).
Figure 5 shows the burden-free emission results for one catheter remanufactured in three different locations: Germany (0.77 kg CO2eq), USA (0.61 kg CO2eq), and UK (0.53 kg CO2eq). In each scenario, the remanufactured catheter was used in the UK. Electricity showed a noticeable emissions increase when remanufacturing took place in Germany (+0.06 kg CO2eq), potentially because energy generation is more reliant on coal combustion than other countries Bruninx et al. (2013). Conversely, UK remanufacturing reduced electricity emissions by 1.6 kg CO2eq. Since electricity was the highest emission category, the composition of energy production technologies should be taken into consideration to optimise the remanufacturing process.
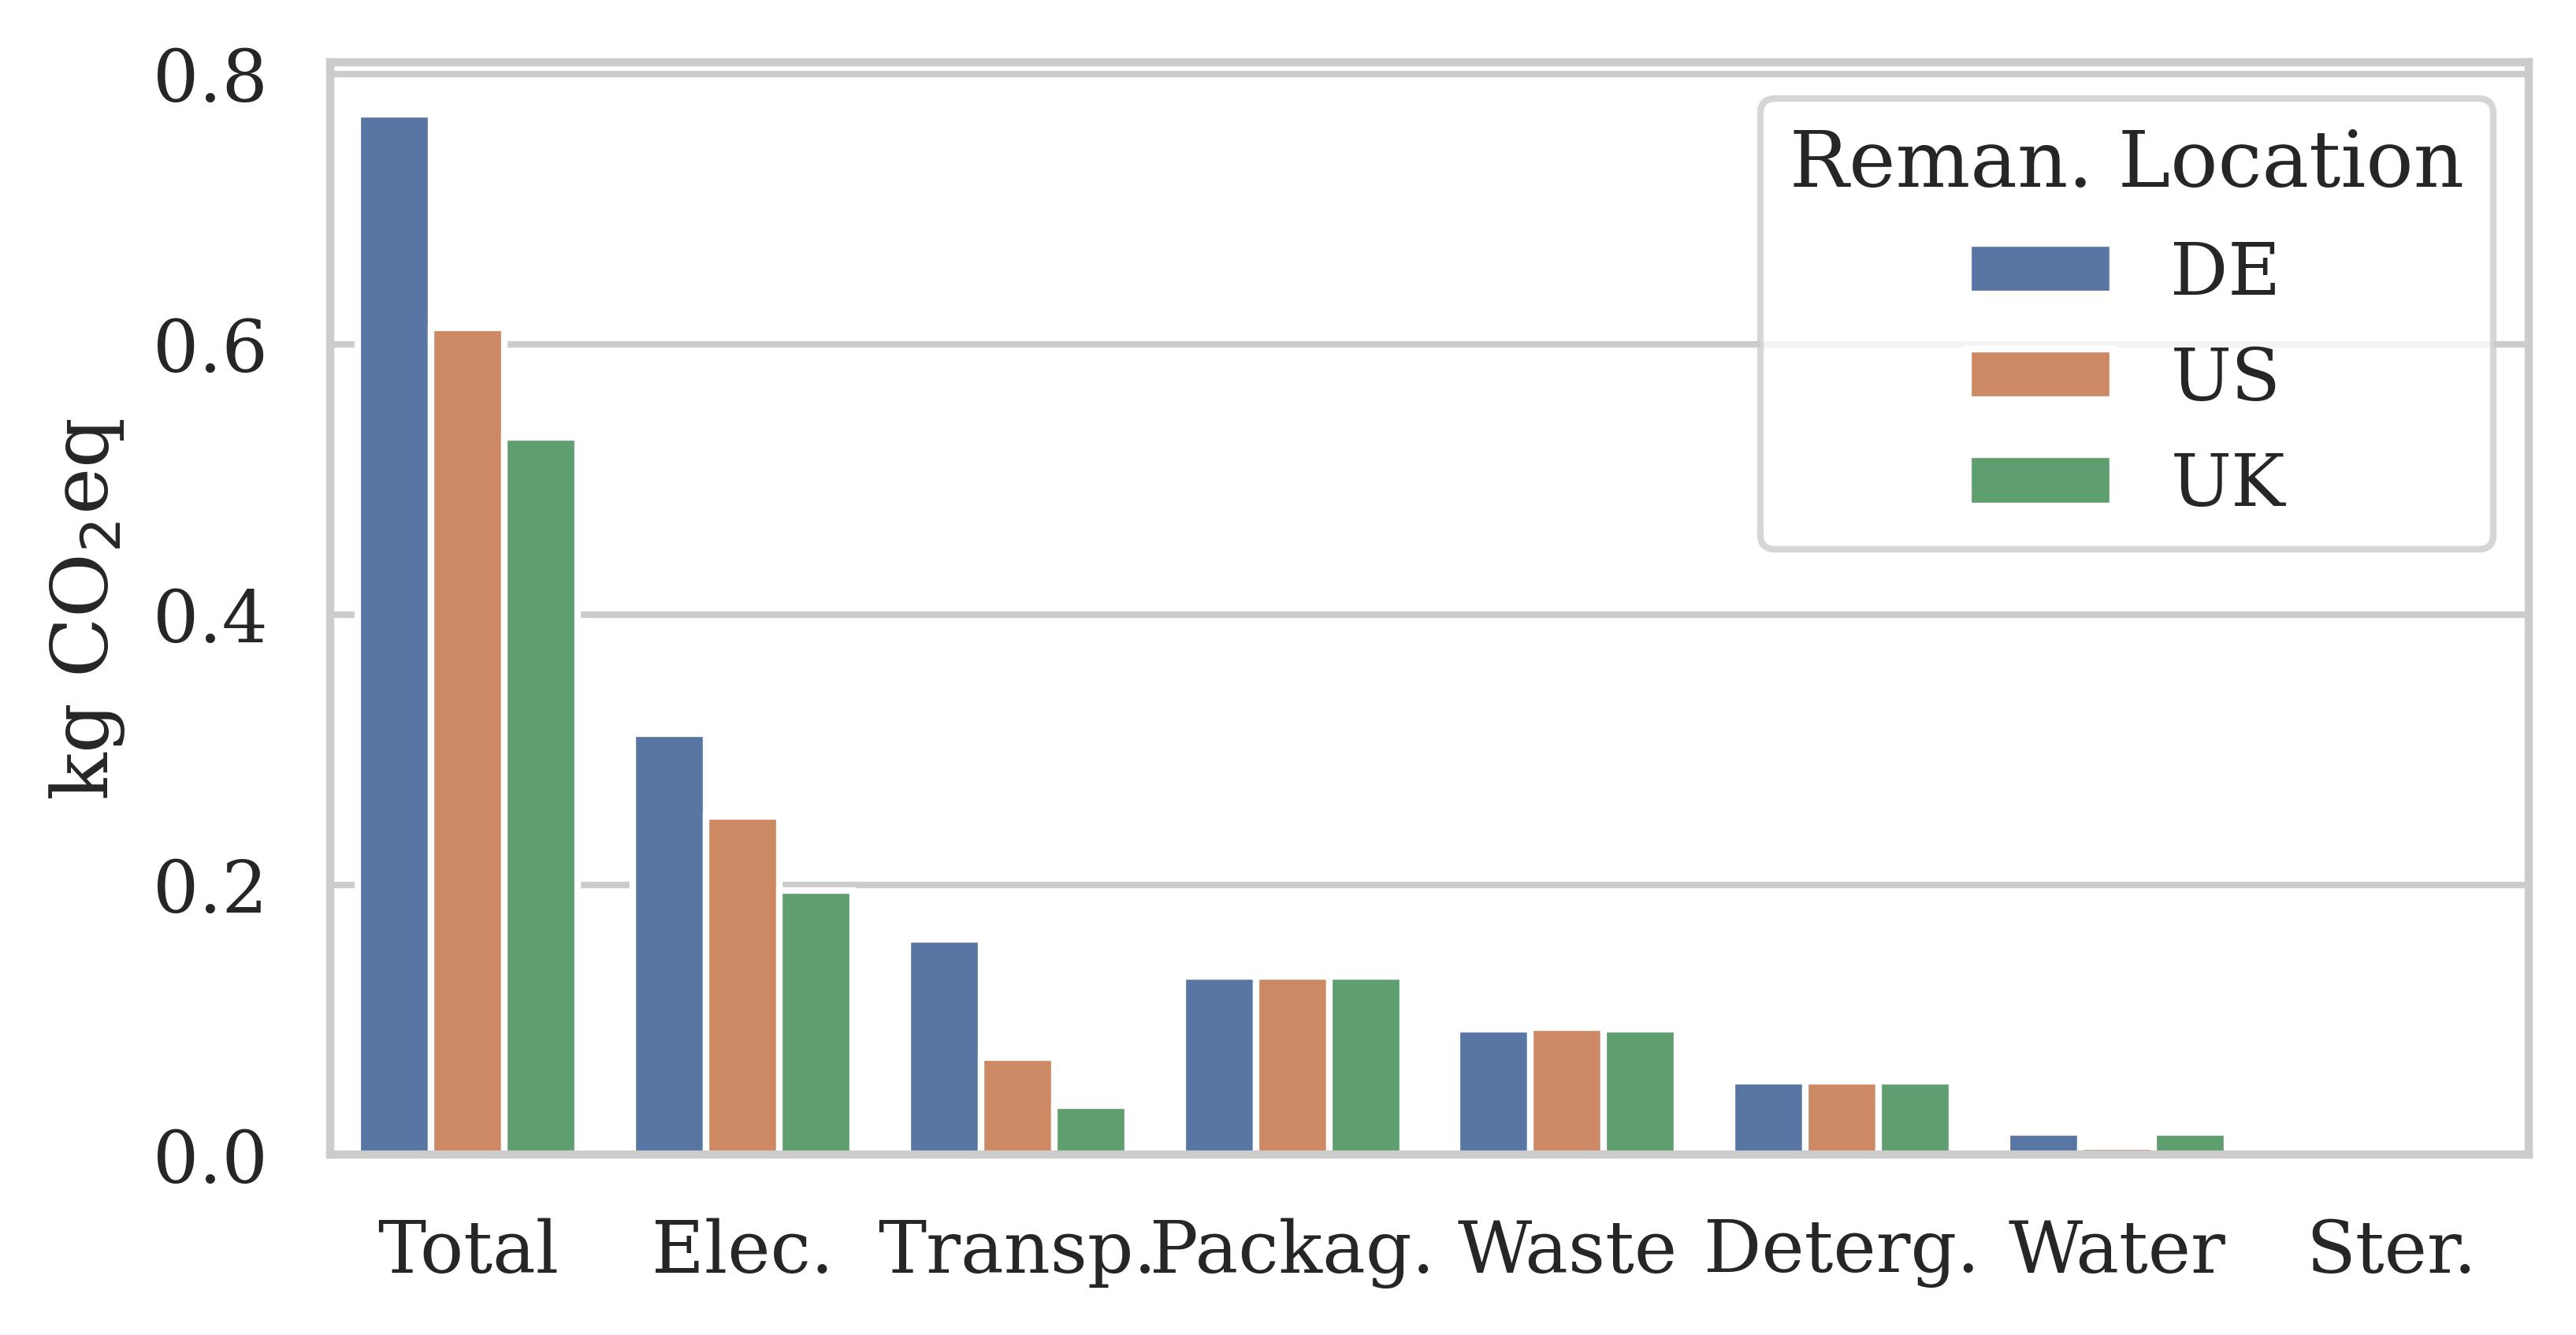
Surprisingly, the transportation of used and remanufactured catheters between Germany and the UK had the highest climate impact as well (0.16 kg CO2eq), over USA-UK transportation (0.07 kg CO2eq). This may be partially due to the different transport modes. Our results suggest that in terms of their climate impact, long-distance routes using primarily container ship transportation (USA-UK, 19,000 km) may be more efficient than shorter-distance routes using primarily road transportation (DE-UK, 1400 km). Interestingly, the total transport distance may not necessarily indicate the emission efficiency of a remanufacturing location.
Given its significance to the majority of remanufacturing materials and processes, it is unexpected to see multiple categories with only minor changes between the burden-free emissions at three different locations. We hypothesise that this is most likely due to two reasons:
-
(i)
The materials (e.g., for cleaning and sterilisation) were in small quantities, and therefore the absolute regional differences were minimal,
-
(ii)
And/or Ecoinvent v3.8 Wernet et al. (2016) had only broad regional categories that included multiple remanufacturing locations such as the ‘global’ region for waste treatment, packaging, and water.
For those categories, more detailed and regionally distinguished data flows could be used in future for more precise emission calculations.
Even with the stated regionality limitations, our results highlight the environmental impact a catheter user may exert through the careful selection of a remanufacturer based on their facility’s location. Our results suggest that the location of remanufacturing may not just have a significant effect on the emissions caused by the transportation, but also on the climate impact of the remanufacturing process itself.
4.2.2 Rejection Rate
The rejection rate describes the proportion of used catheters that are discarded due to sub-par quality for every successfully remanufactured catheter. Many factors, including the catheter model and collection processes, may influence the quality rejection rate. For simplicity, we assume that low-quality catheters are rejected on arrival at the remanufacturing facility (e.g., because of missing identification or damage during collection).
To illustrate the significant influence of the rejection rate on remanufacturing emissions, we evaluated a range from 0% (optimal) to 70% in Figure 6. The virgin catheter emissions are given for reference (kg CO2eq). As the rejection rate increases, the burden-free remanufactured catheter emissions increased exponentially from 0.52 to 1.18 kg CO2eq. To put that in context relative to a virgin catheter, a 0% rejection rate represents a 66% emission reduction through remanufacturing, 35% represents 56% reduction, and 70% means only a 23% reduction, respectively.
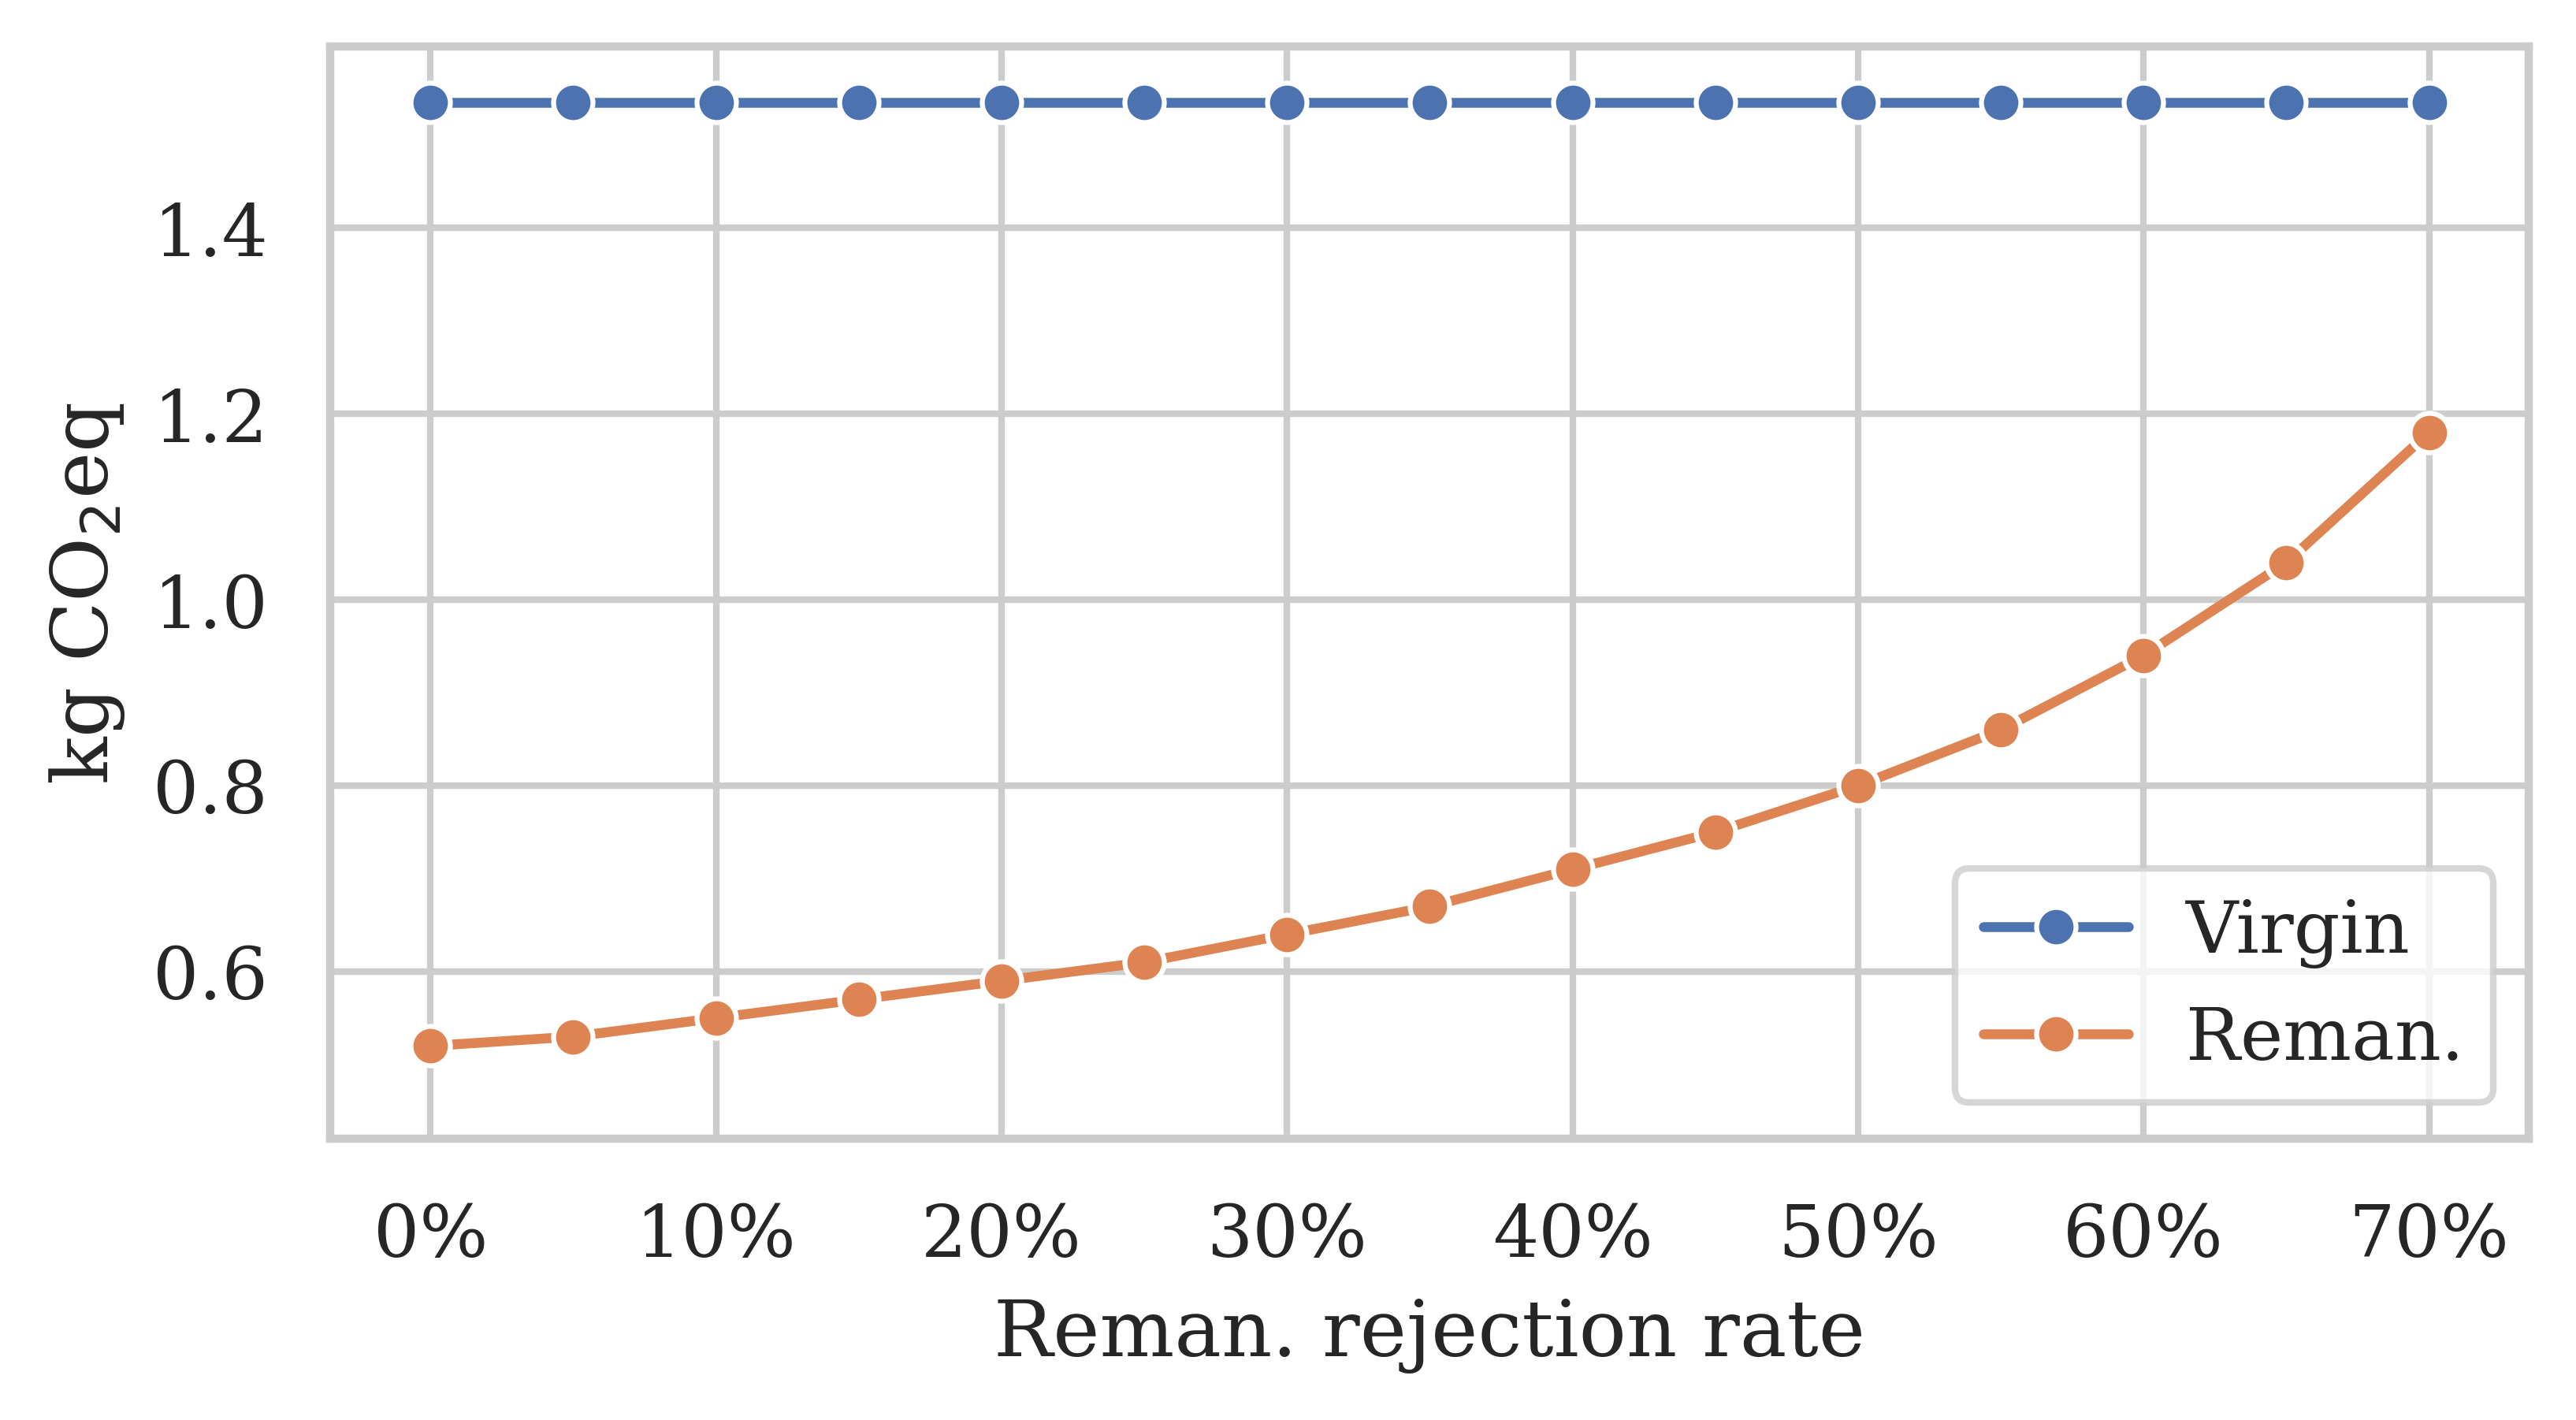
The increased emission savings were directly caused by a lower quality rejection rate, which implies that more of the used catheters arriving at the remanufacturing facility could be successfully reprocessed. In turn, this led to less used catheters reaching their end of life due to a low quality. The climate impact reduction primarily stemmed from the reduced waste incineration per reprocessed catheter.
4.2.3 Number of Turns
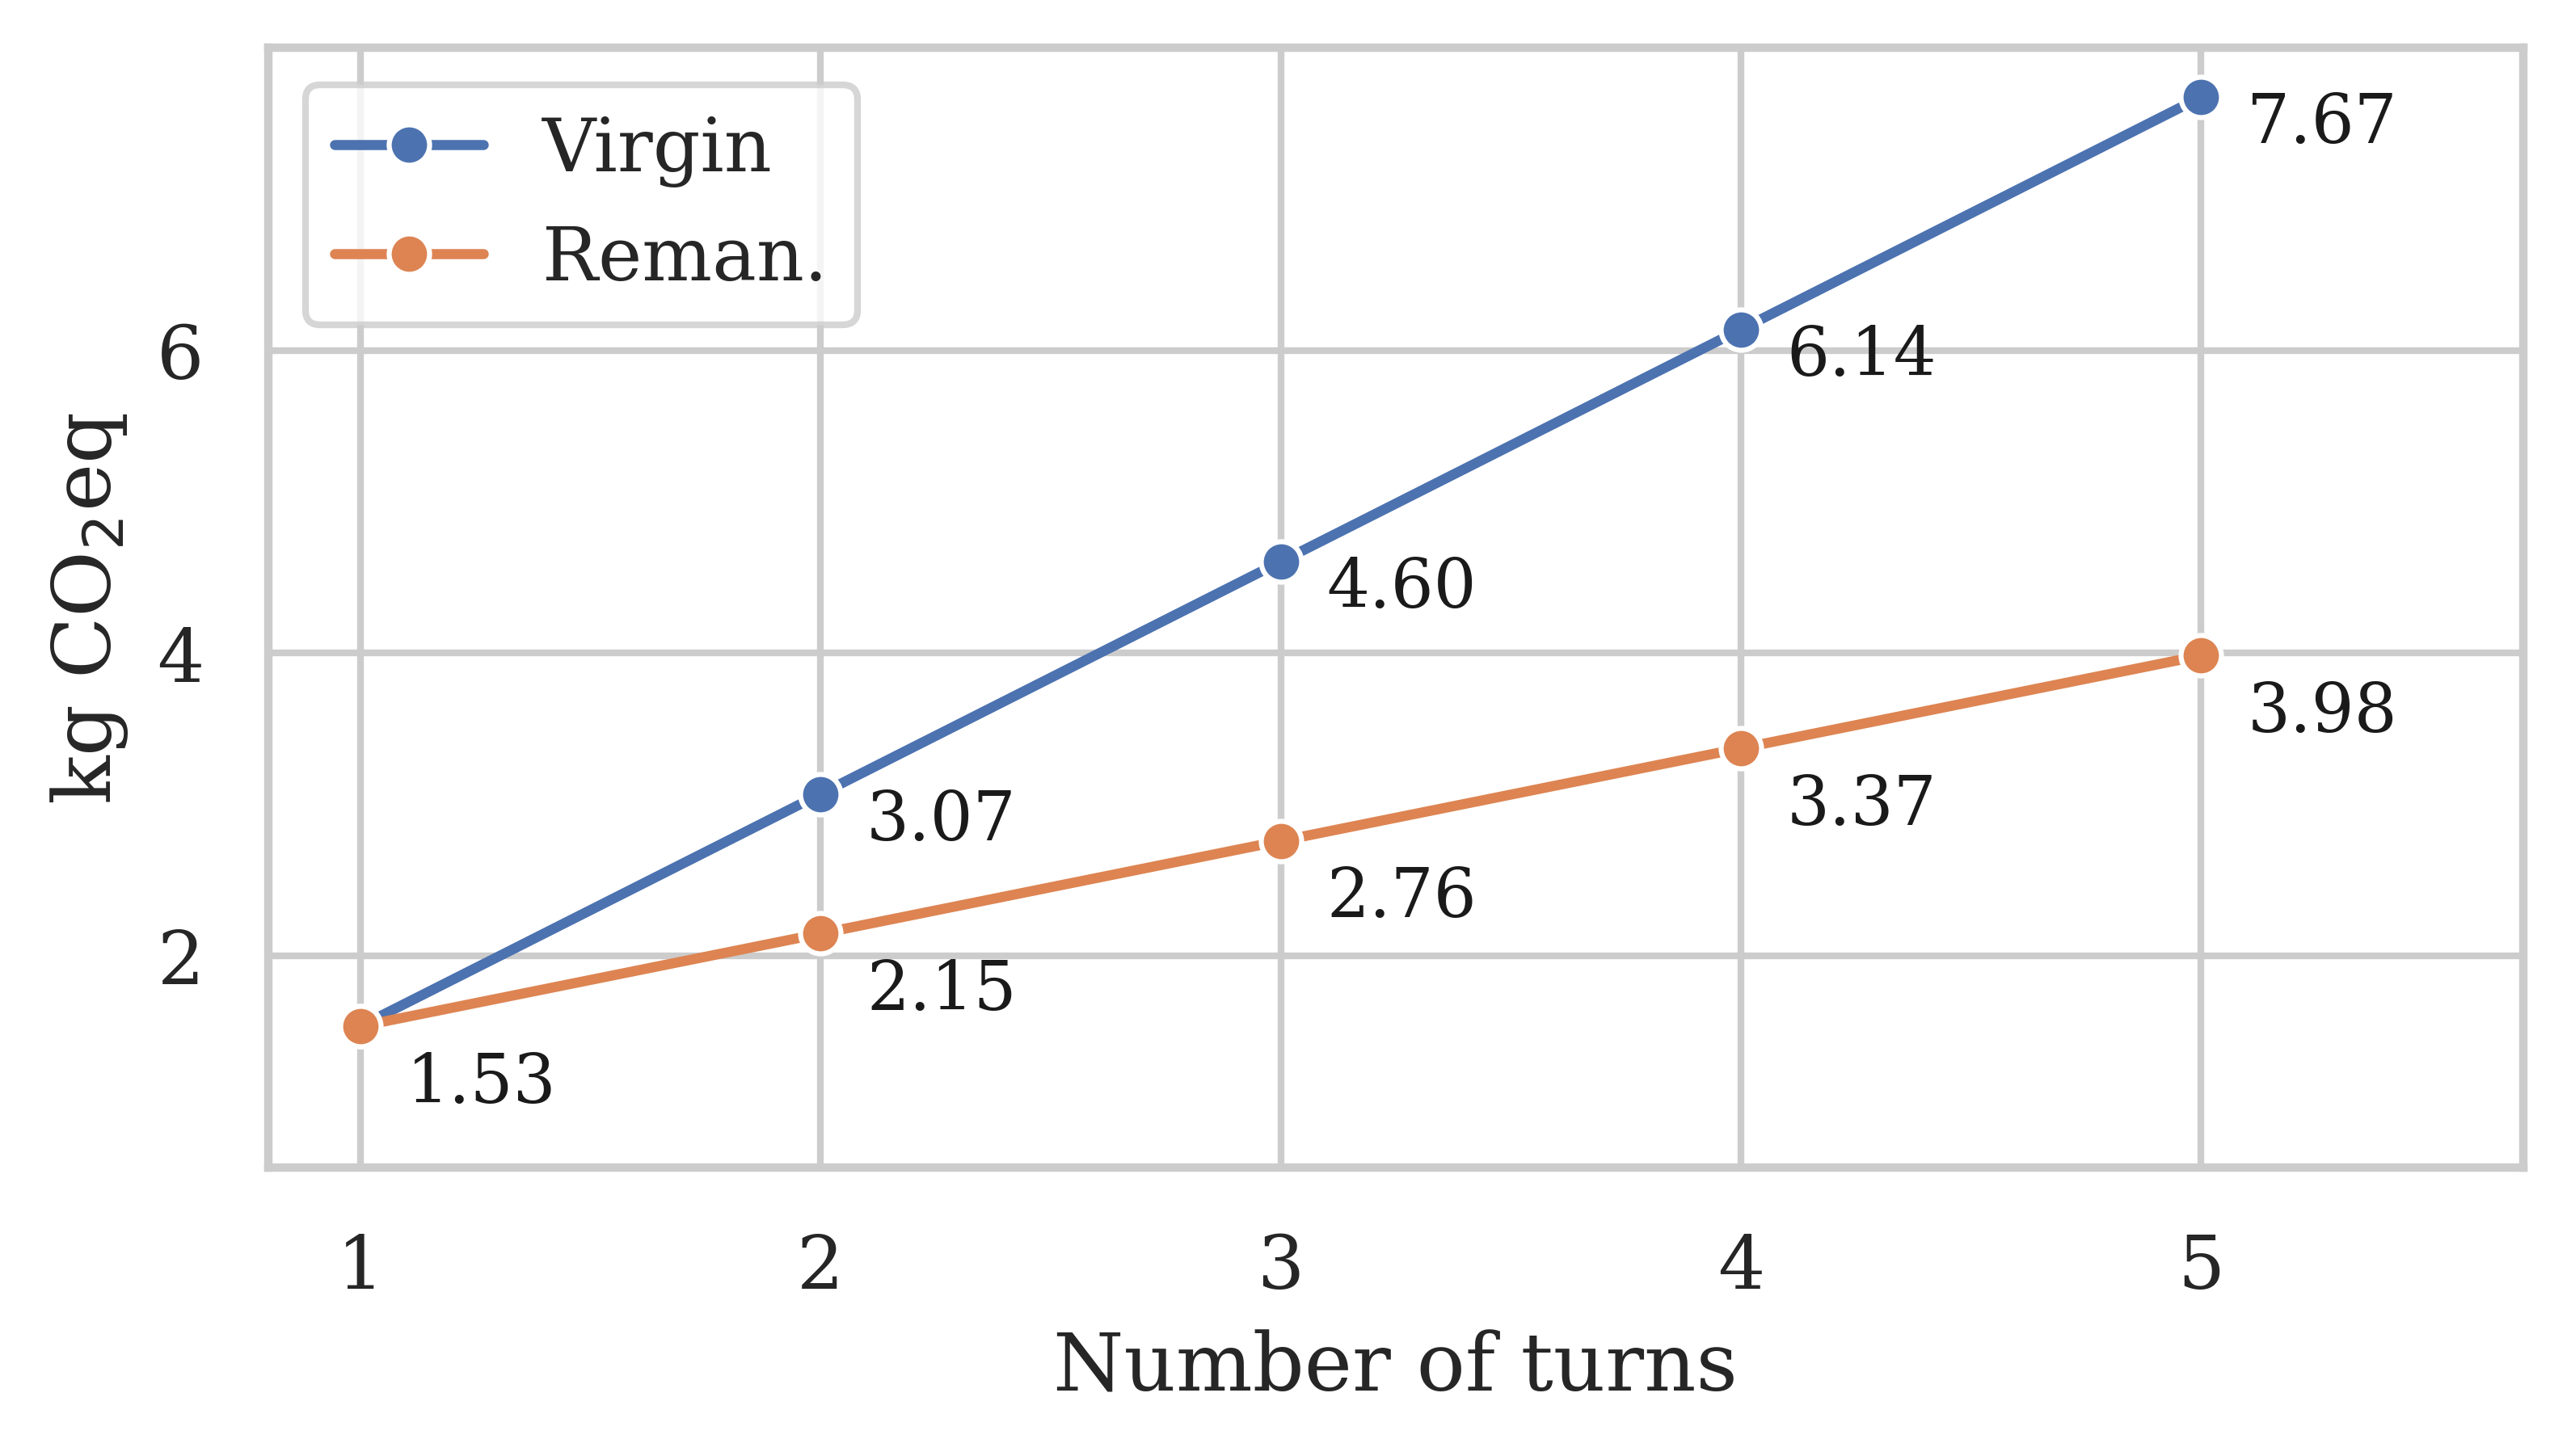
To ensure that the functionality of remanufactured catheters is substantially equivalent to a virgin catheter, each catheter model must be cleared for a certain number of turns by regulators before they may be remanufactured. According to medical device remanufacturer Innovative Health, EP catheters are relatively fragile compared to other remanufactured devices and typically cannot withstand more than 1–5 turns. Consequently, we evaluated the burdened emissions of remanufactured catheters for that range and contrasted the results against the total emissions of using a new virgin catheter for each turn in Figure 7.
Both scenarios started at kg CO2eq since a remanufactured catheter’s first life is as a virgin catheter. As the number of turns increased, so did the improved savings of remanufactured over virgin catheters. In the virgin scenario, each ‘turn’ required the production, use, and disposal of a brand-new catheter, which meant a linear growth of +1.53 kg CO2eq. In contrast, remanufacturing the same catheter repeatedly had a significantly shallower growth of +0.61 kg CO2eq per turn. This represents a 60% reduction per turn since a remanufactured catheter only emits 40% of emissions compared to a virgin catheter.
Our results highlight that remanufacturing emission savings increase significantly with the number of viable turns. After two turns, is decreased by 30% compared to two virgin catheters (0.9 kg CO2eq), 40% after three turns (1.8 kg CO2eq), and 48% after five turns (3.7 kg CO2eq). To put it in a different perspective, a remanufactured catheter used five times has lower climate emissions than three virgin catheters (4 kg CO2eq vs. 4.6 kg CO2eq).
4.2.4 Multivariate Scenarios
Finally, we combine the individually explored parameters into three representative multivariate scenarios, as shown in Table 7. By analysing these scenarios in parallel, we may contextualise the univariate sensitivity analysis results (Sections 4.2.1–4.2.3) and evaluate the possible overall gains that may be achieved with an improved remanufacturing process.
| Scenario | Comments | |||
|---|---|---|---|---|
| Good | UK | 0% | 5 | Ideal scenario. |
| Average | DE | 15% | 4 | Approximately current. |
| Bad | USA | 50% | 3 | Approximately following Schulte et al. (2021). |
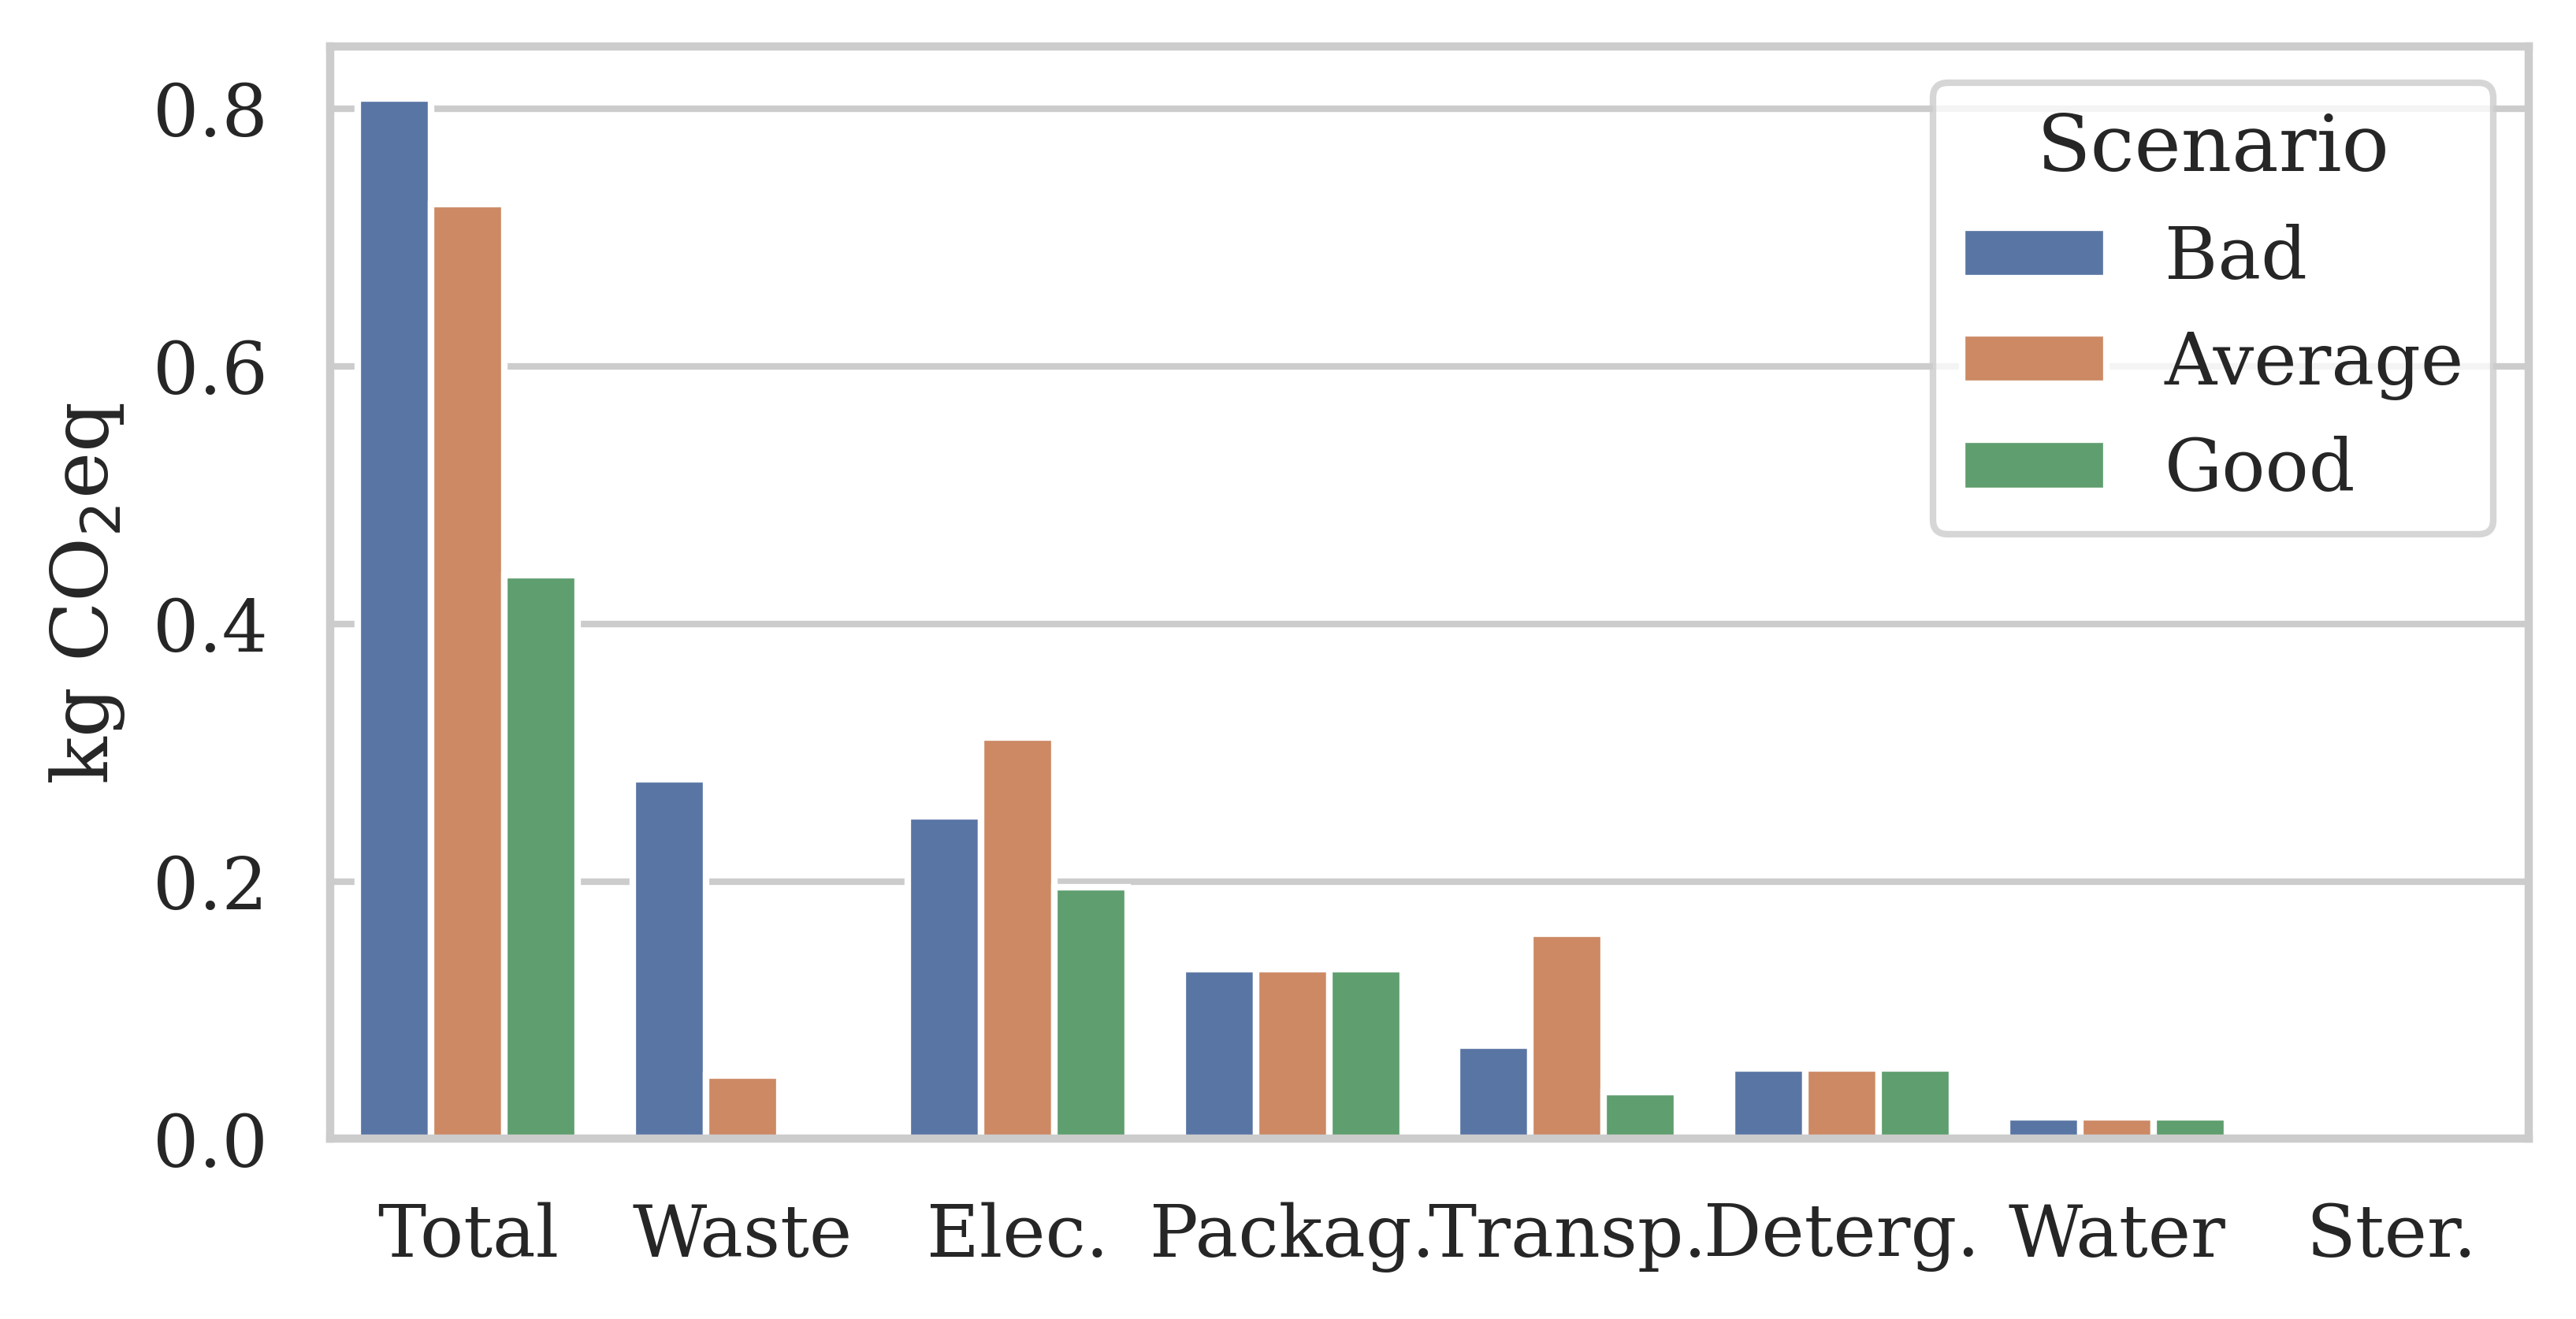
A high-level comparison in Figure 8a revealed that the burden-free climate emissions of a remanufactured catheter followed the expected ranking (0.81, 0.73, 0.44 kg CO2eq). The Average scenario improved on the Bad remanufacturing scenario by 10% compared to the 46% improvement by the good scenario. The largest variations in results were observed in the waste treatment (0–0.3 kg CO2eq) and transport (0.04–0.16 kg CO2eq) categories, which were the most directly affected by the quality rejection rate and remanufacturing location parameters. We also observed a variation in the electricity category, influenced by the remanufacturing location.
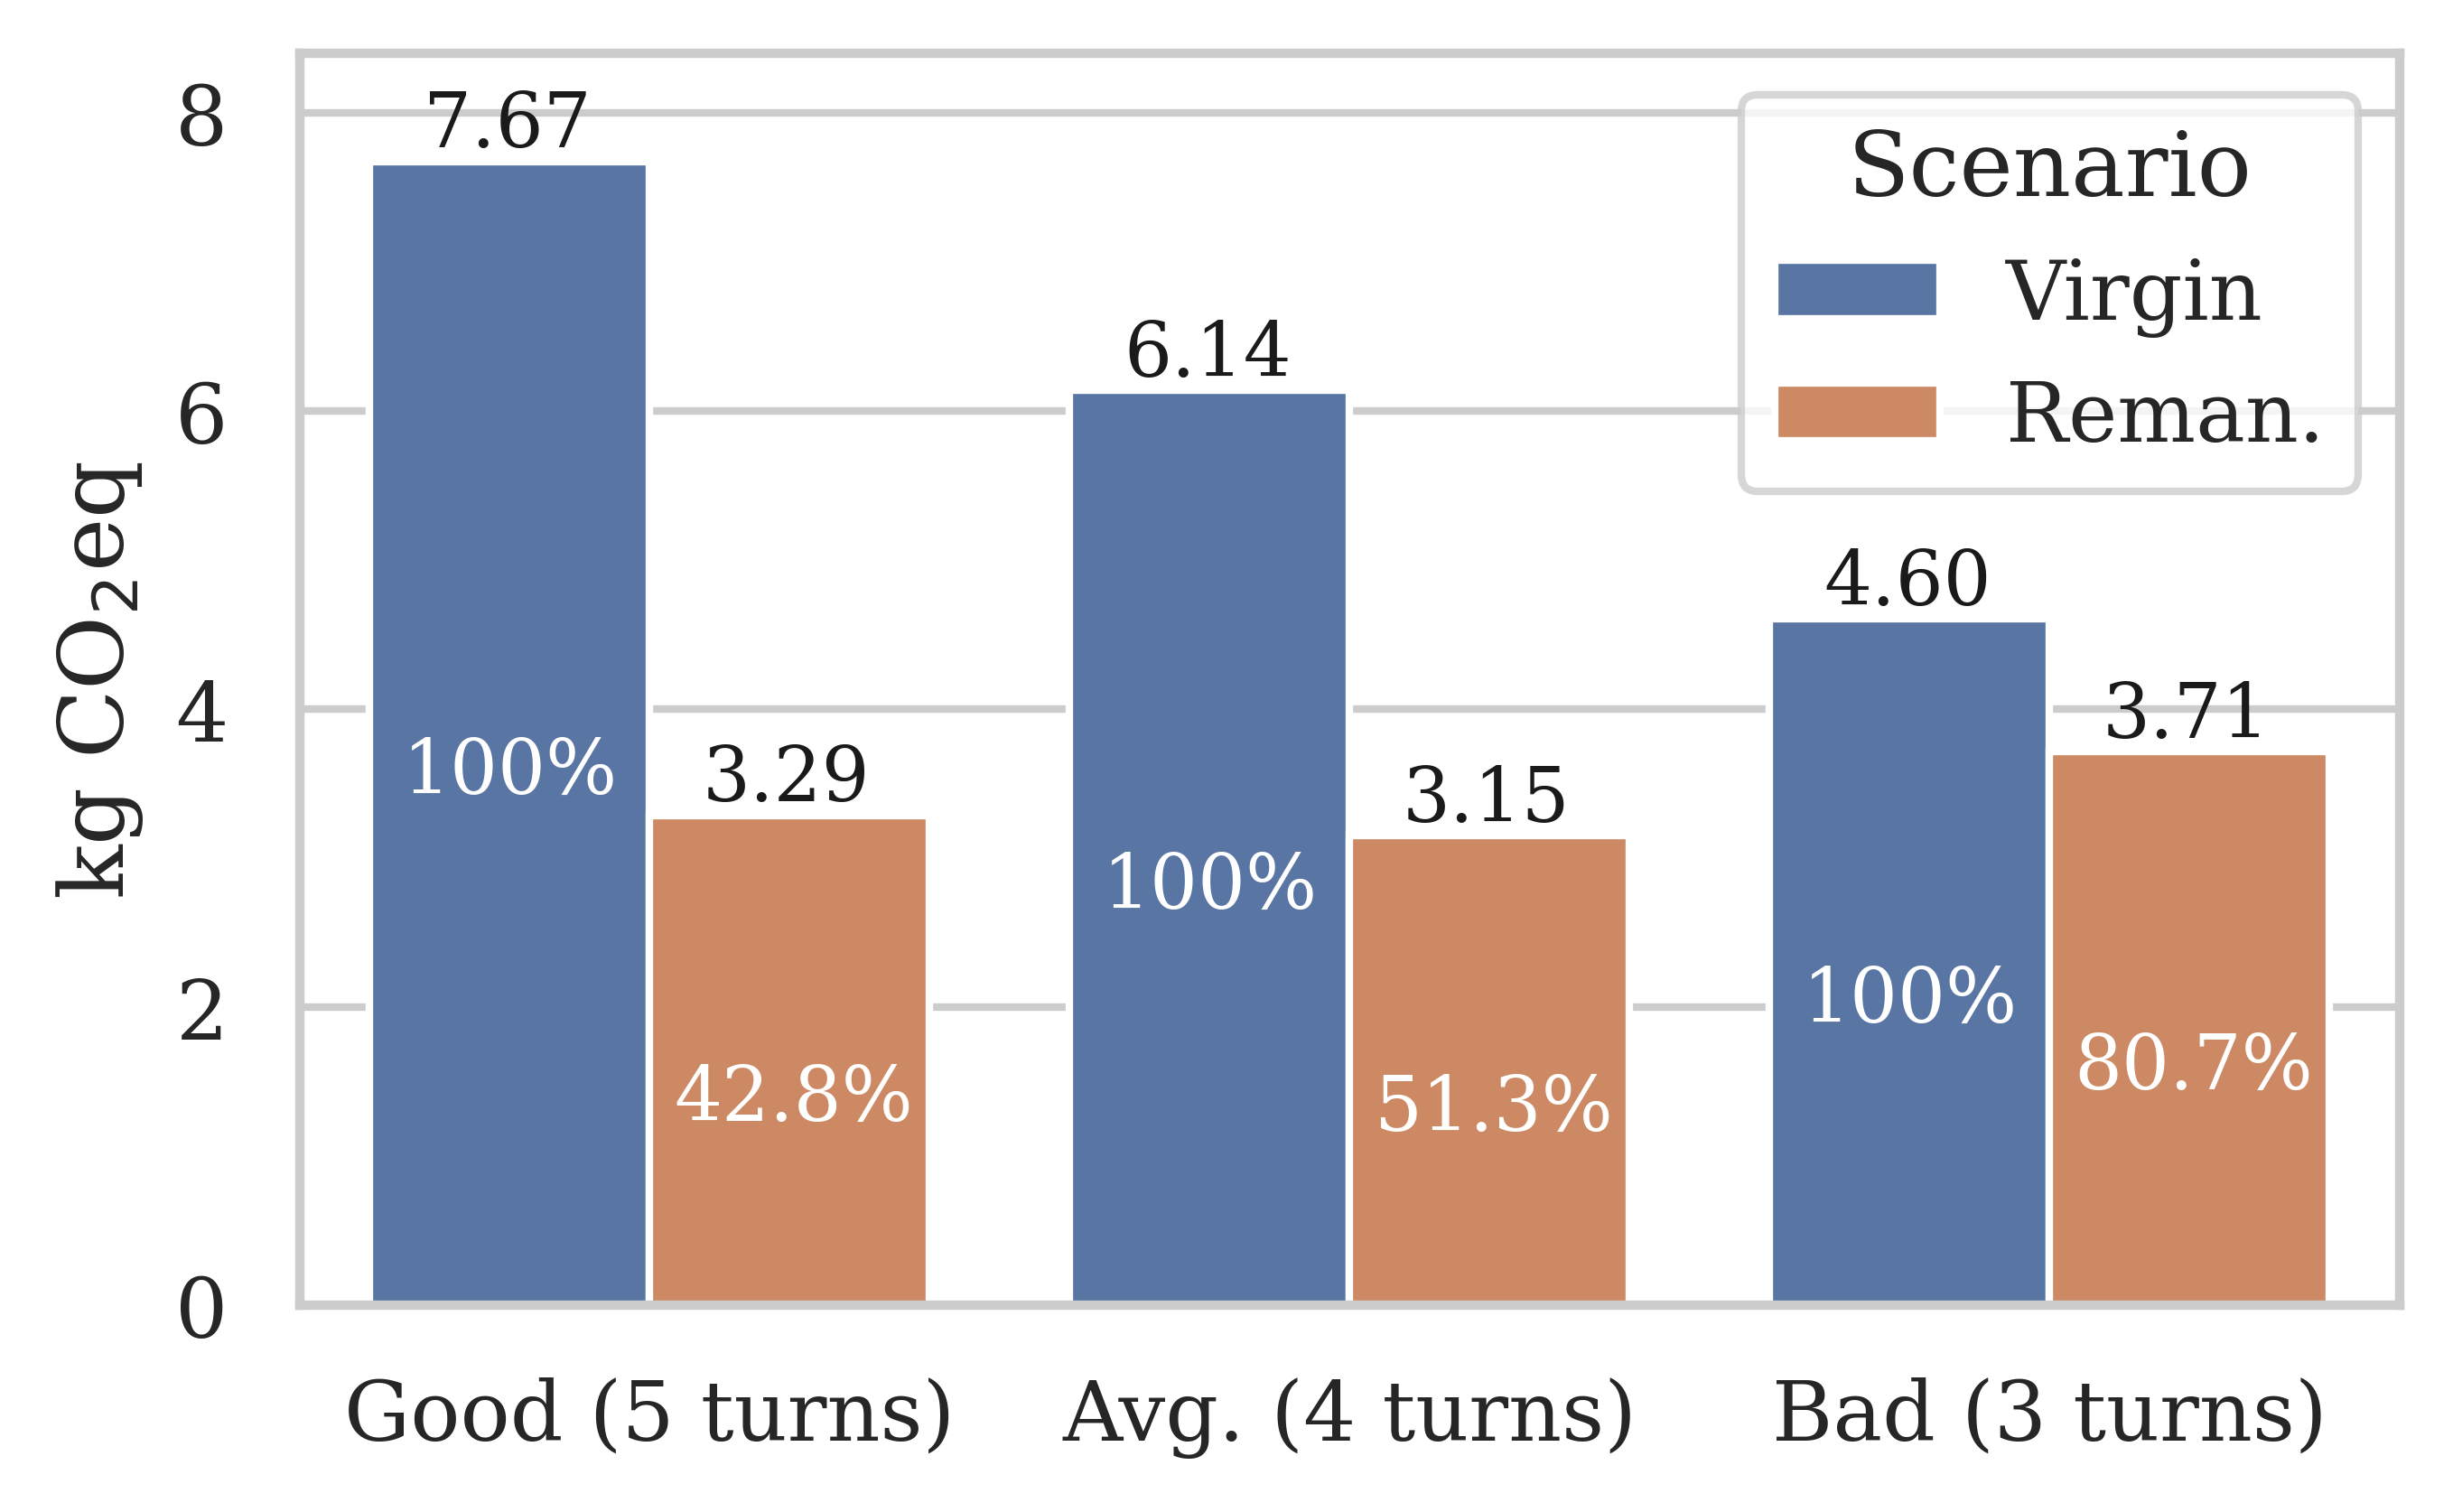
To incorporate the number of turns, we calculated the burdened per life emissions for remanufactured catheters and compared them to an equal number of virgin catheters () in Figure 8b. As the remanufacturing process became more efficient overall (Bad to Average to Good scenarios), the per life emission reductions increased significantly from 19% to 57% (0.9 to 4.3 kg CO2eq). Our results showcase that even sub-optimal remanufacturing processes with relatively small per-turn emission reductions (e.g., the Bad scenario) may significantly reduce the emissions across a remanufactured catheter’s entire life cycle.
4.3 Long-Term Emissions Use Case: A Realistic Buy-Back Scheme
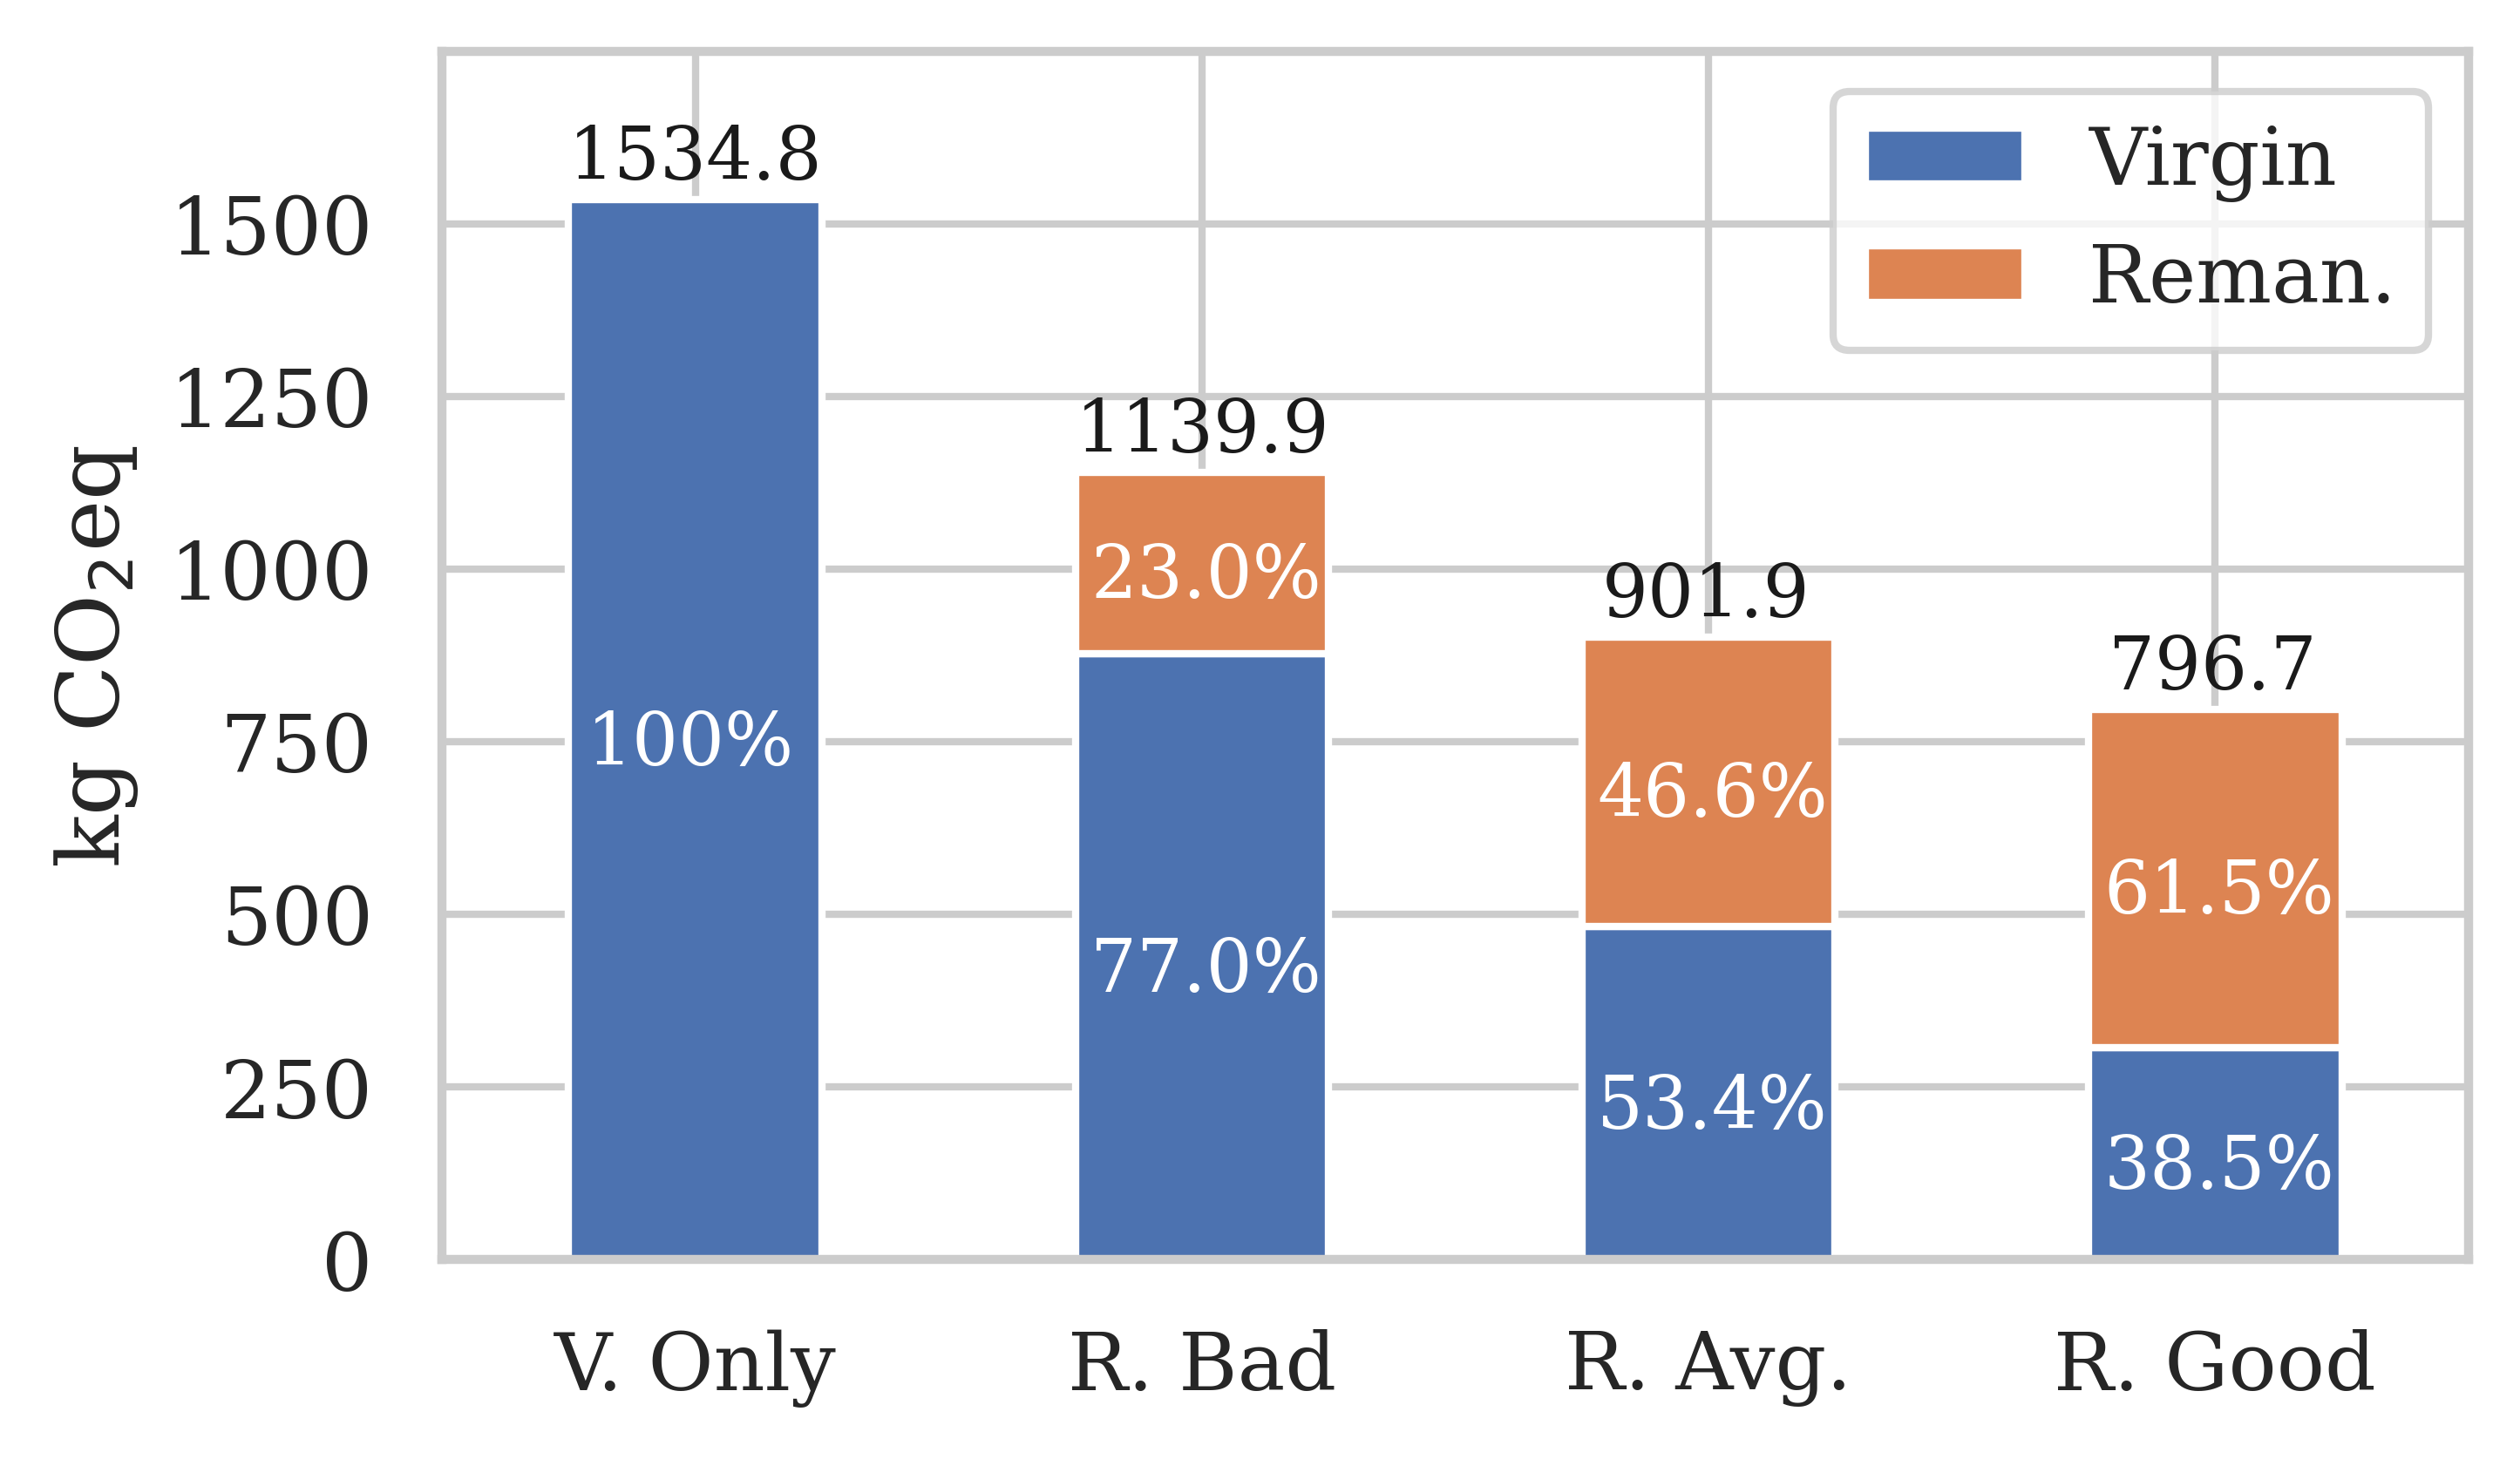
Finally, we simulate an industry buy-back scheme where medical remanufacturing is provided by a third-party service. Given the number of turns and the remanufacturing rejection rate , we may calculate the necessary initial injection of virgin catheters . Results for catheter uses are shown in Table 8 for the Bad, Average, and Good scenarios, calculated with Equation (5) (defined in Section 2.6).
| Scenario | Bad | Average | Good |
|---|---|---|---|
| Nr. of turns | 3 | 4 | 5 |
| Rejection rate | 0.5 | 0.15 | 0.0 |
| Initial injection | 572 | 314 | 200 |
| Total uses | 1000 | 1000 | 1000 |
Figure 9a visualises the total emissions for 1000 catheter uses across scenarios. It immediately stands out that all remanufacturing burdened-emissions were significantly lower than the emissions of 1000 virgin catheters ( = 1535 kg CO2eq). As the proportion of uses covered by remanufactured catheters grew, the total emissions reduced from 1140 kg (Bad) to 902 kg (Average) to 797 kg CO2eq (Good).
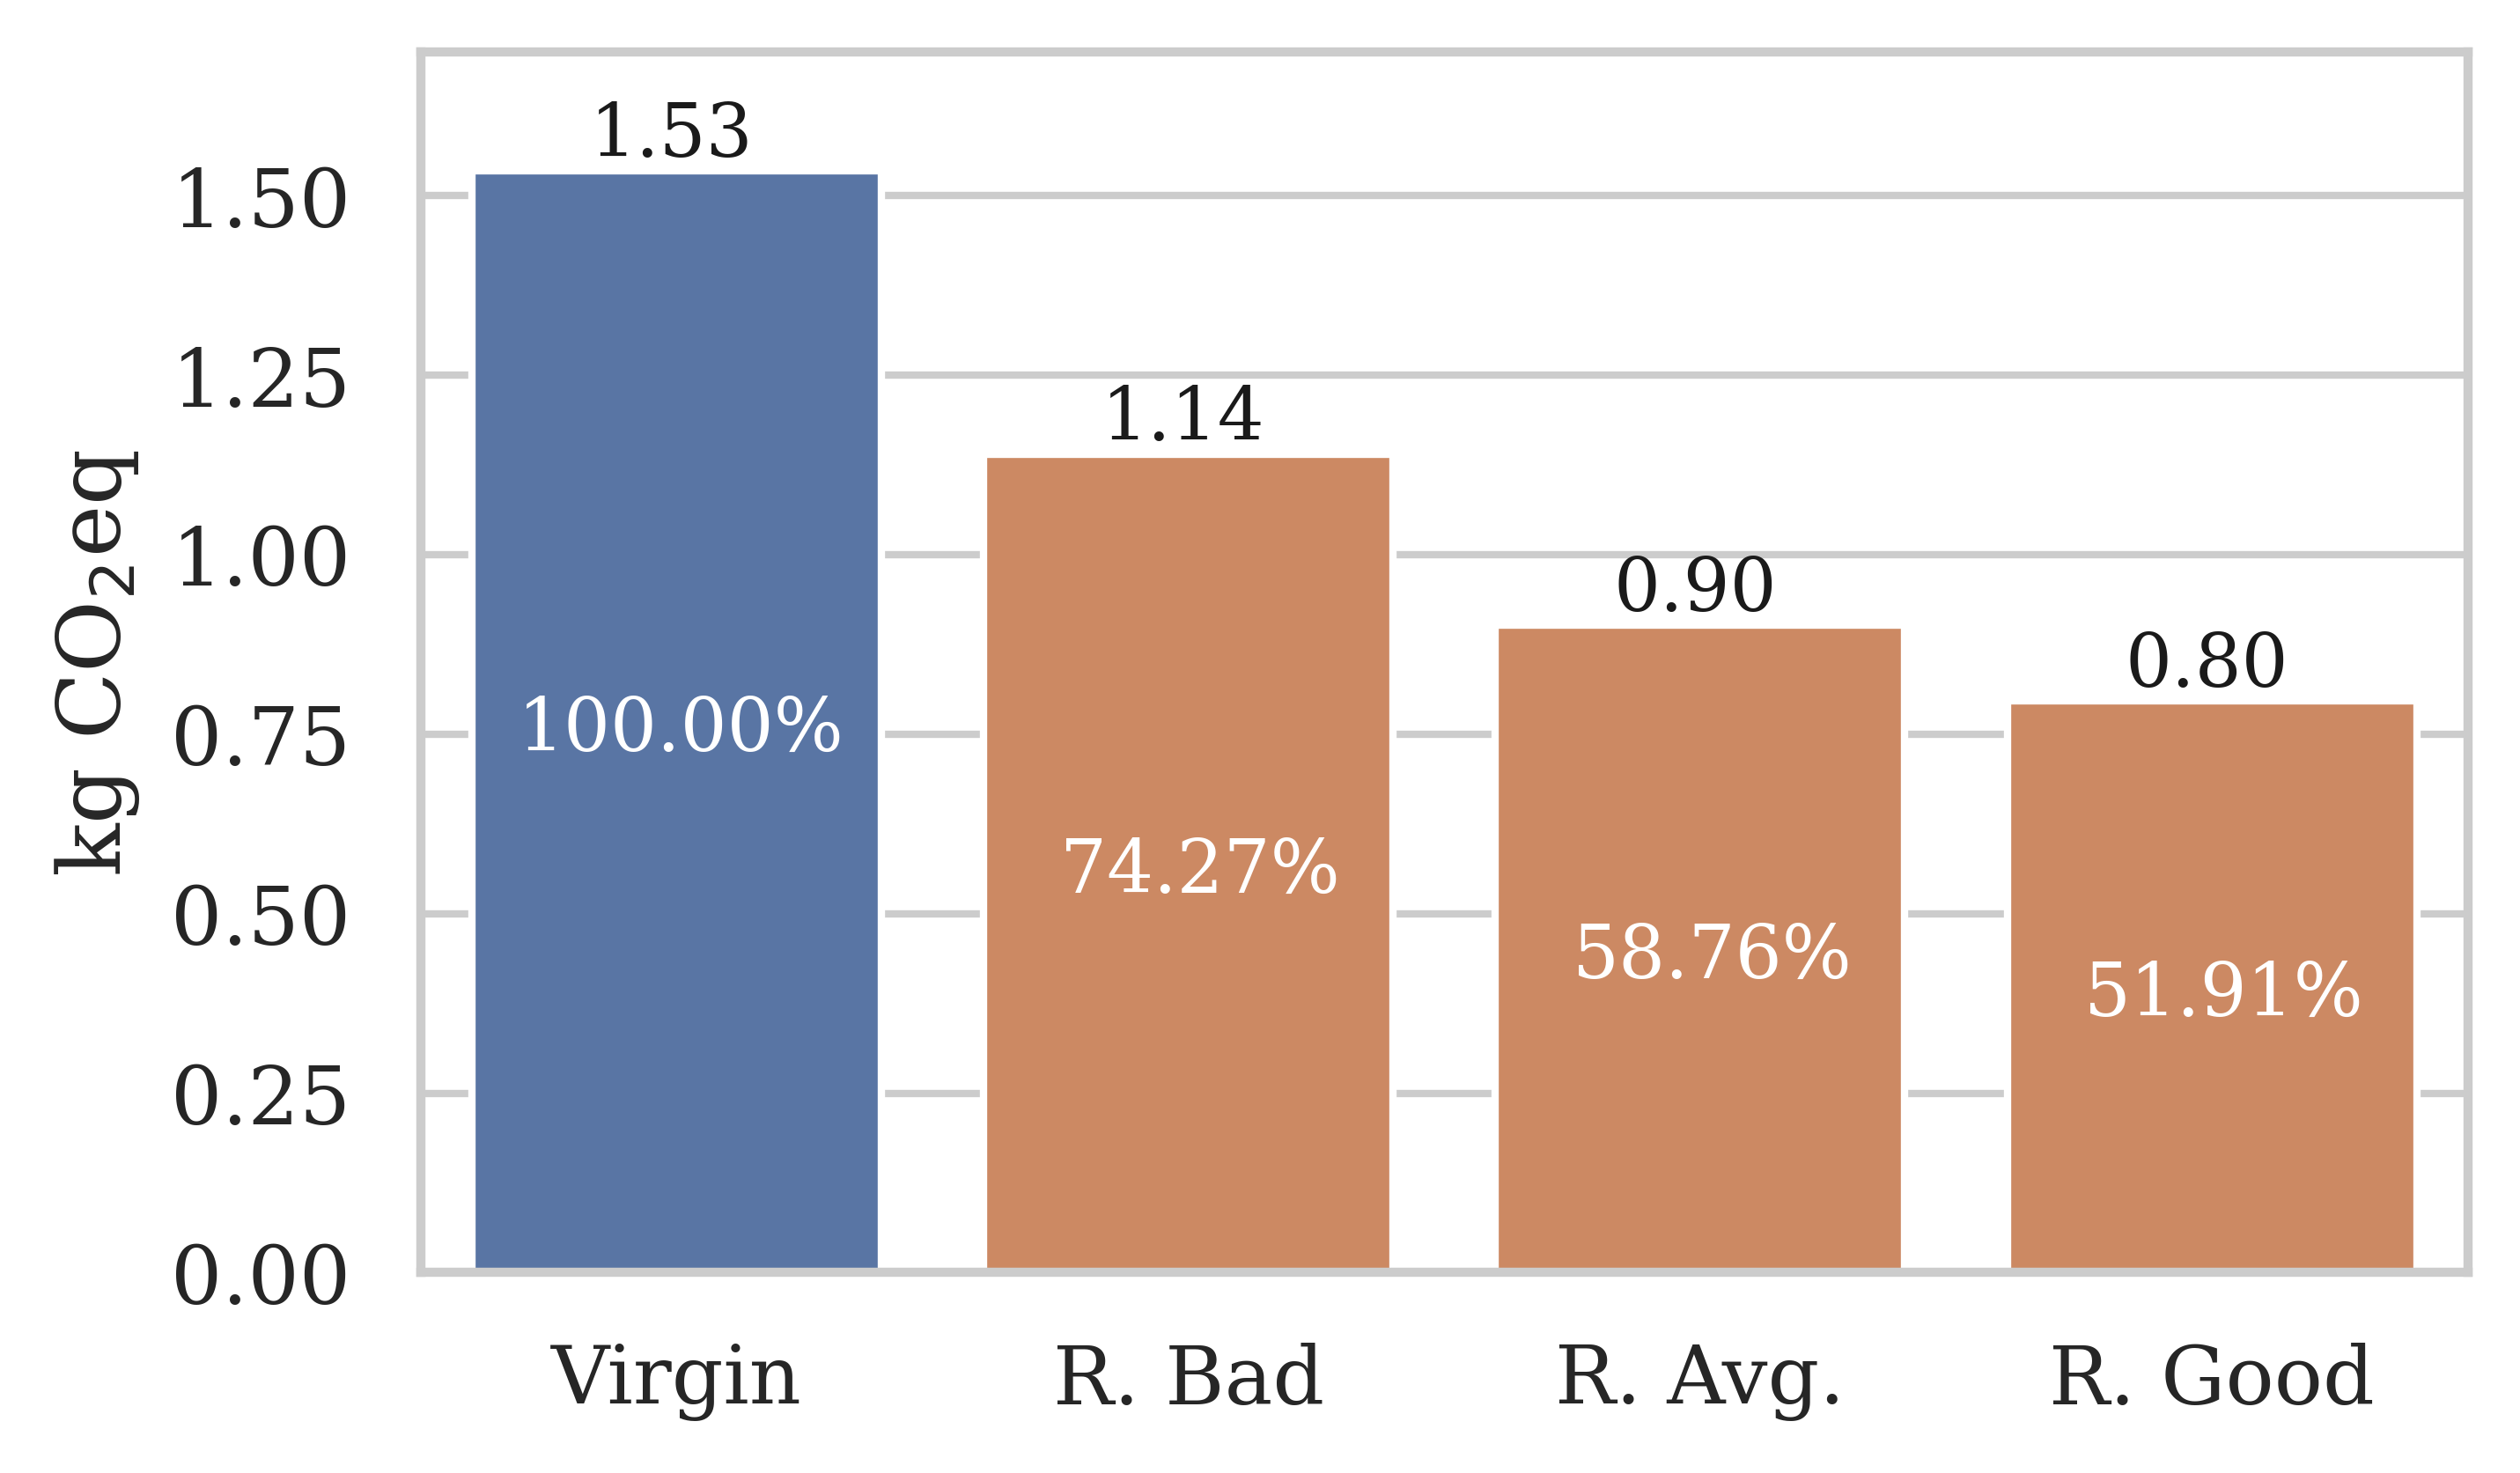
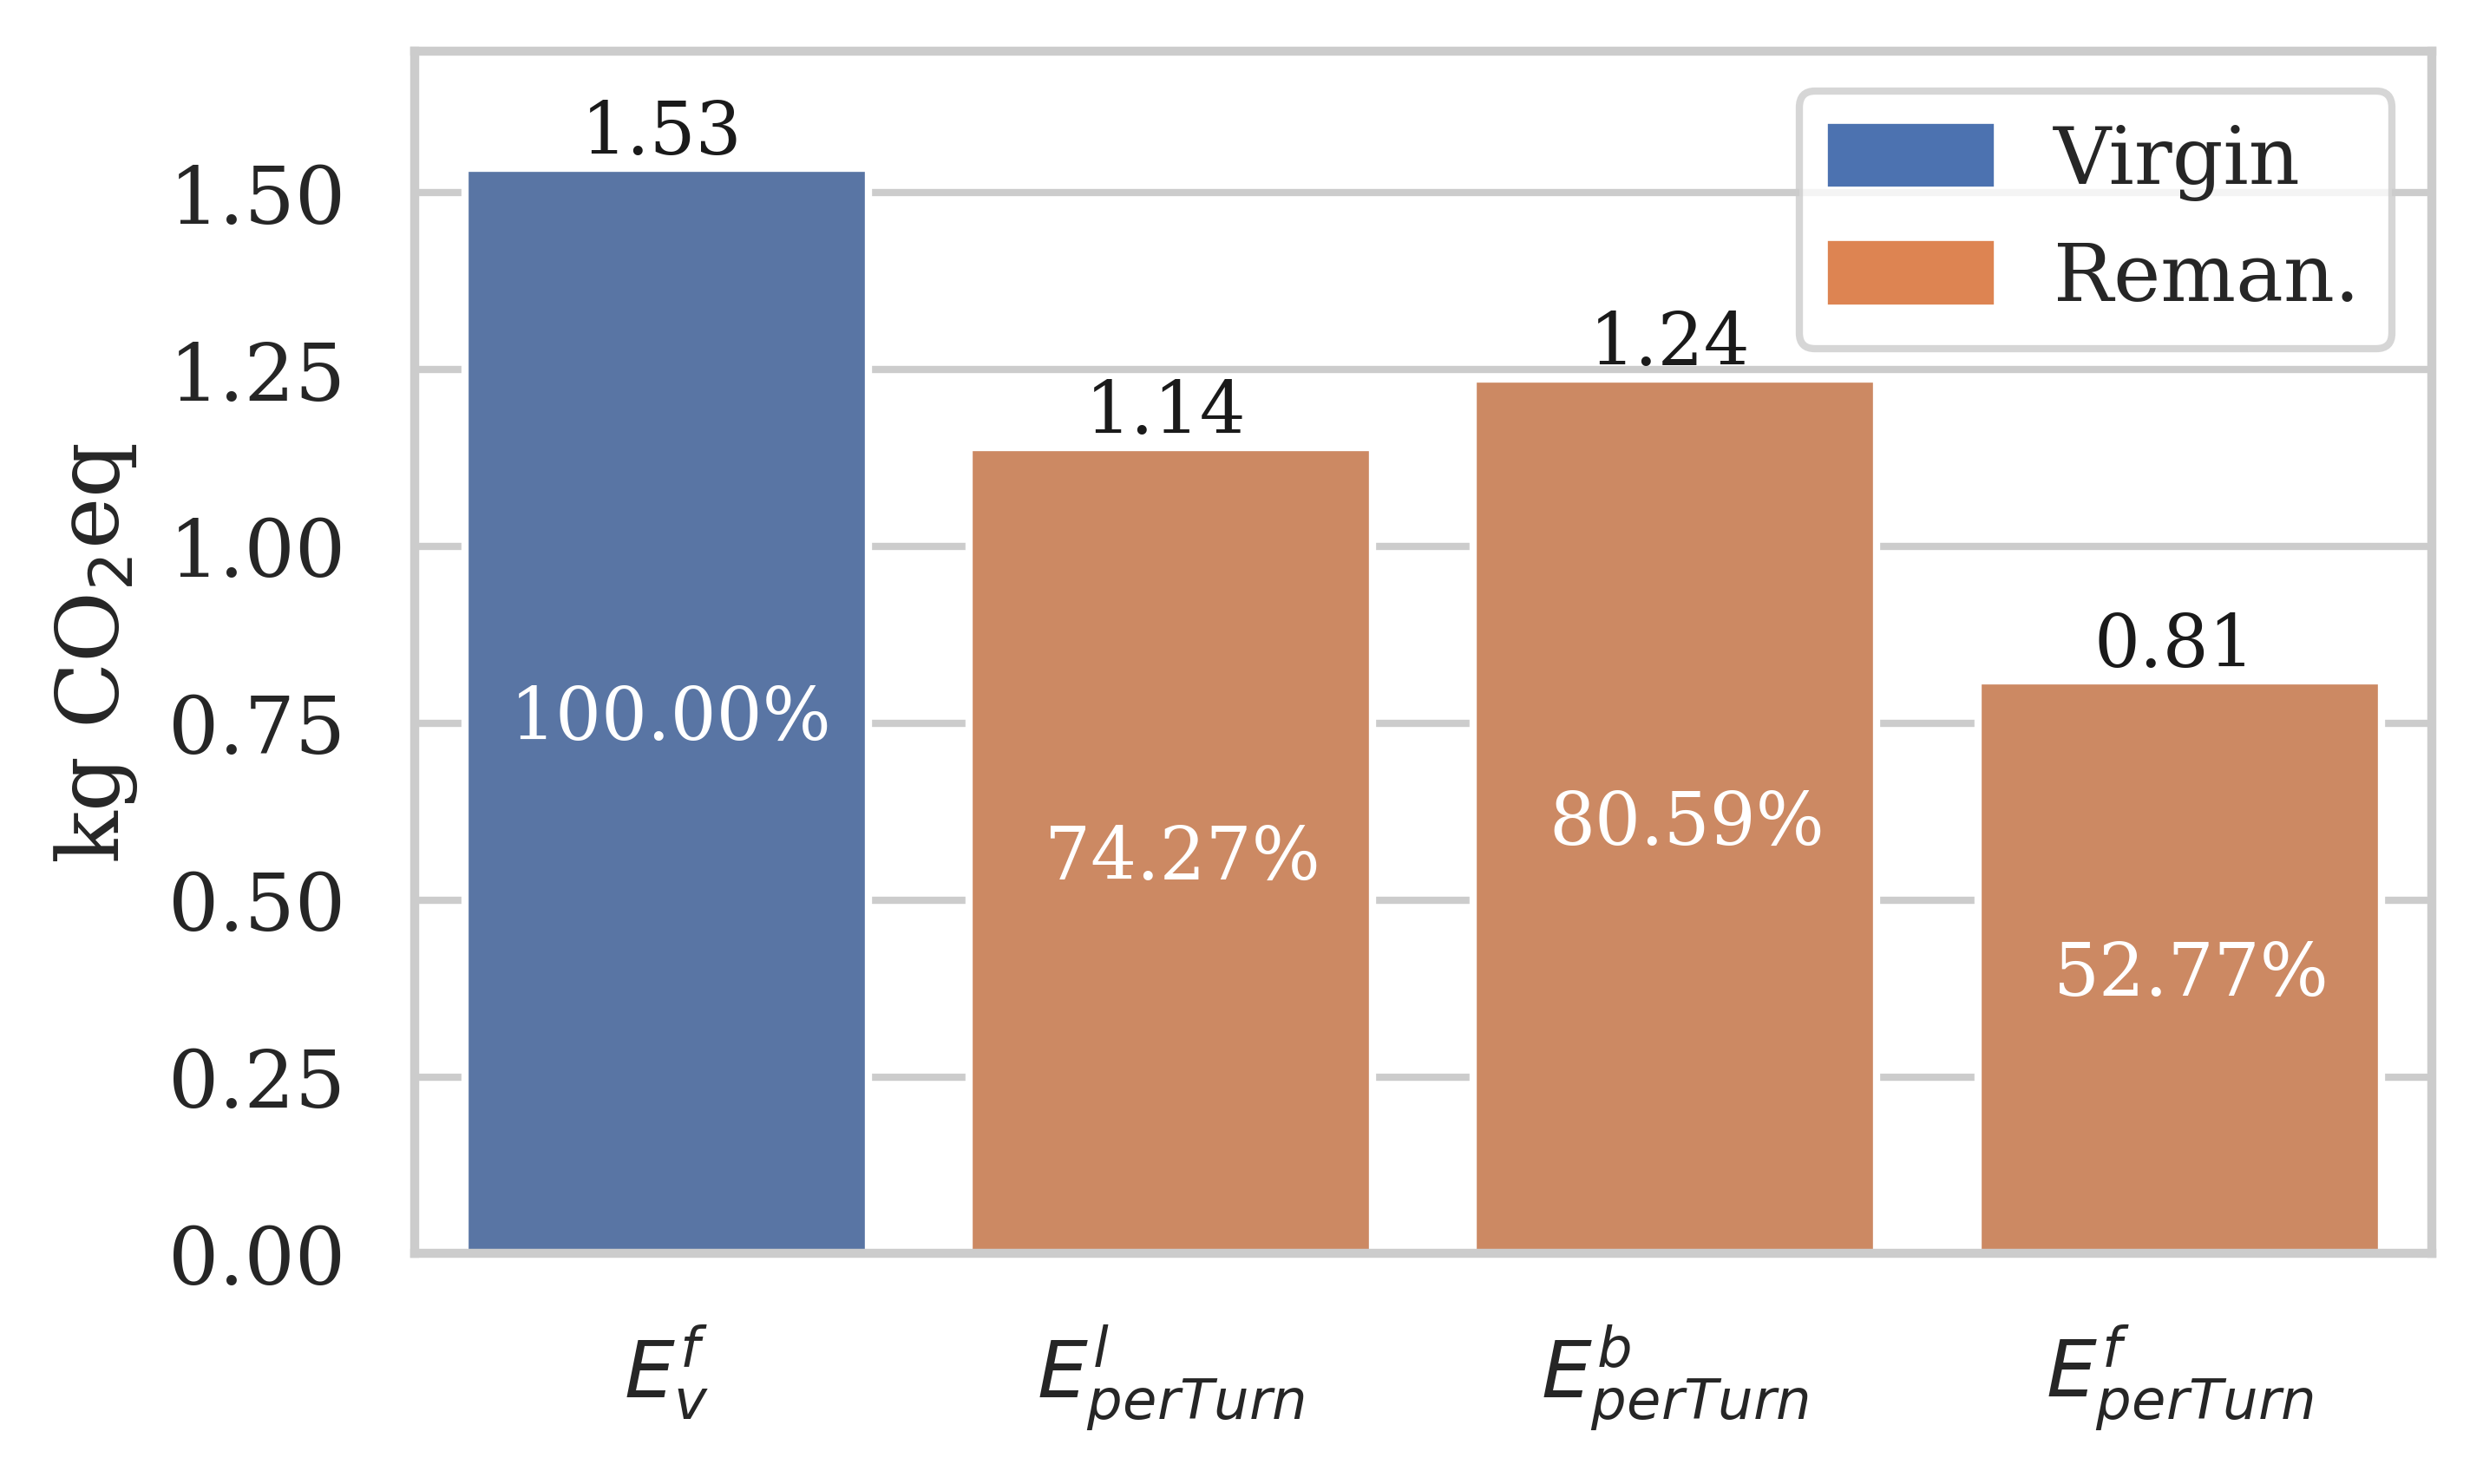
Relative to one remanufactured catheter (Figure 9b), the burdened per turn emissions were reduced to 0.8–1.14 kg CO2eq, compared to a 1.53 kg CO2eq virgin catheter. Overall, our results show that remanufacturing may reduce long-term, cumulative emissions by a significant 25–48%, depending on the process efficiency and the used catheter quality.
5 Discussion
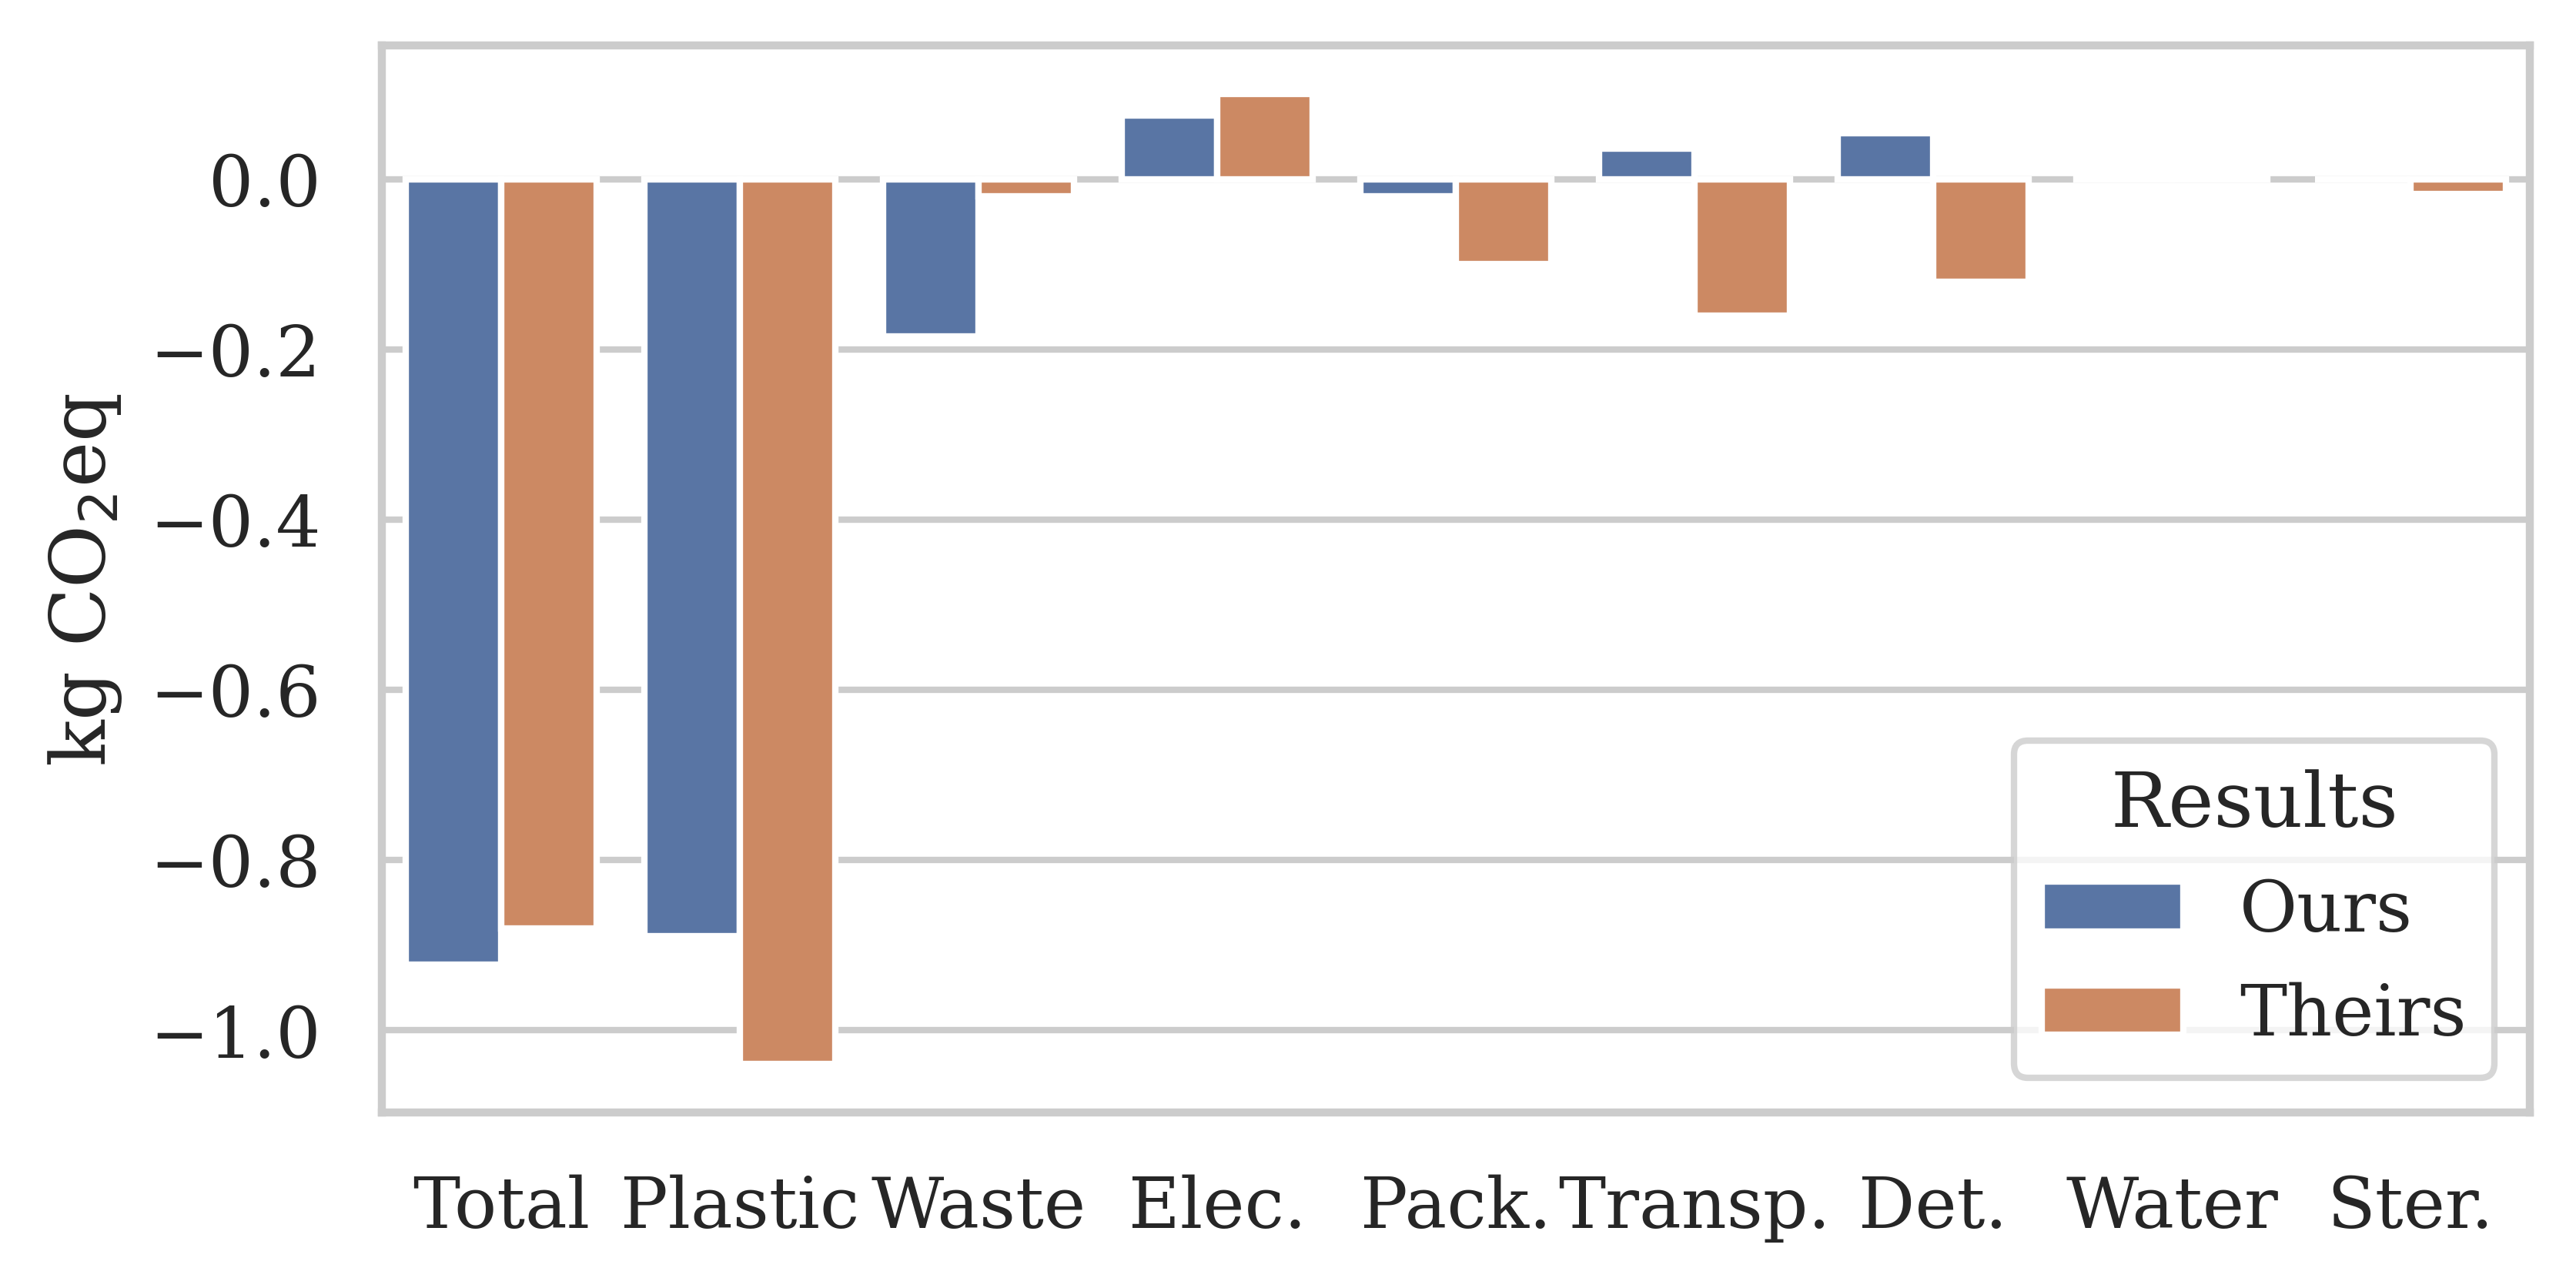
Our extensive emission result analysis found that remanufacturing catheters reduces burden-free climate emissions by 60%. Figure 10a compares our burden-free results and kg CO2eq (Section 4.1) against the Fraunhofer case study Schulte et al. (2021). The case study reports and kg CO2eq, representing a 50% emission reduction through remanufacturing. Even though the total emissions were slightly higher than what our models produced, we consider the results validated as the total and most category emissions follow the same trends. Furthermore, the discrepancies can be explained with the primary data updates we made, such as the lower-impact virgin plastic processing (replacement materials), lower remanufacturing waste emissions (reduced rejection rate) and the increased remanufacturing transport emissions (doubled transport rather than one round trip). Readers are referred to Section 3 for details and justifications.
Emission metrics. However, burden-free results do not necessarily accurately reflect the realistic emissions. Figure 10b visualises how the total emissions may change depending on the selected metric. For a fair comparison, all remanufactured emissions are calculated for the same scenario (, and USA). Our proposed metric comes the closest to accurately reflecting the real-world emissions, as it takes the previous lives (burdened) and long-term use of catheters into account. For the chosen Bad scenario, remanufacturing reduces climate emissions by 47% burden-free, 19% burdened, and 26% long-term, respectively.
Sensitivity analysis. Of course, these results may improve dramatically when the remanufacturing process is optimised. One of the main insights of our extensive sensitivity analysis (Section 4.2) is the significant impact even relatively minor changes may have on the absolute and cumulative remanufacturing emissions. Higher remanufacturing efficiency (e.g., quality rejection rate, number of turns, location) may significantly reduce climate impact. In our best-case scenario, remanufacturing reduced climate emissions by 71% burden-free, 57% burdened, and 52% long-term, respectively.
Result uncertainty. Because Life Cycle Analysis (LCA) results are calculated from a model of the real-world product, LCA climate emissions should be considered as estimates. The uncertainty of the results may be categorised into three groups: model, scenario, and parameter uncertainty Bamber et al. (2020). Throughout our study, we have attempted to address these concerns and improve the reliability of our results. Model uncertainty comes from the structure of the emission-calculating models themselves. We have addressed this by choosing highly-regarded software and background datasets openLCA and Ecoinvent v3.0. On the other hand, scenario uncertainty describes uncertainty introduced through LCA methodological choices such as the functional unit and system boundary. To minimise the introduced uncertainty, we have followed industry standards (e.g., ISO iso (2006) and NHS guidelines Penny et al. (2012); Standard (2013)). Finally, to address parameter uncertainty (i.e., data uncertainty), we have conducted a qualitative analysis of the data quality and included a comprehensive sensitivity analysis of high-impact life cycle parameters.
Versatility. Note that the systematic evaluation of virgin and remanufactured electrophysiology catheter emissions and the proposed long-term emission metric are versatile and not limited to electrophysiology catheters. In future, a similar approach could be taken to evaluate the life cycle emissions of other high-waste medical devices, as well as for circular economy approaches other than remanufacturing (e.g., recycling).
6 Related Work
As substantial individual contributors to environmental impacts, healthcare organisations and regulatory bodies worldwide have been investing in circular economy solutions England and Improvement (2020); Agreement (2015); EU Commission (2020). Compared to the current reliance on a linear, take-make-dispose model, a circular economy is defined by its principles to redesign, reduce, recover, recycle, and reuse (5R’s) resources to significantly extend their life before disposal Chen et al. (2020). Remanufacturing is a promising technique which resets a used device to a “substantially equivalent” state as when it was first manufactured MHRA (2016, 2021). This approach is particularly impactful for single-use medical devices, which contribute significantly to the 590,000 tonnes of healthcare waste produced annually in England alone Zils et al. (2022) and have similar statistics globally. Regulated remanufacturing processes allow the devices to be legally reused, reducing both the consumption of rare raw resources and minimising the need for emission-heavy waste disposal treatments (e.g., incineration) Unger and Landis (2016).
Apart from the environmental and financial benefits of a more circular single-use device economy, remanufacturing also has the potential to make expensive, multi-use medical devices more available to developing countries Eze et al. (2019). By prolonging their life, devices discarded due to the fast-paced, technology-driven turnover in high-income countries may be repurposed. Multiple studies have argued that the required initial investment to ramp up remanufacturing capabilities would be offset quickly as the devices are safely reused Oturu et al. (2022); Eze et al. (2020).
To make the required sustainable procurement decisions throughout a product value chain, decision makers need access to realistic, quantified climate impacts Dong et al. (2018). Life Cycle Analysis (LCA) has been widely recognised as an effective tool to support sustainable decision-making by systematically evaluating a product system’s potential impacts over its entire life Liu et al. (2022). Climate impact (also GHG emissions or carbon footprint) measured in kg CO2eq tends to be the most popular emission metric Smol et al. (2017); Ditac et al. (2022), presumably due to its widespread use across public, industry, and legislative communication around climate change. However, LCAs may be used to give a broad overview of multiple environmental factors instead, which may avoid over-optimising a particular indicator Bojarski et al. (2009). The LCA modelling may have different purposes within the scope of sustainability: (i) To compare the impact efficiency of healthcare practices (e.g., healthcare waste management approaches Soares et al. (2013)), (ii) to inform product design (e.g., comparing single-use medical devices containing biopolymers vs. plastic equivalents Unger et al. (2017), and (iii) to inform procurement decisions (e.g., single-use vs. reusable bronchoscopes Sørensen and Grüttner (2018)). Furthermore, called a Comparative LCA, such analysis may provide a robust and transparent comparison of two or more products Martin et al. (2022).
However, a significant limitation of LCAs is that they rely on a core, approximated model of a real-world product system Larsson Ivanov et al. (2019). Therefore, the quality of the environmental impact measurements is subject to the quality of the representative model, which describes all material inputs and outputs that contribute to or stem from the product or service Wu (2019). This inherent challenge to the modelling process means that LCA models are very time-consuming and expensive to construct, often requiring long periods of extensive data collection throughout a product’s life cycle. The consequence is that few studies have been carried out on complex product systems. Popular healthcare candidates tend to be simple with relatively few components, for example, face masks van Straten et al. (2021), surgical scissors Rizan et al. (2022), and staplers Freund et al. (2022), to name a few. In contrast, electrical medical devices are rarely featured (e.g., bronchoscopes Sørensen and Grüttner (2018)). Especially in the healthcare domain, proprietary design and materials in key components may make the data collection and LCA modelling process more complicated than usual.
In cases where product life cycle data is unavailable, assumptions and simplifications have to be made. Because LCAs may be highly sensitive to such choices as well as other modelling decisions (e.g., system boundary, reference unit, allocation strategy) Djati et al. (2018); Liu et al. (2019); Bishop et al. (2021), recent years have seen an attempt to standardise LCA analysis through modelling standards (e.g., ISO regulations iso (2006, 2006)) and reporting guidelines (e.g., NHS GHG accounting Penny et al. (2012); Standard (2013)). Consequently, current studies tend to include a report of the assumptions made Anshassi and Townsend (2021); Anshassi et al. (2021); Kløverpris (2018) and a sensitivity analysis of key life cycle parameters Shimako et al. (2018); Pannier et al. (2018); Patouillard et al. (2019). The aim is to give the results and their interpretation a clear context and provide a measure of the uncertainty.
Given the uncertainty of LCA estimations and their importance in supporting significant shifts in sustainable medical device procurement, it is not unreasonable to expect studies to be frequently validated to ensure that the results are accurate. However, LCA result validation is rare because comparing absolute environmental impact results across studies is difficult even when common guidelines are followed Spreafico (2022). This is because the mentioned industry standards propose best practices in broad strokes but leave many details to the study designers, which may drastically influence the results. For example, there is currently no one-size-fits-all solution for incorporating circular life cycles in LCA models, nor a hard-and-fast rule for which life cycle parameters to consider when calculating long vs. short-term emissions. When validation is attempted, it often results in major impact discrepancies (e.g., 270–570% variation in a validation of 13 plastic recycling studies Creadore and Castaldi (2022)).
The challenges with LCA emission modelling illustrated above also apply to electrophysiology catheters, the medical device examined in this article. As a traditionally single-use medical device with significant rare-resource material components, they are a promising candidate for remanufacturing. To the best of our knowledge, only a handful of studies have assessed their environmental impacts, which we discuss in the following.
In a recent study, Leung et al. found that circular mapping catheters could be remanufactured to their original functionality and efficiently reused in healthcare centres without complications Leung et al. (2019). According to their calculations, over £30,000 were saved across only 100 procedures. They estimate that up to £1.7 m may be saved annually in the UK if half of all circular mapping catheter procedures (5000–10,000) were carried out with remanufactured catheters instead. The paper concludes that catheter remanufacturing is a highly cost-efficient process that may be implemented without compromising patient safety. Additionally, Ditac et al. modelled the carbon footprint of atrial fibrillation catheter ablation procedures from catheter production to surgery, covering all processes carried out in the operating room Ditac et al. (2022). The authors found that catheters contributed almost 40% of total Greenhouse Gas (GHG) emissions during the procedure, 26% of emissions came from the anaesthesia and other pharmaceutical drugs, and the remaining 34% were emitted by other disposable materials during surgery. Since more than a third of ablation GHG emissions are released during material mining and catheter production, the results suggest that catheter remanufacturing could potentially significantly reduce their environmental impact.
A survey of 278 physicians from 42 European healthcare centres revealed a high motivation to reduce the environmental impact of EP procedures (62% of responses) Boussuge-Roze et al. (2022). However, Boussuge-Roze et al. report that only 15% of catheters are remanufactured and identify multiple barriers that must be addressed before the process can become more widespread. These are mainly at an institutional, processing, and regulatory level and highlight the need for a collaborative approach between healthcare, industry, and legislation. Schulte et al. provide an incentive for catheter remanufacturing by quantifying the emission reductions with a comparative LCA analysis of virgin manufactured and remanufactured single-use electrophysiology catheters Schulte et al. (2021). They find that remanufacturing reduces GHG emissions by 51% per turn when classifying the used catheter at the start of the remanufacturing process as burden-free (i.e., not considering previous lives). They also include a circularity metric to take multiple remanufactured catheter lives into account, which can be critical to interpret LCA results accurately Andrae (2022).
Even with widely-accepted standards for LCA analysis in place, LCA methodology for healthcare faces open questions. Significant challenges include (i) how to address data unavailability (e.g., due to proprietary materials and processes), (ii) how to address the consequent uncertainty, and (iii) how to translate the absolute LCA emission results into actionable insights for industry and healthcare practitioners. To address these points in our comprehensive study of electrophysiology catheters, we validate a case study from the literature, conduct an extensive results analysis including a sensitivity analysis of key parameters, and propose a novel metric that calculates realistic emissions by taking long-term use statistics of the device into account.
7 Conclusions
In this article, we carried out a comprehensive analysis of the climate impact and carbon emissions of virgin manufactured and remanufactured electrophysiology catheters, validating and expanding on a previous case study by the prestigious Fraunhofer Institute with a holistic sensitivity analysis and long-term emission analysis. Our emission framework is based on Life Cycle Analysis (LCA) models.
According to our models, remanufacturing catheters achieved 60% burden-free per turn emission reductions (1.53 to 0.61 kg CO2eq). However, our results have shown that burden-free results do not necessarily reflect real-world emissions. Therefore, we have included a range of emission metrics, including a novel long-term emission metric. When taking a remanufactured catheter’s previous lives into account, the emission reduction drops slightly to 57% burdened per life reductions (0.87 kg CO2eq). Including long-term remanufacturing use statistics changes the results to up to 48% cumulative reductions (0.73 kg CO2eq).
Our comprehensive results analysis concluded in three primary insights:
-
(i)
Remanufacturing is a promising circular economy approach to reduce the climate impact of single-use electrophysiology catheters.
-
(ii)
Sensitivity analysis has shown that parameters across the product chain may have major impacts on environmental emissions (e.g., up to 66% reduction with an improved remanufacturing rejection rate). Therefore, our study encourages a collaborative approach to remanufacturing by all actors throughout the value chain.
-
(iii)
Furthermore, finally, the distinction between burden-free (no previous lives) and burdened emissions (taking previous lives into account) is necessary to fully understand how emissions may be attributed to catheter turns over its entire life. Additionally, long-term use statistics should be incorporated into the emission metrics for more accurate results.
In future, we would like to expand our LCA models by removing the need for simplified assumptions that we had to make due to data availability. Additionally, since our proposed emissions framework is device-agnostic, it would be beneficial to analyse the emissions of other high-waste medical devices to inform the developing circular economy and net zero goal in healthcare.
Conceptualization, Y.W. and K.A.N.; methodology, J.A.M., J.S., Y.W. and K.A.N.; software, J.A.M. and J.S.; validation, J.A.M., J.S., Y.W. and K.A.N.; formal analysis, J.A.M. and J.S.; investigation, J.A.M. and J.S.; resources, J.A.M., J.S., Y.W. and K.A.N.; data curation, J.A.M., J.S., Y.W. and K.A.N.; writing—original draft preparation, J.A.M. and J.S.; writing—review and editing, J.A.M., J.S., Y.W. and K.A.N.; visualization, J.A.M. and J.S.; supervision, Y.W. and K.A.N.; project administration, Y.W. and K.A.N.; funding acquisition, Y.W. and K.A.N. All authors have read and agreed to the published version of the manuscript.
This research was funded by University of Brighton’s 2021 Quality Research grant.
Not applicable.
Not applicable.
The data presented in this study are available in this article and in the licensed Ecoinvent 3.8 dataset at https://ecoinvent.org/, accessed on 11 July 2022.
Acknowledgements.
We gratefully thank Dan Vukelich and David Sheon from the Association of Medical Device Reprocessing (AMDR); Lars Thording from Innovative Health; and Agnes Henson, Nicole Fletcher and Rebecca Griffiths from NHS England for their insight and contribution. This research was funded by University of Brighton’s 2021 Quality Research grant. \conflictsofinterestThe authors declare no conflict of interest. The funders had no role in the design of the study; in the collection, analyses, or interpretation of data; in the writing of the manuscript; or in the decision to publish the results. \abbreviationsAbbreviations The following abbreviations are used in this manuscript:| AMDR | Association of Medical Device Reprocessors (USA). |
|---|---|
| CO2 | Carbon Dioxide. |
| DE | Germany. |
| EF | Environmental Footprint. |
| EP | Electrophyisiology. |
| EU | European Union. |
| FDA | Food and Drug Administration (USA). |
| GHG | Greenhouse Gases. |
| GWP | Global Warming Potential. |
| IH | Innovative Health (USA). |
| ISO | International Organization for Standardization. |
| JIT | Just In Time. |
| LCA | Life Cycle Analysis. |
| LCI | Life Cycle Inventory. |
| LCIA | Life Cycle Impact Analysis. |
| NHS | National Health Service (UK). |
| OEM | Original Equipment Manufacturer. |
| SUD | Single-Use Device. |
| UK | United Kingdom. |
| UN | United Nations. |
| USA | United States of America. |
References
- Karliner et al. (2019) Karliner, J.; Slotterback, S.; Boyd, R.; Ashby, B.; Steele, K. Health Care’s Climate Footprint: How the Health Sector Contributes to the Global Climate Crisis and Opportunities for Action; Technical Report; Health Care Without Harm: 2019. https://noharm-global.org/sites/default/files/documents-files/5961/HealthCaresClimateFootprint_092319.pdf (accessed 25 November 2022).
- Zils et al. (2022) Zils, M.; Hopkinson, P.; Charnley, F.; Pencheon, D.; Dawson, T.; Eatherley, D.; Burton, K.; Gopfert, A. Accelerating the Transition towards a Net Zero NHS; Technical Report; University of Exeter and Philips: Exeter, UK, 2022.
- UK Public General Acts (2022) UK Public General Acts. Legislation: Health and Care Act. Available online: https://www.legislation.gov.uk/ukpga/2022/31/contents/enacted (accessed on 25 November 2022).
- England and Improvement (2020) England, N.; Improvement, N. Delivering a ‘net zero’ National Health Service; NHS England and NHS Improvement: London, UK, 2020.
- Van Boerdonk et al. (2021) Van Boerdonk, P.; Krikke, H.; Lambrechts, W. New business models in circular economy: A multiple case study into touch points creating customer values in health care. J. Clean. Prod. 2021, 282, 125375.
- Cole et al. (2018) Cole, R.; Lindsay, C.F.; Barker, F. Reverse exchange of healthcare devices: The case of hearing aid equipment in the UK. Prod. Plan. Control 2018, 29, 1045–1057.
- Guzzo et al. (2020) Guzzo, D.; Carvalho, M.; Balkenende, R.; Mascarenhas, J. Circular business models in the medical device industry: Paths towards sustainable healthcare. Resour. Conserv. Recycl. 2020, 160, 104904.
- MHRA (2016) MHRA. Single-Use Medical Devices: UK Guidance on Re-Manufacturing; Technical Report; Medicines and Healthcare products Regulatory Agency: London, UK, 2016.
- MHRA (2021) MHRA. Single-Use Medical Devices: Implications and Consequences of Reuse; Technical Report; Medicines and Healthcare products Regulatory Agency: London, UK, 2021.
- Schulte et al. (2021) Schulte, A.; Maga, D.; Thonemann, N. Combining life cycle assessment and circularity assessment to analyze environmental impacts of the medical remanufacturing of electrophysiology catheters. Sustainability 2021, 13, 898.
- Liu et al. (2022) Liu, M.; Wen, J.; Feng, Y.; Zhang, L.; Wu, J.; Wang, J.; Yang, X. A benefit evaluation for recycling medical plastic waste in China based on Material Flow Analysis and Life Cycle Assessment. J. Clean. Prod. 2022, 368, 133033.
- iso (2006) ISO 14040: Life Cycle Assessment–Principles and Framework; Technical Report; International Organization for Standardization: Geneva, Switzerland, 2006.
- Penny et al. (2012) Penny, T.; Fisher, K.; Colins, M.; Allison, C. Greenhouse Gas Accounting Sector Guidance for Pharmaceutical Products and Medical Devices; Technical Report; NHS Sustainable Development Unit: 2012. https://ghgprotocol.org/sites/default/files/Summary-Document_Pharmaceutical-Product-and-Medical-Device-GHG-Accounting_November-2012_0.pdf (accessed 25 November 2022).
- Standard (2013) Standard, R. GHG protocol product life cycle accounting and reporting standard ICT sector guidance. Greenh. Gas Protocol 2013. https://ghgprotocol.org/sites/default/files/standards/Product-Life-Cycle-Accounting-Reporting-Standard_041613.pdf (accessed 25 November 2022).
- Vadoudi et al. (2022) Vadoudi, K.; Deckers, P.; Demuytere, C.; Askanian, H.; Verney, V. Comparing a material circularity indicator to Life Cycle Assessment: The case of a three-layer plastic packaging. Sustain. Prod. Consum. 2022, 33, 820–830.
- Jensen et al. (2019) Jensen, J.P.; Prendeville, S.M.; Bocken, N.M.; Peck, D. Creating sustainable value through remanufacturing: Three industry cases. J. Clean. Prod. 2019, 218, 304–314.
- Leung et al. (2019) Leung, L.W.; Evranos, B.; Grimster, A.; Li, A.; Norman, M.; Bajpai, A.; Zuberi, Z.; Sohal, M.; Gallagher, M.M. Remanufactured circular mapping catheters: Safety, effectiveness and cost. J. Interv. Card. Electrophysiol. 2019, 56, 205–211.
- Boussuge-Roze et al. (2022) Boussuge-Roze, J.; Boveda, S.; Mahida, S.; Anic, A.; Conte, G.; Chun, J.K.; Marijon, E.; Sacher, F.; Jais, P. Current practices and expectations to reduce environmental impact of electrophysiology catheters: Results from an EHRA/LIRYC European physician survey. Europace 2022, 24, 1300–1306.
- Ditac et al. (2022) Ditac, G.; Cottinet, P.J.; Quyen Le, M.; Grinberg, D.; Duchateau, J.; Gardey, K.; Dulac, A.; Delinière, A.; Haddad, C.; Boussuge-Roze, J.; et al. Carbon footprint of atrial fibrillation catheter ablation. EP Eur. 2022. https://doi.org/10.1093/europace/euac160.
- Ciroth et al. (2019) Ciroth, A.; Di Noi, C.; Lohse, T.; Srocka, M. OpenLCA 1.10. In Comprehensive User Manual, GreenDelta GmbH: Berlin, Germany, 2019.
- Kløverpris (2018) Kløverpris, N.H. Establishing LCA in the healthcare sector. In Designing Sustainable Technologies, Products and Policies; Springer: Cham, Switzerland, 2018; pp. 89–94.
- Botejara-Antúnez et al. (2022) Botejara-Antúnez, M.; González-Domínguez, J.; García-Sanz-Calcedo, J. Comparative analysis of flat roof systems using Life Cycle Assessment methodology: Application to healthcare buildings. Case Stud. Constr. Mater. 2022, 17, e01212.
- Baustert et al. (2022) Baustert, P.; Igos, E.; Schaubroeck, T.; Chion, L.; Mendoza Beltran, A.; Stehfest, E.; van Vuuren, D.; Biemans, H.; Benetto, E. Integration of future water scarcity and electricity supply into prospective LCA: Application to the assessment of water desalination for the steel industry. J. Ind. Ecol. 2022. https://doi.org/10.1111/jiec.13272.
- Sánchez-Barroso et al. (2021) Sánchez-Barroso, G.; Botejara-Antúnez, M.; García-Sanz-Calcedo, J.; Zamora-Polo, F. A Life Cycle Analysis of ionizing radiation shielding construction systems in healthcare buildings. J. Build. Eng. 2021, 41, 102387.
- Borglin et al. (2021) Borglin, L.; Pekarski, S.; Saget, S.; Duane, B. The Life Cycle Analysis of a dental examination: Quantifying the environmental burden of an examination in a hypothetical dental practice. Community Dent. Oral Epidemiol. 2021, 49, 581–593.
- Pizzol et al. (2017) Pizzol, M.; Laurent, A.; Sala, S.; Weidema, B.; Verones, F.; Koffler, C. Normalisation and weighting in Life Cycle Assessment: Quo vadis? Int. J. Life Cycle Assess. 2017, 22, 853–866.
- Salemdeeb et al. (2021) Salemdeeb, R.; Saint, R.; Clark, W.; Lenaghan, M.; Pratt, K.; Millar, F. A pragmatic and industry-oriented framework for data quality assessment of environmental footprint tools. Resour. Environ. Sustain. 2021, 3, 100019.
- iso (2006) ISO 14044: Life Cycle Assessment–Requirements and Guidelines; Technical Report; International Organization for Standardization: Geneva, Switserland, 2006.
- Gradin and Björklund (2021) Gradin, K.T.; Björklund, A. The common understanding of simplification approaches in published LCA studies: A review and mapping. Int. J. Life Cycle Assess. 2021, 26, 50–63.
- Steubing and de Koning (2021) Steubing, B.; de Koning, D. Making the use of scenarios in LCA easier: The superstructure approach. Int. J. Life Cycle Assess. 2021, 26, 2248–2262.
- Wernet et al. (2016) Wernet, G.; Bauer, C.; Steubing, B.; Reinhard, J.; Moreno-Ruiz, E.; Weidema, B. The Ecoinvent database version 3 (part I): Overview and methodology. Int. J. Life Cycle Assess. 2016, 21, 1218–1230.
- Edelen and Ingwersen (2018) Edelen, A.; Ingwersen, W.W. The creation, management, and use of data quality information for Life Cycle Assessment. Int. J. Life Cycle Assess. 2018, 23, 759–772.
- Mannheim (2021) Mannheim, V. Life Cycle Assessment model of plastic products: Comparing environmental impacts for different scenarios in the production stage. Polymers 2021, 13, 777.
- McAlister et al. (2021) McAlister, S.; Grant, T.; McGain, F. An LCA of hospital pathology testing. Int. J. Life Cycle Assess. 2021, 26, 1753–1763.
- EU Commission (2020) EU Commission. Communication from the Commission to the European Parliament, the Council, the European Economic and Social Committee and the Committee of the Regions. Off. J. Eur. Union 2020. https://eur-lex.europa.eu/legal-content/EN/ALL/?uri=CELEX:52012DC0673 (accessed on 25 November 2022).
- Agreement (2015) Agreement, P. Paris agreement. In Proceedings of the Report of the Conference of the Parties to the United Nations Framework Convention on Climate Change (21st Session, 2015: Paris), Paris, France, 30 November–13 December 2015 2015; Volume 4, p. 2017.
- EU Commission (2013) EU Commission. 2013/179/EU: Commission recommendation of 9 April 2013 on the use of common methods to measure and communicate the life cycle environmental performance of products and organisations text with EEA relevance. Off. J. Eur. Union 2013. https://eur-lex.europa.eu/legal-content/EN/TXT/?uri=CELEX:32013H0179 (accessed 25 November 2022).
- Brander and Davis (2012) Brander, M.; Davis, G. Greenhouse gases, CO2, CO2e, and carbon: What do all these terms mean? Econometrica 2012. https://bluemangrove.fund/wp-content/uploads/2021/03/Glossary-on-different-CO2-terms.pdf (acessed 25 November 2022).
- DeMarco and Fortier (2021) DeMarco, M.; Fortier, M.O.P. Functional unit choice in space conditioning Life Cycle Assessment: Review and recommendations. Energy Build. 2021, 225, 111626.
- Furberg et al. (2022) Furberg, A.; Arvidsson, R.; Molander, S. A practice-based framework for defining functional units in comparative Life Cycle Assessments of materials. J. Ind. Ecol. 2022, 26, 718–730.
- Food and Drug Administration (2007) (FDA) Food and Drug Administration (FDA). Summary of Safety and Effectiveness Data-Electrophysiology Ablation catheter RF Ablation Generator. Available online: https://www.accessdata.fda.gov/cdrh_docs/pdf6/P060019b.pdf (accessed on 25 November 2022).
- Opresnik and Taisch (2015) Opresnik, D.; Taisch, M. The manufacturer’s value chain as a service—The case of remanufacturing. J. Remanufacturing 2015, 5, 1–23.
- Bruninx et al. (2013) Bruninx, K.; Madzharov, D.; Delarue, E.; D’haeseleer, W. Impact of the German nuclear phase-out on Europe’s electricity generation—A comprehensive study. Energy Policy 2013, 60, 251–261.
- Bamber et al. (2020) Bamber, N.; Turner, I.; Arulnathan, V.; Li, Y.; Zargar Ershadi, S.; Smart, A.; Pelletier, N. Comparing sources and analysis of uncertainty in consequential and attributional life cycle assessment: Review of current practice and recommendations. Int. J. Life Cycle Assess. 2020, 25, 168–180.
- Chen et al. (2020) Chen, T.L.; Kim, H.; Pan, S.Y.; Tseng, P.C.; Lin, Y.P.; Chiang, P.C. Implementation of green chemistry principles in circular economy system towards sustainable development goals: Challenges and perspectives. Sci. Total Environ. 2020, 716, 136998.
- Unger and Landis (2016) Unger, S.; Landis, A. Assessing the environmental, human health, and economic impacts of reprocessed medical devices in a Phoenix hospital’s supply chain. J. Clean. Prod. 2016, 112, 1995–2003. https://doi.org/10.1016/j.jclepro.2015.07.144.
- Eze et al. (2019) Eze, S.; Ijomah, W.; Wong, T.C. Accessing medical equipment in developing countries through remanufacturing. J. Remanufacturing 2019, 9, 207–233.
- Oturu et al. (2022) Oturu, K.; Ijomah, W.; Orr, A.; Verpeaux, L.; Broadfoot, B.; Clark, S.; Devine, R. Remanufacturing of single-use medical devices: A case study on cross-border collaboration between the UK and Nigeria. Health Technol. 2022, 12, 273–283.
- Eze et al. (2020) Eze, S.; Ijomah, W.; Wong, T. Remanufacturing: A potential sustainable solution for increasing medical equipment availability. J. Remanuf. 2020, 10, 141–159.
- Dong et al. (2018) Dong, Y.; Miraglia, S.; Manzo, S.; Georgiadis, S.; Sørup, H.J.D.; Boriani, E.; Hald, T.; Thöns, S.; Hauschild, M.Z. Environmental sustainable decision making—The need and obstacles for integration of LCA into decision analysis. Environ. Sci. Policy 2018, 87, 33–44.
- Smol et al. (2017) Smol, M.; Kulczycka, J.; Avdiushchenko, A. Circular economy indicators in relation to eco-innovation in European regions. Clean Technol. Environ. Policy 2017, 19, 669–678.
- Bojarski et al. (2009) Bojarski, A.D.; Laínez, J.M.; Espuña, A.; Puigjaner, L. Incorporating environmental impacts and regulations in a holistic supply chains modeling: An LCA approach. Comput. Chem. Eng. 2009, 33, 1747–1759.
- Soares et al. (2013) Soares, S.R.; Finotti, A.R.; da Silva, V.P.; Alvarenga, R.A. Applications of life cycle assessment and cost analysis in health care waste management. Waste Manag. 2013, 33, 175–183.
- Unger et al. (2017) Unger, S.R.; Hottle, T.A.; Hobbs, S.R.; Thiel, C.L.; Campion, N.; Bilec, M.M.; Landis, A.E. Do single-use medical devices containing biopolymers reduce the environmental impacts of surgical procedures compared with their plastic equivalents? J. Health Serv. Res. Policy 2017, 22, 218–225.
- Sørensen and Grüttner (2018) Sørensen, B.L.; Grüttner, H. Comparative study on environmental impacts of reusable and single-use bronchoscopes. Am. J. Environ. Prot. 2018, 7, 55–62.
- Martin et al. (2022) Martin, N.L.; Kononova, N.; Cerdas, F.; Herrmann, C. LCA-based framework to support planning of centralized vs. decentralized production of solid pharmaceuticals. Procedia CIRP 2022, 105, 128–133.
- Larsson Ivanov et al. (2019) Larsson Ivanov, O.; Honfi, D.; Santandrea, F.; Stripple, H. Consideration of uncertainties in LCA for infrastructure using probabilistic methods. Struct. Infrastruct. Eng. 2019, 15, 711–724.
- Wu (2019) Wu, R. The carbon footprint of the Chinese health-care system: An environmentally extended input–output and structural path analysis study. Lancet Planet. Health 2019, 3, e413–e419.
- van Straten et al. (2021) van Straten, B.; Ligtelijn, S.; Droog, L.; Putman, E.; Dankelman, J.; Weiland, N.; Horeman, T. A life cycle assessment of reprocessing face masks during the COVID-19 pandemic. Sci. Rep. 2021, 11, 1–9.
- Rizan et al. (2022) Rizan, C.; Brophy, T.; Lillywhite, R.; Reed, M.; Bhutta, M.F. Life cycle assessment and life cycle cost of repairing surgical scissors. Int. J. Life Cycle Assess. 2022, 27, 780–795.
- Freund et al. (2022) Freund, J.; Gast, K.; Zuegge, K.; Hicks, A. Environmental considerations in the selection of medical staplers: A comparative life cycle assessment. J. Clean. Prod. 2022, 371, 133490.
- Djati et al. (2018) Djati, R.; Paramita, A.; Cahayanti, S.R.; Chairani, E.; Koestoer, R.H.; Hartono, D.M. When LCA applies to health service industry. J. Environ. Sci. Sustain. Dev. 2018, 1, 40–62.
- Liu et al. (2019) Liu, Z.; Liu, W.; Adams, M.; Cote, R.P.; Geng, Y.; Chen, S. A hybrid model of LCA and energy for co-benefits assessment associated with waste and by-product reutilization. J. Clean. Prod. 2019, 236, 117670.
- Bishop et al. (2021) Bishop, G.; Styles, D.; Lens, P.N. Environmental performance comparison of bioplastics and petrochemical plastics: A review of Life Cycle Assessment (LCA) methodological decisions. Resour. Conserv. Recycl. 2021, 168, 105451.
- Anshassi and Townsend (2021) Anshassi, M.; Townsend, T.G. Reviewing the underlying assumptions in waste LCA models to identify impacts on waste management decision making. J. Clean. Prod. 2021, 313, 127913.
- Anshassi et al. (2021) Anshassi, M.; Sackles, H.; Townsend, T.G. A review of LCA assumptions impacting whether landfilling or incineration results in less greenhouse gas emissions. Resour. Conserv. Recycl. 2021, 174, 105810.
- Shimako et al. (2018) Shimako, A.H.; Tiruta-Barna, L.; de Faria, A.B.B.; Ahmadi, A.; Spérandio, M. Sensitivity analysis of temporal parameters in a dynamic LCA framework. Sci. Total Environ. 2018, 624, 1250–1262.
- Pannier et al. (2018) Pannier, M.L.; Schalbart, P.; Peuportier, B. Comprehensive assessment of sensitivity analysis methods for the identification of influential factors in building Life Cycle Assessment. J. Clean. Prod. 2018, 199, 466–480.
- Patouillard et al. (2019) Patouillard, L.; Collet, P.; Lesage, P.; Tirado Seco, P.; Bulle, C.; Margni, M. Prioritizing regionalization efforts in life cycle assessment through global sensitivity analysis: A sector meta-analysis based on Ecoinvent v3. Int. J. Life Cycle Assess. 2019, 24, 2238–2254.
- Spreafico (2022) Spreafico, C. An analysis of design strategies for circular economy through Life Cycle Assessment. Environ. Monit. Assess. 2022, 194, 1–33.
- Creadore and Castaldi (2022) Creadore, L.; Castaldi, M. Quantitative Comparison of Life Cycle Assessments of Advanced Recycling Technologies for End-of-Life Plastics. J. Energy Resour. Technol. 2022, 145, 042201.
- Andrae (2022) Andrae, A. Weighting of circularity dimensions. Eng. Appl. Sci. Lett. 2022, 5. https://doi.org/10.30538/psrp-easl2022.0085.