Elastic Valley Spin Controlled Chiral Coupling in Topological Valley Phononic Crystals
Abstract
Distinct from the phononic valley pseudo-spin, the real physical spin of elastic waves adds a novel tool-kit capable of envisaging the valley-spin physics of topological valley phononic crystals from a local viewpoint. Here, we report the observation of local elastic valley spin as well as the hidden elastic spin-valley locking mechanism overlooked before. We demonstrate that the selective one-way routing of valley phonon states along the topological interface can be reversed by imposing the elastic spin meta-source at different interface locations with opposite valley-spin correspondence. We unveil the physical mechanism of selective directionality as the elastic spin controlled chiral coupling of valley phonon states, through both analytical theory and experimental measurement of the opposite local elastic spin density at different interface locations for different transport directions. The elastic spin of valley topological edge phonons can be extended to other topological states and offers new tool to explore topological metamaterials.
The valley in the momentum space that provides an extra degree of freedom (DOF) to manipulate particles has attracted tremendous interests in the field of topological materials in parallel to charge and spin Schaibley et al. (2016); Lundeberg and Folk (2014); Mak et al. (2014). Beside electron systems, the valley DOF has been successfully extended to classical wave systems like optical Liu et al. (2016); Deng et al. (2015); Dong et al. (2017); Gao et al. (2018); Noh et al. (2018); Song et al. (2019), acoustic Lu et al. (2017); He et al. (2018); Zhang et al. (2021); Tian et al. (2020); Wang et al. (2021); Zhang et al. (2018) and elastic Pal and Ruzzene (2017); Vila et al. (2017); Yan et al. (2018); Miniaci et al. (2019); Mei et al. (2019); Ma et al. (2021); Du et al. (2020); Zhang et al. (2022); Wang et al. (2022) waves. Regarding elastic wave, the valley-dependent phenomena, e.g., the valley edge states Yan et al. (2018); Vila et al. (2017) and topological transportation Mei et al. (2019); Miniaci et al. (2019) are demonstrated experimentally. The topological phase transition of these lattice could be characterized by the valley Chern number Zhang et al. (2013); Du et al. (2020) and carried out by the honeycomb lattice with broken symmetry Torrent et al. (2013); Liu and Semperlotti (2018). Due to topological protection, these elastic topological edge states (ETES) based on valley DOF are immune to sharp corners and structural defects Pal and Ruzzene (2017); Yan et al. (2018).
The elastic valley pseudospin-up (or -down) states of ETES are mathematically described by the effective Dirac Hamiltonian Yan et al. (2018). As such, the elastic pseudospin has been underlined with the help of chiral vibration Yan et al. (2018) and the energy flux Du et al. (2020); Ye et al. (2017a), which deepens the understanding about the relationship between chiral vibration modes and pseudospin Liu et al. (2017, 2019). However, pseudospin fails to represent the detailed properties of a finite inhomogeneous area that contains rich information. At given position, a local real physical quantity with measurable effects is desired to help people to identify or manipulate the ETES.
Recently, research in optical Bliokh et al. (2014, 2015a); Aiello et al. (2015); Bliokh et al. (2015b), acoustic Shi et al. (2019); Bliokh and Nori (2019); Toftul et al. (2019); Long et al. (2020a, b) and elastic Long et al. (2018); Lanoy et al. (2020); Yuan et al. (2021) systems show that the real physical quantity, spin angular momentum (spin for short) in classic waves plays an important role in the topological and unidirectional transportation. For example, the elastic spin demonstrates the local chirality locking mechanism of Rayleigh wave in conventional semi-infinite medium Long et al. (2018); Yuan et al. (2021). The elastic spin is different from pseudospin Liu et al. (2017, 2019), the latter of which is not spin angular momentum, but represents a spin-like mathematical structure in various systems. Pseudospin does not have the unit of angular momentum, but is a dimensionless quantity. In contrast, the elastic spin is a real physical quantity as angular momentum of the structure Long et al. (2018); Ren (2022), which dose not rely on abstract analogue of mathematical structure.
Therefore, on one hand, although it is well accepted that the pseudospin-momentum locking is crucial for ETES, how the real local elastic spin locked with the directionality at different locations is not yet uncovered in topological elastic metamaterials. On the other hand, although the elastic spin could unveil more local physics in 3D complex structures, the application of elastic spin to study topological metamaterials is yet absent so far, let alone the valley elastic metamaterials.
Here, we construct topological phononic crystal (PC) plates based on valley DOF, and create ETES in between PC plates with opposite valley Hall phases. Particularly, we introduce the elastic spin into the valley PC plates and show the local elastic spin-momentum locking mechanism in valley metamaterials. We observe the unidirectional wave propagation according to both the spin distribution of edge states and position of meta-sources with sub scale in PC plate. The direction of spin density inside the edge states can give a clear guidance for selectively chiral manipulation. Our results advance the knowledge of local features of topological meta-materials, build a bridge between topological meta-materials and intrinsic elastic spin, and provide a flexible tool to investigate spin related phenomena in integrative on-chip devices Cha et al. (2018); Yan et al. (2018); Ma et al. (2021).
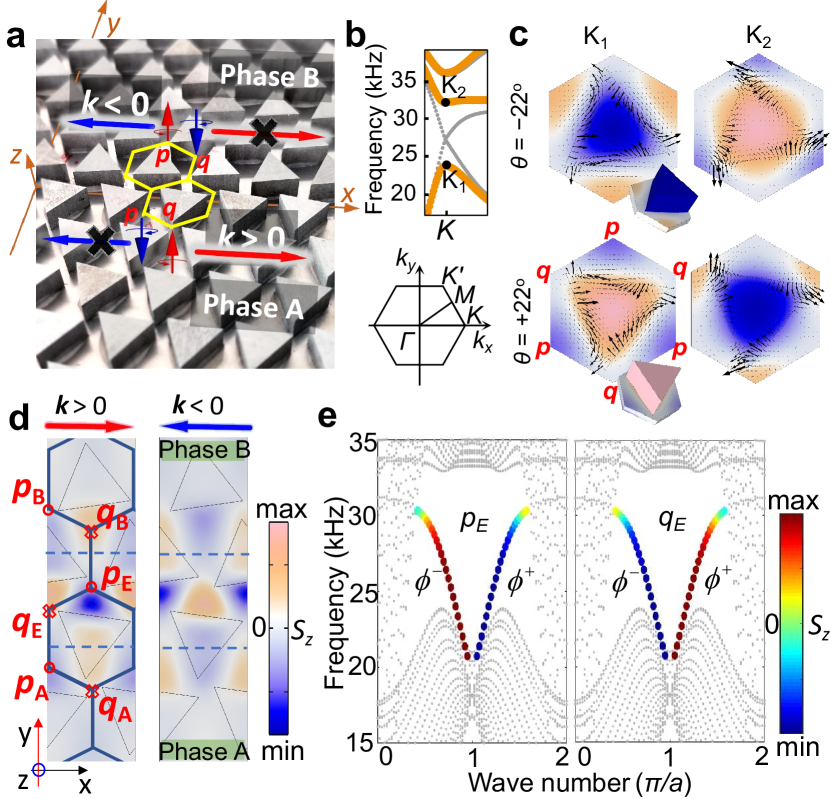
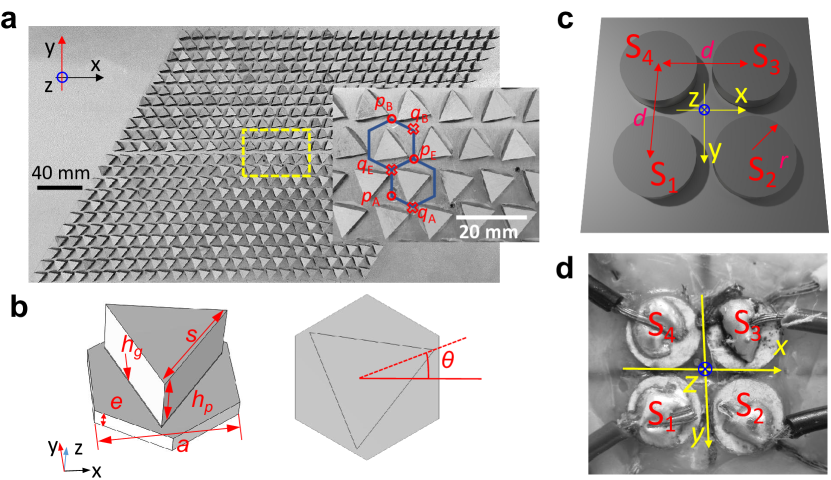
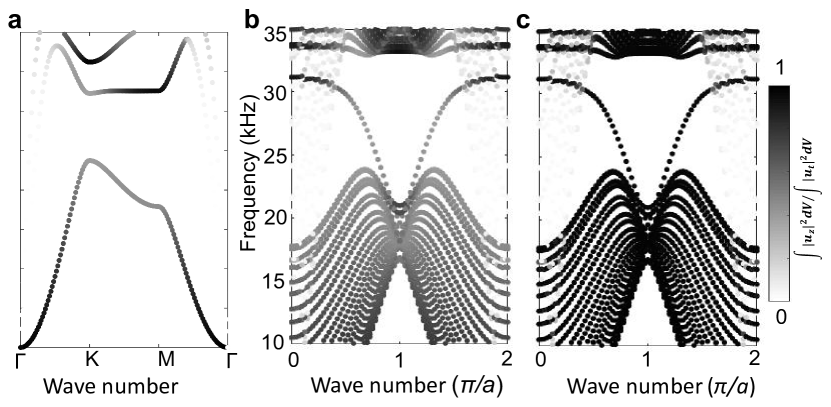
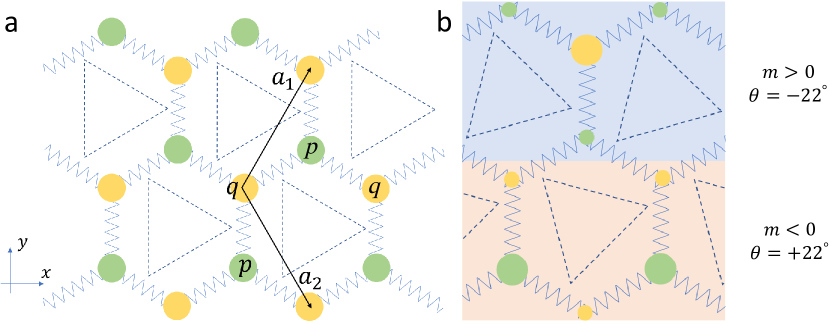
Figure 1a shows the photograph of a valley PC plate fabricated by erecting triangular aluminum pillars in hexagonal lattice on an aluminum plate using epoxy adhesiv(see also Supplementary Fig. 1a 111See Supplemental Material at (URL) about design of chiral elastic spin meta-source, sample fabrication, experimental measurement, numerical simulations, data processing and mass-spring model, which includes Refs. Graff (1975); Yang et al. (2021b); Chen et al. (2018); Nash et al. (2015)). The topological properties of PC plate with phase A and B are opposite with each other due to the converse rotation of pillars (Figs. 1b and 1c). Then, two ETES branches with positive and negative slopes occur in between the bulk band gap(Fig. 1e) Yan et al. (2018).The primary interest here is unveiling the hidden spin momentum locking mechanism which predicts multiple selective excitation of ETES, as shown in Fig. 1a. For example, the spin-up source at point or spin-down source at point can generate the leftward () wave; while the reversed condition leads to the rightward () wave.
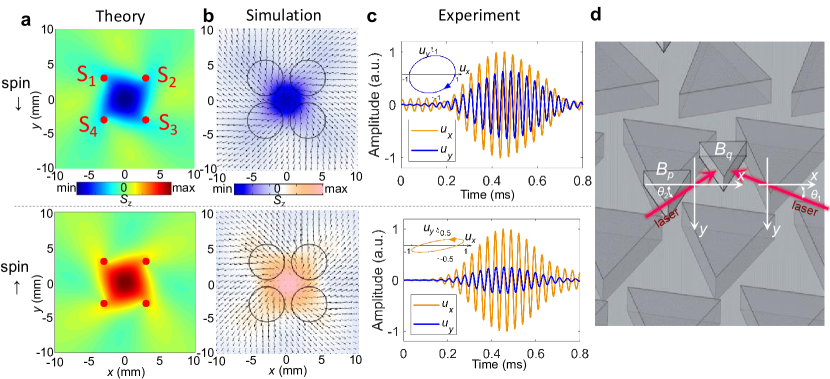
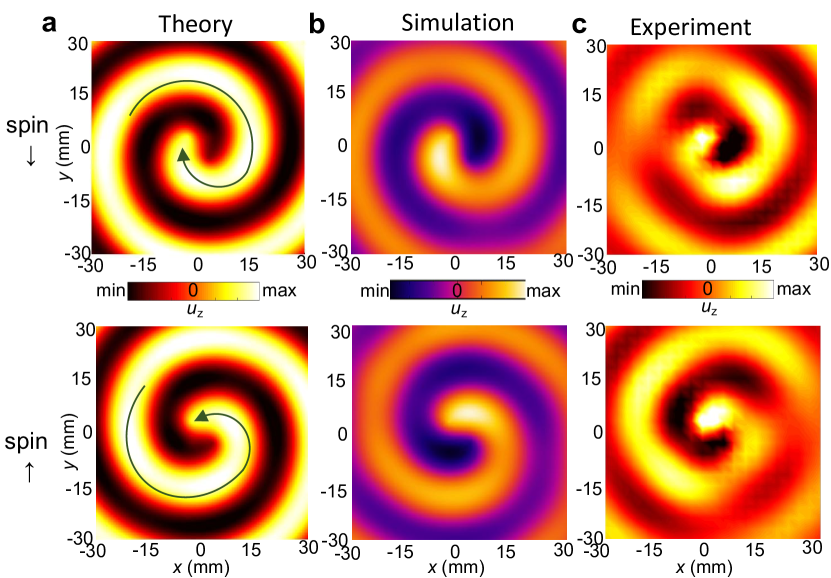
Figure 1d shows the spin density of ETES at 25.8 kHz on the substrate aluminum plate, where the elastic spin density is governed by Long et al. (2018); Ren (2022)
| (1) |
while the component along axis is then calculated by =. is the displacement vector. The time term is for monochromatic wave. The elastic spin is related to the spin angular momentum of media parcel with chirally polarized displacement vector. Elastic spin depends only on the displacement vector at selected location, which is different from the orbital angular momentum that relates also to the choice of coordinate origin Long et al. (2018). In this work, the clockwise (resp. anticlockwise) polarized displacement vector in - plane yields the negative (resp. positive) spin density for , respectively.
From Fig. 1d, the , and points all have negative on the state of ETES with positive group velocity ( 0, ), but the , and all have positive . The shows reversed distribution on state of ETES with negative group velocity ( 0, ). For comparison, Supplementary Fig. 3 11footnotemark: 1 shows the in-plane energy flux arrows near the interface that do not maintain distribution as clear as the elastic spin density. Note that we only show the spin density and distribution of energy flux on substrate, considering the spin meta-source is erected on the substrate.
To show the theoretical origin of distribution, we return to the basic topological properties of valley PC plates and ETES branches. Figure 1b shows the band structures of valley PC plate based on the milestone work Yan et al. (2018). When = , two degenerate states occur at K and they are separated by the rotation of pillars, as shown in Fig. 1b. The positive (resp. negative) distribution of spin density near and points is similar to the anti-clockwise (resp. clockwise) polarization of and sites in the mass-spring model 11footnotemark: 1. This is because the elastic spin Long et al. (2018) is related to the mechanical angular momentum of media parcel Zhang and Niu (2015). Supposing the medium parcel at and point as the mass and the rest of medium as the elastic springs, the spin of eigen states at and point are related to the circular motion of the eigenstates in mass-spring models Liu et al. (2017, 2019); Chen et al. (2019) that can be described by the effective Dirac Hamiltonian 11footnotemark: 1.
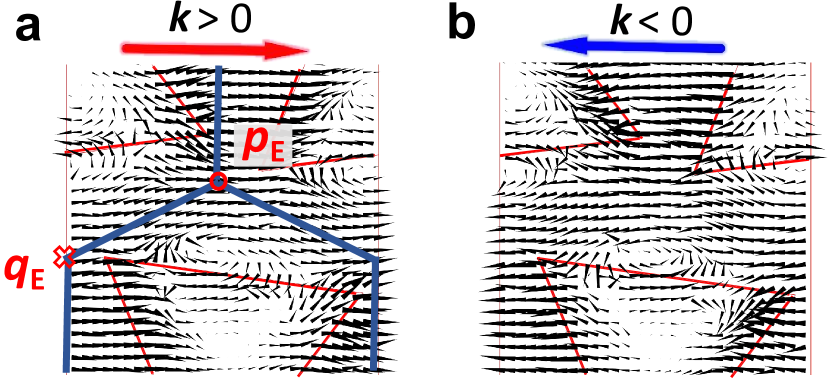
When the symmetry is broken by the rotation of triangle pillars, the eigen frequencies of two states at K are shifted to open a band gap for flexural plate wave. As shown in Fig. 1c, the frequency of eigen state with negative spin density at point decreases when = but increases when = . Regarding both values, the spin inside triangle pillars is reversed between and . For example, when = , in triangular pillar at is purely positive, indicating the anti-clockwise polarization of in-plane displacement field anywhere inside the pillar and therefore the anti-clockwise motion of single pillar. This is well consistent with the reported anti-clockwise motion of pillar of valley chiral state Yan et al. (2018). Furthermore and qualitatively, the spin direction (up or down) of at or point agrees with the in-plane energy flux rotation (anti-clockwise or clockwise) therein. This lies in the phase difference of , e.g., the around or points have experienced phase difference Lu et al. (2016). This applies also to meta-source where the input signal on PZT - experiences phase difference 11footnotemark: 1.
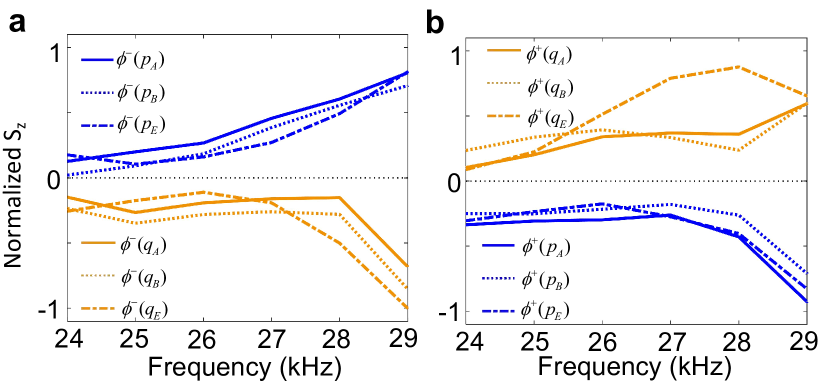
Now let us combine PC plates with opposite rotational angle, i.e phase B up and A down. Figure 1e shows the projected dispersion curves of supercell of , magnifying two ETES branches with forward or backward group velocity, respectively. The distribution of along both ETES is already shown in Fig. 1d, while Fig. 1e further summarizes the value along both ETES branches, e.g. at (left panel, also for and ) and (right panel, also for and ), respectively. Figure 1e yields a novel and important deduction: the or located at or , respectively, is tightly bonding to the ETES due to spin-momentum locking, while the or located at or allows for ETES, in the frequency range of ETES with nearly linear slope.
The elastic spin at and points near the interface can be qualitatively understood by analytically solving the simplified mass-spring model 11footnotemark: 1, as:
| (2) |
and are elastic spin density derived from the displacement vectors of and sites. denotes the decaying rate of the ETES apart from the interface. = +1 (-1) is associated with () valley or (). Obviously, the sign of elastic spin density depends on propagation direction of ETES, and and are opposite with each other, magnifying well the calculated results in Figs. 1d and 1e.
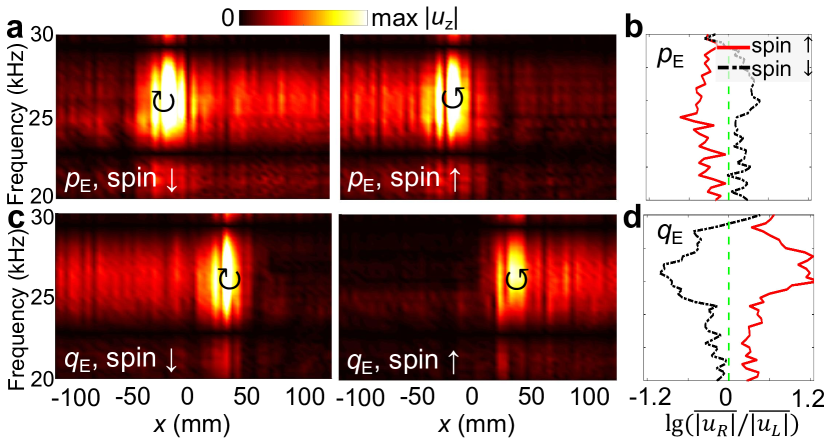
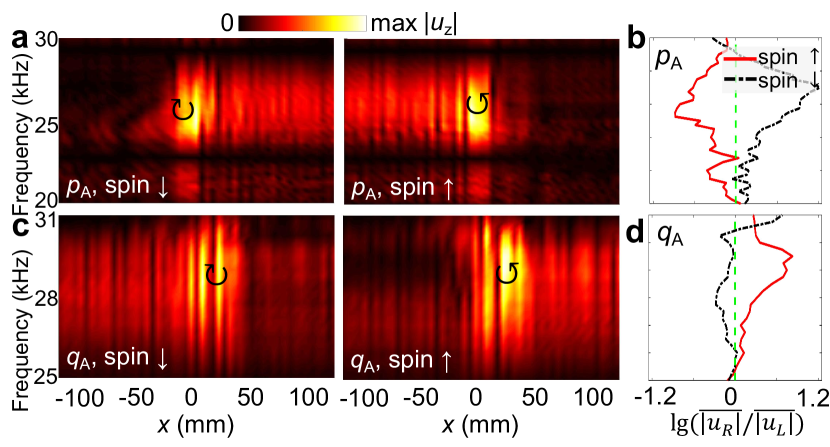
For experimental measurement, we put up elastic spin meta-source centered at , , , or with both spin-up and spin-down settings. The meta-source is made of four small lead zirconate titanate piezoelectric ceramics (PZT) disks with radii mm arranged in square lattice Ye et al. (2017b) (see Supplementary Figs. 1c and 1d 11footnotemark: 1). Although the assembly of the meta-source occupies area about 11 mm11 mm, the effective area of meta-source is the center position (about 2.5 mm2.5 mm) with highly confined of the same sign. Figure 2a shows the measured along interface with meta-source central at . Notice that for each measurement position, the amplitude of is retrieved from the time resolved profile by using Fourier transformation (FFT) of the recorded wave package at the target frequencies Yuan et al. (2021). In Fig. 2a, the asymmetric rightward and leftward wave propagation are successfully generated by spin-down and spin-up source, respectively. This asymmetric propagation is observed in broad frequency range, as shown by the ratio lg in Fig. 2b: the positive (resp. negative) value indicates the rightward (resp. leftward) wave propagation generated by the spin down (resp. up) source. These experimental results agree with and must be ascribed to the distribution in Fig. 1e: at , the is negative for but positive for . The spin-down (resp. spin-up) source central at with (resp. ) generates the (resp. ). Hence, the unidirectional transport is determined by both the source spin and the local elastic spin density distribution around interface , which demonstrates strongly the elastic spin-momentum locking in valley topological phononic materials.
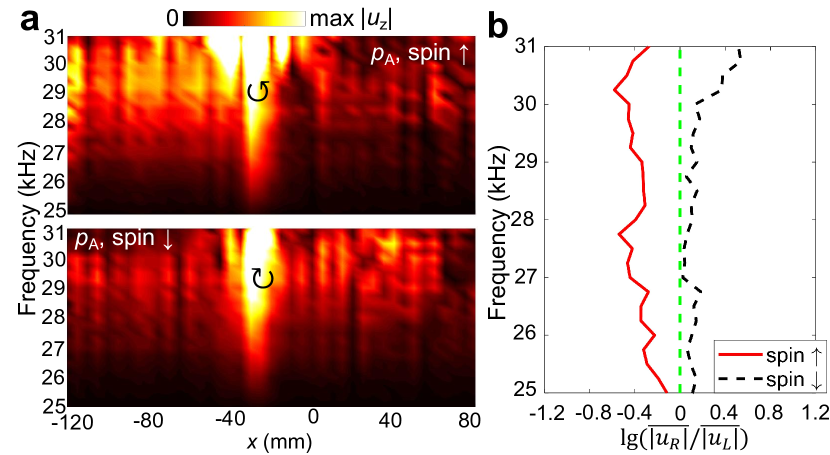
To further shed lights on this spin-momentum locking, we show in Figs. 2c and 2d the mapping of and the difference lg along interface , with the meta-source central at . In this case, the leftward and rightward wave propagation are realized by using spin-down and up source, respectively, which is opposite to the situation shown in Fig. 2a. Notably, the amplitude of asymmetric elastic wave between right and left side can reach a difference of times (lg). Supplementary Figs. 6a-6d 11footnotemark: 1 detail the experimental results when the source is central at (resp. ), and the spin source generates asymmetric transportation in a way similar to those results by putting the source central at (resp. ). The observation of broadband unidirectional ETES agrees well with the distribution in Figs. 1b and 1e.
It is noteworthy that Fig. 2 excludes frequencies up 30 kHz, considering that ETES branches are nearly flat with small spin density at or , together with the possible perturbing by some bulk modes, as shown in Fig. 1e. The calculated ratio lg (see Supplementary Fig. 8 11footnotemark: 1) shows similar results above 30 kHz. In addition, the relatively weak asymmetric propagation at lower frequencies (24 kHz) may come from the experimental factors, e.g. installation errors of meta-source, and the possible influences from bulk modes. Besides, we must note that when using even smaller PZT disk (with radii 1.5 mm) to construct meta-source, the installation process introduces even strong imperfection and downloads the ratio lg, e.g., at position. Yet, the broadband asymmetric wave transportation is still observable (see Supplementary 11footnotemark: 1).
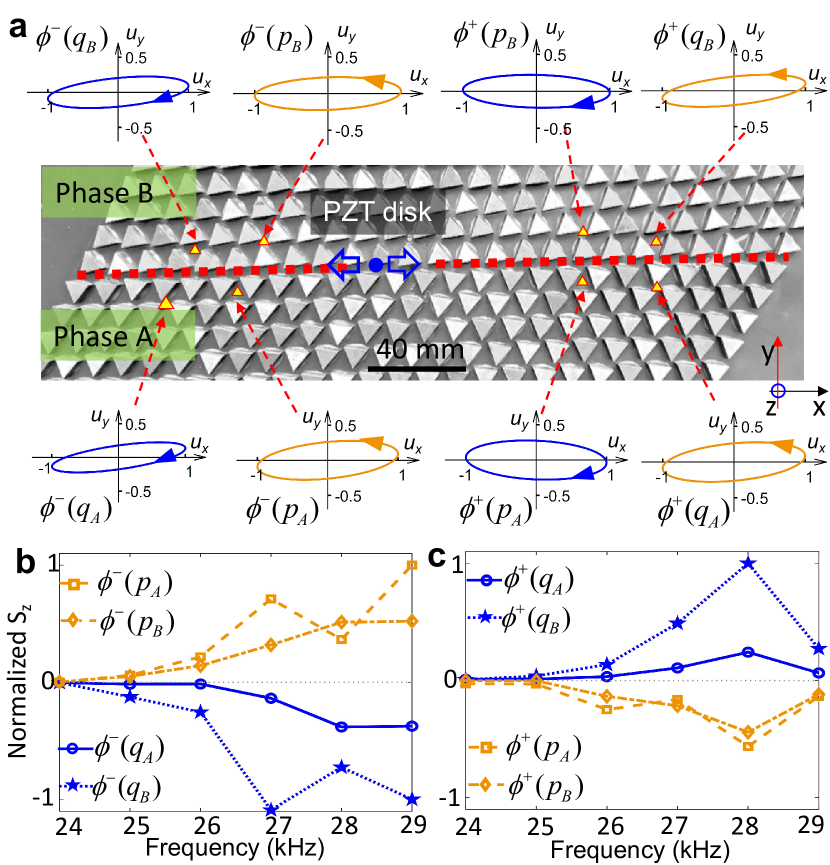
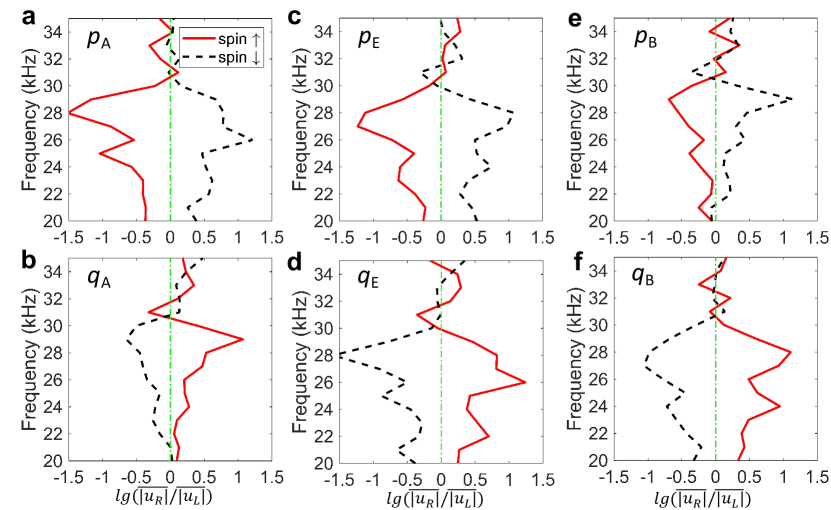
Finally, we turn to the experimental characterization of at or points. Figure 3a shows the zooming in of experimental sample for interface . Without losing generality, one PZT disk is chosen to generate both and instead of meta-source. The yellow triangles stand for the position of subwavelength triangular pillars at high-symmetry points (, , , and ) but on the bottom surface of PC plate. By measuring the displacement that is perpendicular to the side surface of subwavelength triangular pillars (see Supplementary 11footnotemark: 1), we can obtain the and at the selected points. After making FFT of and , we can extract the amplitude and phase information of FFT components of and at the given frequency, e.g. 28 kHz. Then, we draw the displacement polarization by using the retrieved amplitude and phase value of and at the given frequency, and obtain the elastic spin density Yuan et al. (2021). Figure 3a shows the experimentally obtained displacement polarization at both and points. At the left side of wave source, the and feature anticlockwise polarized , resulting in positive . While the and feature clockwise polarized with the negative . Regarding the right side of wave source, the situation is reversed: both sites, i.e. and , show clockwise polarized with negative , while both sites, i.e. and , demonstrate the anticlockwise polarized with positive .
Figure 3b summarizes the measured at points and at the left side of source. In short, the features positive value on points but negative value on points within broad frequency range. The situation at points or at right side of source, as presented in Fig. 3c, shows the reverse scenario: the is negative on points but positive on points. These experimental results agree well with the numerical ones shown in Supplementary. In Figs. 3b and 3c, the normalized features smaller value than the numerical counterparts (Supplementary Fig. 8 11footnotemark: 1 ) at lower frequency, due to the imperfect installation of source, the possible influence of bulk edge modes and some other factors in experiment. Nevertheless, both experimental and numerical results confirm that the unidirectional wave transportation is spin-momentum locking between the spin of meta-source and the spin density distribution on PC plate at discrete points.
In conclusion, we have successfully observed the elastic spin density at selected local points in valley topological materials and the hidden elastic spin-valley locking resulted unidirectional transport. The selective chiral coupling to the propagating direction is mostly determined by the local spin-momentum locking according to the elastic spin of source and local spin density distribution in valley topological PC plate. In the future, the real measurable physical effects of elastic spin angular momentum, such as the spin-torque correspondence Toftul et al. (2019); Shi et al. (2019); Yang et al. (2021a), could largely expand the application scenarios of topological valley phononic crystals. The local elastic valley spin as well as the hidden elastic spin-valley locking advances the knowledge about the conventional features in topological meta-materials and phononics Zhang et al. (2010); Li et al. (2012), which can be extended to other topological states and offers flexible tool to build up elastic devices like elastic (or phonon) logic devices Boechler et al. (2011); Liu et al. (2017); Chen et al. (2022), topological nonreciprocal transmitter Sanavio et al. (2020); Nassar et al. (2020), unidirectional information transportation Ye et al. (2017b, a); Yuan et al. (2021); Zhang et al. (2020), intriguing transport in novel valley system Fan et al. (2022); Lu et al. (2018), and etc.
This work is supported by National Natural Science Foundation of China (Nos. 11935010, 12172256 and 11872282), Shanghai Science and Technology Committee (No. 20ZR1462700), and the Opening Project of Shanghai Key Laboratory of Special Artificial Microstructure Materials and Technology.
References
- Schaibley et al. (2016) J. R. Schaibley, H. Yu, G. Clark, P. Rivera, J. S. Ross, K. L. Seyler, W. Yao, and X. Xu, Nature Reviews Materials 1, 16055 (2016).
- Lundeberg and Folk (2014) M. B. Lundeberg and J. A. Folk, Science 346, 422 (2014).
- Mak et al. (2014) K. F. Mak, K. L. McGill, J. Park, and P. L. McEuen, Science 344, 1489 (2014).
- Liu et al. (2016) J.-L. Liu, W.-M. Ye, and S. Zhang, Light: Science & Applications 5, 16094 (2016).
- Deng et al. (2015) F. Deng, Y. Li, Y. Sun, X. Wang, Z. Guo, Y. Shi, H. Jiang, K. Chang, and H. Chen, Optics Letters 40, 3380 (2015).
- Dong et al. (2017) J.-W. Dong, X.-D. Chen, H. Zhu, Y. Wang, and X. Zhang, Nature Materials 16, 298 (2017).
- Gao et al. (2018) F. Gao, H. Xue, Z. Yang, K. Lai, Y. Yu, X. Lin, Y. Chong, G. Shvets, and B. Zhang, Nature Physics 14, 140 (2018).
- Noh et al. (2018) J. Noh, S. Huang, K. P. Chen, and M. C. Rechtsman, Physical Review Letters 120, 063902 (2018).
- Song et al. (2019) D. Song, D. Leykam, J. Su, X. Liu, L. Tang, S. Liu, J. Zhao, N. K. Efremidis, J. Xu, and Z. Chen, Physical Review Letters 122, 123903 (2019).
- Lu et al. (2017) J. Lu, C. Qiu, L. Ye, X. Fan, M. Ke, F. Zhang, and Z. Liu, Nature Physics 13, 369 (2017).
- He et al. (2018) C. He, S.-Y. Yu, H. Ge, H. Wang, Y. Tian, H. Zhang, X.-C. Sun, Y. B. Chen, J. Zhou, M.-H. Lu, and Y.-F. Chen, Nature Communications 9, 4555 (2018).
- Zhang et al. (2021) X. Zhang, L. Liu, M.-H. Lu, and Y.-F. Chen, Physical Review Letters 126, 156401 (2021).
- Tian et al. (2020) Z. Tian, C. Shen, J. Li, E. Reit, H. Bachman, J. E. S. Socolar, S. A. Cummer, and T. Jun Huang, Nature Communications 11, 762 (2020).
- Wang et al. (2021) Z. Wang, Y. Yang, H. Li, H. Jia, J. Luo, J. Huang, Z. Wang, B. Jiang, N. Yang, G. Jin, and H. Yang, Physical Review Applied 15, 024019 (2021).
- Zhang et al. (2018) Z. Zhang, Y. Tian, Y. Wang, S. Gao, Y. Cheng, X. Liu, and J. Christensen, Advanced Materials 30, 1803229 (2018).
- Pal and Ruzzene (2017) R. K. Pal and M. Ruzzene, New Journal of Physics 19, 025001 (2017).
- Vila et al. (2017) J. Vila, R. K. Pal, and M. Ruzzene, Physical Review B 96, 134307 (2017).
- Yan et al. (2018) M. Yan, J. Lu, F. Li, W. Deng, X. Huang, J. Ma, and Z. Liu, Nature Materials 17, 993 (2018).
- Miniaci et al. (2019) M. Miniaci, R. K. Pal, R. Manna, and M. Ruzzene, Physical Review B 100, 024304 (2019).
- Mei et al. (2019) J. Mei, J. Wang, X. Zhang, S. Yu, Z. Wang, and M.-H. Lu, Physical Review Applied 12, 054041 (2019).
- Ma et al. (2021) J. Ma, X. Xi, and X. Sun, Advanced Materials 33, 2006521 (2021).
- Du et al. (2020) Z. Du, H. Chen, and G. Huang, Journal of the Mechanics and Physics of Solids 135, 103784 (2020).
- Zhang et al. (2022) Q. Zhang, D. Lee, L. Zheng, X. Ma, S. I. Meyer, L. He, H. Ye, Z. Gong, B. Zhen, K. Lai, and A. T. C. Johnson, Nature Electronics 5, 157 (2022).
- Wang et al. (2022) J.-Q. Wang, Z.-D. Zhang, S.-Y. Yu, H. Ge, K.-F. Liu, T. Wu, X.-C. Sun, L. Liu, H.-Y. Chen, C. He, M.-H. Lu, and Y.-F. Chen, Nature Communications 13, 1324 (2022).
- Zhang et al. (2013) F. Zhang, A. H. MacDonald, and E. J. Mele, Proceedings of the National Academy of Sciences 110, 10546 (2013).
- Torrent et al. (2013) D. Torrent, D. Mayou, and J. Sánchez-Dehesa, Physical Review B 87, 115143 (2013).
- Liu and Semperlotti (2018) T.-W. Liu and F. Semperlotti, Physical Review Applied 9, 014001 (2018).
- Ye et al. (2017a) L. Ye, C. Qiu, J. Lu, X. Wen, Y. Shen, M. Ke, F. Zhang, and Z. Liu, Physical Review B 95, 174106 (2017a).
- Liu et al. (2017) Y. Liu, C.-S. Lian, Y. Li, Y. Xu, and W. Duan, Phys. Rev. Lett. 119, 255901 (2017).
- Liu et al. (2019) Y. Liu, Y. Xu, and W. Duan, Research (Washington, D.C.) 2019, 5173580 (2019).
- Bliokh et al. (2014) K. Y. Bliokh, A. Y. Bekshaev, and F. Nori, Nature Communications 5, 3300 (2014).
- Bliokh et al. (2015a) K. Y. Bliokh, D. Smirnova, and F. Nori, Science 348, 1448 (2015a).
- Aiello et al. (2015) A. Aiello, P. Banzer, M. Neugebauer, and G. Leuchs, Nature Photonics 9, 789 (2015).
- Bliokh et al. (2015b) K. Y. Bliokh, F. J. Rodríguez-Fortuño, F. Nori, and A. V. Zayats, Nature Photonics 9, 796 (2015b).
- Shi et al. (2019) C. Shi, R. Zhao, Y. Long, S. Yang, Y. Wang, H. Chen, J. Ren, and X. Zhang, National Science Review 6, 707 (2019).
- Bliokh and Nori (2019) K. Y. Bliokh and F. Nori, Physical Review B 99, 174310 (2019).
- Toftul et al. (2019) I. D. Toftul, K. Y. Bliokh, M. I. Petrov, and F. Nori, Physical Review Letters 123, 183901 (2019).
- Long et al. (2020a) Y. Long, D. Zhang, C. Yang, J. Ge, H. Chen, and J. Ren, Nature Communications 11, 1 (2020a).
- Long et al. (2020b) Y. Long, H. Ge, D. Zhang, X. Xu, J. Ren, M.-H. Lu, M. Bao, H. Chen, and Y.-F. Chen, National Science Review 7, 1024 (2020b).
- Long et al. (2018) Y. Long, J. Ren, and H. Chen, Proceedings of the National Academy of Sciences 115, 9951 (2018).
- Lanoy et al. (2020) M. Lanoy, F. Lemoult, A. Eddi, and C. Prada, Proceedings of the National Academy of Sciences 117, 30186 (2020).
- Yuan et al. (2021) W. Yuan, C. Yang, D. Zhang, Y. Long, Y. Pan, Z. Zhong, H. Chen, J. Zhao, and J. Ren, Nature Communications 12, 6594 (2021).
- Ren (2022) J. Ren, arXiv , arXiv: 2211.04959 (2022).
- Cha et al. (2018) J. Cha, K. W. Kim, and C. Daraio, Nature 564, 229 (2018).
- Note (1) See Supplemental Material at (URL) about design of chiral elastic spin meta-source, sample fabrication, experimental measurement, numerical simulations, data processing and mass-spring model, which includes Refs. Graff (1975); Yang et al. (2021b); Chen et al. (2018); Nash et al. (2015).
- Zhang and Niu (2015) L. Zhang and Q. Niu, Phys. Rev. Lett. 115, 115502 (2015).
- Chen et al. (2019) Y. Chen, X. Liu, and G. Hu, Journal of the Mechanics and Physics of Solids 122, 54 (2019).
- Lu et al. (2016) J. Lu, C. Qiu, M. Ke, and Z. Liu, Physical Review Letters 116, 093901 (2016).
- Ye et al. (2017b) L. Ye, Y. Yang, Z. Hong Hang, C. Qiu, and Z. Liu, Applied Physics Letters 111, 251107 (2017b).
- Yang et al. (2021a) C. Yang, Y.-T. Tan, H. Chen, and J. Ren, Journal of Applied Physics 129, 135106 (2021a).
- Zhang et al. (2010) L. Zhang, J. Ren, J.-S. Wang, and B. Li, Phys. Rev. Lett. 105, 225901 (2010).
- Li et al. (2012) N. Li, J. Ren, L. Wang, G. Zhang, P. Hänggi, and B. Li, Rev. Mod. Phys. 84, 1045 (2012).
- Boechler et al. (2011) N. Boechler, G. Theocharis, and C. Daraio, Nature materials 10, 665 (2011).
- Chen et al. (2022) H. Chen, W. Wu, J. Zhu, Z. Yang, W. Gong, W. Gao, S. A. Yang, and L. Zhang, Nano Letters 22, 1688 (2022).
- Sanavio et al. (2020) C. Sanavio, V. Peano, and A. Xuereb, Physical Review B 101, 085108 (2020).
- Nassar et al. (2020) H. Nassar, B. Yousefzadeh, R. Fleury, M. Ruzzene, A. Alù, C. Daraio, A. N. Norris, G. Huang, and M. R. Haberman, Nature Reviews Materials 5, 667 (2020).
- Zhang et al. (2020) X. Zhang, G. E. W. Bauer, and T. Yu, Physical Review Letters 125, 077203 (2020).
- Fan et al. (2022) X. Fan, T. Xia, H. Qiu, Q. Zhang, and C. Qiu, Phys. Rev. Lett. 128, 216403 (2022).
- Lu et al. (2018) J. Lu, C. Qiu, W. Deng, X. Huang, F. Li, F. Zhang, S. Chen, and Z. Liu, Physical Review Letters 120, 116802 (2018).
- Graff (1975) K. F. Graff, Wave Motion in Elastic Solids (Ohio State University Press, 1975).
- Yang et al. (2021b) L. Yang, K. Yu, B. Bonello, B. Djafari-Rouhani, W. Wang, and Y. Wu, Phys. Rev. B 103, 184303 (2021b).
- Chen et al. (2018) H. Chen, H. Nassar, A. N. Norris, G. K. Hu, and G. L. Huang, Physical Review B 98, 094302 (2018).
- Nash et al. (2015) L. M. Nash, D. Kleckner, A. Read, V. Vitelli, A. M. Turner, and W. T. M. Irvine, Proceedings of the National Academy of Sciences 112, 14495 (2015).
Elastic Valley Spin Controlled Chiral Coupling in Topological Valley Phononic Crystals-Supplementary
Jinfeng Zhao These authors contributed equally: Jinfeng Zhao, Chenwen Yang, Weitao Yuan
Chenwen Yang These authors contributed equally: Jinfeng Zhao, Chenwen Yang, Weitao Yuan
Weitao Yuan These authors contributed equally: Jinfeng Zhao, Chenwen Yang, Weitao Yuan
Danmei Zhang
Yang Long
Yongdong Pan
Hong Chen
Zheng Zhong
Jie Ren
I Design of chiral elastic spin meta-source.
Our chiral elastic spin meta-sources are composed of four subwavelength PZT disks that are fixed to the thin aluminum plate by epoxy adhesive in square. We first evaluate the chiral elastic spin meta-source in theory. Consider a thin solid plate in - plane, the plate wave equation is then governed by Graff (1975)
| (3) |
where is the biharmonic operator, is the out-of-plane displacement along axis, is the angular frequency, is the mass density of plate, is the plate thickness, is the plate bending stiffness, is the Young’s modulus, is the shear modulus, and is the applied force along axis.
For monochromatic wave, the out-of-plane displacement caused by the point source in thin plate can be assumed as
| (4) |
where is the initial amplitude, is wave number of plate wave, is a positive number indicating the decay of propagating wave away from the point source, is an additional phase, = and (,) is the point source location. Notice that near-field evanescent wave of the point source is ignored in this equation.
Typically, for a thin plate in - plane, the stress components , , and are much smaller than other components , or . As a consequence, the strain components relating to and satisfy condition
| (5) | |||
where and are the in-plane displacement along and axes, respectively. Considering is only the function of and , the in-plane displacement can be obtained as
| (6) | |||
Here, the is set at the middle plane of thin plate.
The elastic spin density in isotropic solids is governed by Long et al. (2018)
| (7) |
The component of along the axis is then calculated by =. When elaborating the meta-source by using multiple point sources, e.g., two point sources, can then be written as
| (8) | |||
where
| (9) | |||
with * as the conjugate operator. When the meta-source is built by four point sources, the can be derived as .
To give illustration, in Supplementary Figures 7 and 8, we show the theoretical results of meta-source consisting four point sources located as (,) = (-3 mm, 3 mm), (3 mm, 3 mm), (3 mm, -3 mm), (-3 mm, -3 mm) with additional phase = , , , , in accordance to the experimental configuration. is set as 0 for simplicity. Obviously, presents good agreement between the theoretical, numerical and experimental results, and so is the distribution. It is noteworthy that includes so that the value of present the same sign along the thickness direction, with the maxima on both the top and bottom surfaces at and , respectively.
II Sample Fabrication.
The phononic crystal (PC) plate is fabricated by erecting triangular pillars on substrate plate using epoxy adhesive. The triangular pillars and substrate plate are made of 6061-T6 aluminum. We first perforate triangular pillars from a 5 mm thick aluminum plate with geometric side length = 10 mm by laser cutting technique. Then we manually fix an array of 25 22 triangular pillars in hexagonal lattice to a 800 mm 700 mm rhombus aluminum plate with epoxy adhesive. The rotation angle of pillars is and , respectively. Meanwhile, the PC occupies a rhombus region to reduce the influence of wave reflection between PC plate and pure aluminum plate. After 24 hours at room temperature, the strength of the epoxy adhesive reaches their maximum, and these samples can be used for experiment.
III Experimental measurement.
To generate ultrasonic wave pulses, the subwavelength lead zirconate titanate piezoelectric ceramic (PZT) disks are used to excite point-like source and chiral elastic spin meta-source. The PZT disks are fixed to substrate plate by using epoxy adhesive. In both cases, the five-cycled tone burst electrical signals with central frequency are issued from the function generator (RIGOL DG1032z) and then amplified by the power amplifier (Aigtek ATA-2022H). The every phase difference against in chiral meta-source is tuned by using function generator (RIGOL DG1032z). To measure elastic wave propagation, the laser Droppler vibrometer (LDV, Polytec vibrometer OFV 2570) is used to record the out-of-plane displacement at any position on substrate surface, and the out-of-plane displacement perpendicular to each face of small triangular pillars for elastic SAM measurement (Supplementary Fig. 7). Each measurement comes from the averaging over 128 scans digitized by an oscilloscope (DPO 4102B) at sampling frequency of 250 MHz. This measurement allows for a good signal-to-noise (S/N) ratio.
IV Numerical simulations.
The numerical simulations are performed by finite element method using commercial software COMSOL Multiphysics. For the physical parameters of 6061-T6 aluminum, we chose the mass density , Young’s modulus GPa, and Poisson’s ratio . For the epoxy adhesive, we set the , GPa, and . The geometric parameters include = 12 mm, = 1.5 mm, = 0.14 mm, = 5 mm, = 10 mm, = .
V Data processing.
To get the displacement polarization and the maps of wave transportation, our experimental methods and detailed data analysis procedures are as what follows. In order to obtain the displacement polarization, we adopt an experimental method as shown in Supplementary Fig. 7d. We erect small sub-wavelength aluminum triangular pillars on the back surface of substrate, central at selected or point in phase A (B) or on interface. These small size pillars feature the side length 2.9 mm and height 3 mm that is much smaller than the triangular scatters for building PC plate. Then we use LDV to record the displacement that is perpendicular to the side surface of sub-wavelength small triangular pillars, as shown by the red arrows in Supplementary Fig. 7d. We label the displacement on side as with angle , while the displacement on side as with angle , so that and of the effective point can be obtained as , and , in the form of time evolution signal. Then by making the Fourier transformation (FFT) of and within the same time period including the same target wave package, we can extract the amplitude and phase information of FFT components of and at given frequency, e.g. 28 kHz. After that, we can draw the displacement polarization by using the retrieved amplitude and phase value of and at the given frequency with time term , and we obtain the elastic SAM density. To draw the maps of normalized along interface, we measure the out-of-plane displacement at a series of points along interface on substrate, from 125 mm to 125 mm every 5 mm, and get the time evolution signal at each point. Then we make the FFT of measured time evolution signal and extract the amplitude information of FFT components of in concerned frequency range. The assembly of all the extracted amplitude of gives rise to the maps of in Figs. 3a and 3c, and Supplementary Figs. 9 and 10.
VI The mass-spring model.
The SAM density of elastic wave is related with the mechanical angular momentum of the medium parcel which has a circularly polarized displacement vector Long et al. (2018). We can understand the SAM properties of and points through the well-established mass-spring model Chen et al. (2019), where the mass-spring model is widely used to build and understand physical models Yang et al. (2021b); Pal and Ruzzene (2017); Torrent et al. (2013); Chen et al. (2018); Vila et al. (2017); Nash et al. (2015). Suppose the valley metamaterial in our work as a mass-spring system in Supplementary Fig. 13. We regard the medium parcel at and points as the masses and the rest medium as elastic springs.
In Supplementary Fig. 13, the unit cell has a pair of mass and at and point, respectively, and the springs between them. The stiffness of spring is , and the length of spring is . Lattice vectors are and . Consider a Bloch wave of unit cell (,) in the form: , where . The harmonic time term is omitted here. By solving the equation of motion Chen et al. (2019), we can get the Hamiltonian of this model
| (10) | |||
| (11) | |||
| (16) | |||
| (17) | |||
| (20) |
The subscript † refers to the conjugate transpose, and is the unit matrix. At Brillouin zone corner , the two eigen states of this Hamiltonian are
| (21) |
while at , the two eigen states can be written as
| (22) |
These eigen states show a clear picture of the circularly polarized displacements of mass. For example, at , means , and the displacement vector at shows clockwise polarization but equates zero at point. Thus, in continuum valley metamaterial, we shall get the negative SAM density at point and the zero SAM density at point. According to above theoretical eigen states, we can also see that at , one state possess clockwise polarization at site () while the other state shows the anticlockwise polarization at site (), explaining well the calculated negative SAM density at point () and positive SAM density at point () in continuum valley metamaterial.
The effective Hamiltonian near the Dirac point of this system is expressed as
| (23) | |||
| (24) | |||
| (25) |
where relates to the valley, is eigenvector related to the linear combination of degenerated states at , i.e. .
Consider an interface along -axis at (), and assume a Bloch type evanescent wave solution as with 0, one can get the eigenvector around boundary
| (26) |
which yields the displacement
| (27) | ||||
| (28) |
so that the
| (29) | ||||
| (30) |
Based on the definition of =, we can obtain the SAM density at and sites as
| (31) | ||||
| (32) |
Here we only briefly demonstrate the eigen states of this mass-spring model in connection with our continuum structures. Detailed theory can be found in Ref. Chen et al. (2019) with a similar and fine mass-spring model.
According to above equation, at the interface between the structures with converse topological phases (see Supplementary Fig. 13), both and sites magnify non-zero vibration states, but the circularly polarization direction is opposite between and sites. Note that the sign of determines the propagative direction and circularly polarization direction of and points. When the propagation direction is reversed, the circularly polarization direction of and sites is also reversed. These behaviors of polarization direction are same as the SAM direction of and points in the 3D continuum structures.