ECASS short=ECASS, long=European Cooperative Acute Stroke Study, \DeclareAcronymNCCT short=NCCT, long=non-contrast head CT, \DeclareAcronymDWI short=DWI, long=diffusion-weighted imaging, \DeclareAcronymMRI short=MRI, long=magnetic resonance imaging, \DeclareAcronymnnUNet short=nnUNet, long=No New U-Net, \DeclareAcronymCNN short=CNN, long= Convolutional Neural Network, \DeclareAcronymASPECTS short= ASPECTS, long= Alberta Stroke Program Early CT Score, \DeclareAcronymAVD short= AVD, long= Absolute Volume Difference, \DeclareAcronymVS short= VS, long= Volumetric Similarity, \DeclareAcronymHD 95 short= HD 95, long= Hausdorff Distance 95 percentile, \DeclareAcronymAIS short= AIS, long= Acute Ischemic stroke, \DeclareAcronymAIS-LVO short= AIS-LVO, long= AIS due to large vessel occlusion,
Non-inferiority of Deep Learning Ischemic Stroke Segmentation on Non-Contrast CT Within 16-hours Compared to Expert Neuroradiologists
Abstract
Purpose
To determine if a convolutional neural network (CNN) deep learning model can accurately segment acute ischemic changes on non-contrast CT compared to neuroradiologists.
Materials and Methods
Non-contrast CT (NCCT) examinations from 232 acute ischemic stroke patients who were enrolled in the DEFUSE 3 trial were included in this study. Three experienced neuroradiologists independently segmented hypodensity that reflected the ischemic core on each scan. The neuroradiologist with the most experience (expert A) served as the ground truth for deep learning model training. Two additional neuroradiologists’ (experts B and C) segmentations were used for data testing. The 232 studies were randomly split into training and test sets. The training set was further randomly divided into 5 folds with training and validation sets. A 3-dimensional CNN architecture was trained and optimized to predict the segmentations of expert A from NCCT. The performance of the model was assessed using a set of volume, overlap, and distance metrics using non-inferiority thresholds of 20%, 3ml, and 3mm. The optimized model trained on expert A was compared to test experts B and C. We used a one-sided Wilcoxon signed-rank test to test for the non-inferiority of the model-expert compared to the inter-expert agreement.
Results
The final model performance for the ischemic core segmentation task reached a performance of 0.46±0.09 Surface Dice at Tolerance 5mm and 0.47±0.13 Dice when trained on expert A. Compared to the two test neuroradiologists the model-expert agreement was non-inferior to the inter-expert agreement, .
Conclusion
The CNN accurately delineates the hypodense ischemic core on NCCT in acute ischemic stroke patients with an accuracy comparable to neuroradiologists.
Introduction
AIS is the number one cause of disability and a leading cause of mortality in the United States and worldwide [1, 2]. \acAIS-LVO carries the worst prognosis, but timely endovascular thrombectomy treatment leads to reduced death and disability [3]. AIS-LVO patient treatment decisions are guided by the presence and severity of the acute ischemic core, which is considered to be irreversibly injured [4, 5, 6]. The ischemic core is commonly assessed on computed tomography perfusion and \acDWI \acMRI. However, these imaging techniques are less widely available, and more generalizable means to identify and quantify the ischemic core on \acNCCT are needed. \acNCCT is the most commonly used imaging modality in AIS patients (>65%) given its widespread availability and low cost [7, 8, 9].
Established semi-quantitative methods to assess an ischemic stroke on \acNCCT include the \acECASS 1 and \acASPECTS. \acECASS defined a major infarct as involving more than 1/3 of the middle cerebral artery territory [10], and \acASPECTS evaluates 10 standardized regions within the middle cerebral artery territory and removes one point for the presence of hypodensity within each region. \acAIS-LVO patients with an ASPECTS have been shown to benefit from thrombectomy in multiple studies [11, 12], and, more recently, \acAIS-LVO patients with an \acASPECTS have also been shown to benefit from thrombectomy [13, 14, 15]. ASPECTS is widely used, but it is limited by low reproducibility among raters and correlates only modestly to ischemic lesion volumes and symptom severity [12, 16, 17]. New imaging techniques that can identify and segment the ischemic core on \acNCCT with a more reliable inter-rater agreement would improve patient selection and identify \acAIS-LVO populations in need of further study to improve outcomes.
Supervised deep learning is a promising technique that has been successfully applied in medical image segmentation challenges, such as lesion segmentation on CT perfusion images of the brain [18]. Furthermore, benchmark deep learning models for out-of-the-box segmentation of diverse medical imaging datasets have been developed [19] and sparsely applied to ischemic stroke segmentation [20]. However, the low signal-to-noise ratio and ill-defined borders of the ischemic core on \acNCCT results in segmentation variability between experts [21]. This variability results in difficulty in defining the ground truth and in evaluating deep learning model performance against current segmentation methods (manual segmentation of experts) [22, 23].
We present a deep learning framework and evaluation process specifically designed for segmenting ischemic stroke lesions on \acNCCT scans. This framework allows us to not only compare the model’s segmentation with ground truth segmentation of the test set [20, 24, 25, 26], but to evaluate for non-inferiority when compared to two test experts. In this way, we may show that the model segmentations generalize to experts it was not trained with — measuring to which degree the model is consistent with the ischemic core as a biomarker with inherent variability between experts.
We hypothesized that a deep learning model trained against an experienced neuroradiologist may accurately identify and segment hypodensity that represents the ischemic core on \acNCCT. We also hypothesized that this trained deep learning model would segment the ischemic core non-inferiorly when compared to other neuroradiologists. We tested these hypotheses in \acNCCT studies of \acAIS-LVO patients enrolled in the DEFUSE 3 trial.
Results
Patient characteristics
All randomized (n=146) and non-randomized (n=86) patients from the DEFUSE 3 trial with a baseline \acNCCT study were included. The time from symptom onset to \acNCCT image acquisition (10 (IQR: 8-12)h and 10 (IQR: 9-12)h), and ASPECTS (8 (IQR: 7-9) and 8 (IQR: 7-9)) were similar in the training and test set, respectively. Additional patient characteristics were similar between the training and test set (Table 1).
Ischemic Core Hypodensity Ground Truth Determination
The median volume of the ground truth on \acNCCT as determined by Expert A was 12 (IQR: 5-30)ml in the training set and 13 (IQR: 5-35)ml in the test set. Similar ischemic core volumes were determined by CT perfusion in the training set and in the test set (11 (IQR: 0-39)ml and 12 (IQR: 4-32)ml, respectively).
Evaluation of Model
On the test set, the final model trained on expert A achieved the following performance: Surface Dice at Tolerance 5mm of 0.46 ± 0.09, Dice of 0.47 ± 0.13, and absolute volume difference (AVD) of 7.43 ± 4.31 ml (Table 2, last column). We observed similar performance on the validation sets and present further details of weaker-performing models in supplementary Table LABEL:tab:config).
To put the results of the final model into perspective, the predicted segmentations on the test set were then compared to the test experts B and C.
With the chosen metrics and lower boundaries, the model-expert agreement (model trained on expert A compared to expert B and C) is non-inferior to the inter-expert agreement (expert A compared to expert B and C) (Figure 4). For expert B, the model-expert is better than the inter-expert (Surface Dice at Tolerance of 5mm 0.63± 0.16 vs. 0.54 ±0.09, Dice 0.56 ±0.18 vs. 0.47 ±0.16). For expert C, the model-expert and inter-expert are similar and within the testing boundary (Table 2).
In addition, the volumetric inter-expert and model-expert agreements are visualized with scatter plots in Fig. 1 with Spearman Correlation Coefficient (R). The correlation between the predicted volumes of the model and the test expert is higher than that between experts (R=0.75 vs. R=0.74 for expert B (top row, blue lines), R=0.79 vs. R=0.63 for expert C (bottom row, yellow lines).
Fig. 2 displays a qualitative comparison of the model’s prediction, comparing annotations by experts A, B and C in two patients with different image quality. The model prediction visually agrees with the training expert A (ground truth) as well as with the test experts B and C.
Analyses on models that are trained on each of the other experts can be found in the Supplementary Tables LABEL:tab:comparison_test_C, LABEL:tab:comparison_test_B.
Discussion
In this study, a 3D \acCNN segmented the hypodense ischemic core on \acNCCT in a manner that was non-inferior compared to expert neuroradiologists. Our results are notable because the segmentation of acute ischemic stroke is a challenging task compared to less complex tasks in which deep learning methods have shown promise[27].
In addition, the non-inferiority of the model across comparisons to multiple different expert neuroradiologists suggests that our results are generally applicable to the identification and quantification of the ischemic core on NCCT, and not limited to the emulation of any particular clinician.
These results have important implications for the care of patients with \acAIS-LVO.
Segmentation of the ischemic core on NCCT is challenging and suffers from high inter-expert variability. This variability results in significant difficulty in ischemic core segmentation and in the definition of a gold standard. Our results have important implications for artificial intelligence approaches to detect and quantify ischemic brain injury on \acNCCT.
The detection of cerebral ischemia and the ischemic core differs between commonly used imaging modalities, such as \acMRI (\acDWI), \acNCCT, and CT perfusion. This variability may result in differences in an imaging modality’s ability to detect and localize the ischemic core. The sensitivity of \acNCCT for cerebral ischemia detection may be as low as 30% [28, 29]. This variability hampers consistent evaluation of deep learning models and integration in clinical practice.
In order to create an optimal ground truth, prior work created a hypodense ischemic core lesion on \acNCCT from healthy patients by co-registering ischemic core lesions from DWI studies of acute ischemic stroke patients [30]. Other studies have also chosen DWI lesions as ground truth and co-registered to \acNCCT images from the same patient [26, 31]. However, very few centers have large databases of patients with NCCT and DWI acquired within short time intervals to facilitate the development of CNN that uses the ischemic core on DWI as the ground truth. In addition, diffusion restriction is a unique phenomenon of DWI, especially in earlier time windows (h) where cytotoxic edema is the predominant abnormality that is imaged [32]. Hypodensity on \acNCCT is generally felt to largely reflect vasogenic edema, which normally develops h after stroke onset [33] suggesting irreversibly damaged brain tissue (ischemic core). We chose the ground truth segmentation based on the human reader with the most experience among expert neuroradiologists. Compared to related research, we report advancements in model development (Supplementary Table LABEL:tab:nnUNetModifications). We show significant non-inferiority through a comprehensive statistical analysis incorporating multiple performance metrics [20].
Cell death in ischemic stroke is time-sensitive and happens on a continuous temporal scale, which results in a very difficult segmentation task even for experienced neuroradiologists in \acAIS-LVO patients. The CNN developed in this study demonstrated strong performance in the delineation of the ischemic core across multiple expert neuroradiologists, which suggests that this approach is likely to be generalizable in \acAIS-LVO patients. Future studies should test this hypothesis. In addition, our results have the potential to increase the consistency and quality of stroke assessment on NCCT in the emergency setting across hospitals where expert neuroradiologists might not be always available.
This study has limitations. First, the dataset originates from the DEFUSE 3 trial that randomized stroke patients presented within 6-16 hours.However, to diversify we also included non-randomized patients who did not meet the inclusion criteria (Table 1). Second, we included the manual segmentation of three experts. Since the concept of absolutely correct ground truth core segmentation ischemic stroke is not well-defined, more experts might be necessary for more accurate validation of results[21].
Conclusion
A CNN was non-inferior to expert neuroradiologists for the segmentation of the hypodense ischemic core on NCCT.
Methods
Study Design and Data
This post-hoc analysis of the DEFUSE 3 trial included 232 AIS-LVO patients with NCCT who were either enrolled in the study or screened but not enrolled [5]. This multi-center (38 U.S. centers with obtained IRB approval) trial investigated thrombectomy eligibility for patients with acute ischemic stroke with an onset time within 6-16 hours (https://clinicaltrials.gov/ct2/show/NCT02586415). The patient cohort includes patients that met the inclusion criteria (symptom onset within 6-16h, anterior circulation, NIHSS 6) and patients that were excluded from randomization because of exclusion criteria (no LVO, within 6h of symptom onset). Further scanning parameters and details of the patient cohort are described in the original publication of the DEFUSE 3 trial [5]. All patients or their legally authorized representatives provided informed consent. Institutional review board approval from the Administrative Panel on Human Subjects in Medical Research at Stanford University was obtained for this study. All methods were performed in accordance with the relevant guidelines and regulations.
Ischemic Core Hypodensity Ground Truth Determination
Three experienced neuroradiologists from the USA and Belgium with 4, 4, and 9 years of clinical experience post-fellowship in diagnostic neuroradiology were instructed to outline abnormal hypodensity on the \acNCCT that was consistent with acute ischemic stroke within 6-16 hours of symptom onset. Segmentation was performed with the drawing tool in Horos (Horosproject.org, version 4.0.0). Experts had the option to not segment any tissue if no abnormal hypodensity was appreciated. Experts were blinded to all imaging other than the NCCT. For detailed instructions see the original instruction sheet (Supplementary Fig.LABEL:fig:instructions).
Data Preparation and Partitions
The \acNCCT image and corresponding manual segmentation mask were resized to a common resolution of 22-56 x 512 x 512, resampled, and normalized using an existing preprocessing pipeline [19]. A mirrored rigid co-registered version of each input image was computed using SimpleITK to provide the model with symmetry information of the opposite hemisphere (https://simpleitk.org/) [30]. Data augmentation was performed with the python package "batchgenerators" (version 2.0.0) including rotation, random cropping, gamma transformation, flipping, scaling, brightness adjustments, and elastic deformation [19].
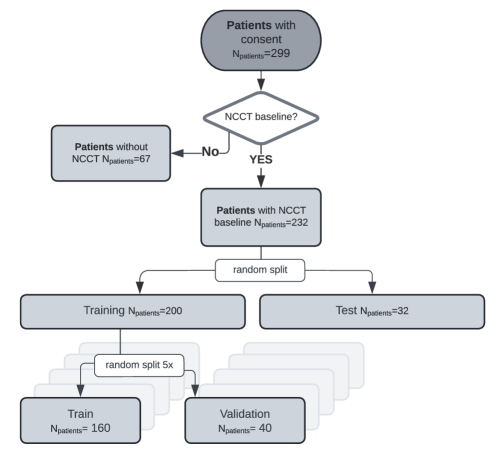
The data was divided into three steps. First, the experts were divided into training (expert A, ground truth) and test experts (experts B and C) by the amount of experience to approximate the most accurate ground truth for the model. Second, the cohort of 232 patients was randomly partitioned into 200 training and 32 test patients. Third, the training set was further split into five folds for cross-validation, with 160 patients for the training and 40 for the validation. Optimized model configurations were selected based on the result of fold 1 and further validated on folds 2 to 5 (Figure 3, Table LABEL:tab:config). The highest-performing model from the 5-fold cross-validation, based on the Surface Dice at Tolerance at 5mm, was then evaluated on the test set.
Model Architecture and Training
A nnUNet was trained on the NCCTs with manual segmentations of the training expert A as reference annotations (Pytorch 1.11.0, Python 3.8, cuda 11.3). The model’s input comprised a brain NCCT, along with an NCCT of the same patient. In the latter scan, the ipsilateral hemisphere is replaced by a mirrored version of the contralateral hemisphere. The output of the model was a segmentation mask [19]. The final nnUNet configuration includes a patch size of 28x256x256 and spacing of (3.00, 0.45, 0.45), 7 stages with two convolutional layers per stage, leaky ReLU as an activation function, Soft Dice + Focal [34] loss functions with equal weights, alpha of 0.5 and gamma of 2, a batch size of 2, stochastic gradient descent optimizer and He initialization (Supplementary Figure LABEL:fig:archi). We empirically set the epoch number to 350. In addition, we applied further regularization techniques such as L2 regularization, a dropout of 0.1, and a momentum of 0.85. Data augmentation included rotation, random crop, re-scaling, elastic transformation, and flipping. Please see supplementary Table LABEL:tab:nnUNetModifications for a detailed discussion and analysis of technical procedures.
Metrics
The models were evaluated using a set of volume, overlap and distance metrics (for definitions see Supplementary Table LABEL:table:metric_definition):
-
•
Volume-based metrics (\acVS and \acAVD [ml])
-
•
Overlap metrics (Dice, Precision, and Recall), and
-
•
Distance metrics (\acHD 95 [mm], Surface Dice at Tolerance of 5mm).
The best configuration choice was chosen based on the ‘Surface Dice at Tolerance’ with a tolerance of 5mm.
The Surface Dice at Tolerance, also known as the Normalized Surface Dice, quantifies the separation between individual surface voxels in the reference and predicted masks. The tolerance establishes the maximum acceptable distance for surface voxels in the reference and predicted masks to be classified as true positive voxels. This metric is especially useful if there is more variability in the outer compared to the inner border, as is the case for ischemic stroke segmentation [35, 36, 37]. In this work, we chose the tolerance to be 5mm based on the average surface distance between experts.
Statistical Analysis
R (Version 2022.02.3) was used for statistical analysis. To evaluate the model performance for generalizability on unseen data, we measure to which degree the model segmentation on the test set is consistent with the ischemic core as a biomarker inherent to the variability between experts. For that, we compare the model segmentation against the test experts B and C (Figure 4). We used each metric to evaluate how close the model segmentations were to the test experts.
We used the one-sided Wilcoxon rank sign test ( = 0.05, n=32) of the median metric values upon a negative Shapiro test for normality. We chose the following non-inferior boundaries:
-
•
for relative metrics with values between 0 and 1: The model-expert agreement is no worse than 20% of the metric range compared to the inter-expert agreement.
-
•
\ac
AVD: The model-expert absolute volume difference is at most 3 ml larger compared to the inter-expert agreement.
-
•
\ac
HD 95: The model-expert maximum distance is at most 3mm larger compared to the inter-expert agreement.
We chose these boundaries based on the average difference in inter-expert agreements as a measure for variability (for metrics with a range of 0 to 1: 0.19, for metrics with SI Units: 2.53. This identifies whether model performance is comparable, within the normal bounds of variation, to experienced neuroradiologists [24]. This implies that the difference between the model-expert and inter-expert agreement is tested for being smaller than the average difference variability of agreement among experts to reach non-inferiority.
All p-values were adjusted for the total number of statistical tests presented in the paper using the Holm-Bonferroni method. The significant threshold is p0.05.
We report statistical analysis on the test set.
Code and Data Availability
To facilitate future studies, we have made the model evaluator tool and statistical tool freely available on GitHub (https://github.com/SophieOstmeier/UncertainSmallEmpty
and https://github.com/SophieOstmeier/StrokeAnalyzer).
The data set will be made available upon reasonable request. Please contact the corresponding author (Jeremy Heit).
References
- [1] Global, regional, and national burden of stroke and its risk factors, 1990-2019: a systematic analysis for the global burden of disease study 2019. \JournalTitleLancet Neurol 20, 795–820, DOI: 10.1016/s1474-4422(21)00252-0 (2021).
- [2] Lakomkin, N. et al. Prevalence of large vessel occlusion in patients presenting with acute ischemic stroke: a 10-year systematic review of the literature. \JournalTitleJournal of NeuroInterventional Surgery 11, 241–245, DOI: 10.1136/neurintsurg-2018-014239 (2019).
- [3] Campbell, B. C. et al. Endovascular thrombectomy for ischemic stroke increases disability-free survival, quality of life, and life expectancy and reduces cost. \JournalTitleFrontiers in Neurology 657 (2017).
- [4] Powers, W. J. et al. 2018 guidelines for the early management of patients with acute ischemic stroke: a guideline for healthcare professionals from the American Heart Association and American Stroke Association. \JournalTitleStroke 49, e46–e99 (2018).
- [5] Albers, G. W. et al. Thrombectomy for stroke at 6 to 16 hours with selection by perfusion imaging. \JournalTitleNew England Journal of Medicine 378, 708–718, DOI: 10.1056/NEJMoa1713973 (2018).
- [6] Nogueira, R. G. et al. Thrombectomy 6 to 24 hours after stroke with a mismatch between deficit and infarct. \JournalTitleNew England Journal of Medicine 378, 11–21, DOI: 10.1056/NEJMoa1706442 (2017).
- [7] Kim, Y. et al. Utilization and availability of advanced imaging in patients with acute ischemic stroke. \JournalTitleCirc Cardiovasc Qual Outcomes 14, e006989, DOI: 10.1161/CIRCOUTCOMES.120.006989 (2021).
- [8] McDonough, R., Ospel, J. & Goyal, M. State of the art stroke imaging: a current perspective. \JournalTitleCan Assoc Radiol J 8465371211028823, DOI: 10.1177/08465371211028823 (2021).
- [9] Alexandrov, A. W. & Fassbender, K. Triage based on preclinical scores-low-cost strategy for accelerating time to thrombectomy. \JournalTitleJAMA Neurol 77, 681–682, DOI: 10.1001/jamaneurol.2020.0113 (2020).
- [10] Hacke, W. et al. Intravenous thrombolysis with recombinant tissue plasminogen activator for acute hemispheric stroke: the European Cooperative Acute Stroke Study (ECASS). \JournalTitleJama 274, 1017–1025 (1995).
- [11] Jovin, T. G. et al. Thrombectomy within 8 hours after symptom onset in ischemic stroke. \JournalTitleNew England Journal of Medicine 372, 2296–2306 (2015).
- [12] Goyal, M. et al. Endovascular thrombectomy after large-vessel ischaemic stroke: a meta-analysis of individual patient data from five randomised trials. \JournalTitleThe Lancet 387, 1723–1731 (2016).
- [13] Huo, X. et al. Trial of endovascular therapy for acute ischemic stroke with large infarct. \JournalTitleNew England Journal of Medicine null (2023).
- [14] Sarraj, A. et al. Trial of endovascular thrombectomy for large ischemic strokes. \JournalTitleNew England Journal of Medicine DOI: 10.1056/NEJMoa2214403.
- [15] Yoshimura, S. et al. Endovascular therapy for acute stroke with a large ischemic region. \JournalTitleNew England Journal of Medicine 386, 1303–1313 (2022).
- [16] Barber, P. A., Demchuk, A. M., Zhang, J. & Buchan, A. M. Validity and reliability of a quantitative computed tomography score in predicting outcome of hyperacute stroke before thrombolytic therapy. \JournalTitleThe Lancet 355, 1670–1674 (2000). Doi: 10.1016/S0140-6736(00)02237-6.
- [17] Schroeder, J. & Thomalla, G. A Critical Review of Alberta Stroke Program Early CT Score for Evaluation of Acute Stroke Imaging. \JournalTitleFrontiers in Neurology 7, DOI: 10.3389/fneur.2016.00245 (2017).
- [18] Hakim, A. et al. Predicting infarct core from computed tomography perfusion in acute ischemia with machine learning: Lessons from the ISLES challenge. \JournalTitleStroke 52, 2328–2337 (2021).
- [19] Isensee, F., Jaeger, P. F., Kohl, S. A. A., Petersen, J. & Maier-Hein, K. H. nnu-net: a self-configuring method for deep learning-based biomedical image segmentation. \JournalTitleNat Methods 18, 203–211, DOI: 10.1038/s41592-020-01008-z (2021). Isensee, Fabian Jaeger, Paul F Kohl, Simon A A Petersen, Jens Maier-Hein, Klaus H eng Research Support, Non-U.S. Gov’t 2020/12/09 Nat Methods. 2021 Feb;18(2):203-211. doi: 10.1038/s41592-020-01008-z. Epub 2020 Dec 7.
- [20] El-Hariri, H. et al. Evaluating nnU-Net for early ischemic change segmentation on non-contrast computed tomography in patients with acute ischemic stroke. \JournalTitleComputers in biology and medicine 141, 105033 (2022).
- [21] Goyal, M. et al. Challenging the ischemic core concept in acute ischemic stroke imaging. \JournalTitleStroke 51, 3147–3155 (2020).
- [22] Lampert, T. A., Stumpf, A. & Gançarski, P. An empirical study into annotator agreement, ground truth estimation, and algorithm evaluation. \JournalTitleIEEE Transactions on Image Processing 25, 2557–2572, DOI: 10.1109/TIP.2016.2544703 (2016).
- [23] Warfield, S. K., Zou, K. H. & Wells, W. M. Validation of image segmentation by estimating rater bias and variance. \JournalTitlePhilosophical Transactions of the Royal Society A: Mathematical, Physical and Engineering Sciences 366, 2361–2375 (2008).
- [24] Hirsch, L. et al. Radiologist-level performance by using deep learning for segmentation of breast cancers on mri scans. \JournalTitleRadiology: Artificial Intelligence 4, e200231 (2021).
- [25] Liu, C.-F. et al. Deep learning-based detection and segmentation of diffusion abnormalities in acute ischemic stroke. \JournalTitleCommunications Medicine 1, 61, DOI: 10.1038/s43856-021-00062-8 (2021).
- [26] Kuang, H., Menon, B. K., Sohn, S. I. L. & Qiu, W. EIS-Net: Segmenting early infarct and scoring ASPECTS simultaneously on non-contrast CT of patients with acute ischemic stroke. \JournalTitleMedical Image Analysis 70, 101984, DOI: https://doi.org/10.1016/j.media.2021.101984 (2021).
- [27] Havaei, M. et al. Brain tumor segmentation with deep neural networks. \JournalTitleMedical image analysis 35, 18–31 (2017).
- [28] Cereda, C. W. et al. A benchmarking tool to evaluate computer tomography perfusion infarct core predictions against DWI standard. \JournalTitleJournal of Cerebral Blood Flow & Metabolism 36, 1780–1789 (2016).
- [29] Lansberg, M. G., Albers, G. W., Beaulieu, C. & Marks, M. P. Comparison of diffusion-weighted MRI and CT in acute stroke. \JournalTitleNeurology 54, 1557–1561 (2000).
- [30] Christensen, S. et al. Optimizing Deep Learning Algorithms for Segmentation of Acute Infarcts on Non-Contrast Material-enhanced CT Scans of the Brain Using Simulated Lesions. \JournalTitleRadiol Artif Intell 3, DOI: 10.1148/ryai.2021200127 (2021).
- [31] Qiu, W. et al. Machine Learning for Detecting Early Infarction in Acute Stroke with Non-Contrast-enhanced CT. \JournalTitleRadiology 294, 638–644 (2020).
- [32] Albers, G. W. Diffusion-weighted MRI for evaluation of acute stroke. \JournalTitleNeurology 51, S47–S49 (1998).
- [33] Almandoz, J. E. D., Pomerantz, S. R., González, R. G. & Lev, M. H. Imaging of acute ischemic stroke: Unenhanced computed tomography. \JournalTitleAcute Ischemic Stroke 43–56 (2011).
- [34] Lin, T.-Y., Goyal, P., Girshick, R., He, K. & Dollár, P. Focal loss for dense object detection. In Proceedings of the IEEE international conference on computer vision, 2980–2988 (2017).
- [35] Nikolov, S. et al. Deep learning to achieve clinically applicable segmentation of head and neck anatomy for radiotherapy. \JournalTitlearXiv preprint arXiv:1809.04430 (2018).
- [36] Maier-Hein, L. et al. Metrics reloaded: Pitfalls and recommendations for image analysis validation. \JournalTitlearXiv preprint arXiv:2206.01653 (2022).
- [37] Ostmeier, S. et al. USE-Evaluator: Performance metrics for medical image segmentation models supervised by uncertain, small or empty reference annotations in neuroimaging. \JournalTitleMedical Image Analysis 102927 (2023).
Author contributions statement
Guarantors of the integrity of the entire study, S.O., J.J.H.; study concepts/study design or data acquisition or data analysis/interpretation, all authors; manuscript drafting or manuscript revision for important intellectual content, all authors; approval of final version of submitted manuscript, all authors; literature research, S.O., J.J.H.; clinical studies, S.O., J.J.H.; statistical analysis, S.O., B.A.; and manuscript editing, S.O., B.A., S.C., J.L., G.Z., J.J.H.
Competing Interest
Sophie Ostmeier: none
Brian Axelrod: none
Benjamin F.J. Verhaaren: none
Soren Christensen: none
Abdelkader Mahammedi: none
Yongkai Liu: none
Benjamin Pulli: none
Li-Jia Li: none
Greg Zaharchuk: co-founder, equity of Subtle Medical, funding support GE Healthcare, consultant Biogen
Jeremy J. Heit: Consultant for Medtronic and MicroVention, Member of the medical and scientific advisory board for iSchemaView
from the DEFUSE 3 dataset
| Categories | Characteristic | Train | Test | ||||
|---|---|---|---|---|---|---|---|
| Randomized | Non- | Total | Randomized | Non- | Total | ||
| randomized | randomized | ||||||
| General | Total Number | 129 | 71 | 200 | 17 | 15 | 32 |
| Age, yrs | 69 (58-78) | 68 (59-80) | 68 (59-78) | 75 (72-84) | 64 (58-68) | 71 (62-80) | |
| Female % | 52 | 53 | 51 | 50 | 47 | 53 | |
| Imaging Characteristics | Expert A Volume [ml] (ground truth) | 9 (4-23) | 20 (5-69) | 12 (5-30) | 9 (3-18) | 23 (7-57) | 13 (5-35) |
| Expert B Volume [ml] | 15 (8-31) | 15 (2-70) | 15 (6-39) | 10 (5-18) | 25 (9-49) | 14 (6-47) | |
| Expert C Volume [ml] | 3 (1-6) | 4 (0-35) | 3 (0-9) | 2 (0-5) | 1 (0-35) | 2 (0-9) | |
| Ischemic Core Volume [ml] | 10 (2-29) | 15 (0-84) | 11 (0-39) | 8 (4-15) | 20 (5-46) | 12 (4-32) | |
| Tmax6 Volume [ml] | 117 (78-158) | 69 (0-170) | 104 (61-158) | 121 (89-154) | 74 (53-126) | 104 (63-144) | |
| ASPECTS on Baseline CT | 8 (7-9) | 8 (5-10) | 8 (7-9) | 8 (7-9) | 8 (6-10) | 8 (7-9) | |
| Known Occlusion Site, MCA | 54 | 26 | 80 | 4 | 3 | 7 | |
| Known Occlusion Site, ICA | 77 | 20 | 97 | 13 | 5 | 18 | |
| Process | Witnessed, n | 44 | N/A 6 | 44 | 6 | N/A 6 | 6 |
| Wake-Up, n | 68 | N/A 6 | 68 | 9 | N/A 6 | 9 | |
| Unwitnessed, n | 17 | N/A 6 | 17 | 2 | N/A 6 | 2 | |
| Onset to Image Time [h] | 10 (8-12) | N/A 6 | 10 (8-12) | 10 (9-12) | N/A 6 | 10 (9-12) | |
| Follow-Up | 24h DWI, n | 129 | N/A 6 | 129 | 17 | N/A 6 | 17 |
| 24h DWI Volume [ml] | 40 (23-111) | N/A 6 | 40 (23-111) | 33 (27-66) | N/A 6 | 33 (27-66) | |
| Clinical Outcome | mRS at Baseline | 0 (0-0) | N/A 6 | 0 (0-0) | 0 (0-0) | N/A 6 | 0 (0-0) |
| mRS at 90 days | 4 (2-5) | N/A 6 | 4 (2-5) | 4 (2-5) | N/A 6 | 4 (2-5) | |
1 Median (1st - 3rd quantile), if not otherwise indicated, 2 Alberta Stroke Program Early CT Score, 3 Time-to-Maximum after 6 seconds, 4 ground truth during training, 5 modified ranking scale, 6 data for non-randomized patients not available
| Categories | Metric 1 | Expert B | Expert C | Expert A | |||||||||
|---|---|---|---|---|---|---|---|---|---|---|---|---|---|
| Inter-Expert2 | Model-Expert2 | p-value3 for | Inter-Expert2 | Model-Expert2 | p-value3 for | Model-Expert2 | |||||||
| (B to A) | (B to Model) | non-inferiority | (C to A) | (C to Model) | non-inferiority | (A to Model) | |||||||
| Volume | VS | 0.66 | ± 0.1 | 0.81 | ± 0.1 | p0.001 | 0.64 | ± 0.3 | 0.51 | ± 0.3 | p0.01 | 0.67 | ± 0.14 |
| AVD [ml] | 8.40 | ± 5.25 | 7.11 | ± 4.81 | non-sig | 7.28 | ± 4.96 | 5.99 | ± 2.24 | p0.05 | 7.43 | ± 4.31 | |
| Overlap | Dice | 0.47 | ± 0.16 | 0.56 | ± 0.18 | p0.0001 | 0.25 | ± 0.15 | 0.36 | ± 0.15 | p0.0001 | 0.47 | ± 0.13 |
| Precision | 0.49 | ± 0.26 | 0.52 | ± 0.18 | p0.0001 | 0.64 | ± 0.16 | 0.77 | ± 0.15 | p0.001 | 0.58 | ± 0.26 | |
| Recall | 0.59 | ± 0.18 | 0.73 | ± 0.16 | p0.0001 | 0.17 | ± 0.15 | 0.26 | ± 0.14 | p0.0001 | 0.52 | ± 0.15 | |
| Distance | HD 95 [mm] | 15.89 | ± 5.02 | 12.39 | ± 3.78 | non-sig | 21.97 | ± 7.36 | 18.13 | ± 7.03 | non-sig | 18.04 | ± 9.21 |
| SDT 5mm | 0.54 | ± 0.09 | 0.63 | ± 0.16 | p0.0001 | 0.31 | ± 0.14 | 0.31 | ± 0.18 | p0.0001 | 0.46 | ± 0.09 | |
1 VS = Volumetric Similarity, AVD = Absolute Volume Difference, HD 95 = Hausdorff Distance 95th percentile, SDT = Surface Dice at Tolerance 5mm
2 Median 95% CI (bootstrapped)
3 p-values of one-sided Wilcoxon sign rank test
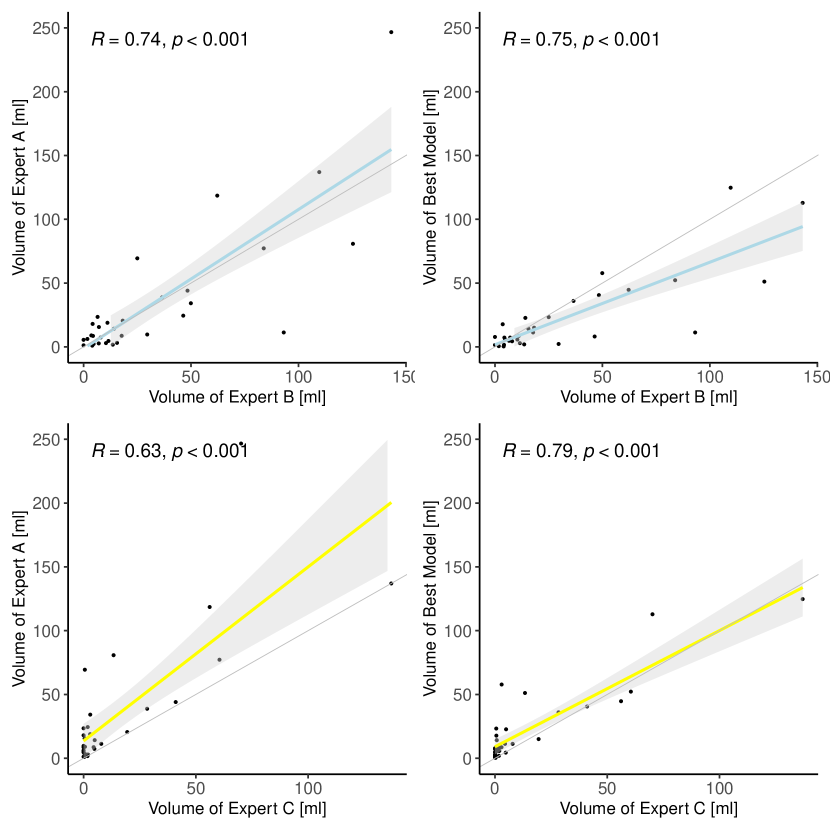
Top row: Top row: Inter-Expert and Model-Expert Agreement for expert B, Bottom row: Top row: Inter-Expert and Model-Expert Agreement for expert C, R= Spearman’s Correlation Coefficient, Gray Area = 95% confidence region, Black dots = individual data points. The gray areas are smaller in the model-expert comparisons (rightmost column) indicating a lower variance for the predicted volumes.
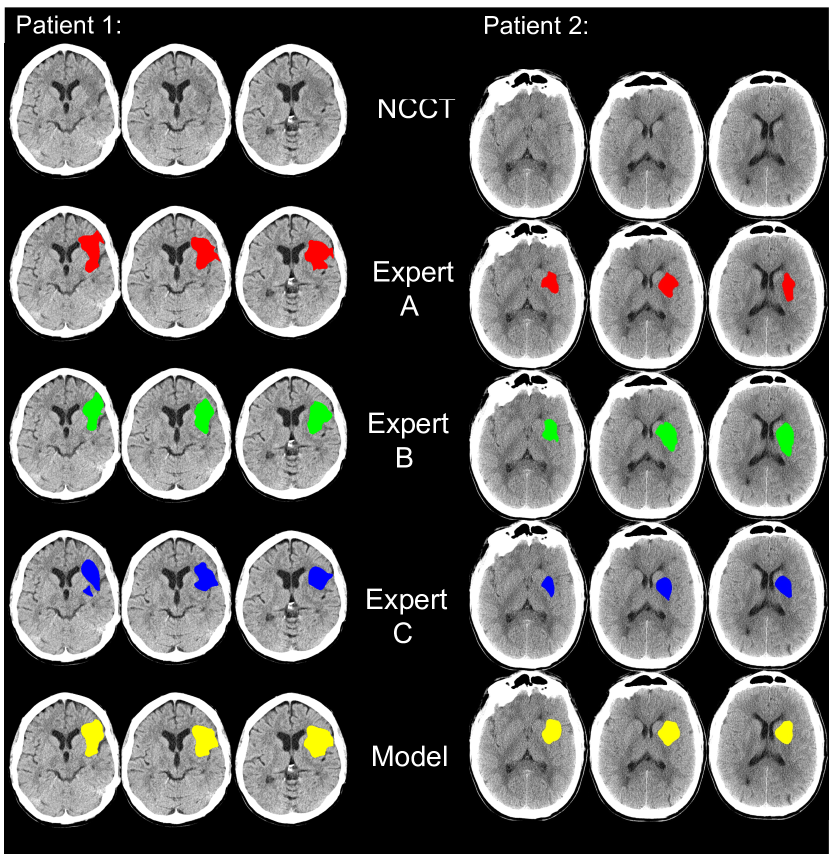
Patient 1 (left): higher quality NCCT Patient 2 (right): lower quality NCCT. Experts A, B, and C agree on the location and volume of the stroke. The model prediction (last row) agrees as well with the test experts B and C as with the training expert A .
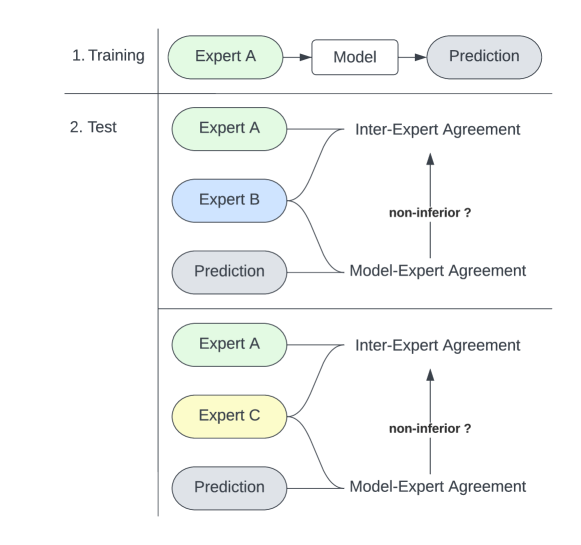
1. Training: A model was trained on training expert A (please see supplementary information for training on experts B and C).
2. Test: The prediction of the model was compared to test experts B and C and tested for non-inferiority.