*latexMarginpar on page 0 moved
\PHyear2022 \PHnumber266 \PHdate28 November \ShortTitleMultiplicity dependence of charged-particle production at the LHC \CollaborationALICE Collaboration††thanks: See Appendix LABEL:app:collab for the list of collaboration members \ShortAuthorALICE Collaboration
Multiplicity () distributions and transverse momentum () spectra of inclusive primary charged particles in the kinematic range of and are reported for pp, p==Pb, Xe==Xe and Pb==Pb collisions at centre-of-mass energies per nucleon pair ranging from up to . A sequential two-dimensional unfolding procedure is used to extract the correlation between the transverse momentum of primary charged particles and the charged-particle multiplicity of the corresponding collision. This correlation sharply characterises important features of the final state of a collision and, therefore, can be used as a stringent test of theoretical models. The multiplicity distributions as well as the mean and standard deviation derived from the spectra are compared to state-of-the-art model predictions. Providing these fundamental observables of bulk particle production consistently across a wide range of collision energies and system sizes can serve as an important input for tuning Monte Carlo event generators.
1 Introduction
In high-energy nucleus–nucleus (AA) collisions, a hot and dense state of deconfined strongly-interacting matter, commonly denoted as the quark–gluon plasma, is formed [Busza:2018rrf]. This system undergoes hydrodynamic evolution [Heinz:2013th, Bernhard:2016tnd, Gardim:2019xjs] and exhibits hadron yields indicating chemical equilibrium [Andronic:2017pug, BraunMunzinger:2003zd]. At low to intermediate transverse momentum (), up to about a few , charged-particle production is influenced by the collective expansion (flow) of the system, reflected in the shapes of single-particle transverse-momentum spectra [Adam:2016tre, ALICE:2018vuu] and multi-particle correlations [Heinz:2013th]. It came as a major surprise that even small collision systems such as proton–proton (pp) and proton–nucleus (pA) collisions at Large Hadron Collider (LHC) energies exhibit features that can be attributed to collective expansion [Adam:2016dau, ABELEV:2013wsa, Khachatryan:2014jra, Chatrchyan:2013nka, Khachatryan:2015waa, Aad:2013fja, Dusling:2013oia, Blok:2017pui, Schenke:2021mxx].
Multi-particle correlations measured in all collision systems, contain an imprint of the initial state of the colliding partners, characterised via their quark and gluon degrees of freedom, allowing the extraction of fundamental properties of the quark–gluon plasma [Bernhard:2016tnd, Bernhard:2019bmu, Gardim:2019xjs]. Hydrodynamic-like (final-state) collective flow is increasingly part of the modelling of small collision systems [Moreland:2018gsh, Schenke:2020mbo] in an interplay with initial-state phenomena (see reviews in Refs. [Dusling:2015gta, Schenke:2021mxx]). Such collision systems are usually modelled in the framework of the colour glass condensate (CGC) [McLerran:2013una], where multi-particle production proceeds via the decay of colour flux tubes that stretch between two colliding hadrons in the longitudinal direction and are coherent in the transverse direction over a range that is inversely proportional to a saturation scale , which appears due to the non-linearity of parton evolution at high energies.
In the PYTHIA8 event generator [Sjostrand:2014zea], which describes a broad range of observables in pp collisions, the initial state is determined by parton distribution functions extracted from measurements. With increasing collision energy, the role of multi-parton interactions, i.e., when two or more distinct (hard) parton interactions occur within a pp collision, becomes more and more important [Skands:2010ak]. The respective colour strings may cut each other or reconnect, which leads to a redistribution of energy from particle production to transverse momentum, and, therefore, a smaller number of particles but with higher average . A phenomenon recently implemented in PYTHIA is the interaction between transversely-extended colour strings, exerting pressure on each other [Bierlich:2017vhg]. This produces effects similar to those resulting from final-state collective dynamics, akin to that of a long-lived quark–gluon medium. Recently, PYTHIA8 was extended with the Angantyr model for heavy-ion collisions [Bierlich:2018xfw], which uses a Glauber-based initial-state modelling with Gribov colour fluctuations to determine the number of pp sub-collisions. In current PYTHIA8 implementations with the Angantyr model, there is no colour reconnection between individual pp sub-collisions but between the multiple partonic interactions of the pp sub-collisions.
A broad range of observables is also described successfully in the EPOS family Monte Carlo (MC) event generators [Drescher:2000ha]. The initial state is realised in EPOS through a parton-based Gribov-Regge theory [Drescher:2000ha] which is a multiple scattering framework, recently augmented with the treatment of saturation effects [Werner:2019aqa]. While in EPOS3 [Werner:2013tya], a full hydrodynamic evolution is included for the final state, in EPOS LHC [Pierog:2013ria] a parameterised hydrodynamic component of a small volume with high density of thermalised matter is used together with a dilute region, i.e. a core plus corona implementation. In both PYTHIA8 and EPOS LHC models, the respective parameters are tuned using the Run 1 data at the LHC [Skands:2014pea, Pierog:2013ria].
The mean transverse momentum, , of the charged-particle spectrum and its correlation with the charged-particle multiplicity carry essential information on the underlying particle production mechanism. This has been studied by many experiments at hadron colliders in pp() covering centre-of-mass energies from up to 13 [Arnison:1982ed, ABCDHW, Albajar:1989an, PhysRevLett.60.1622, Adams:2006xb, Aaltonen:2009ne, Aamodt:2010my, Khachatryan:2010nk, Aad:2010ac, Adam:2015pza] as well as in Xe==Xe [Acharya:2018eaq] and Pb==Pb [ALICE:2018vuu] collisions at and 5.02, respectively. All experiments observed an increase of with in the central rapidity region, explained in the PYTHIA approach as a consequence of non-trivial colour reconnections (see discussion in Ref. [Christiansen_2015]). While in the CGC approach is a universal function of the ratio of the charged-particle multiplicity to the transverse area of the collision [McLerran:2014apa], in the EPOS LHC model it is determined by the collective expansion [Pierog:2013ria]. For all collision systems, the correlation is a basic observable for tuning or calibrating the theoretical models [Moreland:2018gsh], a simple observable which allows extracting fundamental properties of a deconfined quark–gluon medium [Gardim:2019xjs].
As bulk production at the LHC is driven by a complex interplay of soft and hard QCD processes, the endeavour to find a consistent model description for particle production in all collision systems has not been concluded yet. At the LHC, a large amount of data was recorded in Run 1 and Run 2, covering different collision systems from pp to heavy-ion collisions at various centre-of-mass energies, which allows a detailed study of particle production over a wide range of charged-particle multiplicity. This Letter presents a measurement of the charged-particle multiplicity distributions and the corresponding transverse momentum spectra as a function of in pp, p==Pb, Xe==Xe and Pb==Pb collisions at centre-of-mass energies per nucleon pair ranging from up to 13. From these spectra, the mean and standard deviation within are extracted. The comprehensive set of measurements presented in this Letter can serve as a high-precision input for tuning phenomenological models towards the goal of understanding particle production in the non-perturbative regime of QCD and its transition to the perturbative regime.
2 Experimental setup
The measurements reported in this Letter were obtained with ALICE at the Large Hadron Collider. In the following, the detectors relevant for this work are discussed briefly. A more detailed description of the ALICE apparatus in its configurations of LHC Run 1 and Run 2 can be found in Refs. [ALICE:2008ngc, AlicePerf2014].
The present analysis is based on tracking information from the Inner Tracking System (ITS) [Aamodt:2010aa] and the Time Projection Chamber (TPC) [Alme:2010ke]. Both detectors are located within a large solenoidal magnet which provides a nominal field strength of 0.5 T for all of the data taking periods analysed in this work, except for the Xe==Xe data taking, where the magnetic field was reduced to 0.2 T in order to extend the kinematic acceptance of the detector to lower transverse momentum. The ITS is comprised of six cylindrical layers of silicon detectors with radii between 3.9 cm and 43 cm. Its two innermost layers are equipped with silicon pixel detectors (SPD), the two intermediate layers consist of silicon drift detectors (SDD), and the two outermost layers are made of double-sided silicon strip detectors (SSD). The large cylindrical TPC has an active radial range from about 85 cm to 250 cm and an overall length along the beam direction of about 500 cm. It covers the full azimuth in the pseudorapidity range and provides track reconstruction with up to 159 space points along the trajectory of a charged particle as well as particle identification via the measurement of specific energy loss .
The V0 detector, which consists of two scintillator arrays covering the pseudorapidity ranges of (V0A) and (V0C), is used for triggering on hadronic collisions and multiplicity measurements at forward rapidity [ALICE:2018cpu, ALICE:2018vuu]. Contamination from electromagnetic interactions in Pb==Pb and Xe==Xe collisions was strongly suppressed using signals from two neutron-Zero-Degree Calorimeters (ZDC), positioned on both sides of the interaction point at 114.0 m distance, see [AlicePerf2014] for details.
3 Analysis procedure
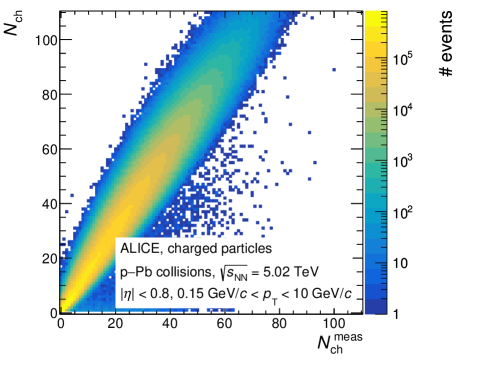
This analysis aims to obtain the correlation between primary charged-particle spectra and their corresponding event multiplicities , both defined consistently in the kinematic range and . This kinematic selection ensures optimal momentum resolution and homogeneous tracking efficiency over the entire range. In addition, the multiplicity distributions for events are reported. For each collision, the number of reconstructed tracks selected for the analysis provides an experimental measure () for its multiplicity. Due to detector acceptance and reconstruction efficiency, this measured track multiplicity is different from the actual number of primary charged particles () produced in the kinematic region under study. Secondary particles from weak decays or from interactions with the detector material as well as tracks that are smeared into the acceptance (i.e. from and ) remaining in the sample of selected tracks further contribute to the measured spectra and consequently to the measured track multiplicity. The event-by-event fluctuations of reconstruction efficiency and contamination effects lead to a rather broad correlation between and that is shown in Fig. 1 for an example data set. As a result, the transverse momentum spectrum associated to a given value carries contributions on particle production from a range of different values. In addition, the finite resolution of the transverse momentum measurement itself results in a (small) smearing of the measured transverse momentum . The correct correlation between the collision-characteristic value and its corresponding distribution can be extracted by unfolding the measured quantities.
Data sets and event selection
The data analysed in this work were collected between 2010 and 2018 during the LHC Run 1 and Run 2 data-taking periods. They comprise pp, p==Pb, Xe==Xe, and Pb==Pb collisions at centre-of-mass energies per nucleon pair ranging from up to 13. Hadronic collisions were selected with two different minimum-bias (MB) interaction triggers. In Run 1, a single hit in either of V0A or V0C detectors or in the SPD was required (denoted as V0OR) in coincidence with a crossing of two particle bunches in the LHC at the nominal ALICE interaction point. For the Run 2 data taking period, a signal in both V0A and V0C was necessary to fulfil the MB trigger condition (denoted V0AND). Therefore, the former is also sensitive to single diffractive pp events while the latter almost exclusively selects non-single diffractive interactions. The offline event selection (for details see Ref. [ALICE:2018cpu, ALICE:2018vuu]) is optimised to reject beam-induced background and pileup collisions. Events with no reconstructed vertex and those with poor vertex resolution are rejected. Both the trigger efficiency and the vertex requirements affect mostly low multiplicity events. To ensure full pseudorapidity coverage of the tracking detectors (in particular by the inner ITS layers) and therefore avoid a possible asymmetry in the kinematic selection of the tracks, all collisions are required to have their reconstructed primary vertex located within along the beam direction with respect to the nominal interaction point. Table 1 shows an overview of the data sets and their corresponding number of events selected for this analysis. In order to have comparable results regardless of the trigger setup and event selections, all measurements presented in this Letter are corrected using Monte Carlo simulations such that they represent collisions with at least one charged particle produced in the kinematic range and . For this event class, the possible bias originating from Monte Carlo event generators for very low values (partially originating from diffractive or electromagnetic events) is minimal.
| (TeV) | year | MB trigger | no. events analysed (M) | |
| pp | 2.76 | 2011 | V0OR | 48 |
| 2017 | V0AND | 316 | ||
| 2010 | V0OR | 129 | ||
| 2012 | V0AND | 26 | ||
| 2016 | V0AND | 180 | ||
| p==Pb | 2016 | V0AND | 309 | |
| 2016 | V0AND | 15 | ||
| Xe==Xe | 2017 | V0AND | 1 | |
| Pb==Pb | 2010 | V0OR | 19 | |
| 2015, 2018 | V0AND | 239 |
Track selection
A primary charged particle [ALICE-PUBLIC-2017-005] is defined as a charged particle with a mean proper lifetime larger than , which is either produced directly in the interaction or from decays of particles with smaller than , excluding particles produced in interactions with the detector material. Charged-particle trajectories are reconstructed using both the ITS and TPC detectors. In order to select only tracks with good resolution for analysis, a minimal length in the active detector volume as well as a good agreement of the final track parameterisation with its comprising space points are required. The contamination of the track sample with weakly decaying particles, secondary particles from interactions of primary particles with the detector material and from pileup events is significantly reduced by selecting only tracks originating from a location close to the primary interaction vertex. In previous ALICE publications [ALICE:2018vuu, Acharya:2018eaq] those selection criteria were studied in great detail and optimised for best track quality and minimal contamination from secondary particles.
Particle-composition correction
The measured data are complemented by Monte Carlo simulations implementing a realistic GEANT3 [GEANT3] model of the ALICE detector and mimicking the experimental conditions present during the data taking. From these simulations, information about efficiency, secondary contamination, and smearing of as well as is obtained. However, it was found in previous measurements [ALICE:strangeEnhance, ALICE:strangeEnhanceMult] that the current state-of-the-art MC event generators do not perfectly reproduce the relative particle abundances, in particular for hyperons. Since the detector response, as well as the effect of the track selection, vary for the different particle species (e.g. due to different lifetimes), a purely MC-based correction for efficiency and feed-down contamination of inclusive charged particles would depend on the accuracy of the relative hadron abundances produced by the respective underlying event generator. To take this effect into account, the particle abundances from the event generator are re-weighted by means of a data-driven approach that was already employed in other ALICE analyses [ALICE:2018vuu, Acharya:2018eaq]. This particle-composition correction utilises several ALICE measurements of identified () particle spectra as a function of multiplicity (in coarse intervals) for a range of collision systems [ALICE:strangeEnhanceMult, ALICE:2019avo, Adam:2016dau, ALICE:2013wgn, ALICE:2013mez] as input and offers - and -dependent correction factors for particle abundances. These data-driven adjustments for the generator bias result in a more accurate description of the detector performance and are applied prior to the unfolding corrections described in the following.
Event-level unfolding
The measurement of the raw charged-particle multiplicity distribution is influenced by several effects. In the experiment, some collisions that occurred within with respect to the nominal interaction vertex are not detected by the minimum-bias trigger or discarded by the subsequent event selection. Due to the experimental vertex-position resolution, a valid collision event may also be reconstructed outside of and therefore rejected in the analysis. On the other hand, the measured and selected sample of events may contain collisions without any primary charged particle produced within the kinematic range of interest (i.e. events with ) or collisions with a true vertex position located outside . In addition, as discussed before, the value of the measured track multiplicity itself is affected by tracking efficiency and track selection as well as contamination with secondaries and particles smeared into the kinematic acceptance, resulting in a broad correlation between the actual number of primary charged particles and the measured track multiplicity .
Using the particle-composition corrected MC simulation, the measured track multiplicity distribution can be corrected for the efficiency, contamination, and smearing effects by means of an iterative unfolding procedure proposed by D’Agostini [DAgostini:1994fjx] and implemented in the RooUnfold [rooUnfold] software package.
Starting with an initial assumption (prior) for the desired multiplicity distribution, which in this case is taken from the MC simulation, unfolding weights (posterior probabilities) are calculated by combining the prior with the detector response and the measured track multiplicity distribution according to Bayes’ theorem. By again applying these posterior probabilities to the measured track multiplicity distribution, an updated and more accurate guess for the prior is calculated. This procedure is repeated at least three times and, in order to avoid overfitting, immediately stopped once the between the resulting multiplicity distributions of two consecutive iterations drops below unity. In this context, the number of degrees of freedom refers to the number of data points in the respective distribution. The procedure is found to be very stable and the resulting unfolded spectrum after convergence is not sensitive to the choice of a prior.
Track-level unfolding
While the one-dimensional multiplicity distributions are straightforward to unfold with the iterative D’Agostini method described above, extracting the correlation between spectra and the corresponding multiplicity poses a greater challenge. In principle, this two-dimensional (2D) deconvolution could be done in the same manner, i.e., by unfolding the distribution of -pairs and thereby extracting the corrected -distribution of primary charged particles. However, for the highly-granular measurement carried out here, this would imply a huge number of possible combinations and therefore, in practice, require an unreasonably large Monte Carlo event sample to sufficiently populate the smearing matrix that represents the detector response. Hence, in this analysis, a new approach was developed aiming to effectively achieve the 2D unfolding in a simpler way, by splitting it into multiple one-dimensional unfolding problems. Starting from the raw yield of charged-particle tracks as a function of measured track transverse momentum and measured track multiplicity , this technique yields the fully corrected transverse momentum spectra of primary charged particles as a function of their corresponding primary charged particle multiplicity . These fully corrected -dependent spectra are then normalised to the number of events obtained from the unfolded multiplicity distributions. In addition, the spectra are divided by the widths and of the respective intervals chosen for analysis. In the present work, for pp, p==Pb and AA collisions with , multiplicity intervals of are used, while for the rest of the range in AA collisions intervals of are chosen. This choice is driven by optimising the resolution of the unfolding procedure versus computing time. As the bulk of particles are produced at low transverse momentum, the intervals are set to have decreasing granularity from low to high .
In the experiment, event-level as well as track-level effects influence whether a charged particle with transverse momentum from an event of multiplicity is detected with the measured properties and . For the reasons described above, entire collision events, and in consequence all of their corresponding particles, can either be lost if the event is rejected or incorrectly selected and as a result contribute to the background contained in the measured track sample. Further, for an event which is selected for analysis, the spectrum as well as the measured track multiplicity are affected by tracking efficiency, transverse momentum resolution, and contamination from secondaries or particles smeared into the kinematic acceptance of the measurement. While the event-level effects change the -integrated detector response and are intrinsically multiplicity dependent, the track-level detector response mainly depends on the transverse momentum of the respective particle. However, there is still a small dependence of contamination and efficiency related to the event selection as the trigger may bias toward specific types of events (e.g., by selectively rejecting diffractive collisions which may have a transverse momentum shape different from that of non-diffractive events with the same multiplicity). On the other hand, also the tracking efficiency and contamination are (slightly) multiplicity dependent, as for instance the particle composition of the event changes with multiplicity, which is relevant in particular for AA collisions.
The basic idea behind the novel procedure employed in this analysis is that the multiplicity dimension (which is mostly affected by event-level effects) and the dimension (which is dominated by track-level effects) can be treated in two separate, sequential unfolding stages. In a first step, the dependent raw track yield in each interval is unfolded separately using the event-level efficiencies and contamination as well as the ( integrated) multiplicity smearing matrix of primary charged particles, which contains the probability for a primary charged particle from a collision with true multiplicity to be found in an event with measured track multiplicity . As a result of this deconvolution, the measured tracks are reassigned to the true multiplicities and corrected for track losses related to the event selection and contamination from background events. In a second step, the dependent track yield is unfolded individually in each interval using the corresponding dependent tracking efficiencies and dependent contamination, as well as the (multiplicity-integrated) transverse momentum smearing matrix of primary charged particles. Note that since the measured track distributions in each of the individually unfolded or intervals are different, unique posterior probabilities (i.e., unfolding weights) are obtained in each of these cases. For all of the intervals, the integrated distribution of measured primary charged particles taken from the MC simulation is used as the initial prior for the unfolding, while for all the intervals the integrated distribution of measured primary charged particles is used.
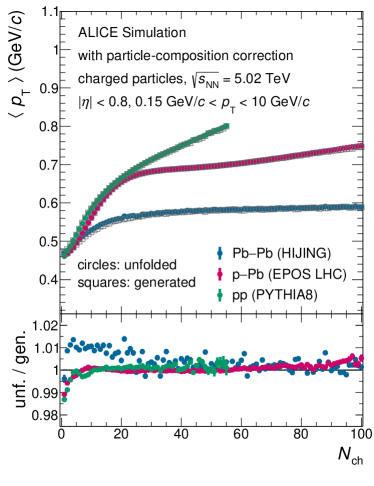
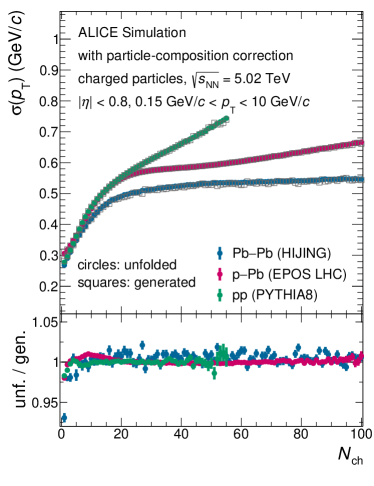
To validate the self-consistency of this sequential unfolding approach, it is applied to a MC sample which includes the transport of particles through the detector and the results are then compared with its underlying generator-level expectation. In Fig. 2 this closure test is shown for the mean and standard deviation of the unfolded dependent transverse momentum spectra simulated for pp, p==Pb and Pb==Pb collisions at using the PYTHIA8, EPOS LHC and HIJING [Wang:1991hta] event generators, respectively. Note that these are the particle-composition corrected simulations. The ratios in the bottom panels show a very good agreement between the unfolded and generated distributions over the whole range of multiplicities. The non-closure is mostly well below 1% and the remaining relative differences are used as an estimate for the systematic uncertainty of the method. The closure test was validated by cross-checking the largest data set, i.e. pp collisions at , with EPOS LHC as an alternative MC generator.
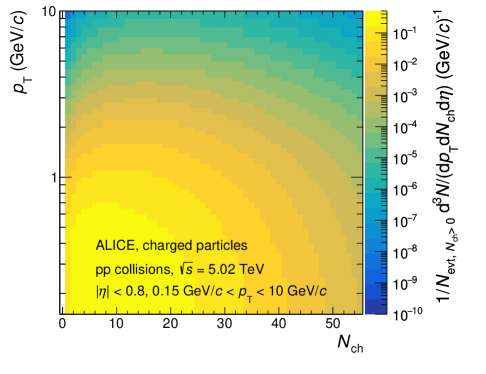

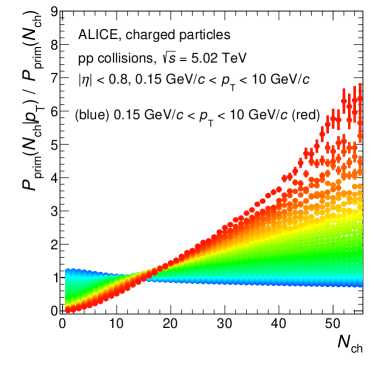
In the top panel of Fig. 3, the evolution of spectral shapes with multiplicity obtained with this unfolding procedure is shown for pp collisions at . This double-differential measurement not only allows characteristic properties of the spectra, e.g. , and , to be extracted but also allows a direct comparison of the spectral shape produced in collisions with different multiplicities. The bottom left panel of Fig. 3 shows the ratio of multiplicity-dependent self normalised distributions to the multiplicity-integrated self normalised distribution of primary charged particles. A hardening of the spectra with multiplicity is apparent, which continuously increases with , a trend observed earlier in coarser multiplicity intervals [Adam:2015pza] and with different event selection methods [ALICE:2019dfi]. In the bottom right panel of Fig. 3 the self normalised multiplicity distribution of primary charged particles for fixed transverse momentum divided by the -integrated distribution is shown as a function of . As expected, it is evident that high particles are produced mostly in high-multiplicity events.
Systematic uncertainties
The accuracy of the corrections applied in this work depends on how well the measured track properties are reproduced by the MC simulations. The systematic uncertainties related to a possible disagreement were estimated by varying the track-selection criteria in reasonable ranges. A detailed list of those track quality criteria and their variations can be found in previous ALICE publications [ALICE:2018vuu, Acharya:2018eaq]. In order to estimate the systematic uncertainty related to the particle-composition correction, the yields of identified particles are varied within their respective systematic uncertainties and the extrapolation of those spectra to is performed with different functions. In addition, an uncertainty for the accuracy of the unfolding procedure is assigned that is quantified by the level of agreement between the unfolded simulated measurement and the expected distributions produced by the generator (MC closure test). For each variation, the fully corrected results are calculated and their deviation to the nominal result is considered an uncertainty. Therefore, any effect of the variations on the performance of the analysis procedure is included in the respective systematic uncertainty. To obtain the overall systematic uncertainties, all individual contributions are assumed to be fully uncorrelated and are added in quadrature.
The systematic uncertainties of multiplicity distributions are around at low , but increase towards higher multiplicities up to , depending on the collision system and energy. While for pp and p==Pb collisions the track quality requirements are the most relevant contributions, in AA collisions the systematic uncertainty related to the particle-composition correction is the most prominent one. The systematic uncertainty of the mean transverse momentum of the unfolded spectra is largely dominated by the contributions from track-selection variations, yet the total systematic uncertainties in most of the reported range are around . At the lowest and highest multiplicities the contribution from the closure tests increases to up to . The contribution from the particle-composition correction is around . The systematic uncertainties of the standard deviation of the spectra are dominated by the track quality requirements and are below on average. At very low and very high , the systematic uncertainties go up to due to the MC closure test contribution.
4 Results and discussion
| (TeV) | () | () | |||
| pp | |||||
| p==Pb | |||||
| Xe==Xe | |||||
| Pb==Pb | |||||
Multiplicity distributions as well as the mean and standard deviation of charged-particle spectra as a function of are presented in comparison with model predictions. Table 2 summarises the mean and standard deviation of both the multiplicity distributions and -integrated spectra for pp, p==Pb, Xe==Xe, and Pb==Pb collisions at the various centre-of-mass energies per nucleon pair.
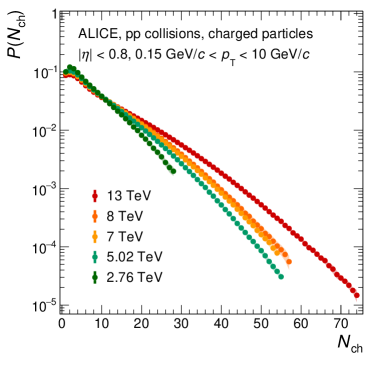
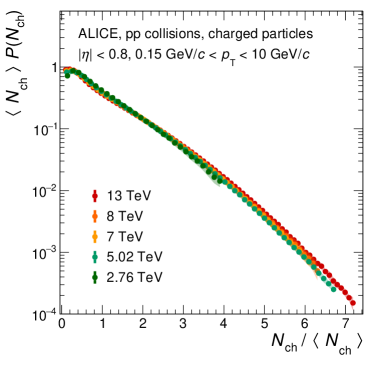
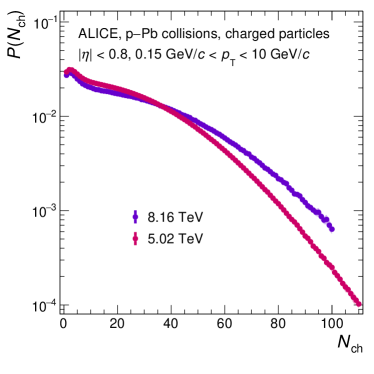
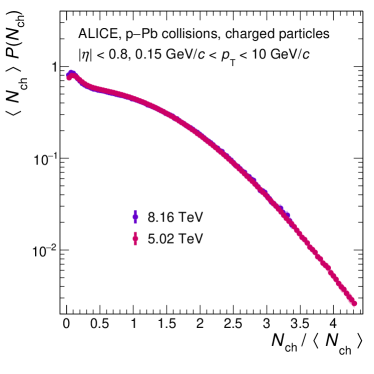
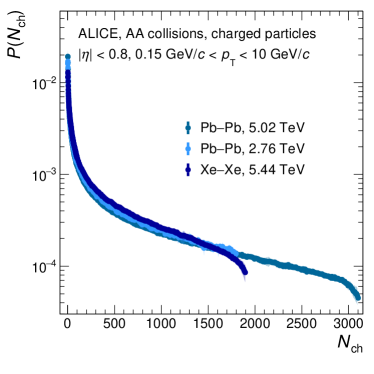
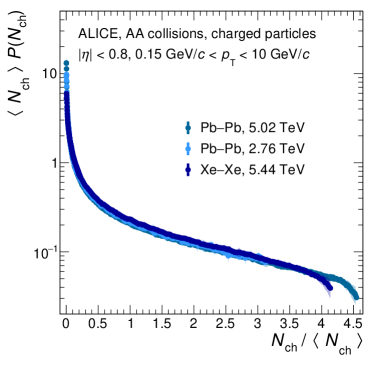
The left panel of Fig. 4 shows the probability density of charged-particle multiplicity for pp (top), p==Pb (middle), and AA (bottom) collisions at different energies per nucleon pair. For all collision systems, the distributions reach a maximum around 2 and then fall steeply off over several orders of magnitude. In the pp and p==Pb systems, the slope of the decay with decreases with increasing collision energy. This can be attributed to the larger momentum transfer in the initial hard scattering which results in larger multiplicities. The right panel of Fig. 4 presents the data after scaling the probability density and the charged-particle multiplicity with the average number of charged particles according to the Koba–Nielsen–Olesen (KNO) [KOBA1972317] scaling. Figure 5 shows the corresponding ratios of the KNO-scaled multiplicity distributions at various centre-of-mass energies per nucleon pair relative to , and for pp, p==Pb and Pb==Pb collisions, respectively. KNO scaling apparently holds in pp and AA collisions within , and in p==Pb collisions within .


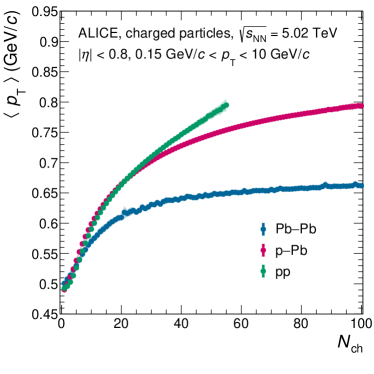
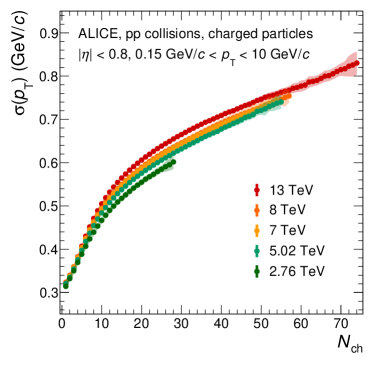
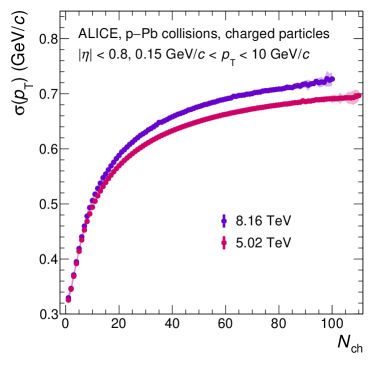
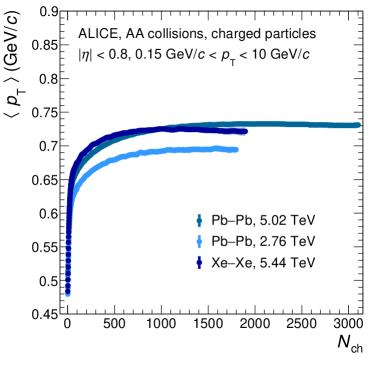
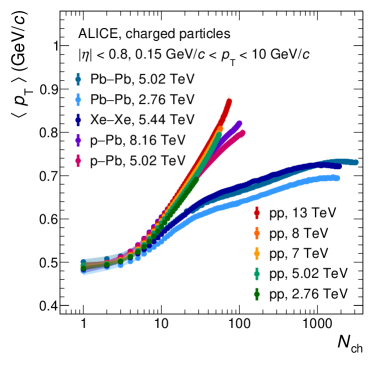
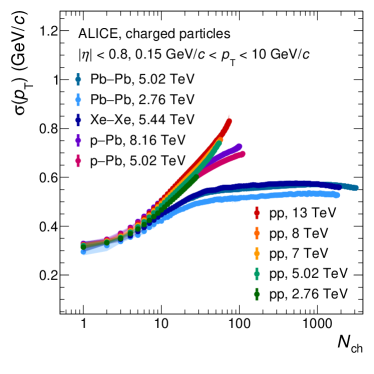
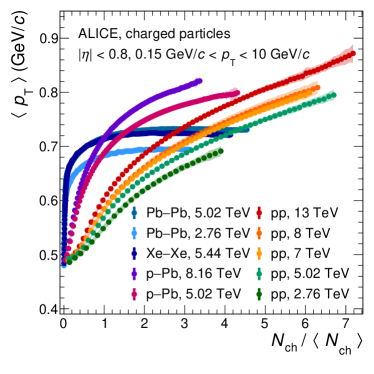
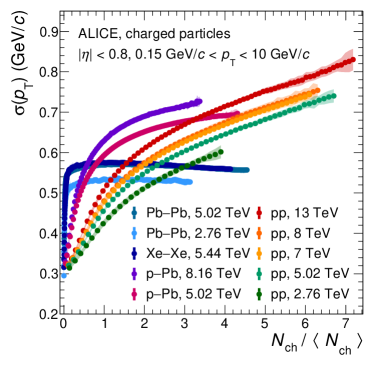
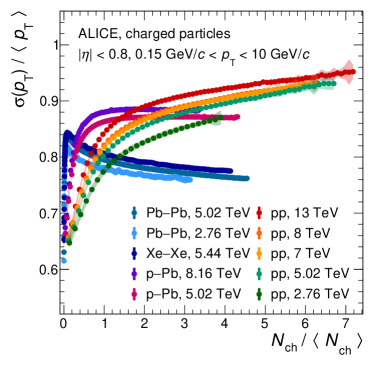
In Fig. 6 the mean and standard deviation of the spectra are compared for pp, p==Pb and Pb==Pb collisions at the same centre-of-mass energy per nucleon pair of . All three collision systems have similar values at and then coincide until Pb==Pb deviates at and p==Pb deviates at from the trend observed in pp. This observation is consistent with an earlier comparison of the – correlation for the three systems at different centre-of-mass energies [Abelev_2013]. Figure 7 shows the mean (left) and standard deviation (right) of the transverse momentum spectra as a function of the charged-particle multiplicity for pp (top), p==Pb (middle), and AA (bottom) collisions at different centre-of-mass energies per nucleon pair. For all collision systems, a clear ordering of as well as with collision energy is observed, which can be attributed to the larger momentum transfers involved at higher . For pp collisions at all centre-of-mass energies, the average transverse momentum increases monotonically with an almost linear trend up to and beyond that continues with an again almost linear dependence on but reduced slope. In p==Pb collisions, a similar multiplicity dependence is observed up to . At higher multiplicities, the increase in is slower than in pp collisions. In both pp and p==Pb, follows a similar trend as . On the other hand, for AA collisions one observes an increase of with multiplicity up to about one third of the measured range, followed by a constant trend for the rest of the range. The increases for to a maximum and decreases afterwards. This is unique to large collision systems and is presumably a consequence of flow and jet quenching [ALICE:2018vuu]. The high resolution of this measurement makes it possible to spot differences between the spectral evolution with multiplicity in Xe==Xe and Pb==Pb collisions at and , respectively. The observed difference in the trends might be a result of the slightly deformed Xe nuclei [Giacalone]. In Fig. 8 both the mean (left) and standard deviation (right) of the spectra as a function of are summarised for all data sets (top panels) and then shown as a function of relative multiplicity (middle panels) as well as divided by their respective multiplicity-integrated values (bottom panels). In the latter scaling, the overall energy-dependent increase of average kinematic energy and number of produced particles are accounted for. As a result, the values for each collision system align almost perfectly for the . For , for a given system the scaled value increases slightly with centre-of-mass energy. This small remaining ordering may be due to the larger available phase space at higher centre-of-mass energies.


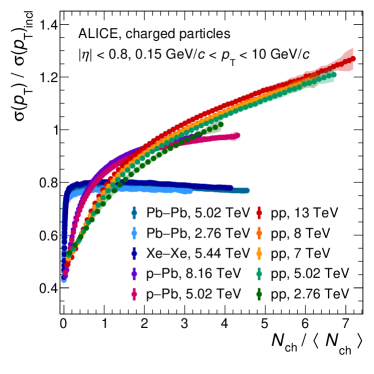

The left panel of Fig. 9 shows the relative standard deviation of the spectra as a function of (left) and as a function of (right). For pp collisions, this relative width of the spectra increases with multiplicity. The same trend is also observed for the larger collision systems. However, after around both for p==Pb and AA collisions, the standard deviation rises at the same rate as the mean, resulting in a flattening of the ratio. After this plateau, the spectra in AA collisions become narrower relative to their mean values. The right panel of Fig. 9 shows the relative standard deviation of the spectra as a function of the relative multiplicity . The plateau observed in p==Pb collisions starts at the relative multiplicity , while the decrease observed in AA collision already begins at lower relative multiplicities of around .

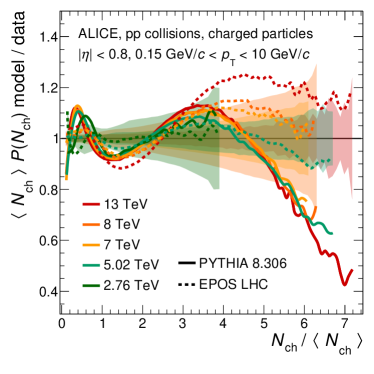

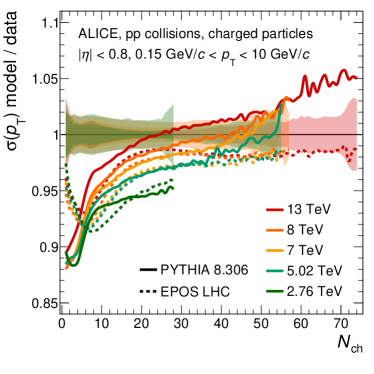
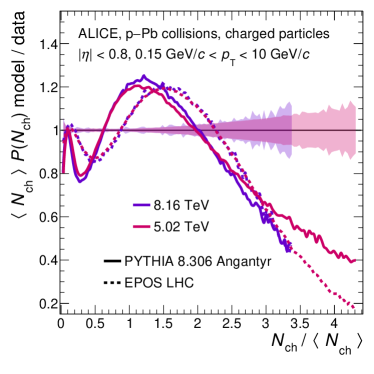
Figures 10 and 11 compare measured results for pp and p==Pb collisions with predictions from PYTHIA8 (solid lines) and EPOS LHC (dashed lines). Here, the PYTHIA8.306 event generator is used with the Monash-2013 tune [Skands:2014pea] for pp collisions and with the Angantyr model [Bierlich:2018xfw] for p==Pb collisions. The top left panel represents the ratio of models over measurements for the multiplicity distributions, the top right panel for the respective KNO-scaled multiplicity distributions and the bottom left and right panel show the ratios for and , respectively.
In pp collisions, the overall shapes of the multiplicity distribution and KNO-scaled distribution shown in the upper panels of Fig. 10 are better described by EPOS LHC, while PYTHIA8 falls sharply off above . Both models agree with the experimental distributions within with larger deviations at highest multiplicities. For and shown in the bottom panels of Fig. 10, PYTHIA8 underpredicts the experimental data on at the lowest values of by up to . The dependent values produced by PYTHIA8 increase faster than the measurements with an almost linear dependence up to , after which the ratio shows a flat multiplicity dependence with an offset from unity varying from at up to at the highest centre-of-mass energy. EPOS LHC is further off at low multiplicities by up to and increases slower than the measurements, underestimating them by up to around . At higher multiplicities, the increase is faster with a linearly rising ratio up to , reaching a plateau which describes the measurements within . The experimental data on is reproduced by both models within at charged-particle multiplicities , with larger deviations at the lowest multiplicities.
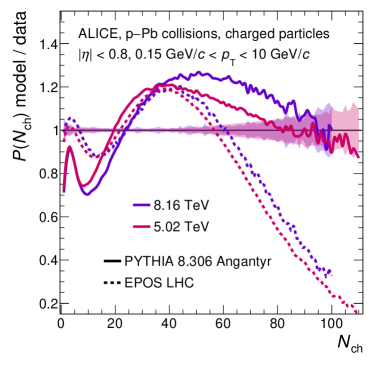

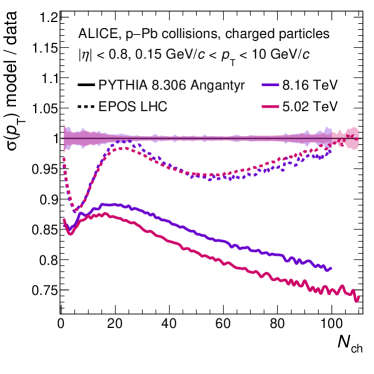
Results from model calculations in comparison with measurements from p==Pb collisions are shown in Fig. 11. PYTHIA8/Angantyr predicts the charged-particle multiplicity distribution within (Fig. 11, top left) over the whole multiplicity range. EPOS LHC agrees within for but fails to describe the measurement at higher multiplicities. The KNO-scaled multiplicity distributions shown in the top right panel of Fig. 11 are described by both models within up to a relative multiplicity of 2.5. Beyond that, both models exhibit increasing deviations from the measurement. PYTHIA8/Angantyr underpredicts by about at low multiplicities (Fig. 11, bottom left), , with the deviation increasing as a function of multiplicity, reaching about at . This might result from the missing colour reconnection between the sub-collisions in the model. It is expected that high string density effects, as the recently-introduced shoving mechanism [Bierlich:2020naj], will lead to an increase of as a function of the multiplicity. EPOS LHC reproduces the and measurement within .
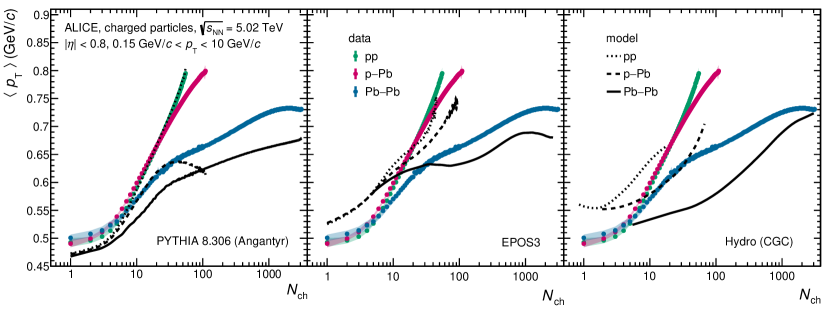
Figure 12 shows a comparison of the measured as a function of for pp, p==Pb and Pb==Pb collisions at the same centre-of-mass energy per nucleon pair, , with results from three different model calculations: PYTHIA8 (left panel; Angantyr for p==Pb and Pb==Pb), EPOS3 (middle panel), and hydrodynamics with CGC initial conditions [Schenke:2020mbo] (right panel). As shown before, PYTHIA8 describes the pp measurements very well over the entire multiplicity range, even at the highest multiplicities. However, it significantly underpredicts the p==Pb measurements above , where the deviation increases with multiplicity. In Pb==Pb collisions, the is systematically underpredicted by PYTHIA8/Angantyr by around on average. Again, this points to the missing treatment of high string density effects which are not included in the PYTHIA8/Angantyr model, yet [Bierlich:2018xfw]. The EPOS3 model overpredicts the in all systems up to , and underpredicts p==Pb and Pb==Pb measurements at higher multiplicities, less than PYTHIA8/Angantyr, but also cannot reproduce the evolution with . The hydrodynamical model calculations do not describe the measurements well, except for Pb