A blazar candidate for the Fermi source 4FGL J1848.7–0129
Abstract
The Fermi source 4FGL J1848.7–0129 has been historically related to the globular cluster GLIMPSE-C01 since its very first detection. Although this association is widely accepted, as it appears in the most recent Fermi catalog, it deserves to be revisited given the multi-wavelength evidences and the recent discovery of variable X-ray sources in the Fermi source region. In particular, low frequency radio maps from the Giant Metre Radio Telescope in Pune (India) have been carefully inspected which, together with X-ray data re-analysis from Chandra, lead us to get a deep insight into the candidates to be associated to 4FGL J1848.7–0129. This results in the discovery of a new X-ray variable point source coincident with an unreported non-thermal radio emitter, both of them well inside the 4FGL J1848.7–0129 error ellipse. We analyze and discuss all these observational facts, and we propose now a newly discovered blazar candidate as the most promising responsible for the gamma ray emission in the Fermi source. If confirmed, this result would set constrains on the number of millisecond pulsars in GLIMPSE-C01 or their gamma-ray emission properties.
keywords:
gamma-rays: general – (galaxies:) BL Lacertae objects: general – (Galaxy:) globular clusters: individual: GLIMPSE-C011 Introduction
More than a decade ago, the collaboration operating the Fermi Large Area Telescope (LAT) released their first catalog based only on three months of gamma-ray observations (Abdo et al., 2009). One of the sources was listed as 0FGL J1848.60138, whose nature remained unknown. In spite of its large 95% confidence error radius of arcmin, some of the present authors were the first to notice (Luque-Escamilla et al., 2009) that the gamma-ray emission coming from this region of the sky could be attributed to the highly absorbed globular cluster GLIMPSE-C01 (hereafter G01; Kobulnicky et al., 2005), located at a distance of few kpc, ranging from kpc (Davidge et al., 2016) to kpc, (Davies et al., 2011). Its mass has been estimated to be M⊙, while its age seems to lie between 0.3 and 2 Gyr (Davies et al., 2011; Hare et al., 2018), which could suggest that G01 is an intermediate-age stellar cluster instead of a typical, older globular one. Nowadays, the same gamma-ray source appears in the more recent Fermi LAT catalog (Abdollahi et al., 2022) as 4FGL J1848.7–0129 with a much smaller ellipse error of arcmin after more than 12 years of observations. The globular cluster association has received increased reliability, with the G01 position being well coincident with the gamma-ray emission, and so it appears in the catalog. The high-energy photons coming from G01 could be collectively produced by a population of millisecond radio pulsars (MSPs) inside the cluster through injection of relativistic leptons into the medium either from their inner magnetospheres or accelerated in the shocks created by the collision of individual pulsar winds (Luque-Escamilla et al., 2009; Tavani, 1993). Moreover, G01 has been used to study the gamma-ray MSP population of globular clusters in order to explain the GeV excess observed from the region surrounding the Galactic Center by Hooper & Linden (2016) and, more recently, by Wu et al. (2022), who estimate 1-6 MSPs inside G01.
However, in the recent past there has been much activity in the astrophysical community related to G01. On December 2020 the Monitor of All-sky X-ray Image (MAXI) discovered the new X-ray transient MAXI J1848–015 (Takagi et al., 2020), which was subsequently detected by NuSTAR (Pike et al., 2020; Pike et al., 2022) and, with an improved position, by Swift (Kennea et al., 2021), NICER (Miller et al., 2021), MeerKAT (Tremou et al., 2021) and Chandra (Hare et al., 2021; Chakrabarty et al., 2021). Thus, MAXI J1848–015 seems to be located in the core of G01, with no coincidence with known archival sources.
All these findings prompted us to revisit the gamma-ray association between 4FGL J1848.7–0129 and G01, taking into account all the multi-wavelength data available up to now. As a result, here we propose a new likely non-thermal radio emitter, coincident with the Fermi error ellipse and a X-ray Chandra point source, that could be contributing to the gamma-ray emission. As illustrated in the following sections, this previously unreported object seems to be a member of the so-called blazars, a radio-loud subclass of active galactic nuclei that host relativistic jets closely aligned with our line of sight (Urry & Padovani, 1995). They are characterized by strong non-thermal radiation across the entire electromagnetic spectrum, and in particular in gamma-rays, with fluxes expected to be between and photons cm-2 sec-1 in the GeV range in Fermi blazars (i.e. Singal, 2015). Blazars also exhibit strong variability at different timescales and wavebands, believed to be a result of relativistic motion of non-thermal plasma along the jet, which dominates the blazar emission due to relativistic beaming because of its particular orientation (Urry & Padovani, 1995). The multiwavelength spectral energy distribution (SED) of a blazar exhibits a typical double hump structure. The low-energy bump peaks at radio-to-X-rays and is believed to be formed by synchrotron mechanism. On the other hand, high-energy bump peaks in the gamma-ray band and is usually explained in terms of inverse Compton process (in a leptonic radiative model, van den Berg et al., 2019) or hadronic processes (e.g., Petropoulou et al., 2015).
2 Observations
We have reanalysed archival observations at different waveleghts (see Table1). Next, we show the corresponding results.
| Observatory / Inst. | ObsID. | Date | |
|---|---|---|---|
| Radio (150 MHz) | GMRT | TGSS | 15/03/2016 |
| Radio (333 MHz) | MAGPIS | 02/09/2001 | |
| Radio (1400 MHz) | MAGPIS | 25/04/2007 | |
| X-ray (0.5-7.0 keV) | Chandra ACIS-S | 6587 | 15/08/2006 |
| Chandra / ACIS-I | 21641 | 23/06/2019 | |
| Chandra / ACIS-I | 21642 | 28/06/2020 | |
| Chandra / ACIS-I | 21643 | 14/07/2020 | |
| Chandra / ACIS-I | 21644 | 08/08/2020 | |
| Chandra / ACIS-I | 21645 | 05/08/2020 | |
| -ray (0.1-500 GeV) | Fermi - LAT | 04/08/2008 to | |
| 28/03/2022 |
2.1 Radio data
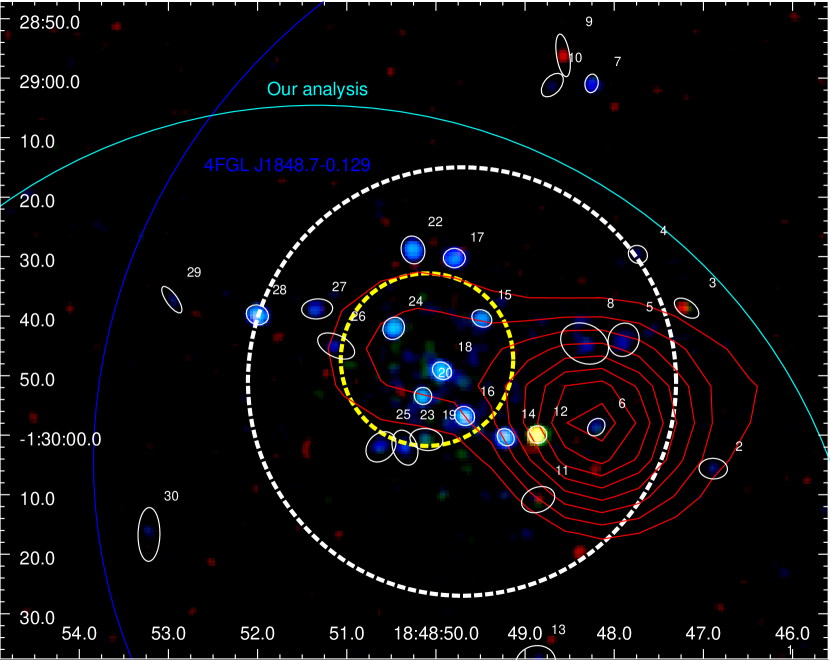
Kobulnicky et al. (2005) first analyzed the NRAO VLA Sky Survey (NVSS, Condon et al., 1998) radio data coming from G01 region. A marginal and extended detection with an integrated flux density of mJy at 20 cm was coincident with the cluster. The present authors recalibrated the Very Large Array (VLA) archive 20 cm data available in B array configuration in order to obtain a higher angular resolution radio map. As a result, no compact radio sources were detected above four times the root mean-square noise of mJy beam-1, thus concluding that radio emission was intrinsically extended or produced by the combined effect of faint point-like radio sources (Luque-Escamilla et al., 2009). The Galactic Plane radio emission at so low latitudes often renders difficult to disentangle weak and confused radio sources. This circumstance prompted us to inspect other newer interferometric radio surveys that also cover G01 field of view but with improved angular resolution. An unexpected finding appeared when using the First Alternative Data Release TGSS ADR1 of the Giant Metre Radio Telescope (GMRT) 150 MHz All-sky Radio Survey (Intema et al., 2017). Here, a conspicuous low-frequency radio source stands out inside the 95 % confidence ellipse of the gamma-ray source 4FGL J1848.7-0129 currently associated with G01 (see Fig. 1). The J2000.0 coordinates of the radio peak position correspond to RA = 18:48:48.23 and DEC = -1:29:57.6, with an estimated uncertainty of 2.6 arc-second in each coordinate. This location is offset from the cluster core by almost half arc-minute, thus not being coincident with the recently reported MeerKAT point-like radio source associated to MAXI J1848-013 (Tremou et al., 2021). The GMRT 150 MHz peak flux density is mJy while the total flux density rises to mJy, thus showing that our new radio source is clearly extended. This is also seen in Fig. 1 where the GMRT object appears elongated roughly in the East-West direction. The fact that this source was missed in the associated GMRT survey catalog is probably due to its signal-to-noise ratio () being not far from the conservative threshold chosen by its authors.
Another improved radio view of the G01 region is provided by the Multi-Array Galactic Plane Imaging Survey (MAGPIS) as described in Helfand et al. (2006). Hints of emission at the Jy level are present in the MAGPIS maps at the 90 cm wavelength close to the GMRT radio source position, while at the 20 cm wavelength no obvious MAGPIS detection is present at the GMRT source position with a upper limit of 5.8 mJy. However, a weak emission at 20 cm in MAGPIS seems to be coincident with the East-West elongated feature in GMRT map. This limb of radio emission might be associated with MAXI J1848-015 or diffuse radio emission from the cluster.

2.2 X-ray data
Pooley et al. (2007) studied Chandra data from G01 using a single 46 ksec ACIS observation. They report 17 point-like sources inside the 36 arcmin radius half-light of the cluster, which are related to a mixture of cataclysmic variables, quiescent low-mass X-ray binaries (LMXB), and MSPs, among other objects.
To obtain a more precise detection and analysis of this X-ray source, we use a complete set of 7 ACIS observations (ObsId. 6587, 21641, 21642, 21643, 21644, 21645, and 21646) that leads to a total of exposure 288.87 ksec, more than six times deeper than Pooley et al. (2007) study. The last provided CIAO 4.14 version and the CALDB 4.9.6 set of calibration files were used. When applying the CIAO wavdetect task for source detection in the entire 0.5–8.0 keV broadband, we detected 30 X-ray point sources on a restricted field of view of 3.93.5 arcmin2 side centered at the G01 position.
One of these X-ray sources deserves special attention. It is the one labeled as X6 in our survey (see Fig. 2), which is remarkably coincident with source X17 in Pooley et al paper. Its location is RA = 18:48:48.20 and DEC = -1:29:58.7 J2000.0, with an uncertainty of 0.3 arc-second in each coordinate. Therefore, it is consistent with the peak of the GMRT radio emission (see Fig. 2), while it is not coincident with MAXI J1848-015. In fact, in this figure we can see that our X18 source is the same than that associated with MAXI J1848-015 in Chandra (Chakrabarty et al., 2021) and MeerKAT (Tremou et al., 2021). X6 has 16 X-ray photons from the stacked observations, which imposes a statistical limit for an X-ray spectral fitting. However, for our analysis, we will take advantage of the results of Albacete-Colombo et al. (2016), who use Chandra Acis Montecarlo Photon Estimator Recipe (Camper)111ess: http://camper.lia.unrn.edu.ar routine to perform a statistical assessment of the X-ray spectral fitting procedure. We simulated a 16 photons spectrum and used a non-thermal absorbed model (TBABS PO) from Arnaud et al. (2011). If the source were located in the Galaxy, we can take as a lower limit for the neutral absorption column of Hydrogen the value from Pooley et al. (2007) NH = 2.71022 cm-2. On the other hand, an upper limit for this parameter could be obtained if we take into account that the source is a blazar without optical counterparts (see Section 2.4) but detected in X-rays, where NH < 1.51024 cm-2 for redshifts () < 0.5 (Mateos et al., 2012). Therefore, a value 4 or 5 times that adopted in Pooley et al. (2007), such as NH = 1023 cm-2, could be a reasonable assumption for our object. To fine-tune this, we can use an spectral model. As no infrared counterpart is observed (see Section 2.4), we assume the blazar to be a Flat-Spectrum Radio Quasar (FSRQ) source with X-ray emission well described by a non-thermal spectrum dominated by jet synchrotron emission (Landt et al., 2008). So, we assume a power-law emission model of index to simulate the X-ray spectrum with 16 photons. As a result, we get log(NH)=22.9(0.3), =2.2(0.5), with a normalization of 2.110-6 in cm-5. The corresponding corrected absorbed flux for the 2.0 to 10.0 keV energy range is log(Flux) = -13.98 ( 0.15) erg s-1 cm-2.
In order to test the variability of the source we have built a light-curve based on the precise count-rate of Chandra (see Fig. 3). Finally, we have also sought for more X-ray data in different observatories. We found that NuSTAR has detected (Pike et al., 2020) a source which has been related to the X-ray transient MAXI J1848–015 (Takagi et al., 2020; Pike et al., 2022). This NuSTAR emitter is far from our Chandra X6 source and will not be taken into account in our discussion.
2.3 Gamma-ray data
We also revisited the LAT data towards 4FGL J1848.7-0129 for a region of radius centered at RA = 18:48:48.0 and DEC = -1:30:00.0. We employed all LAT SOURCE-quality events recorded after more than 13 years of data taking (from August 4, 2008, to March 28, 2022) at energies from 100 MeV to 500 GeV with 90 of maximum zenith angle (to prevent contamination from Earth limb events). We then analyzed the LAT data applying the joint likelihood fitting method provided by the fermipy python package (version 1.0.1, built upon the Fermi Science Tools; Wood et al., 2017). The model fitted to data includes all the LAT sources listed in the Fermi-LAT Fourth Source Catalog (4FGL; Abdollahi et al., 2020) in radius around the reference position above, plus the Galactic and extra-galactic diffuse gamma-ray components described with the most recent version of the Galactic (gll_iem_v07) and isotropic (iso_P8R3_SOURCE_V3_v1) diffuse emission models. We evaluated the LAT instrument’s response with the version P8R3_SOURCE_V2 of the instrument response functions, applying the energy dispersion correction to all sources except for the isotropic diffuse emission. The model’s free parameters are; (1) the normalization parameter of all sources with a detection significance above 3 (), (2) all spectral parameters regarding the sources in radius around the source’s reference position, and (3) the isotropic (norm) and Galactic (norm and tilt) diffuse emission parameters. Lastly, we estimated the systematic uncertainties due to the LAT effective area and the diffuse Galactic model.
The LAT source 4FGL J1848.7-0129 was located (as point-like), with large detection significance (), at the position RA = 18:48:51.36 28.8 30.3 and DEC = -1:30:36.0 32.4 21.1. We compared the best-fit Gaussian and radial disk source hypotheses with the point-like assumption through the likelihood ratio test, resulting in no significant evidence of extended emission. The spectral energy distribution (SED) of the source was modeled with a log-parabola function (), commonly used to characterize blazar spectra at high-energy gamma-rays, for 13 energy bins spanning from 100 MeV to 500 GeV. The model’s parameters that best represent data consist of; cm-2 s-1 MeV-1 referenced at GeV, , and .
Hooper & Linden (2016) and Wu et al. (2022) studied the LAT data towards G01 to quantify the high-energy contribution of its MSPs, assuming that the gamma-ray emission exhibits an exponentially cutoff power-law spectral shape (typical of MSPs). Song et al. (2021) found that globular clusters spectra can be better resolved into an exponentially cutoff power-law together with a pure power-law model, which is most naturally interpreted as inverse Compton emission by cosmic-ray electrons and positrons injected by MSPs. To probe this scenario, we fitted an exponentially cutoff power-law model to the LAT data examined, resulting in cutoff energy of GeV. However, it does not improve the log-parabola fit detailed above (at energies between 100 MeV and 10 GeV), according to the Akaike’s Criterion (as we get AICLP - AIC; Akaike, 1973, 1974).
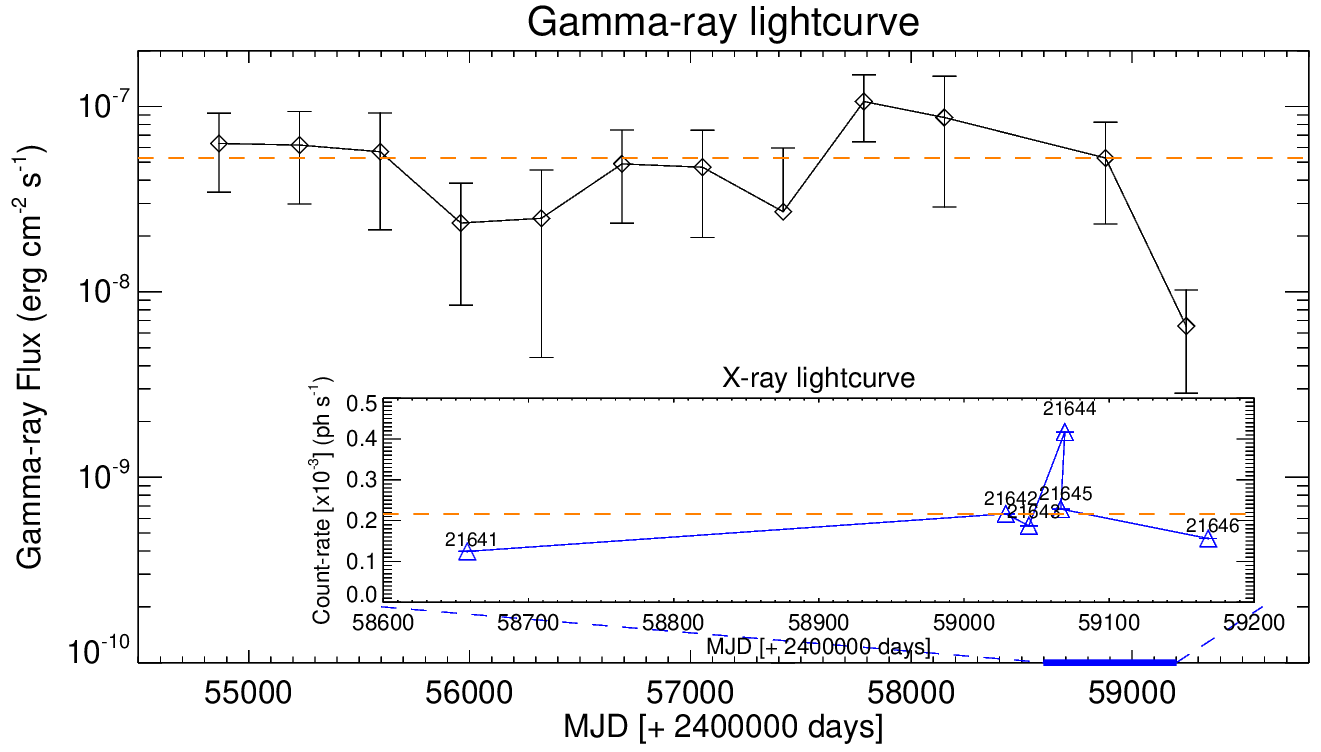
The variability of the LAT source was studied in timescales ranging from four months to three years by computing its light curve with time bins of various sizes (see Fig. 3). The smallest binning used is that in which the average source’s detection significance for the different time bins is .
2.4 Archival optical/infrared data
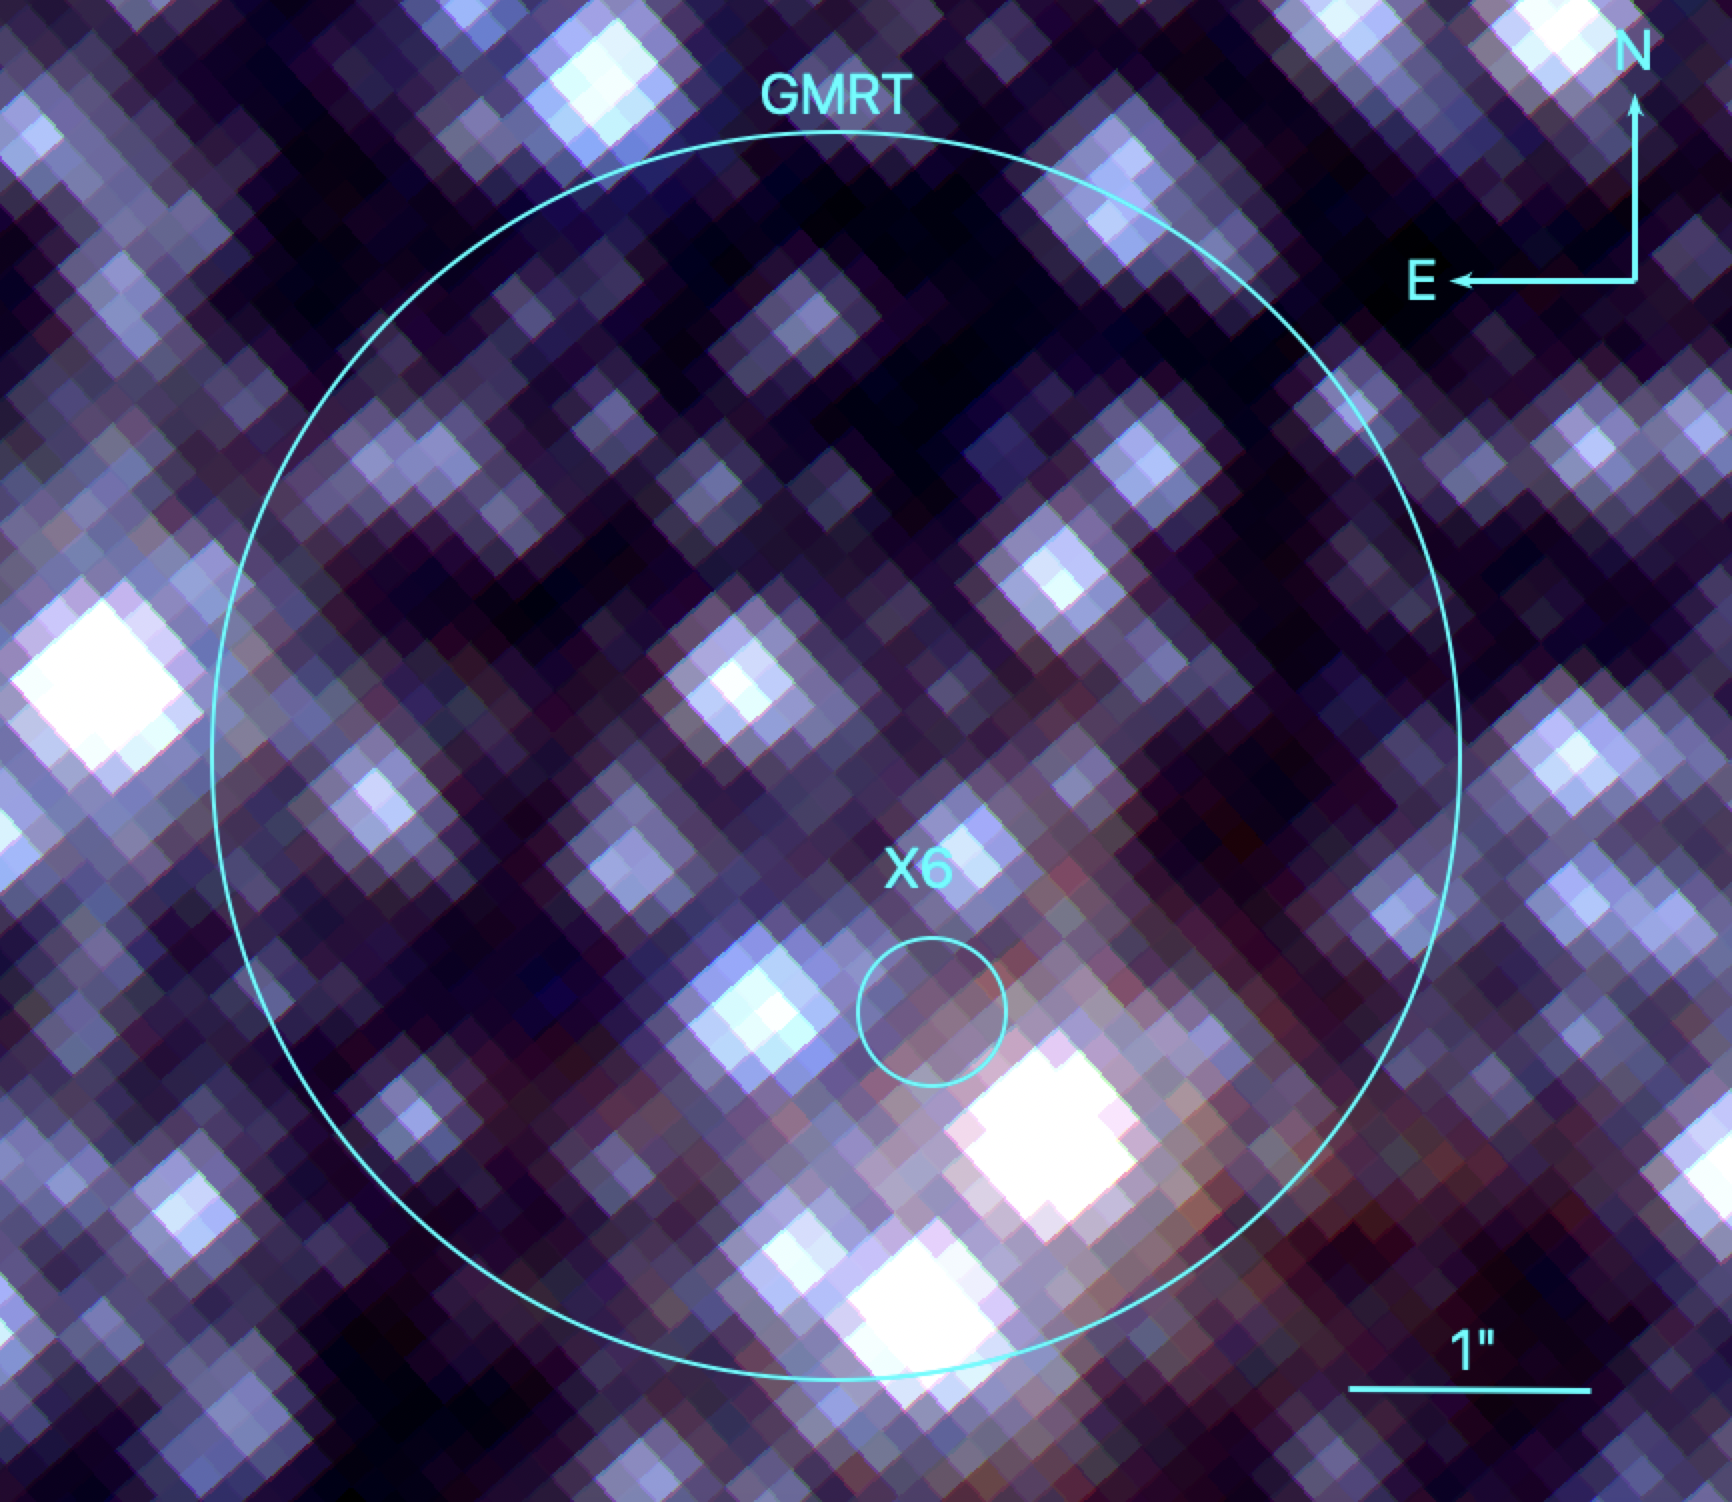
Although we expect a very intense extinction, we seeked for optical/infrared counterparts of our X6 X-ray point source. We retrieved the archival Hubble data obtained with the Wide Field Camera 3 (WFC3) previously reported by (Hare et al., 2018) in quest for possible counterparts for further supporting the later discussion. Astrometry has been linked to the Gaia EDR3 reference stars. These Hubble product also come with photometric calibration available in the header of the fits files. At the Hubble WFC3 wavelengths (12.7, 13.8 and 15.3 ), the corrections for Galactic interstellar absorption assuming the Pooley et al. (2007) value is almost negligible ( magnitudes or less). As a result, no infrared counterparts are apparent in the position of the X6 source (see Fig 4). The same is true when inspecting the optical bands of the Digitized Sky Survey (DSS2) catalogue.
3 Discussion
We first stress the coincidence between the X-ray source X6 and the peak of GMRT radio emission. The offset between the respective coordinates is within the astrometric error at the arc-second level. Therefore we proceed under the assumption that both sources are the same object. No infrared counterpart is detected (see Fig. 4), and this is likely due to the strong absorption towards this direction as suggested by the X-ray measurements.
In order to constraint the radio spectral index, we assume constant flux densities for the newly reported source, and a power law spectrum (with flux ). As a result, from the MAGPIS 90 cm and GMRT maps we roughly estimate an almost flat spectral index , which is in accordance to the typical average value at radio band emission in blazars (Abdo et al., 2010a). If we take into account the lack of detection in MAGPIS 20 cm maps, we get a significantly high , which suggests that the constant flux density assumption is possibly not applying, and the source is variable in radio and lying in a low state at the time of the MAGPIS 20 cm observation.
This hint of variability is reinforced if we analyze the high-energy light curves of our candidate. We will use a common one-sample Kolmogorov-Smirnov (KS) test to compare the observed data with a uniform distribution, which does not depend neither on the binning nor on the size of the sample (see, i.e., Daniel, 1990). According to this test, in the X-ray domain we get a p-value , which means that the source is not constant with a probability. This value is high enough to assure the transient nature of the observed X-ray flux with statistical significance, albeit the scarcity of the sample, The X-ray variability seems to be visually confirmed in the lightcurve in Figure 3, although we take it with due caution. In the gamma-ray lightcurve the KS test results in a p-value , which cannot let us to reject the null hypothesis of a constant source with a high significance. However, this implies that the probability of the observed fluxes come from a variable emitter, which is not negligible. Therefore, in order to obtain an independent evidence of variability for LAT data, for each gamma-ray lightcurve we computed the normalized excess variance quantity (Vaughan et al., 2003) that is commonly used to estimate the variability amplitude in AGN gamma-ray light curves (see, e.g., Abdo et al., 2010b; Rajput et al., 2020). It is defined as , where stands for the light curve’s variance, for its average, and are the systematical and statistical errors added in quadrature (we used ). However, we obtained near zero, but not positive values for for all the cases, indicating either very little variability in monthly or yearly timescales or slightly overestimated errors. The latter is likely our case (as apparent in Fig. 3), given the large errors obtained with in most bins. In any case, this lack of remarkable variability in blazars in gamma-rays is not surprising. The Fermi 4FGL DR3 catalog (Abdollahi et al., 2022) contains 1410 sources labeled as ’bll’, , cataloged as blazars, from which only 504 (36%) have a variability index with significance over 99%. From the remaining 906 sources, there is not a well-defined fractional variability index in 272 (26%), so we can conclude that a neat variability is not always evidenced at these energies.
Although with due caution, we suspect that we are dealing with a highly obscured blazar source. This is relevant because it opens a new perspective towards the identification of 4FGL J1848.7–0129 that could be even completely unrelated to G01 as is widely accepted.
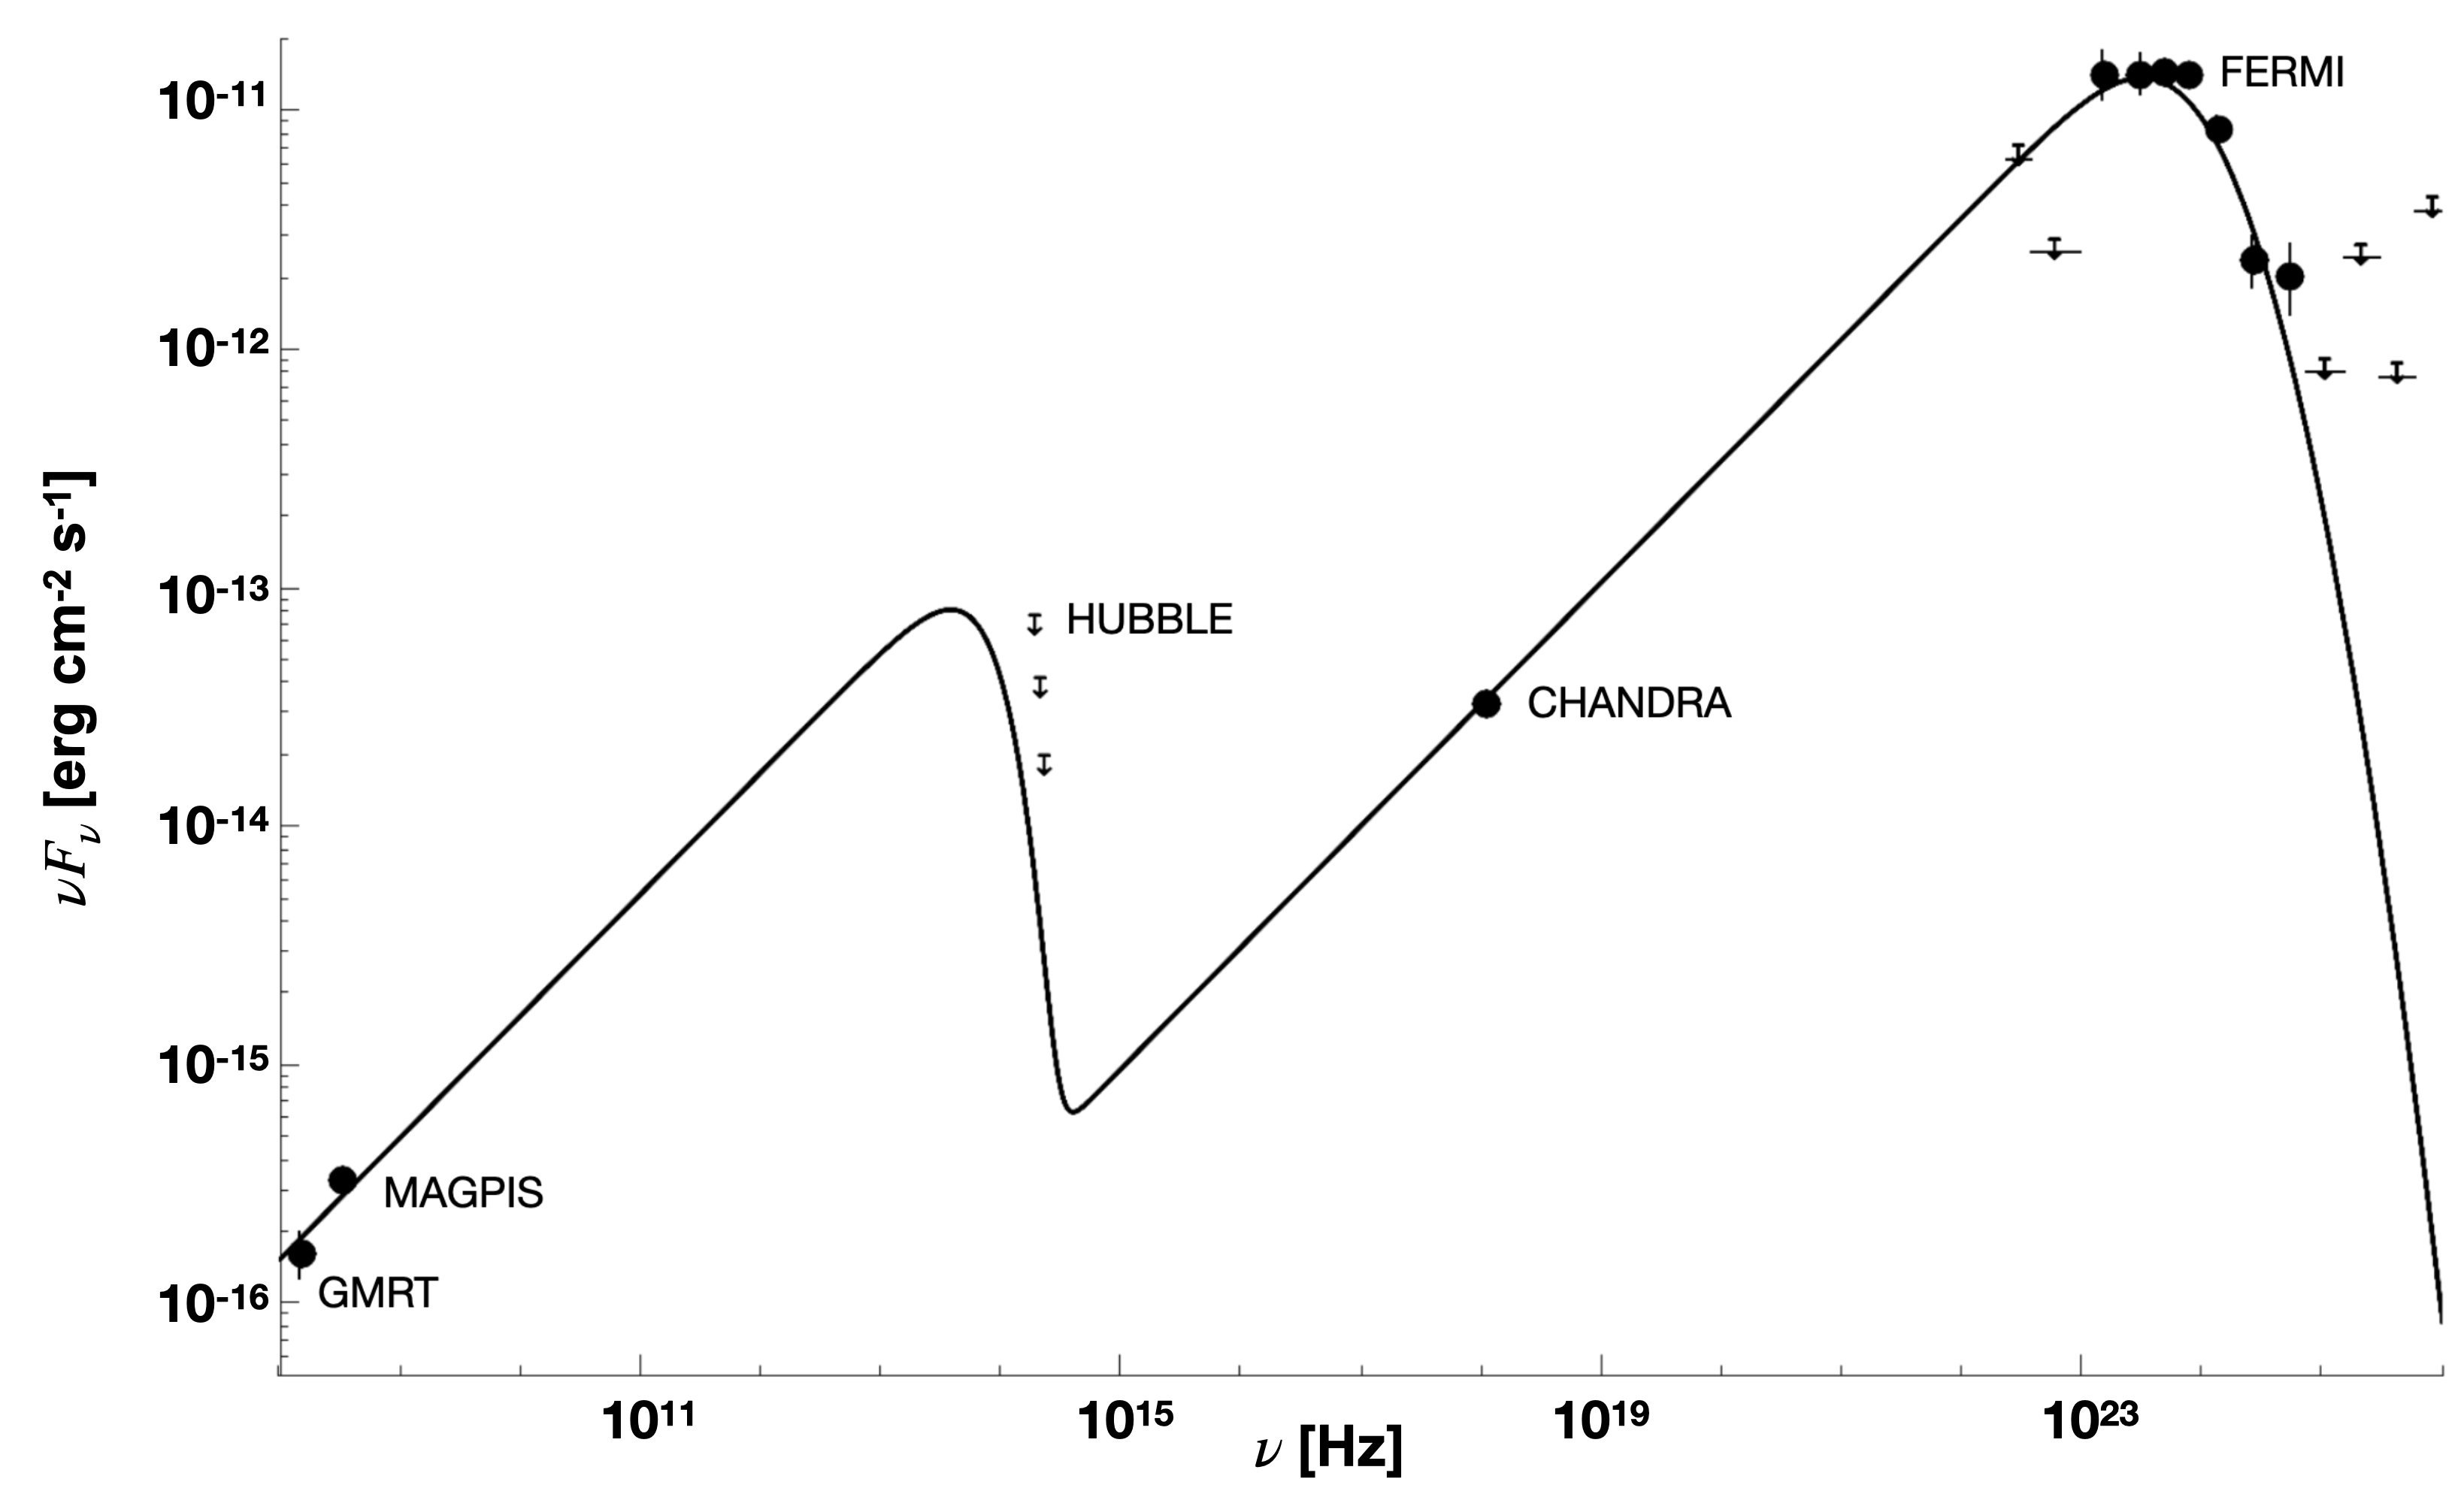
In an attempt to better characterize the agreement of the newly proposed blazar with its expected SED, we have assembled all the available multi-wavelength flux densities measurements in Fig. 5. We tried to fit the SED points based on the Paiano et al. (2017) approach to unveil blazars among multi-wavelength counterparts of Fermi unassociated sources, adapted for monochromatic flux as a function of frequency (see Martí et al., 2020). Despite the scarcity of data and its lack of simultaneity, we see here that the consistency with the typical two-bump SED appearance seems plausible for a FSRQs. The MAGPIS 20 cm point is not appearing in the graphic because it does not follow the SED trend, which reinforces our previously suspicions of variability. A common spectral index for both synchrotron and Compton bumps resulted from the fit.
The blazar FSRQ hypothesis may be tested if we try to apply a classification method based on broad-band effective spectral indices, defined as , where and are flux densities at and , respectively. Following the work of Ouyang et al. (2021), three energy bands are considered (radio at 5 GHz, optical at 5100 Å, and X-ray at 1 keV) to calculate two effective spectral indices ( and ), converting the observed data to those wavelengths by assuming power laws with canonical empirical effective spectral indices for radio, optical and X-rays (as, for instance, in Abdo et al., 2010a). As in our case the optical data is only a limit, so will be the corresponding and . In spite of that, the classification of the source according to the criteria in Ouyang et al. (2021) is always a FSRQ.
A further consistency check to our blazar hypothesis comes from energetic considerations. The observed gamma-ray flux in the Fermi band ( MeV TeV) is photons cm-2 s-1 for 4FGL J1848.7–0129. The modeled log-parabola SED of this source gives a reference energy of MeV, so the gamma-ray flux may be expressed as erg cm-2 s-1. If we now assume a luminosity for 4FGL J1848.7–0129 of the order of the mean luminosity of bright Fermi blazars ( erg s-1, see Ghisellini et al., 2010), we obtain a luminosity distance of about Mpc. Taking a Hubble constant of km s-1 Mpc-1, and assuming a flat Universe with , this luminosity distance is equivalent to a redshift , which seems plausible (e.g. Arsioli et al., 2015; Ouyang et al., 2021). At this distance the K-corrected X-ray luminosity, using a typical FSRQ spectral index (Ouyang et al., 2021), is erg s-1 for the narrow 2 –10 keV range, while for radio, with a flat spectral index, we get erg s-1. These values seem to be compatible with those of blazars (e.g. Costamante, 2020). If, on the other hand, our source were an isolated MSP inside G01 at 5 kpc, its corresponding X-ray and radio luminosities were erg s-1 and erg s-1 (assuming a typical radio spectral index of , Lorimer & Kramer, 2004; Bates et al., 2013), respectively. While the first one may be reasonable for an MSP (Lee et al., 2018), the radio luminosity is a bit higher than the mean one for this kind of sources (Szary et al., 2014). This seems to be against the MSP nature of our X6 source, especially if we take into account that, as was pointed out before, the observed radio spectral index is flat instead of a steep value. Moreover, it is very difficult to explain the observed hints of long time-scale variability for an isolated, old MSP with no expected accretion winds. Therefore, all the observational evidences taken together tip the scale in favor of the extragalactic origin of our source.
4 Conclusions
Here we have presented a plausible blazar coincident with 4FGL J1848.7–0129 that may be contributing to its gamma-ray emission, thus proposing an alternative nature for this source. To reveal if this is the only high-energy emitter or if 4FGL J1848.7–0129 is the result of a collective contribution is out of the scope of this paper. Future X-ray, gamma-ray and radio observations will hopefully be able to proof some sort of correlated variability that unambiguously associates all emissions with a common origin. Assuming that our alternative identification is correct, the number of MSP in G01 as estimated by Wu et al. (2022), or their particle acceleration efficiency, would need to be reduced.
Acknowledgements
JAC and JFAC are CONICET researchers. JAC is a María Zambrano researcher fellow funded by the European Union -NextGenerationEU- (UJAR02MZ). JAC and JFAC acknowledge support by PIP 0113 (CONICET) and PICT-2017-2865 (ANPCyT). PLLE, JM, EM and JAC were also supported by grant PID2019-105510GB-C32/AEI/10.13039/501100011033 from the Agencia Estatal de Investigación of the Spanish Ministerio de Ciencia, Innovación y Universidades, and by Consejería de Economía, Innovación, Ciencia y Empleo of Junta de Andalucía as research group FQM- 322, as well as FEDER funds.
Data Availability
All data used in this work is public, and available in their respective databases.
References
- Abdo et al. (2009) Abdo A. A., et al., 2009, The Astrophysical Journal, 183, 46
- Abdo et al. (2010a) Abdo A. A., et al., 2010a, The Astrophysical Journal, 716, 30
- Abdo et al. (2010b) Abdo A. A., et al., 2010b, ApJ, 722, 520
- Abdollahi et al. (2020) Abdollahi S., et al., 2020, The Astrophysical Journal Supplement Series, 247, 33
- Abdollahi et al. (2022) Abdollahi S., et al., 2022, ApJS, 260, 53
- Akaike (1973) Akaike H., 1973, in 2nd International Symposium on Information Theory, 1973. pp 267–281
- Akaike (1974) Akaike H., 1974, IEEE Transactions on Automatic Control, 19, 716
- Albacete-Colombo et al. (2016) Albacete-Colombo J. F., Flaccomio E., Drake J. J., Wright N. J., Guarcello M., Kashyap V., 2016, arXiv e-prints, p. arXiv:1603.08372
- Arnaud et al. (2011) Arnaud K., Smith R., Siemiginowska A., 2011, Handbook of X-ray Astronomy. Cambridge Observing Handbooks for Research Astronomers, Cambridge University Press
- Arsioli et al. (2015) Arsioli B., Fraga, B. Giommi, P. Padovani, P. Marrese, P. M. 2015, A&A, 579, A34
- Bates et al. (2013) Bates S. D., Lorimer D. R., Verbiest J. P. W., 2013, Monthly Notices of the Royal Astronomical Society, 431, 1352
- Chakrabarty et al. (2021) Chakrabarty D., Jonker P. G., Homan J., van den Berg M., 2021, The Astronomer’s Telegram, 14424, 1
- Condon et al. (1998) Condon J. J., Cotton W. D., Greisen E. W., Yin Q. F., Perley R. A., Taylor G. B., Broderick J. J., 1998, AJ, 115, 1693
- Costamante (2020) Costamante L., 2020, PoS, MULTIF2019, 035
- Daniel (1990) Daniel W. W., 1990, Applied Nonparametric Statistics, 2 edn. PWS-Kent, Boston, p. 319–330
- Davidge et al. (2016) Davidge T. J., et al., 2016, The Astronomical Journal, 152, 173
- Davies et al. (2011) Davies B., Bastian N., Gieles M., Seth A. C., Mengel S., Konstantopoulos I. S., 2011, Monthly Notices of the Royal Astronomical Society, 411, 1386
- Ghisellini et al. (2010) Ghisellini G., Tavecchio F., Foschini L., Ghirlanda G., Maraschi L., Celotti A., 2010, Monthly Notices of the Royal Astronomical Society, 402, 497
- Hare et al. (2018) Hare J., Kargaltsev O., Rangelov B., 2018, The Astrophysical Journal, 865, 33
- Hare et al. (2021) Hare J., Yang H., Kargaltsev O., Rangelov B., Pike S. N., Tomsick J., 2021, The Astronomer’s Telegram, 14499, 1
- Helfand et al. (2006) Helfand D. J., Becker R. H., White R. L., Fallon A., Tuttle S., 2006, AJ, 131, 2525
- Hooper & Linden (2016) Hooper D., Linden T., 2016, Journal of Cosmology and Astroparticle Physics, 2016, 018
- Intema et al. (2017) Intema H. T., Jagannathan P., Mooley K. P., Frail D. A., 2017, A&A, 598, A78
- Kennea et al. (2021) Kennea J. A., et al., 2021, The Astronomer’s Telegram, 14420, 1
- Kobulnicky et al. (2005) Kobulnicky H. A., et al., 2005, The Astronomical Journal, 129, 239
- Landt et al. (2008) Landt H., Padovani P., Giommi P., Perri M., Cheung C. C., 2008, ApJ, 676, 87
- Lee et al. (2018) Lee J., Hui C. Y., Takata J., Kong A. K. H., Tam P. H. T., Cheng K. S., 2018, The Astrophysical Journal, 864, 23
- Lorimer & Kramer (2004) Lorimer D. R., Kramer M., 2004, Handbook of Pulsar Astronomy. Cambridge Observing Handbooks for Research Astronomers Vol. 4, Cambridge University Press
- Luque-Escamilla et al. (2009) Luque-Escamilla P. L., Martí, J. Muñoz-Arjonilla, A. J. Sánchez-Sutil, J. R. Combi, J. A. Sánchez-Ayaso, E. 2009, A&A, 508, 1095
- Martí et al. (2020) Martí J., Sánchez-Ayaso E., Luque-Escamilla P. L., Paredes J. M., Bosch-Ramon V., Corbet R. H. D., 2020, Monthly Notices of the Royal Astronomical Society, 492, 4291–4297
- Mateos et al. (2012) Mateos S., et al., 2012, in Georgantopoulos I., Plionis M., eds, Half a Century of X-ray Astronomy. p. 148
- Miller et al. (2021) Miller J. M., Sanna A., Burderi L., Di Salvo T., Chakrabarty D., Ng M., Gendreau K., 2021, The Astronomer’s Telegram, 14429, 1
- Ouyang et al. (2021) Ouyang Z., Xiao H., Zheng Y., Xu P., Fan J., 2021, Astrophysics and Space Science, 366, 12
- Paiano et al. (2017) Paiano S., Franceschini A., Stamerra A., 2017, Monthly Notices of the Royal Astronomical Society, 468, 4902
- Petropoulou et al. (2015) Petropoulou M., Dimitrakoudis S., Padovani P., Mastichiadis A., Resconi E., 2015, Monthly Notices of the Royal Astronomical Society, 448, 2412
- Pike et al. (2020) Pike et al. 2020, The Astronomer’s Telegram, 14290, 1
- Pike et al. (2022) Pike S. N., et al., 2022, The Astrophysical Journal, 927, 190
- Pooley et al. (2007) Pooley D., Rappaport S., Levine A., Pfahl E., Schwab J., 2007, arXiv e-prints, p. arXiv:0708.3365
- Rajput et al. (2020) Rajput B., Stalin C. S., Rakshit S., 2020, A&A, 634, A80
- Singal (2015) Singal J., 2015, Monthly Notices of the Royal Astronomical Society, 454, 115
- Song et al. (2021) Song D., Macias O., Horiuchi S., Crocker R. M., Nataf D. M., 2021, Monthly Notices of the Royal Astronomical Society, 507, 5161
- Szary et al. (2014) Szary A., Zhang B., Melikidze G. I., Gil J., Xu R.-X., 2014, The Astrophysical Journal, 784, 59
- Takagi et al. (2020) Takagi et al. R. o. b. o. M. t., 2020, The Astronomer’s Telegram, 14282, 1
- Tavani (1993) Tavani M., 1993, The Astrophysical Journal, 407, 135
- Tremou et al. (2021) Tremou E., Carotenuto F., Fender R., Woudt P., Miller-Jones J., Motta S., ThunderKAT Collaboration 2021, The Astronomer’s Telegram, 14432, 1
- Urry & Padovani (1995) Urry C. M., Padovani P., 1995, PASP, 107, 803
- Vaughan et al. (2003) Vaughan S., Edelson R., Warwick R. S., Uttley P., 2003, MNRAS, 345, 1271
- Wood et al. (2017) Wood M., Caputo R., Charles E., Di Mauro M., Magill J., Perkins J. S., Fermi-LAT Collaboration 2017, in 35th International Cosmic Ray Conference (ICRC2017). p. 824 (arXiv:1707.09551)
- Wu et al. (2022) Wu W., Wang Z., Xing Y., Zhang P., 2022, The Astrophysical Journal, 927, 117
- van den Berg et al. (2019) van den Berg J. P., Böttcher M., Domínguez A., López-Moya M., 2019, The Astrophysical Journal, 874, 47